1. Introduction
Elucidating the functional landscape of farm animal genomes is paramount for deciphering the molecular underpinnings of economically important traits, such as growth performance and disease susceptibility. While substantial progress has been made in comprehensively mapping functional regulatory elements in livestock through initiatives like the Functional Annotation of Animal Genomes (FAANG) consortium [
1] or FarmGTEx project [
2], and particularly in annotation of enhancers in chicken genome [
3,
4], including the ChickenGTEx project [
5], the annotation completeness of regulatory elements in the chicken (Gallus gallus) genome necessitates continued investigational efforts.
Birds display a high degree of conservation of nuclear landscape elements, such as topologically associating domains (TADs), formed on the basis of interactions between CCCTC-binding factor regions [
6]. These domains play a role in restricting interactions between enhancers and promoters and, thus, in maintaining the specificity of regulatory contacts [
7]. However, a number of studies have shown that birds have shortened TADs compared to mammals, which may reflect both the peculiarities of genome organization and the accelerated evolution of regulatory elements [
6,
8].
The use of the method of cap analysis of gene expression (CAGE) provided a highly accurate determination of TSSs and identification of clusters corresponding not only to promoters but also to active enhancers [
9]. Hundreds of regions demonstrating characteristics of enhancer transcripts—bidirectional low-level transcription—have been described in the chicken genome. These elements turned out to be specific to certain tissues, including the liver, kidney, brain, and intestine [
10].
In the present study, we employed CAGE data to predict enhancer elements within the chicken (Gallus gallus) genome. Leveraging a substantial dataset derived from multiple tissues, we successfully identified a comprehensive repertoire of enhancers and quantitatively evaluated the distribution between intergenic and intragenic enhancer elements.
3. Discussion
Bird genomes are generally more compact than those of mammals, a pattern that is exemplified by the chicken genome, which spans approximately 1.2 million b.p—nearly three times smaller than the human genome, which contains about 3.2 billion b.p. with estimated proportion of enhancer material of 7.9% [
16] and more than two times smaller than the mouse genome (2.7 million b.p.) with enhancer proportion of being even larger than in humans—12.6% [
17]. A recent comprehensive study by the ChickenGTEx project [
5] has found the proportion of chicken enhancers to be of similar scale—8.86% [
5]. Our estimate slightly exceeded that ratio up to the value of 9.29%. The presence of a subset of enhancers longer than 800 b.p. suggests the potential inclusion of a distinct class of long non-coding RNAs. However, the comparable degree of overlap between both the long and short enhancer fractions with annotated chicken long non-coding RNAs, along with the homogeneity observed in explicit Markov models for sequences from both groups in RefSeq, supports the interpretation that the longer predicted enhancers (>800 b.p.) represent a specific subclass of enhancer-like elements rather than a separate RNA category.
Explicit Markov models of biological sequences have long been established as a component of theoretical foundations [
18] and are also widely applied in practical research [
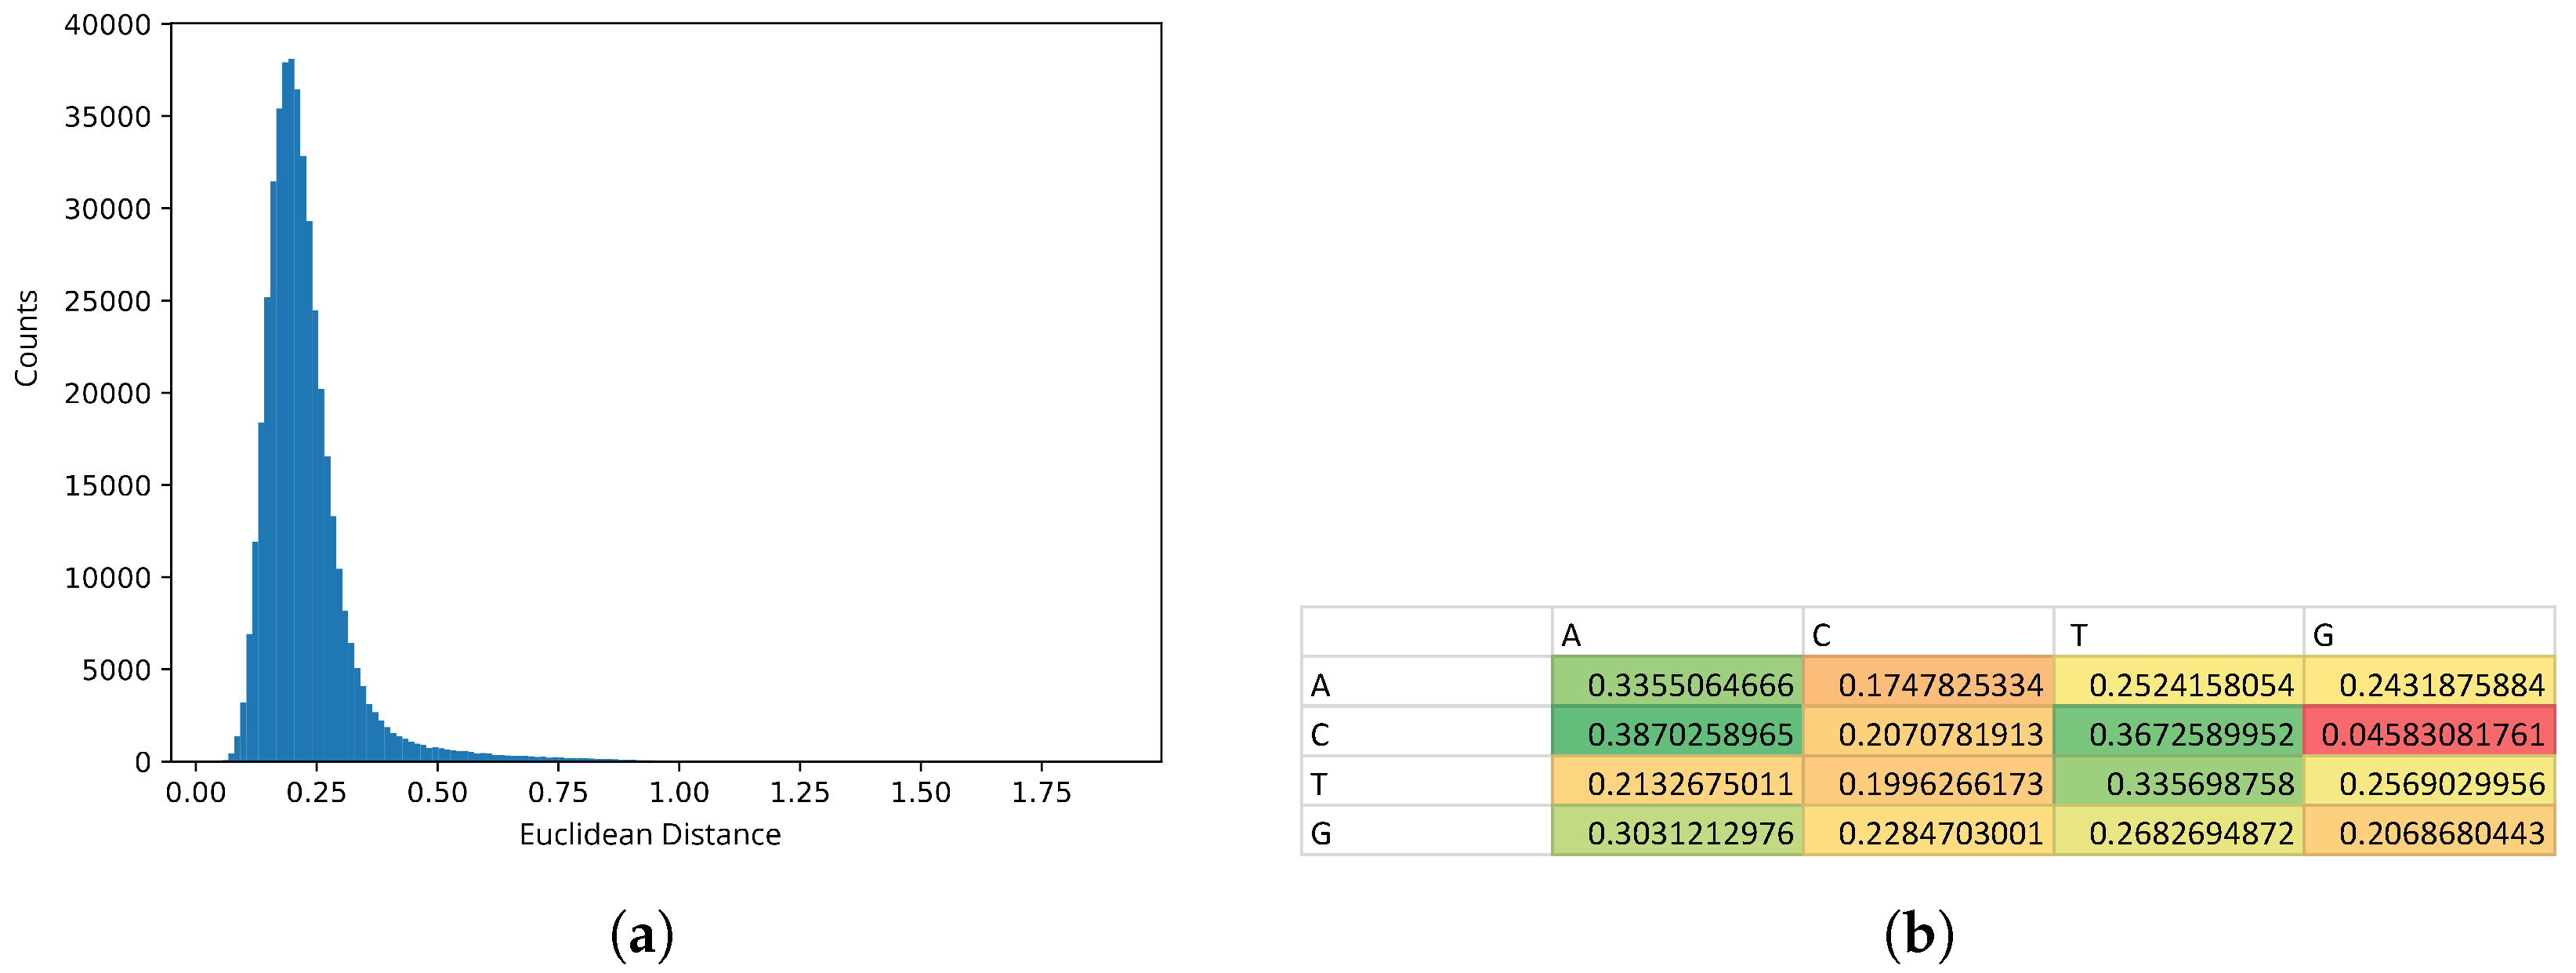
19]. However, the likelihood metric for a genomic sequence—calculated as the product of the conditional probabilities of nucleotides—clearly depends on the sequence length, complicating direct comparisons between sequences of different lengths. In this study, we proposed a metric based on the Euclidean distance between matrices of conditional probabilities for each sequence. Although this approach does not provide a direct estimate of sequence likelihood, it facilitates straightforward comparison between sequences of equal length.
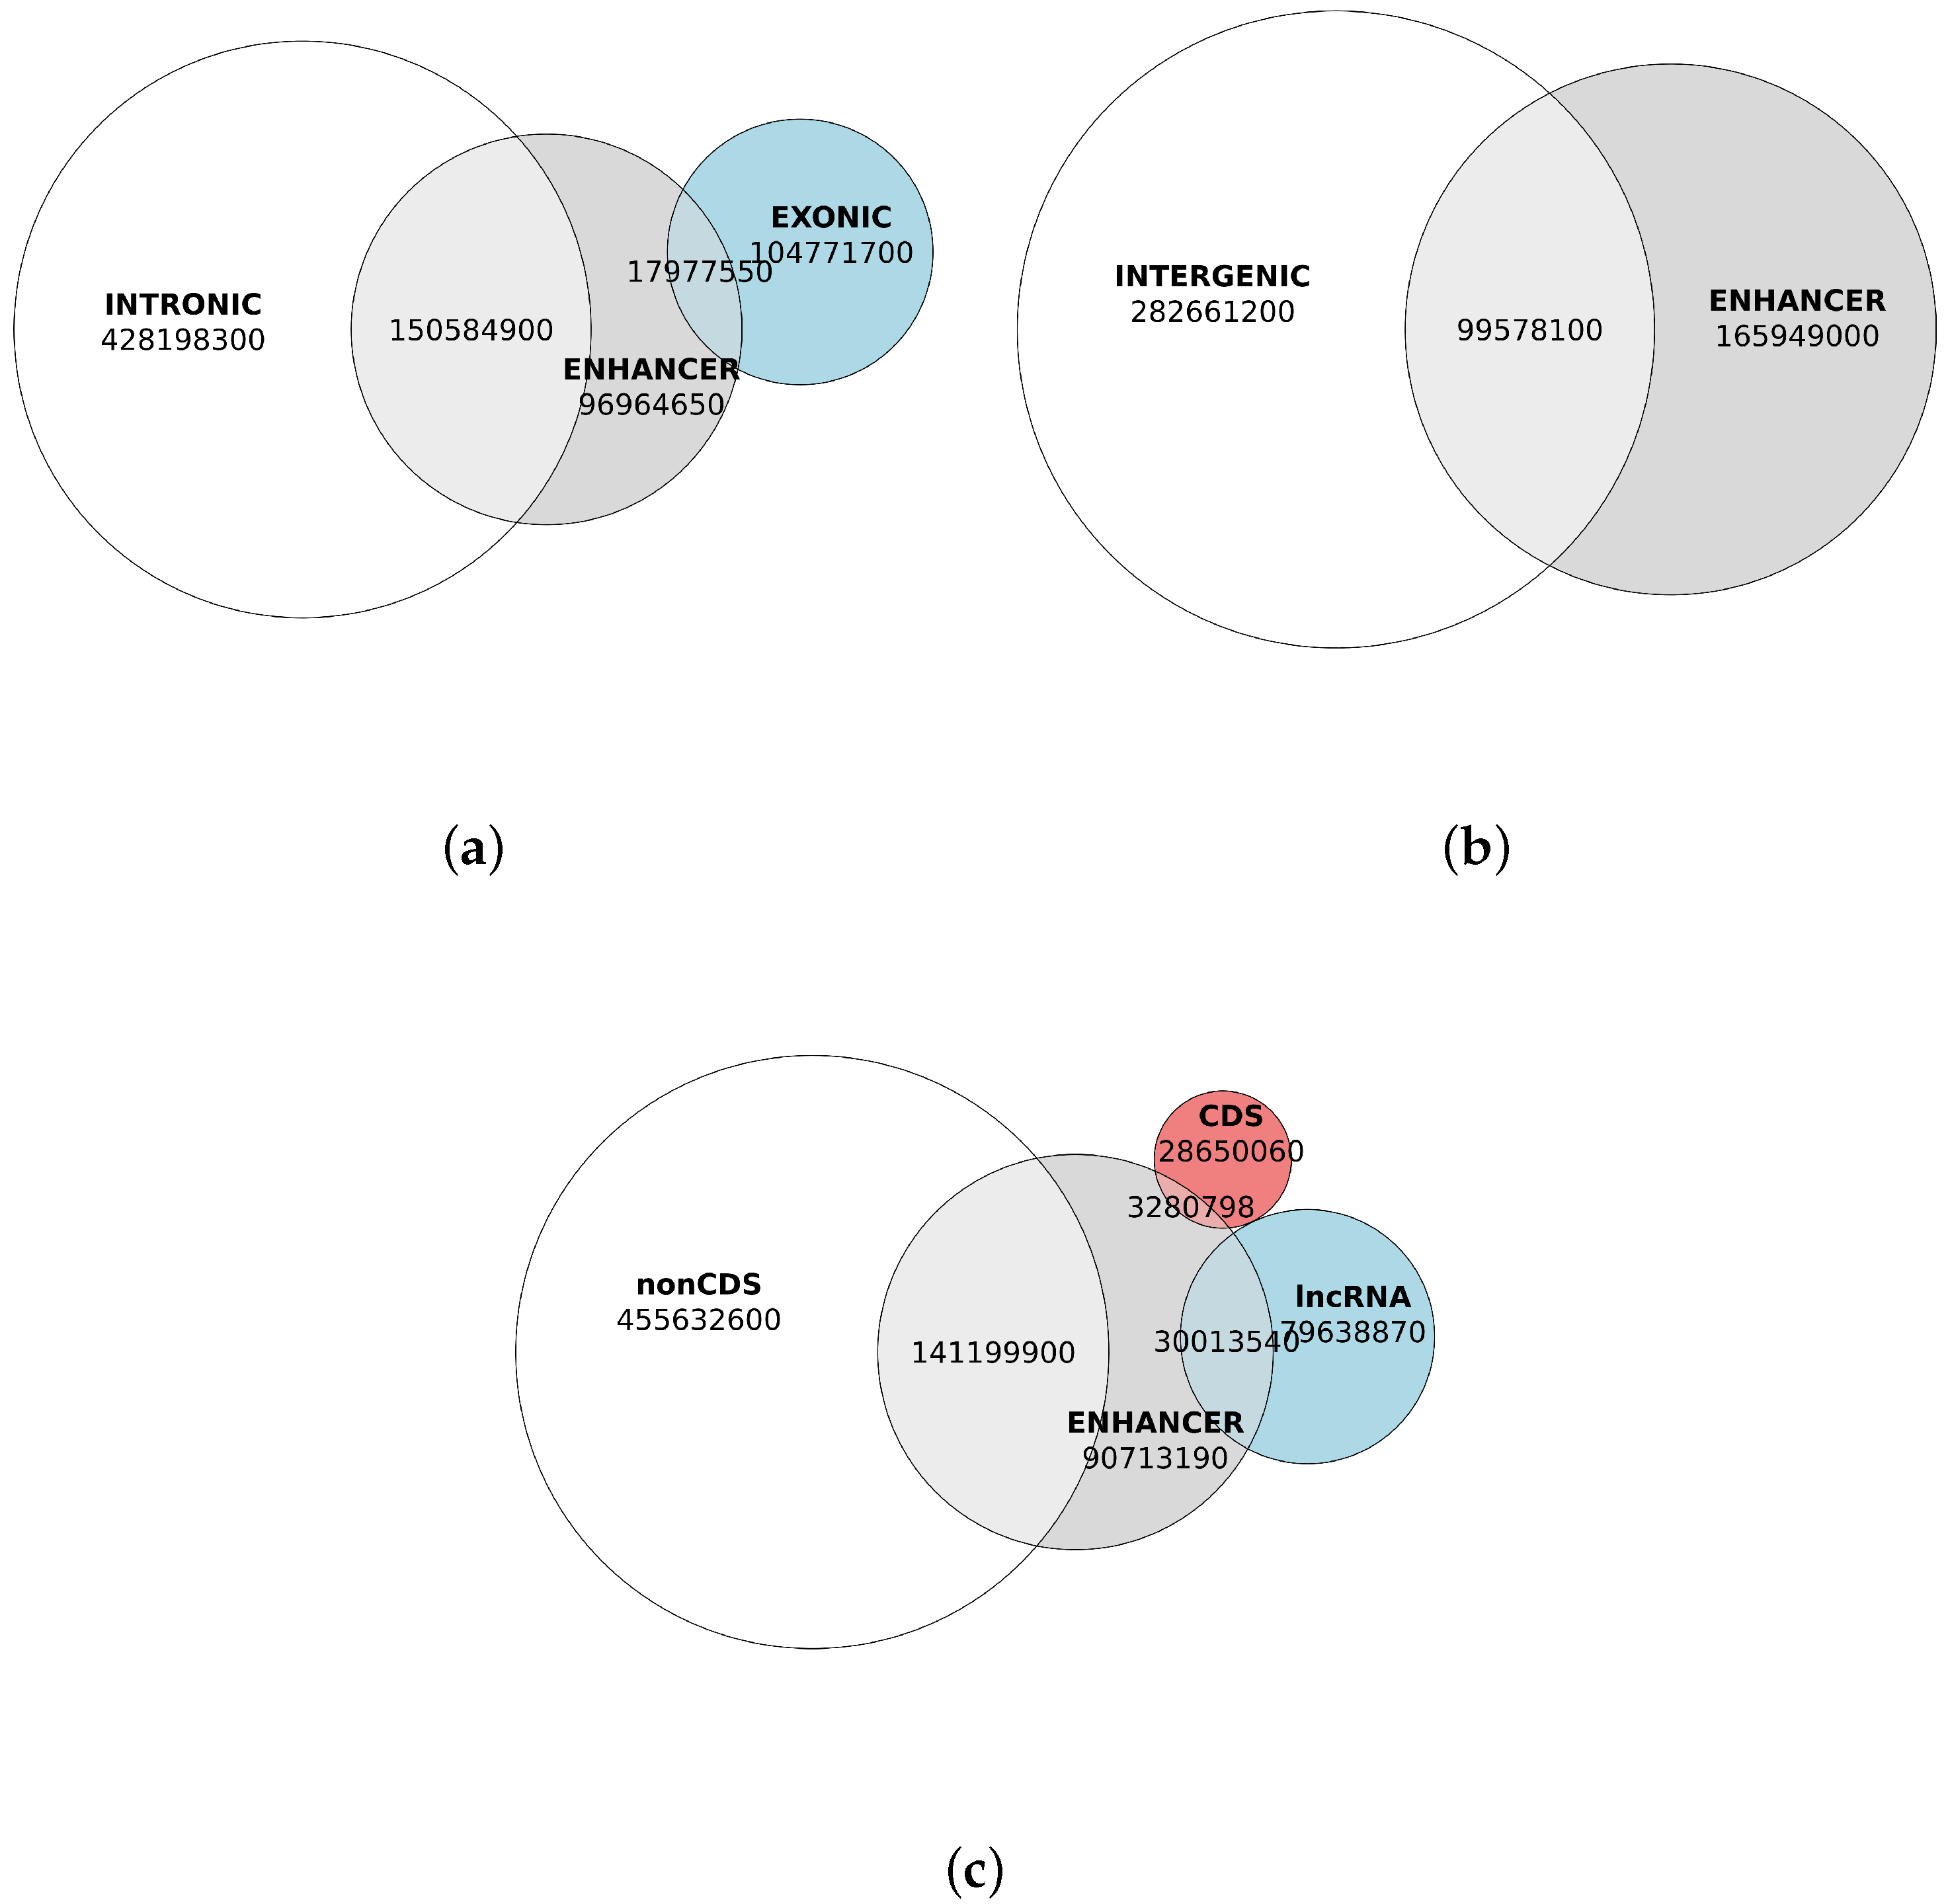
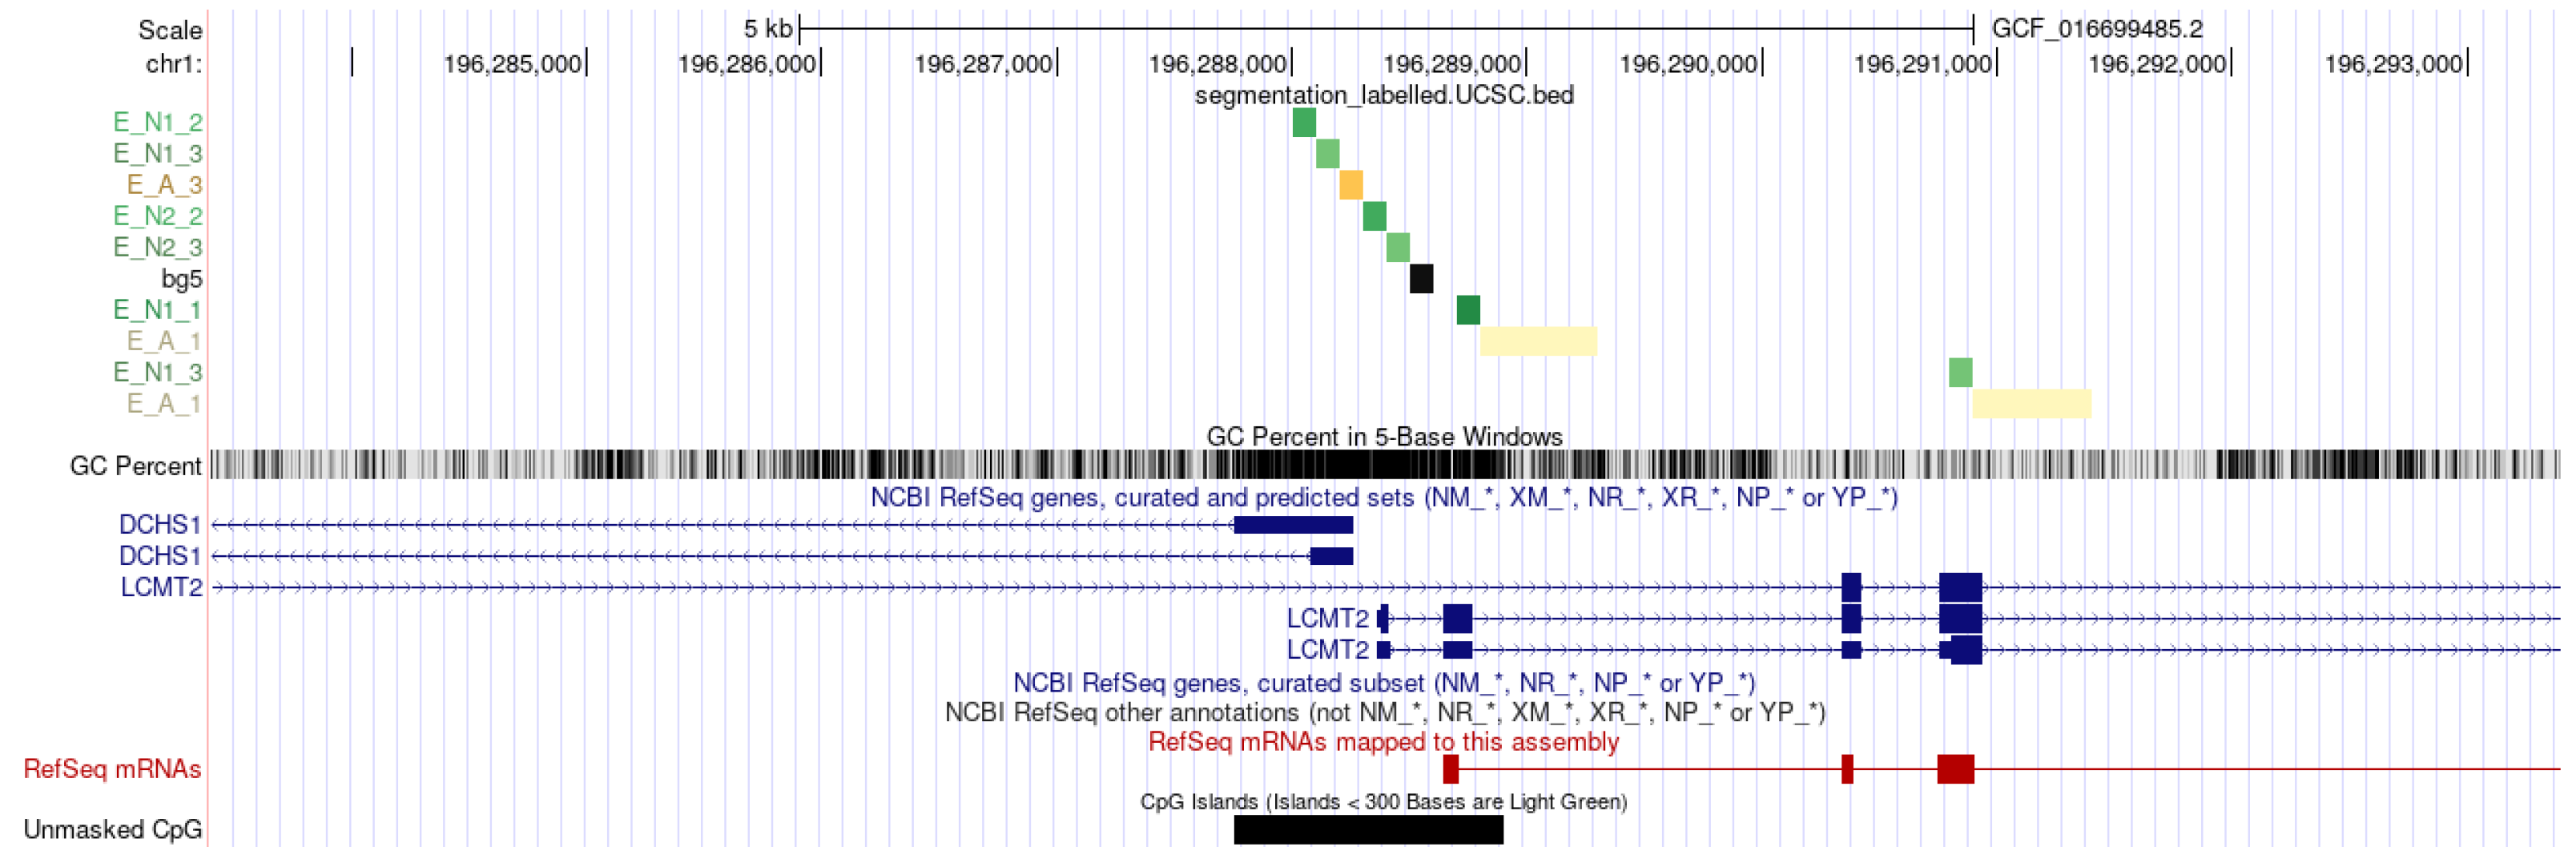
The eHMM enhancer–promoter model predicts the presence of flanking nucleosome-binding sites for both promoters and enhancers, and was able to successfully identify both flanking loci for the majority of enhancer regions. Although the majority of enhancer DNA identified in this study was located within intronic sequences, the proportion of intronic enhancers observed was consistent with the overall genomic proportion of intronic material in the chicken genome. Notably, intronic enhancers have been linked to tissue-specific gene expression, whereas genes exhibiting ubiquitous expression are thought to be predominantly regulated by intergenic enhancers [
20]. In our previous study, we observed that a substantial proportion of actively expressed genes exhibited ubiquitous expression across all tissues [
21].
The annotation of certain enhancer RNA loci as long non-coding RNAs (lncRNAs) in RefSeq is not unexpected, as these RNA types are known to be functionally related [
22]. Historically, the primary criterion for defining lncRNAs was simply transcript length, with non-coding RNAs exceeding 200 nucleotides classified as lncRNAs [
23]. More recently, some enhancer RNAs have been explicitly categorized as a subset of lncRNAs [
24].
The observed overlap between enhancer regions—including their flanking nucleosome landing sites—and coding sequences is also consistent with previous findings. Specifically, nucleosome-binding sites within coding sequences have been reported in yeast [
25], and the presence of exonic enhancers has been demonstrated in mice and zebrafish through ChIP-seq experiments [
26].
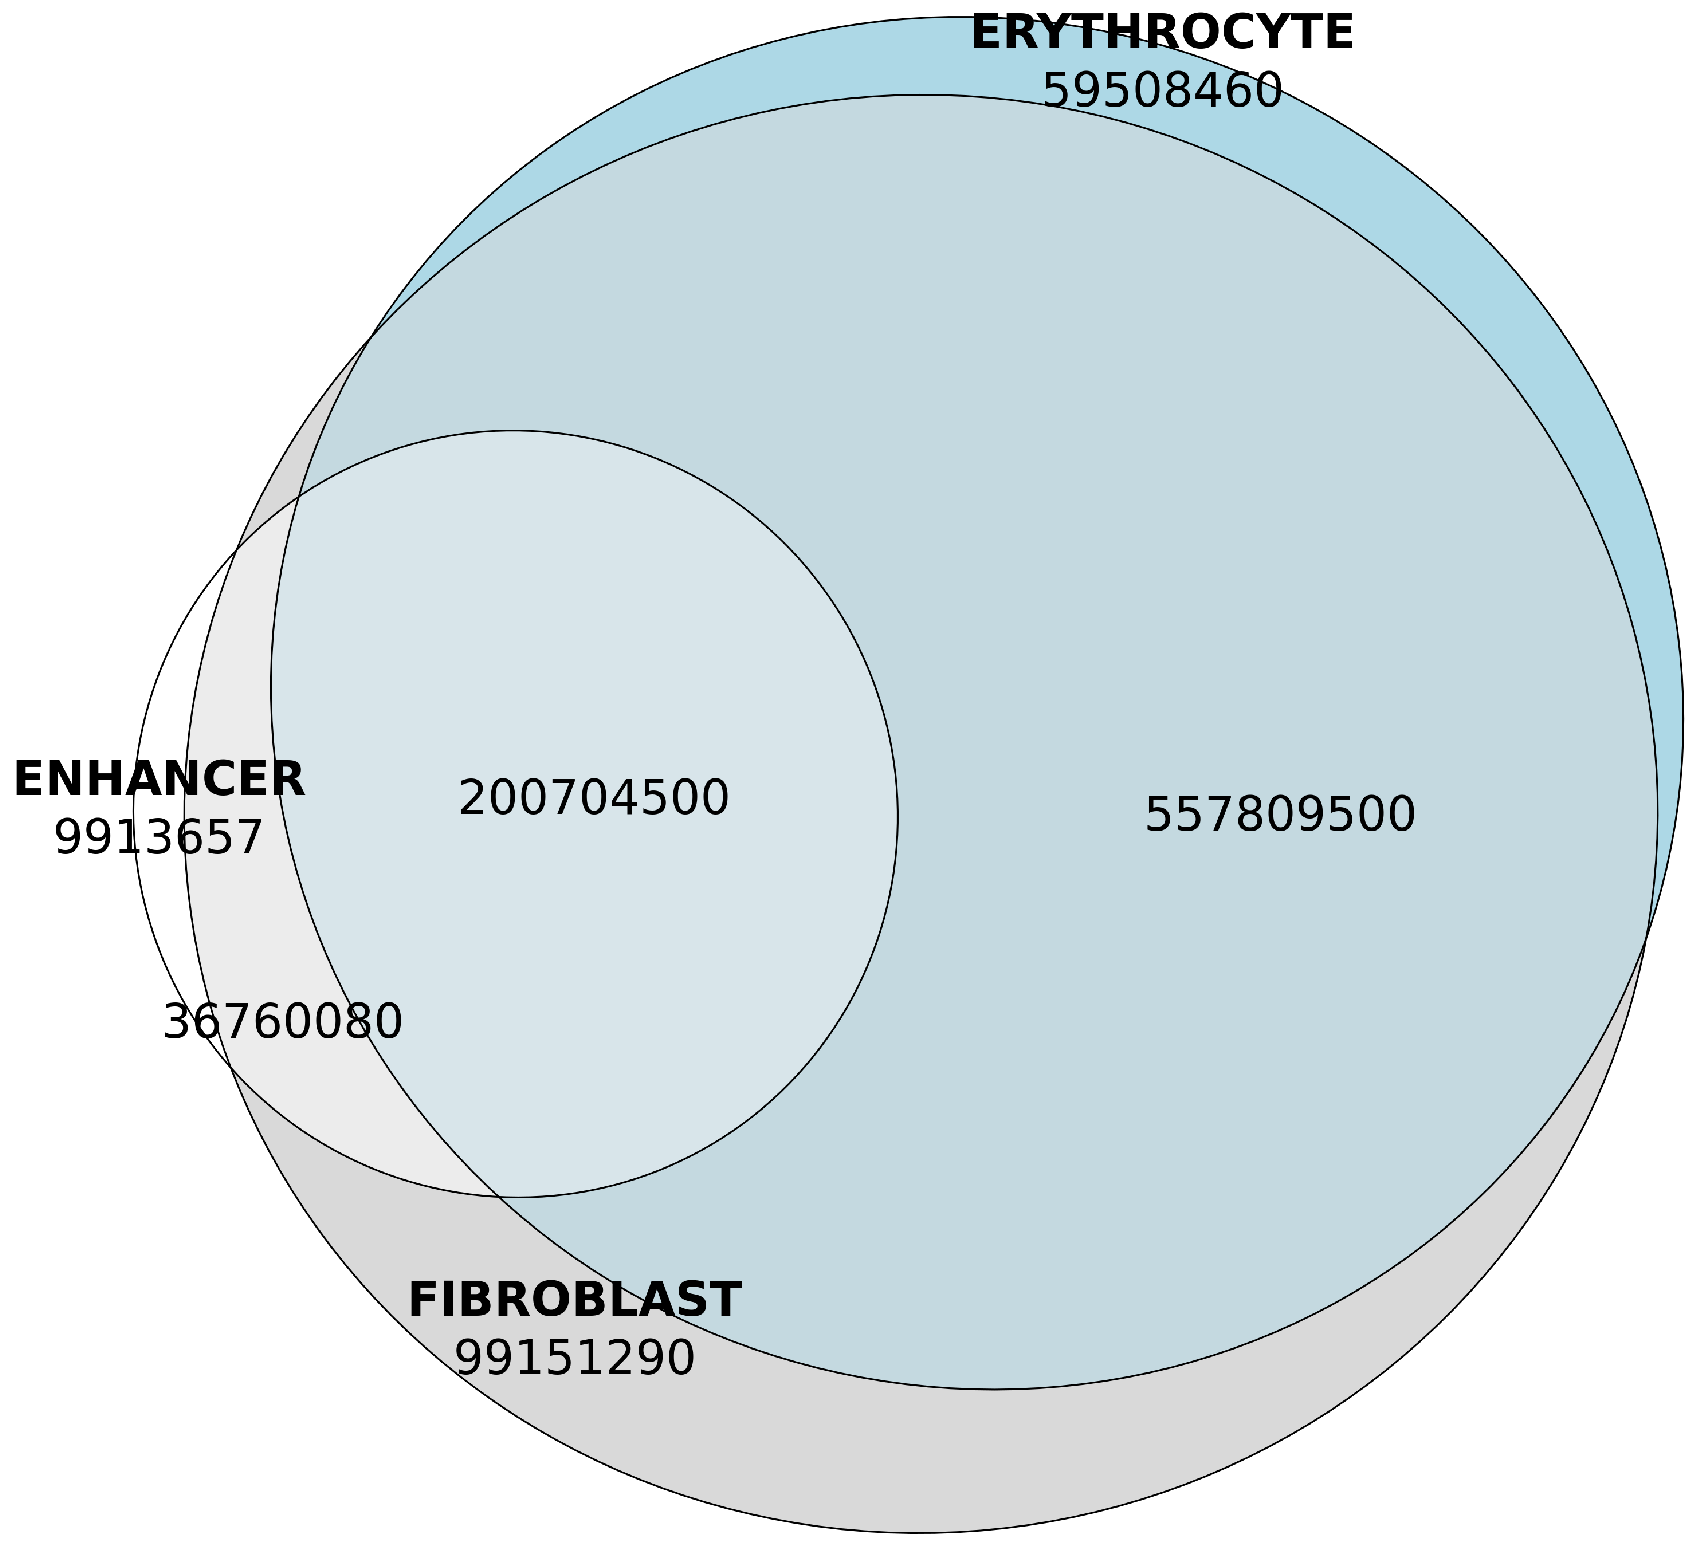
We have observed strong association between our enhancer predictions and intervals between chromosomal contacts imputed earlier from embryonic fibroblasts and immature erythrocytes and released in the Ontogen database [
6]. In that work, those contacts were designated as TADs and we conformed their similarity between fibroblasts and erythrocytes.
The observation of contacts retained in erythrocytes, even immature, is interesting. From one hand, even immature erythrocytes tend to progressively condensate their chromatin, which in turn would progressively lose its TADs in the course of erythropoesis [
27,
28]. According to this notion, only very young erythrocytes should bear TADs similar to other cells, whose chromatin does not undergo condensation, like embryonic fibroblasts.
It should be noted that the immature erythrocytes in the Ontogen paper were taken from chickens with chemically induced anemia. That, in turn, suggested rapid erythropoesis and early age of the erythrocytes sampled for the study. It might be speculated that the erythrocytes did not have enough time to undergo sufficient chromatin condensation and subsequent loss of TADs. From another hand, the chromosomal contacts in the condensed chromatin have been shown to follow the TADs in active chromosomes [
29].
In this study, we have performed a purely computational prediction of enhancers in chicken genome and we based solely on CAGE data. Studies that combine both transcriptomic and chromatin accessibility experiments on the same samples would be highly beneficial to validity and precision of the annotation of enhancers.
Recent research on chicken genomics and transcriptomics has extensively covered the economic impact of novel findings in the field, involving increased productivity, improved market value, disease resistance and livestock development [
30,
31,
32,
33]. Improvement of annotation of genomic enhancers would add more clarity to understanding of regulation of target genes and phenotype diversity.
4. Materials and Methods
4.1. Public CAGE-Seq and IsoSeq Data
We used publicly available dataset of CAGE-seq BGI-SEQ reads (
http://chicken.biouml.org/downloads/ChickenResearch2023/CageSeq/raw_data (accessed on 9 November 2025) from the project “Genetic Technologies in Poultry Farming” (GenTech,
https://chicken.biouml.org). The project involved the CAGE-seq experiments conducted on 12 fast-growing and 12 slow-growing F2 chickens from a cross between the Russian White and Cornish breeds. Samples from 6 tissues were used in the project: brain, breast, heart, kidney, legs, and breast, taken at the age of 9 weeks. To validate the enhancer RNA predictions, we used the public dataset from IsoSeq experiment on a Piao chicken from NCBI SRA (ID SRR24293230).
4.2. Reference Genome and Gene Annotation
We used the chicken GRCg7b Refseq reference genome assembly (Refseq ID GCF_016699485.2) and the corresponding version of the chicken genome annotation (NCBI Gallus gallus Annotation Release 106). For interval arithmetic, we used the bedtools [
34] package, and for visualizing the overlaps as Venn diagrams, we used the eulerr [
35] package.
4.3. Prediction of Enhancers in Chicken Genome from CAGE Data
To make initial predictions of genomic enhancers from CAGE experiments and thus provide a learning set for further HMM predictions, we mapped the CAGE-seq reads, calculated, aggregated and normalized the expression of the CAGE tag start sites (CTSS) in the chicken genome from BGI-SEQ reads similarly to our previous work [
21].
We aligned BGI-SEQ reads to the GRCg7b reference genome, using the STAR package v.2.7.11b [
36] with default parameters but accounting signal only from 5’ of the first read (read1_5p option).
The start positions of mapped CAGE reads were aggregated into CAGE tag start sites (CTSS) following a procedure analogous to that used in the FANTOM5 project [
37]. Initially, mapped reads were filtered using SAMtools, version 1.22.1, and subsequent conversion and aggregation were performed with BEDtools, version 2.31.1. The resulting CTSSs, initially in BED format, were converted into the native CAGEr format, which incorporates chromosome coordinates, tag start positions, strand information, and the corresponding read counts per tag. These CTSS datasets were then imported into the CAGEr package v 2.8.0 [
38].
CTSS expression data were normalized using a power law normalization approach as described by [
39]. This method, implemented in the CAGEr package, leverages the power law distribution characteristic of CTSS expression values and relies on two primary parameters: the slope of the log-log regression line fitted to the CTSS expression value distribution and the X-axis intercept of this regression, which defines the referent number of CTSSs. Two distinct normalization parameter sets were applied in this study: robust and permissive. The robust parameters, adopted from the CAGEr vignette, employed a slope of −1.2 and a referent CTSS count of 50,000. For the permissive parameter set, values were empirically derived from the log-log distribution of our CTSS expression data, with the X-axis intercept of the regression line at 1.2 × 10
7 serving as the referent CTSS number, while retaining the slope of −1.2. The robust normalization parameters were used for analyses involving ubiquitously active promoters and promoter shifts between tissues, whereas the permissive parameters were applied to the analysis of promoter shifts between slow- and fast-growing chickens.
We performed initial enhancer prediction from CAGE data using the approach of extracting bidirectional promoters distant from known gene loci with the use of clusetring of CTSS expression [
40] implemented in the CAGEr package as the interface to the CAGEfightR’s function quickEnhancers(). Thus, we clustered the CTSSs bidirectionally using window length of 201 b.p., the balance of expression from both strands was calculated using Bhattacharyya coefficient and its threshold was set 0.95. The expression of the enhancers was quantified as the sum of the expression values containing CTSSs.
We validated the predicted enhancers by overlapping their genomic intervals with enhancer intervals annotated for the chicken genome in the eRNAdb [
3] and Enhancer Atlas [
4] databases. Statistical significance of the overlaps was estimated with exact Fisher’s test implemented in BEDtools.
4.4. Topologically Associating Domains
We assigned the predicted enhancers to topologically associating domains (TADs) in the chicken genome. The reference set of TADs was from the Ontogen database [
6]. The coordinates of the genomic TAD intervals were transformed from the original galGal5 assembly to the GRCg7b assembly using the liftOver package, version 469 [
41]. For hypothesis rejection testing of the significance of overlaps between genomic intervals, we used the hypergeometric test implemented in the SciPy module for Python 3 [
42].
4.5. Homogeneity of Enhancer Sequences
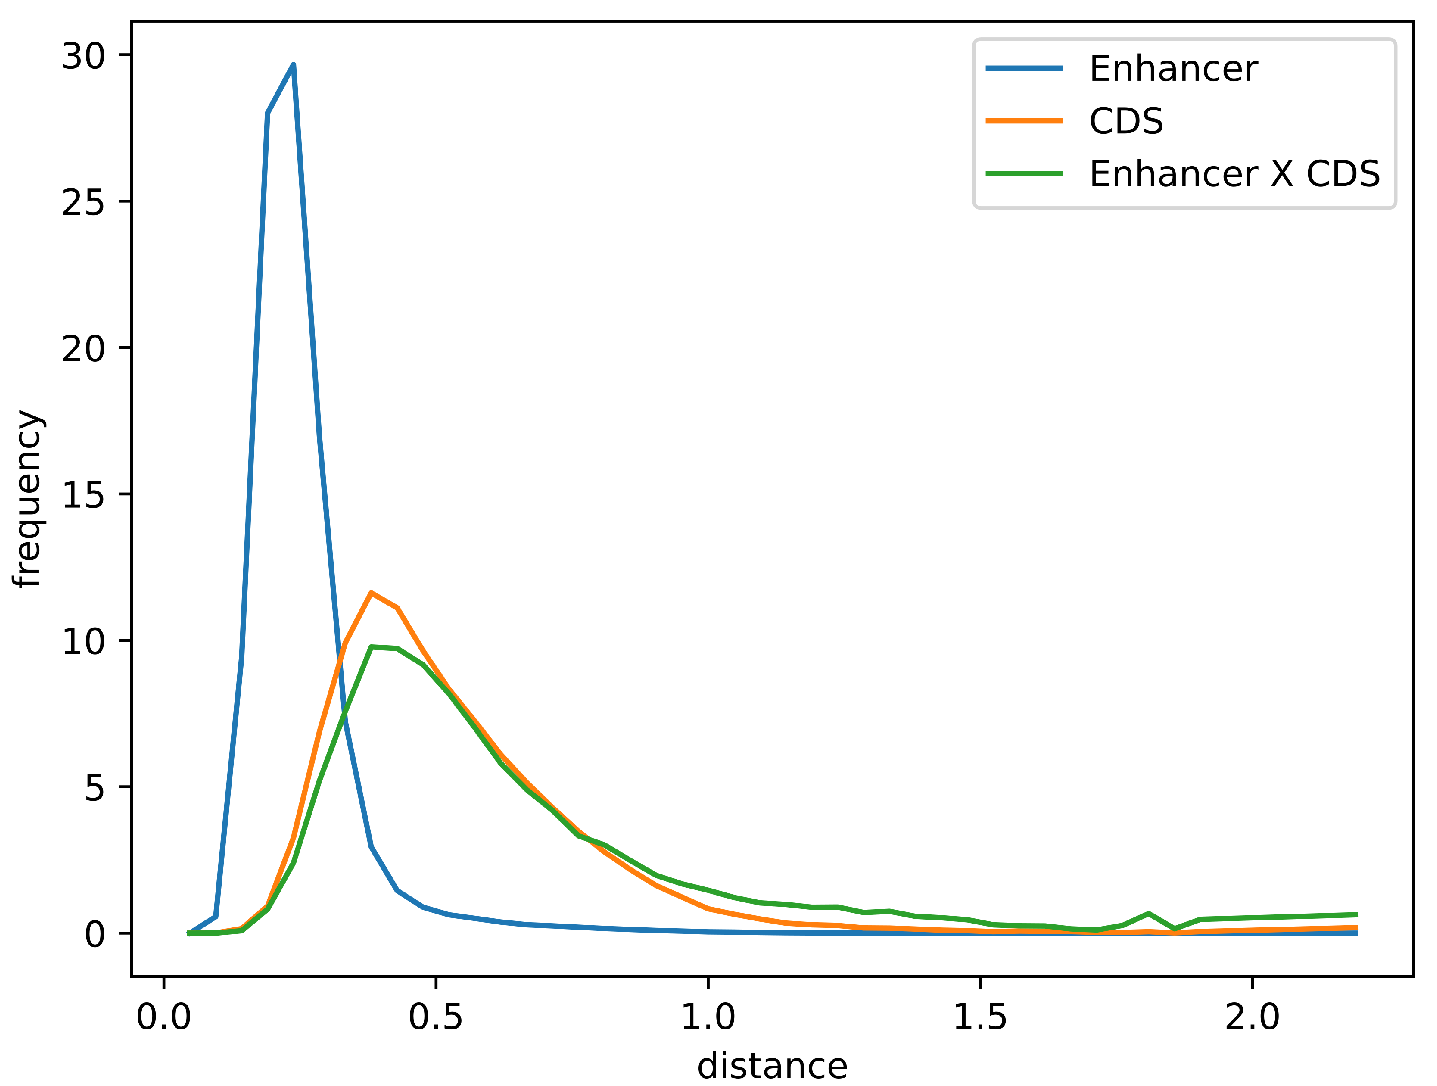
To assess the sequence homogeneity of enhancers predicted from bidirectional promoters, we used the Euclidean distance metric between first-order explicit Markov models.
We calculated first-order Markov models for genomic sequences by analogy with [
18]. For some sequence, we calculate the occurrence values of dinucleotides with a shift of 1 nucleotide. We divide each occurrence value of a dinucleotide by the occurrence of the first nucleotide of a pair in this sequence. Thus, we obtain a vector of 16 conditional probabilities
, where
is the nucleotide at the
i-th position, and
is the previous nucleotide. This vector, also representable as a 4 × 4 matrix, is an explicit first-order Markov model for this sequence. Then, for
N sequences, one can calculate the averaged explicit first-order Markov model as a vector of arithmetic means of conditional probabilities of 16 dinucleotides:
where
. As a result, for each of the sequences, one can calculate the deviation from the average model as the Euclidean distance along 16 coordinates representing dinucleotide frequencies:
The unimodality of the distribution of the statistic was taken as evidence of the homogeneity of the Markov models of predicted enhancers.
4.6. Hidden Markov Model of Enhancers
To refine our prediction of enhancers, we used the hidden Markov chain approach implemented in the eHMM package,
https://github.com/tobiaszehnder/ehmm, last accessed on 9 November 2025 [
43]. To train the model, we applied its learnModel module to the genomic intervals of enhancers and predicted by CAGEr. The learnModel was additionally provided with the promoter regions predicted by CAGEr in our previous work [
21], along with the enhancers, so that the resulting HMM could distinguish between promoters and enhancers. We also used CAGE read mapping against the chicken reference genome, and classified them as accessible chromatin regions (ACCs) in eHMM. As a result, eHMM built intermediate models of promoters and enhancers, as well as read count matrices mapping to promoter and enhancer regions. The resulting intermediate data were then used to build the Hidden Markov Model.
To construct the Hidden Markov Model (HMM), we employed the constructModel module, utilizing intermediate enhancer and promoter models along with count matrices derived during the training phase. Additionally, we explicitly defined state vectors corresponding to accessible chromatin and nucleosome states, each comprising three distinct states. The background model for accessible chromatin was implemented using the default eHMM configuration.
The constructed model was applied to the chicken genome assembly GRCg7b using the applyModel module. Training data consisted of enhancer intervals predicted by Andersson’s bidirectional method, promoter intervals predicted previously [
21], the matrices of CAGE read counts mapped onto these intervals and intermediate promoter and enhancer models, obtained from learnModel stage of the eHMM pipeline. We also used three Markov states of accessible chromatin and nucleosome flanking regions.
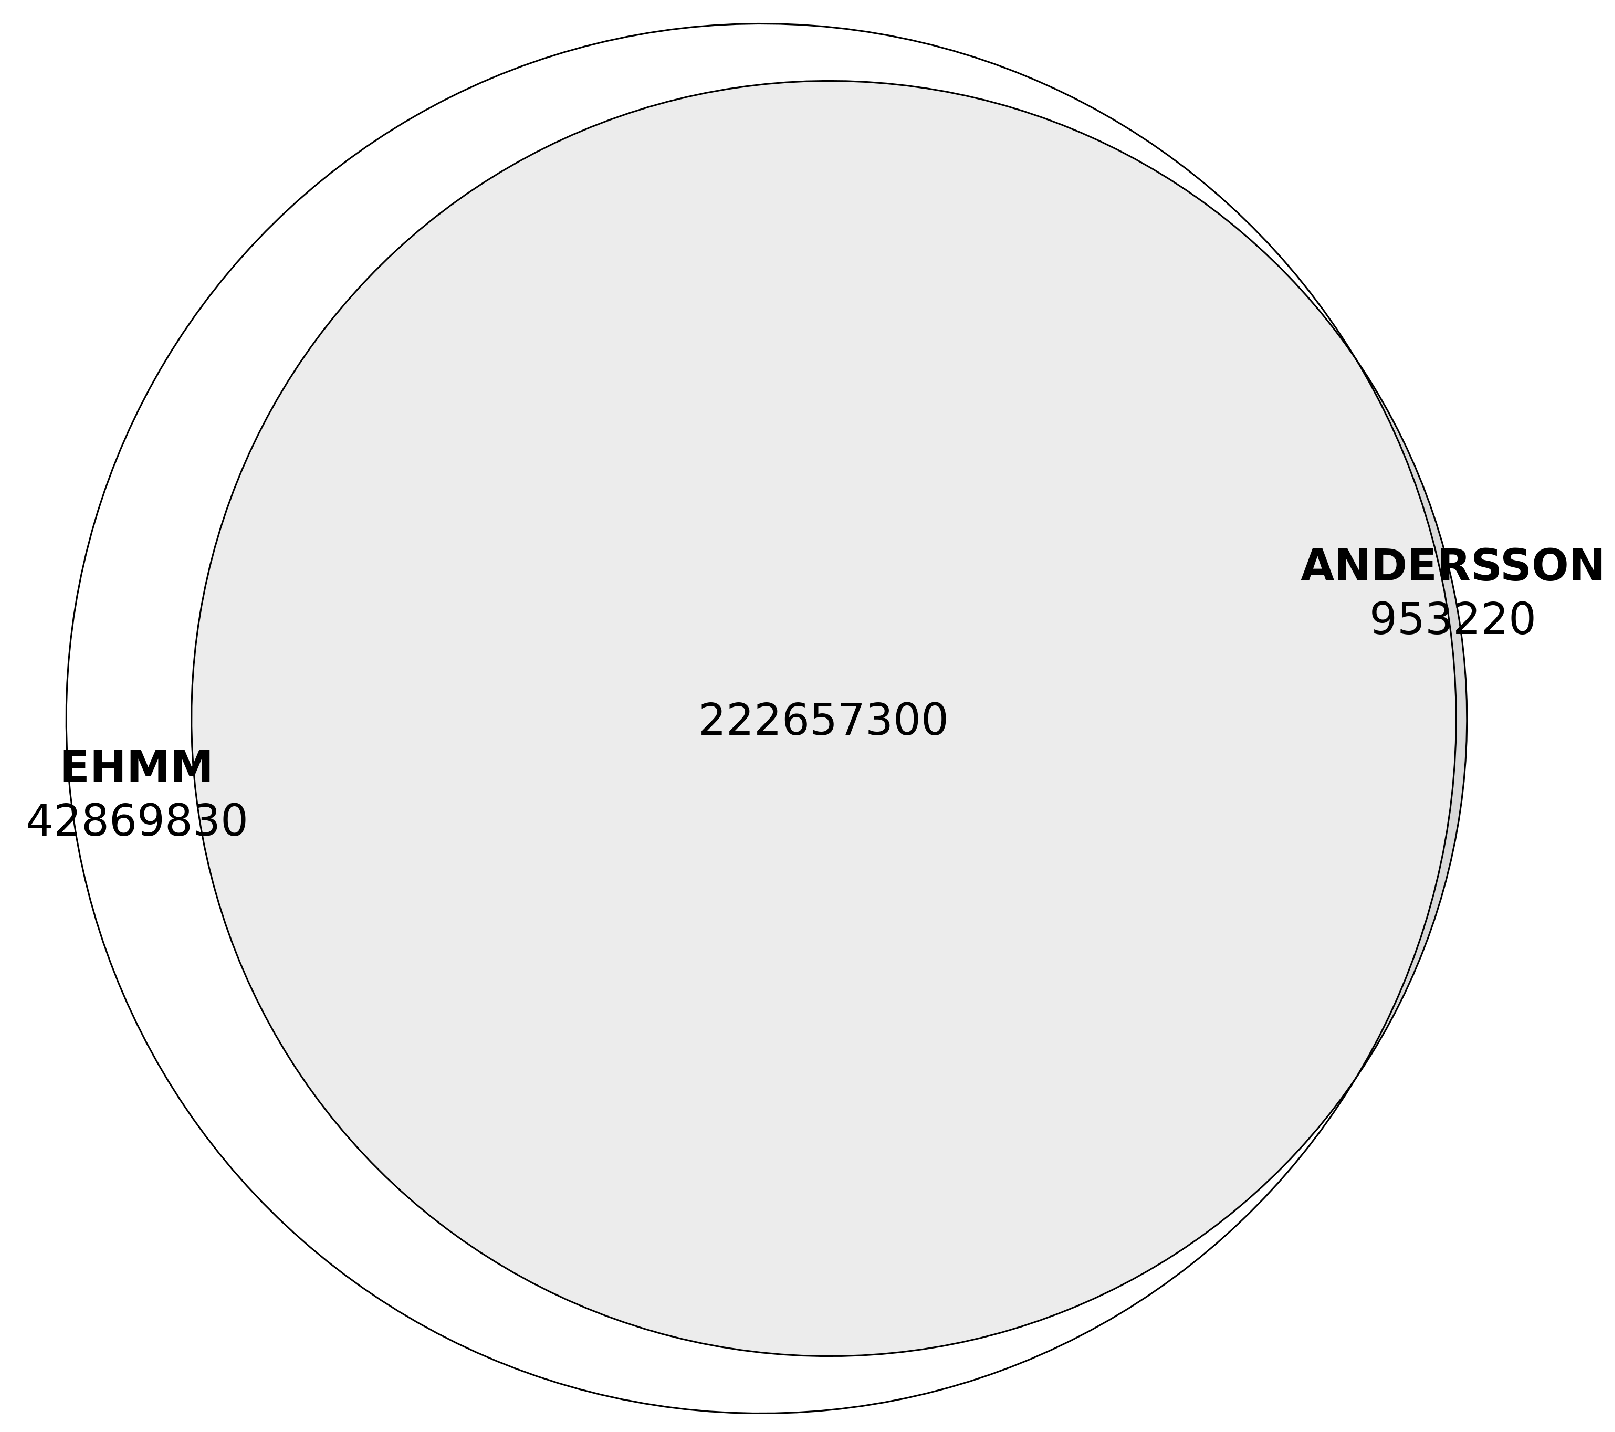
We estimated the discrimination between promoters and enhancers by overlapping the resulting promoter and enhancer regions using BEDtools and counting the number of predicted enhancers which overlapped the predicted promoters.
4.7. Background and Signal Expression of Predicted Enhancers
We measured the expression of the eHMM enhancers by counting reads mapped on to their intervals with featureCount tool of the Subread package, version 2.1.1 [
44]. We estimated averaged expression of enhancers in all samples of all six tissues by summarizing enhancers counts in all samples and then normalized using the transcripts per million (TPM) approach. The array of the averaged expression of enhancers was then used to estimate the TPM threshold of enhancers whose expression was significantly higher then the level of background transcription. To estimate the average level and variability of the background transcription, we used the two-component Gaussian mixture model of log-transformed TPM values of averaged expression of enhancers in all samples, implemented in the mixtools R package, version 2.0.0.1 [
45]. According to the approach, the density of the distribution of the vector of log-transformed expression values
,
was represented as
where
B was the background transcription,
S was the transcription signal,
was the density of a normal distribution of random variable
x with mean
and standard deviation
. Then,
,
,
,
were the estimates of the mean levels and the standard deviations of the background transcription and the transcription signal, respectively.
We estimated the mean and the standard deviation of the two components of the distribution of transformed expression values using the expectation–maximization (EM) approach implemented in the normalmixEM function of the package. The first component of the mixture with the least estimated mean was considered as the estimate of the distribution of the background transcription signal. In order to estimate the expression values which were significantly higher than the background, we define the cutoff between the upper level of background expression and the lower level of signal expression,
, as
which corresponded to one-tailed
p-value of ≈0.022.
Exponentiation of the resulting value allowed to estimate the TPM threshold for non-background (signal) expression of enhancers (
):
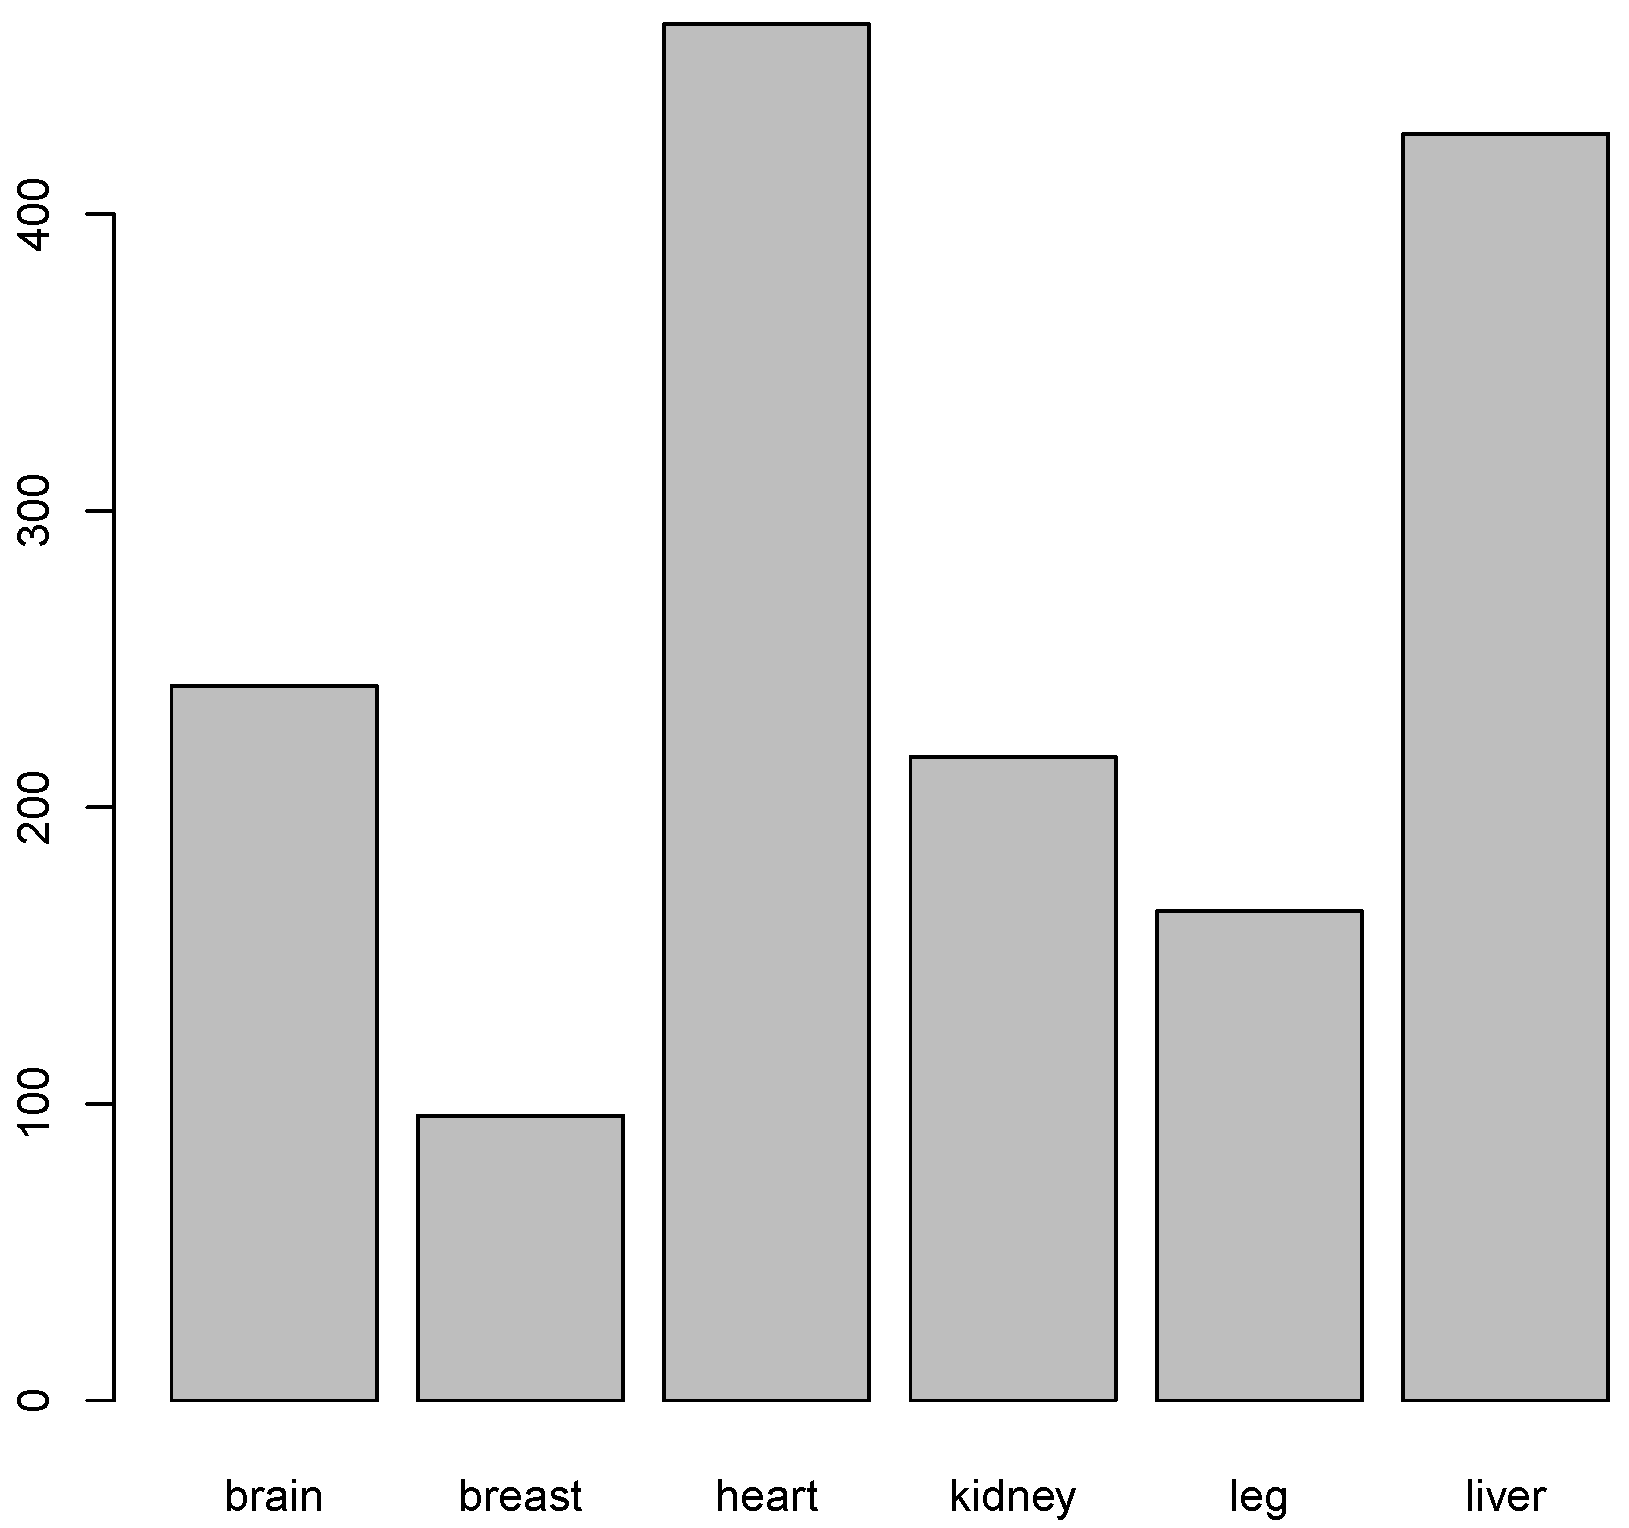
Later, we selected enhancers who averaged expression exceeded the threshold in all tissues (tissue agnostic enhancers), as well as in each of six tissues under study (tissue characteristic enhancers).
4.8. Expression of Enhancers in Tissues and Functional Analysis
To estimate the TPM threshold of signal expression in the eHMM enhancers, we summarized the read counts of each enhancer across all samples and then TPM-normalized the resulting vector of counts.
The expression values of the eHMM enhancers in samples in the form of read counts were also aggregated by tissue and then were TPM normalized. We then applied the TPM threshold estimated earlier () to select enhancers whose expression was significantly higher than the background level in each tissue, which resulted in six sets of tissue characteristic enhancers.
To validate the functionality of the eHMM enhancers, we performed the over-representation analysis (ORA) of the genes which intronic enhancers were significantly expressed. We selected the intergenic subsets of the resulting tissue characteristic enhancers, as well as tissue agnostic enhancers, using bedtools with the option of 100% of an enhancer interval being within the intronic interval and annotated the relevant genes with their gene symbols using the RefSeq annotation. We obtained tissue-specific gene sets by filtering out the gene symbols which were not unique to a certain tissue.
The resulting tissue specific gene lists were searched for significantly over-represented functional terms against KEGG Pathway [
46] and Gene Ontology [
47] databases using the clusterProfiler tool [
48] with Benjamini–Hochberg adjusted
p-value cutoff 0.05.
4.9. Validation with IsoSeq Data
We aligned the IsoSeq reads against the reference chicken genome, version GRCg7b, using the minimap2 tool [
49] with the preset for spliced alignment for long reads (-ax splice:hq option). The reads were overlapped against the predicted eHMM enhancers using the intersect command of the BEDtools package accounting only for enhancer intervals which overlapped with at least one mapping interval of the reads (-wo option, BAM format for the mapped reads). Thus, an enhancer from the eHMM set was considered detected if it overlapped at least one IsoSeq read. The output of BEDtools was aggregated using the uniq utility to count the eHMM enhancers which overlapped any of the IsoSeq reads.

