Article

Identification of Anticancer Targets in Ovarian Cancer Using Genomic Drug Sensitivity Data

1
Department of Biotechnology, Duksung Women’s University, 33 Samyang-Ro 144-Gil, Dobong-gu, Seoul 01369, Republic of Korea
2
Department of Biomedical Systems Engineering, Soongsil University, 369 Sangdo-ro, Dongjak-gu, Seoul 06978, Republic of Korea
*
Author to whom correspondence should be addressed.
Int. J. Mol. Sci. 2025, 26(19), 9530; https://doi.org/10.3390/ijms26199530
Submission received: 18 August 2025 / Revised: 22 September 2025 / Accepted: 24 September 2025 / Published: 29 September 2025
(This article belongs to the Special Issue Bioinformatics of Gene Regulations and Structure–2025)

Abstract

PARP inhibitors exploit synthetic lethality in BRCA1/2-mutated ovarian cancers but are limited by emerging therapeutic resistance. Therefore, novel biomarkers predicting PARP inhibitor response are urgently needed. In this study, we performed integrative analysis using drug sensitivity, patient survival, gene dependency, and expression data to identify biomarkers associated with PARP inhibitor response in ovarian cancer. Mutations in BRCA1, MLL2, NF1, and SMARCA4 were associated with increased sensitivity to PARP inhibitors, suggesting potential synthetic lethality with PARP1. In contrast, SMAD4 mutations were linked to PARP inhibitor resistance, and low SMAD4 expression was associated with poor overall survival in patients with ovarian cancer. Further gene dependency score (GDS)-based screening revealed 51 candidate genes potentially involved in SMAD4-mediated resistance. Functional enrichment revealed associations with stress response, tumor-associated signaling pathways, and additional processes. Subsequent correlation and survival analyses nominated ACACA, PRPF4B, and TUBD1 as potential therapeutic targets. Notably, low ACACA expression in patients with low SMAD4 expression was associated with improved survival, indicating its relevance in overcoming PARP inhibitor resistance. This study contributes to predicting clinical outcomes in ovarian cancer and developing personalized treatment strategies.

1. Introduction

Ovarian cancer is the seventh most common malignancy affecting women worldwide, with approximately 239,000 new cases and 152,000 deaths annually [1]. Although its incidence and mortality rates have gradually declined over time, ovarian cancer remains the most lethal gynecologic malignancy [2]. This is primarily because ovaries are anatomically located deep within the abdominal cavity; therefore, early symptoms are often nonspecific or unnoticed, leading to delayed diagnosis at advanced stages. The five-year relative survival rate, which is widely used in cancer diagnostics to indicate the probability of patient survival within five years of diagnosis, is 70–90% in the early stages of ovarian cancer [3]. However, this rate precipitously declines to approximately 30% in the advanced stages, contributing to an overall poor prognosis [4].
Furthermore, high-grade serous ovarian carcinoma, which has the most unfavorable prognosis among ovarian cancer subtypes, is the most commonly diagnosed subtype [4]. The etiology of this subtype is primarily attributed to genetic deficiencies, specifically homologous recombination deficiency (HRD) [5]. HRD is a state in which the homologous recombination repair pathway is dysfunctional. Homologous recombination is an essential cellular mechanism for repairing double-strand DNA breaks [6]. However, mutations in genes such as BRCA1/2 can impede this repair process, leading to HRD. A promising therapeutic strategy targeting this mechanism involves the use of poly (ADP-ribose) polymerase (PARP) inhibitors, which block PARP1-mediated single-strand DNA break repair, leading to the accumulation of double-strand breaks, which require the BRCA1/2 pathway for repair [7]. In cancer cells with BRCA1/2 mutations, this creates a synthetic lethal interaction where PARP1 inhibition selectively induces cancer cell death while sparing normal cells [8,9].
Synthetic lethality is a process where the simultaneous inactivation of two genes results in cell death, whereas the loss of either gene alone does not affect cell viability [10]. In 1997, Hartwell et al. first proposed the application of synthetic lethality in anticancer drug discovery [11]. PARP inhibitors exemplify the inaugural clinical implementation of synthetic lethality principles for targeted cancer treatment [12]. Olaparib, the first-in-class PARP inhibitor, was initially approved by the FDA in 2014 for treating ovarian cancer with a specific genetic mutation, known as “BRCA-mutated” ovarian cancer. Since then, its therapeutic scope has expanded significantly to encompass other cancer types, including breast and pancreatic cancers [13,14]. Anticancer agents based on synthetic lethality can achieve lethal effects selectively on tumor cells rather than those on normal cells, eventually reducing side effects and enhancing therapeutic efficacy compared to those of conventional chemotherapeutics [6].
Significant advances have been achieved in ovarian cancer treatment through the introduction of novel targeted therapies, such as bevacizumab [15], thus remarkably improving patient survival. However, challenges such as post-treatment recurrence and drug resistance remain unresolved, thereby limiting improvements in long-term survival rates. In particular, resistance to PARP inhibitors is frequently observed clinically and potentially occurs through various mechanisms, including the activation of compensatory pathways and restoration of BRCA function [16].
Synthetic rescue, an emerging concept of drug resistance, is defined as a genetic interaction where a cell modifies one gene to evade the deleterious effects of another inactivated gene [17], resulting in resistance to anticancer therapies [18]. Synthetic rescue interactions are classified into downregulated and downregulated (DD), where the inactivation of two genes promotes cell survival and downregulated and upregulated (DU), where the inactivation of one gene is compensated by the overexpression of another [17]. Cancer cells acquire drug resistance by activating alternative pathways that compensate for the functional loss of target genes. Consequently, the identification and inhibition of genes involved in synthetic rescue relationships that confer resistance to targeted anticancer agents can potentially overcome resistance and enhance therapeutic efficacy.
In this study, we aimed to perform an integrative analysis of genomic drug sensitivity data and genetic functional datasets to identify the genes associated with sensitivity (BRCA1, MLL2, NF1, and SMARCA4) and resistance, specifically SMAD4, whose reduced expression emerged as a prognostic marker, to PARP inhibitors in ovarian cancer. We also predicted potential synthetic lethality and synthetic rescue relationships between these genes and PARP1. Furthermore, through expression correlation and survival analysis, we proposed a novel therapeutic target gene (i.e., ACACA) and suggested a combinatorial strategy in which ACACA inhibition may overcome SMAD4-low–mediated resistance, thereby contributing to improved prognosis and the establishment of personalized treatment strategies for patients with ovarian cancer.

2. Results and Discussion

2.1. Identification of Sensitivity and Resistance Biomarkers to PARP Inhibitors

In this study, we analyzed the Genomics of Drug Sensitivity in Cancer (GDSC) and Cancer Dependency Map (DepMap) databases to identify biomarkers for PARP inhibitors in ovarian cancer (Figure 1). The IC50 values for the five PARP inhibitors were then calculated and compared between the groups (Figure 2 and Table 1).
Based on BRCA1 mutation status, the IC50 values of all the five PARP inhibitors in the mutant group were significantly lower than those in the wild-type group, with notable differences observed for talazoparib and veliparib (Figure S1). Similarly, IC50 values for all the drugs based on the MLL2 mutation status were significantly lower in the mutant group than in the wild-type group, with significantly low values for olaparib, talazoparib, and veliparib. The IC50 values for all the drugs based on the NF1 mutation status also decreased remarkably in the mutant group, with significantly low values for talazoparib and veliparib. Similarly, SMARCA4 mutations resulted in lower IC50 values than those in the wild-type group for all the drugs, with significant reductions observed for talazoparib and veliparib. In contrast to other candidate genes, SMAD4 mutation status demonstrated higher IC50 values in the mutant group than those in the wild-type group for all the drugs, with significant increases noted for olaparib, talazoparib, and veliparib.
Changes in the IC50 values based on gene mutation status suggest the functional involvement of these genes in regulating sensitivity to PARP inhibitors [19,20,21]. Specifically, our drug sensitivity analysis revealed that ovarian cancer cell lines with mutations in BRCA1, MLL2, NF1, and SMARCA4 exhibited significantly decreased IC50 values for PARP inhibitors, whereas SMAD4 mutant cell lines showed markedly increased IC50 values. Overall, mutations in BRCA1, MLL2, NF1, and SMARCA4 significantly enhance sensitivity to PARP inhibitors in ovarian cancer cell lines, whereas SMAD4 mutations induce resistance. These findings suggest the potential interaction mechanisms between each gene and PARP inhibitors, indicating that SMAD4 may serve as a novel biomarker mediating resistance to PARP inhibitors through synthetic rescue relationships, whereas BRCA1, MLL2, NF1, and SMARCA4 may exhibit synthetic lethal relationships with PARP1.
Our results suggest that, in addition to the well-known BRCA1, PARP1 may also show synthetic lethal relationships with MLL2, NF1, and SMARCA4 [22,23]. These findings are supported by predictions with high combined scores from the SynLethDB database (https://www.synlethdb.com/, accessed on 15 December 2023), reinforcing the reliability of our research results [24]. In particular, the clinical applicability of BRCA1 based on its synthetic lethal relationship with PARP1 is well-established [9]. MLL2, NF1, and SMARCA4 may also affect cell survival through functional or genetic interactions with PARP1 [25,26]. Moreover, based on previous studies suggesting that the synthetic lethal relationships demonstrated in specific cancer types may be effective in other cancers with similar mechanisms [27,28], the synthetic lethal relationship between MLL2 and PARP1 proposed in our study may exhibit similar effects of increased PARP inhibitor sensitivity, not only in ovarian cancer, but also in other cancer types with high MLL2 mutation frequencies [29]. The same drug sensitivity analysis based on the cBioPortal database (https://www.cbioportal.org/) yielded similar results for bladder cancer, which had the highest frequency of MLL2 mutations (Figure S2). This important finding contributes to the expansion of the application range of synthetic lethality-based targeted therapeutic strategies across different cancer types.
Conversely, the consistent increase in the IC50 values of PARP inhibitors owing to SMAD4 mutations implies a potential synthetic rescue association between SMAD4 and PARP1. The DD-type synthetic rescue relationship shows a pattern similar to that of the increased drug resistance with SMAD4 mutations in our study. Therefore, this could be interpreted as a potential DD-type synthetic rescue relationship, which explains the mechanisms of resistance to PARP inhibitors, providing important evidence for predicting therapeutic responses in ovarian cancer and for establishing targeted therapeutic strategies to overcome resistance.
Although these observations were derived from in silico analyses, they provide a rationale for subsequent functional investigations to elucidate the underlying synthetic lethal mechanisms. Nonetheless, the study is limited by statistical power, as the number of SMAD4-mutant cell lines analyzed was substantially smaller than that of wild-type counterparts. Accordingly, the findings should be regarded as exploratory and interpreted with caution.
Analysis of drug sensitivity across 30 cancer types revealed that only four cancer types—esophageal carcinoma, head and neck squamous cell carcinoma, ovarian serous cystadenocarcinoma, and pancreatic adenocarcinoma—had available SMAD4 mutation data; among these, only ovarian cancer showed statistically significant results (Figure S5). This finding may reflect the distinct molecular background of ovarian cancer, which is characterized by a markedly higher prevalence of homologous recombination deficiency than that observed in most other cancer types. Therefore, further research on the cancer-type specificity of SMAD4-mediated PARP inhibitor resistance mechanisms is necessary.

2.2. Survival Analysis of Candidate Genes in Ovarian Cancer

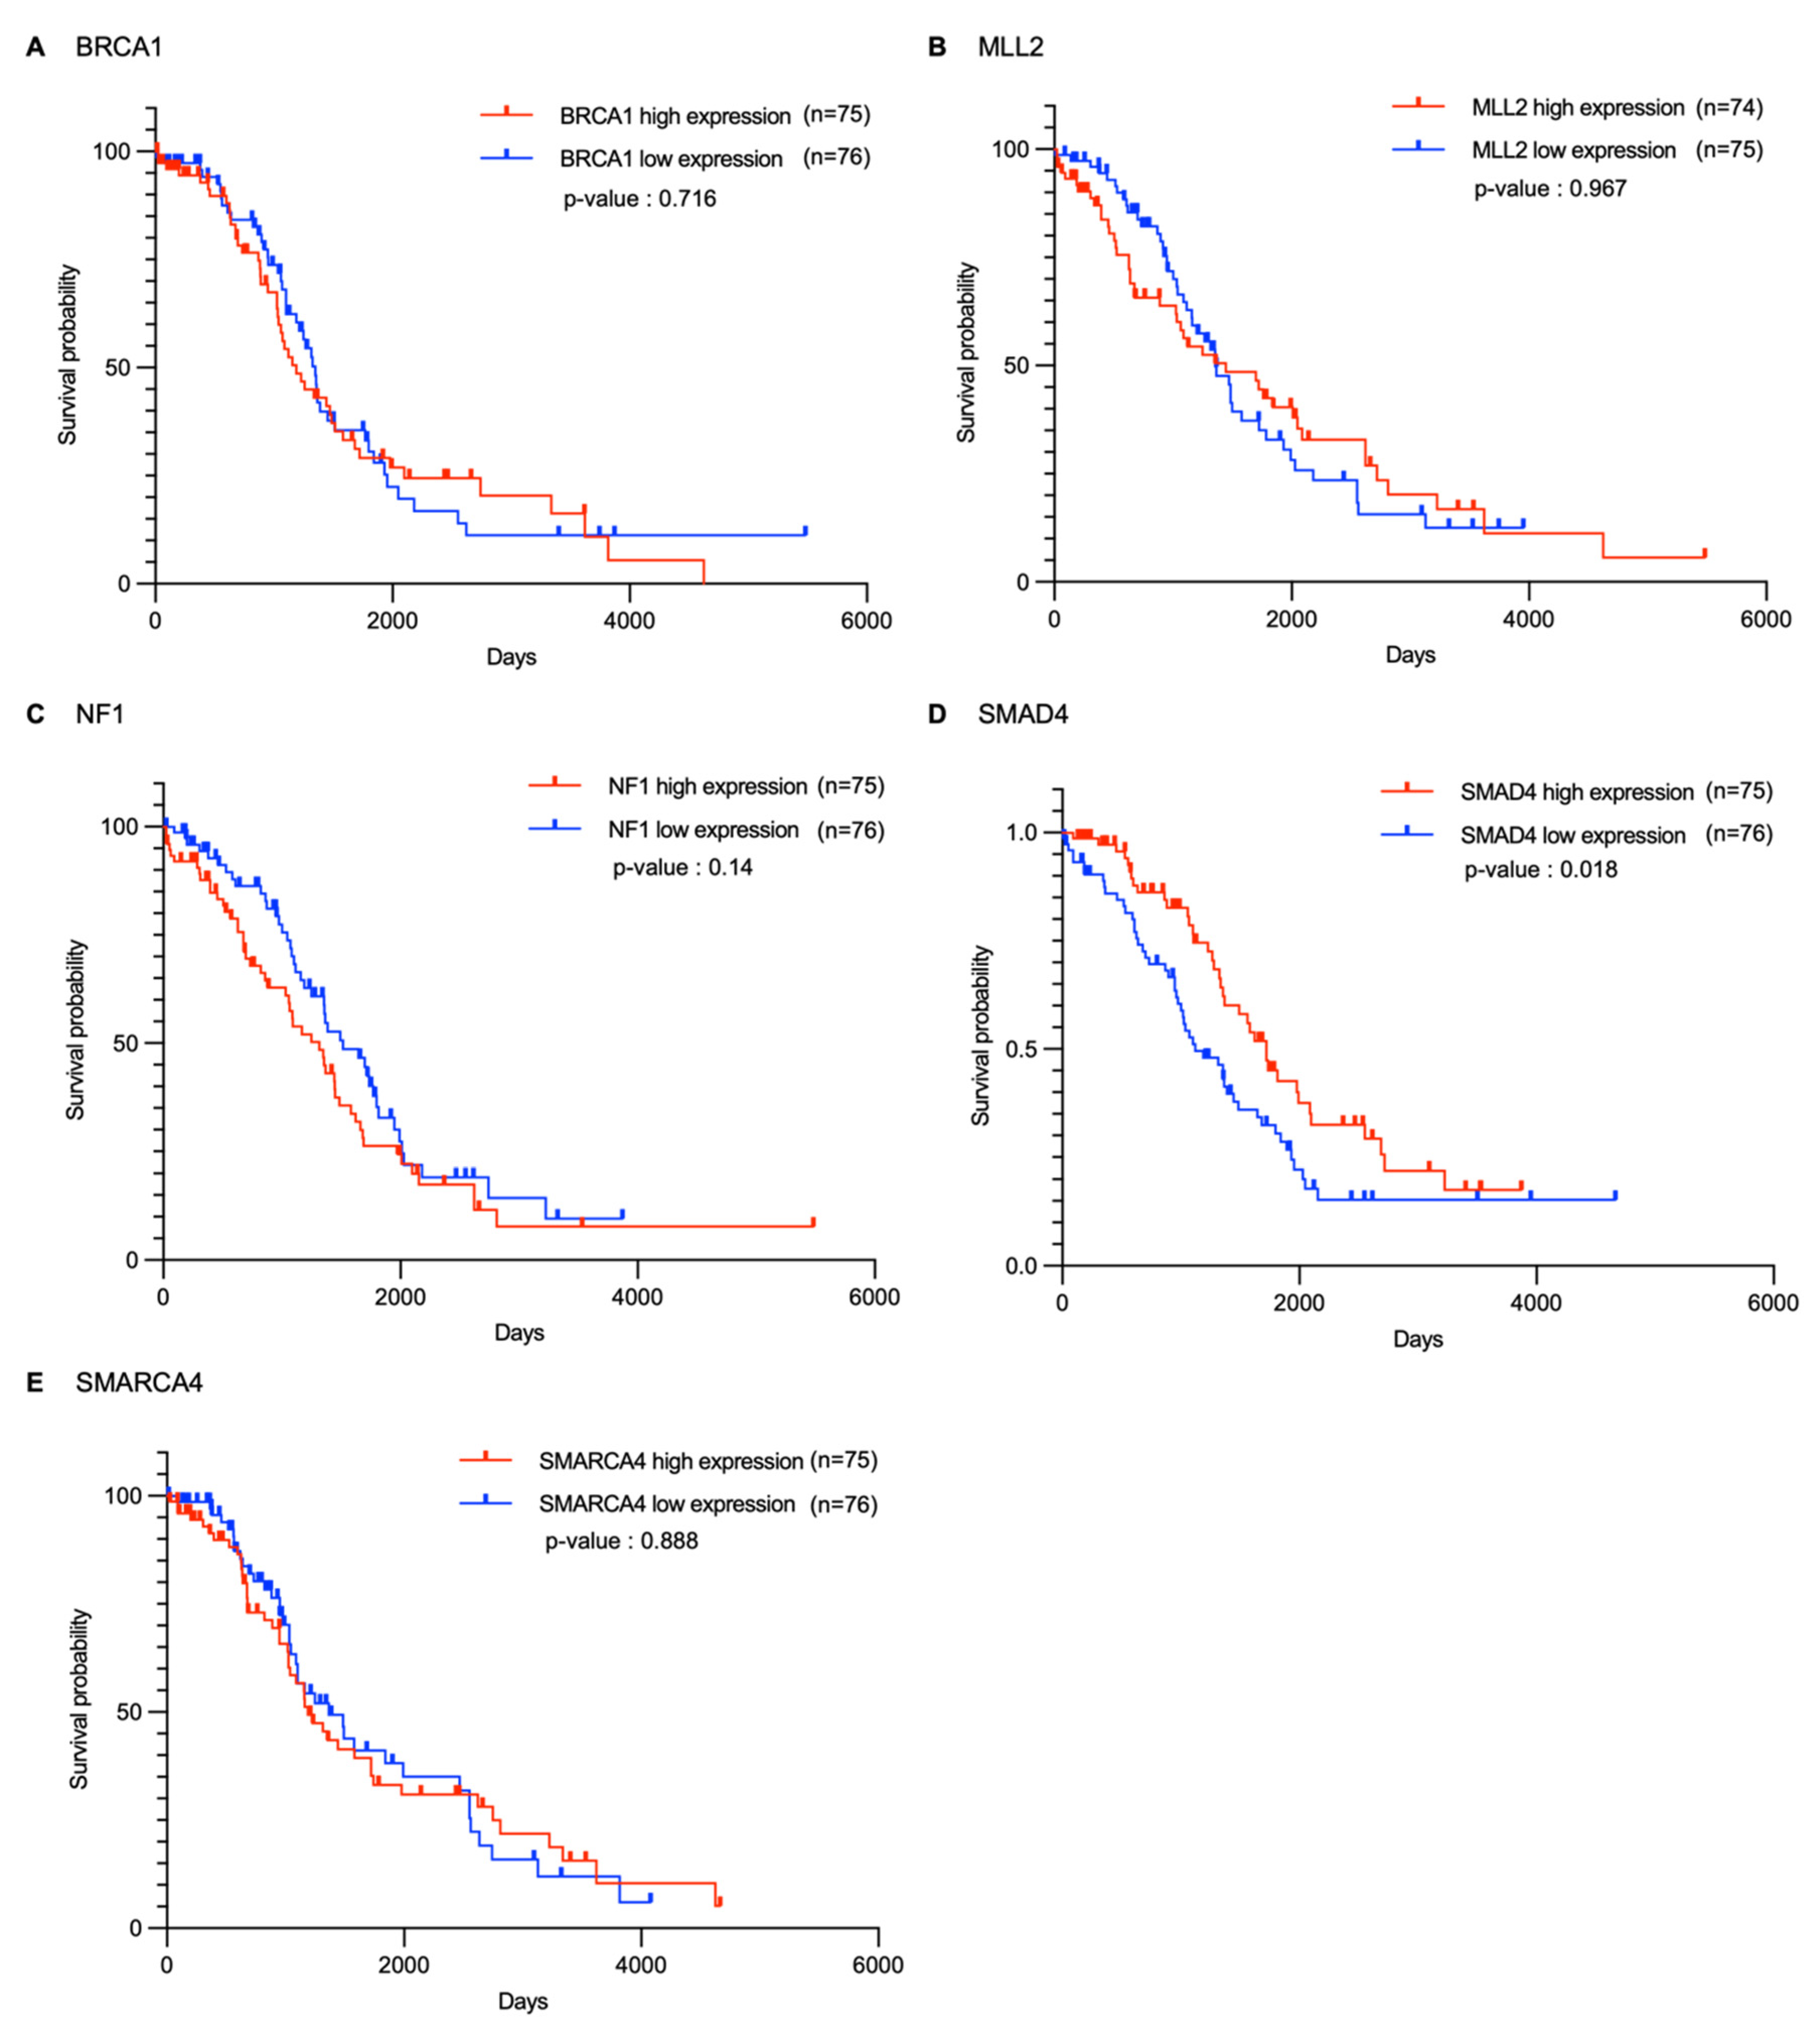
To support the drug sensitivity analysis results, we performed Kaplan–Meier survival analysis to evaluate the impact of BRCA1, MLL2, NF1, SMAD4, and SMARCA4 expression levels on the survival of patients with ovarian cancer and to identify potential associations. The analysis was conducted based on ovarian cancer patient data obtained from The Cancer Genome Atlas (TCGA) database, comparing patient groups with the highest and lowest 20% expression levels for each gene (Figure 3). Survival analysis results were evaluated using the median survival time (MST), log-rank test statistic ( X 2 ), p-value, hazard ratio (HR), and 95% confidence interval (CI) (Table S1).
The analysis revealed that only SMAD4 showed a significant difference in survival rate (p = 0.0182). The MST of the high SMAD4 expression group was 1720 days, which was significantly longer than that of the low SMAD4 expression group, which was 1123 days; an HR of 0.6087 (95% CI: 0.4020–0.9218) was observed for the high expression group compared to that of the low expression group (Figure 3 and Table S1). Therefore, SMAD4 expression levels are closely associated with patient survival, and lower expression levels correspond to a decreased survival probability. Considering the high IC50 values of PARP inhibitors in SMAD4 mutant cell lines observed in drug sensitivity analyses, the survival analysis results support the possibility that SMAD4 can function as a resistance biomarker for PARP inhibitors.
In contrast, no significant differences in survival rates based on expression levels were observed for BRCA1, MLL2, NF1, and SMARCA4. For BRCA1, the MSTs of the high and low expression groups were 1189 and 1348 days, respectively; the low expression group exhibited relatively long survival and HR = 1.079 (95% CI: 0.7153–1.627), indicating no significant difference in risk. Similarly, SMARCA4 showed HR = 1.031 (95% CI: 0.6731–1.578), and NF1 and MLL2 showed p > 0.05, indicating no significant association between expression levels and survival rates.
Based on the survival analysis results, while mutations BRCA1, MLL2, NF1, and SMARCA4 can be associated with drug responsiveness to PARP inhibitors, changes in expression levels alone may not directly affect long-term patient survival. Conversely, SMAD4 showed consistent results in both drug resistance and decreased survival, suggesting its potential as a target biomarker for both prognostic prediction and treatment response. Notably, the low HR of approximately 0.6 in the survival analysis potentially indicates that the expression of a single gene can considerably impact clinical prognosis. Along with the drug sensitivity analysis findings, the survival analysis results confirm that SMAD4 is a biomarker mediating resistance to PARP inhibitors in patients with ovarian cancer and may contribute to decreased patient survival rates. Furthermore, this analysis revealed that SMAD4 expression also serves as a prognostic marker.

2.3. Gene Dependency Score-Based Identification and Functional Analysis of SMAD4-Mediated Resistance

Based on the drug sensitivity and survival analyses results, SMAD4 was identified as a promising candidate biomarker for resistance to PARP inhibitors in ovarian cancer. Therefore, subsequent analyses were performed to identify the potential target genes for overcoming SMAD4-mediated resistance. Here, the term SMAD4-mediated resistance refers to the phenomenon where resistance to PARP inhibitors occurs when SMAD4 expression is reduced or deficient.
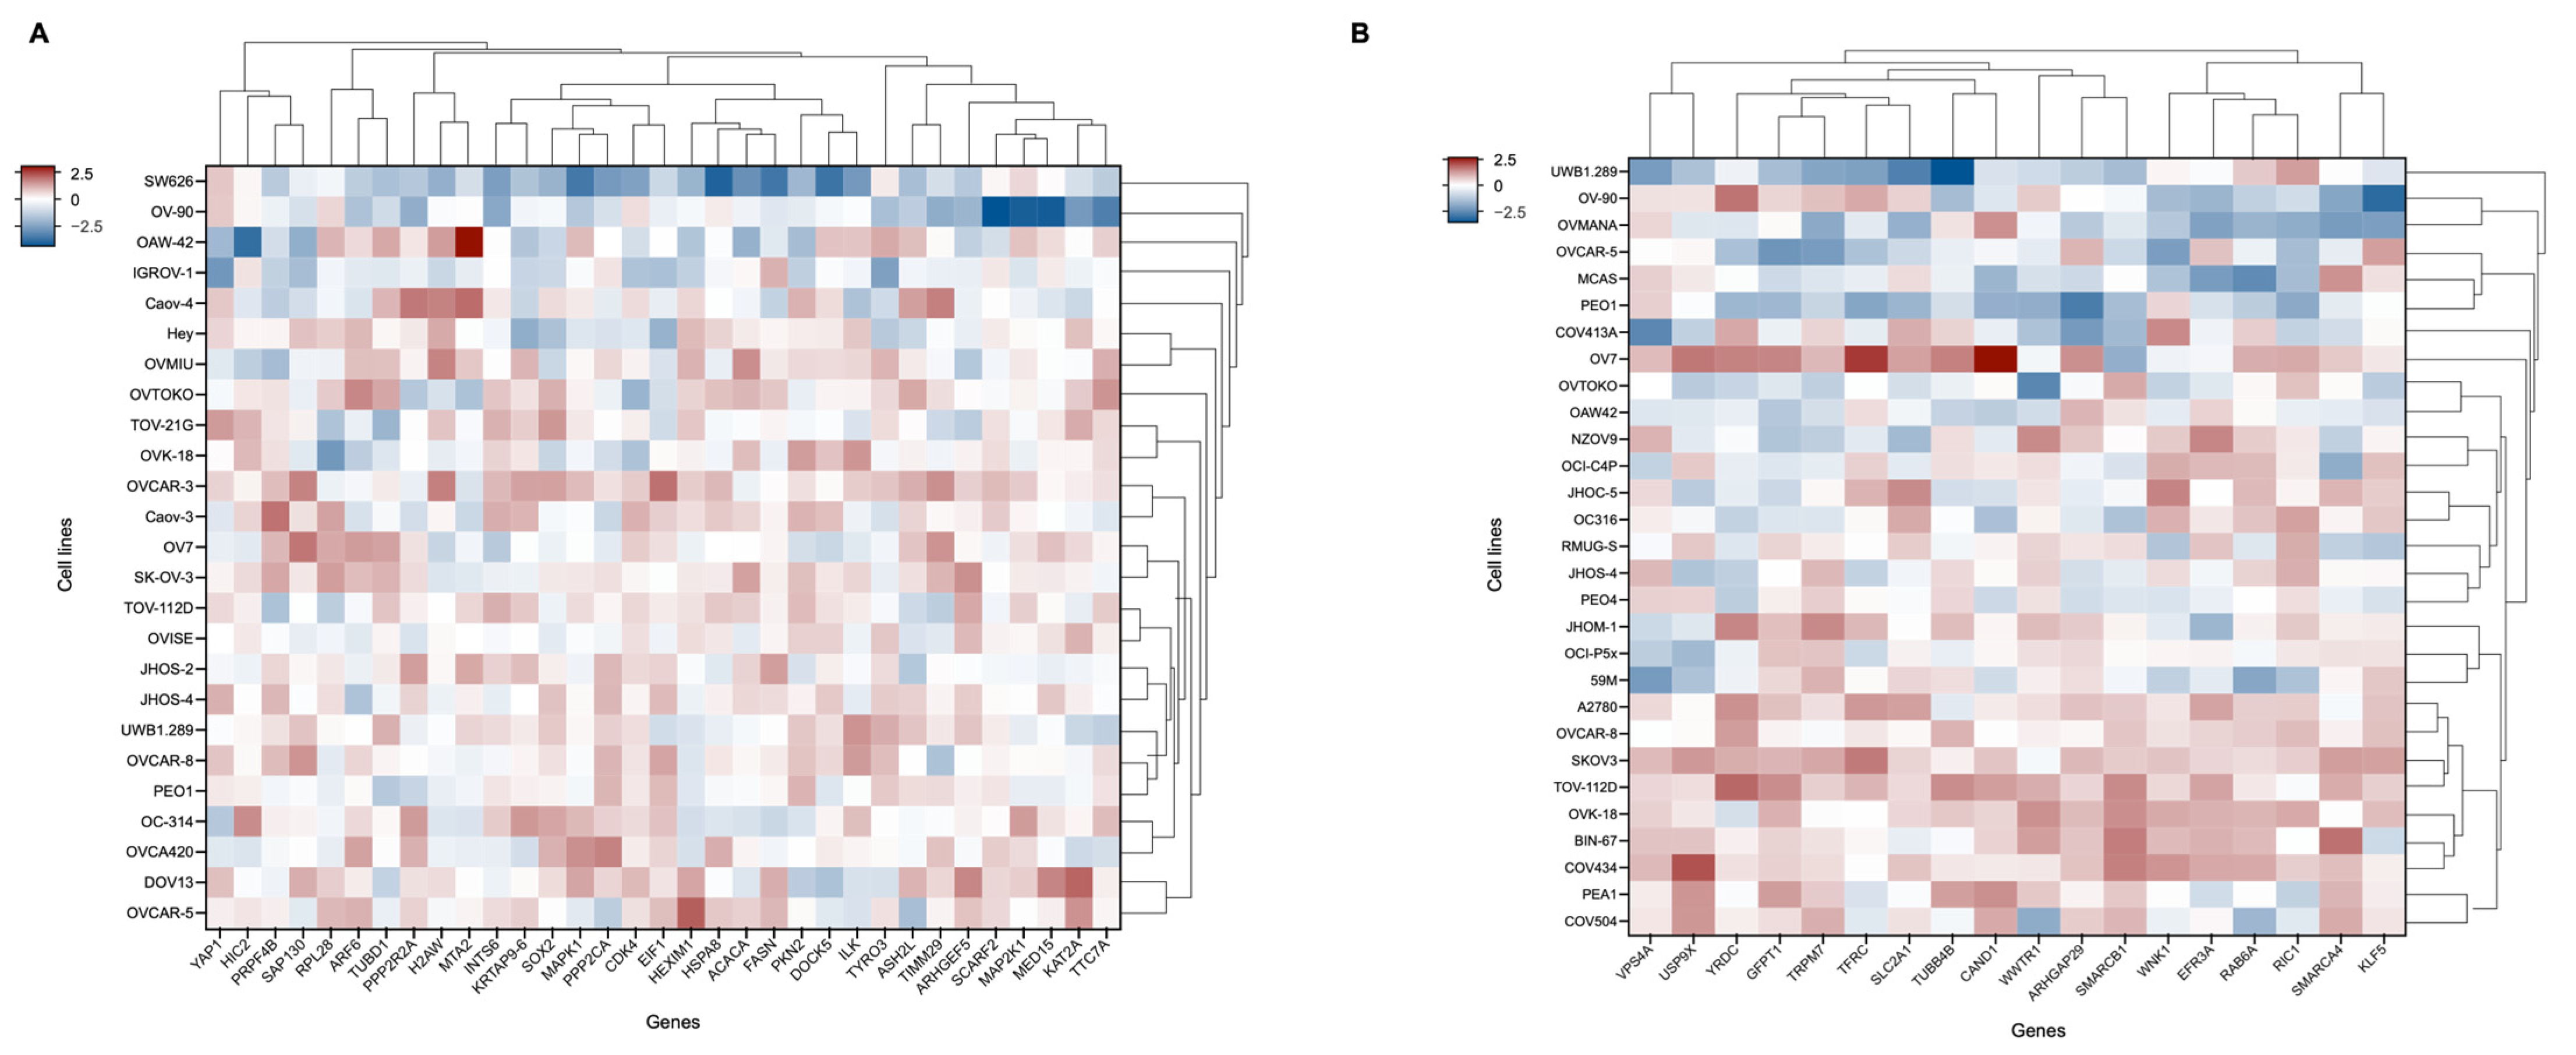
First, 33 ovarian cancer cell lines obtained from the GDSC and DepMap databases were divided into mutant and wild-type groups according to SMAD4 mutation status and simultaneously grouped into high- and low-SMAD4 expression groups, for analysis (Table 2). Subsequently, comparative analysis was conducted using Gene Dependency Score (GDS) data from the DepMap portal for each group [30,31]. Consequently, the following 33 candidate genes were identified based on SMAD4 mutation status: MAPK1, INTS6, TTC7A, MTA2, SOX2, MAP2K1, PPP2R2A, RPL28, TYRO3, KAT2A, ARHGEF5, DOCK5, HSPA8, HIC2, PKN2, SCARF2, MED15, ARF6, CDK4, TIMM29, HEXIM1, YAP1, ASH2L, TUBD1, H2AW, EIF1, PPP2CA, PRPF4B, ACACA, SAP130, KRTAP9-6, ILK, and FASN. In addition, the following 18 candidate genes were selected based on expression levels: SMARCA4, WNK1, RAB6A, VPS4A, GFPT1, ARHGAP29, RIC1, TUBB4B, WWTR1, KLF5, CAND1, TRPM7, SMARCB1, YRDC, TFRC, EFR3A, SLC2A1, and USP9X (Table 3 and Table 4). In total, 51 genes were identified as potential targets based on SMAD4 mutations or expression levels (Figure 4). These genes demonstrated an increased tendency for cancer cell survival in SMAD4 mutant and low SMAD4 expression cell groups compared to those in the control groups and can be proposed as candidates capable of effectively inhibiting cell growth. Furthermore, these genes can act as potential targets for overcoming therapeutic resistance in SMAD4-related ovarian cancer. Therefore, subsequent enrichment analyses were conducted, to elucidate the biological functions and pathways through which these genes are involved in cells and their functional association with SMAD4 [32,33]. Enrichment analyses were performed using Enrichr (https://maayanlab.cloud/Enrichr/, accessed on 15 December 2023) databases and analytical tools, including Gene Ontology (GO) biological processes and pathway analyses [34].
GO biological process analysis was performed on the 33 potential target genes selected based on SMAD4 mutation status (Table 3), to identify their major biological functions. On sorting the results based on the combined scores, these genes were found to be significantly enriched in various biological pathways, including metabolic pathways, stress responses, and intracellular transport (Figure 5A). In total, 468 enriched entries were identified, and notably, “Regulation of Stress-Activated Protein Kinase Signaling Cascade” emerged as a major pathway with the highest combined score of 1705.05, which included MAPK1 and MAP2K1. Other highly ranked biological pathways included “Vascular Endothelial Cell Response to Fluid Shear Stress” (1115.71), “Regulation of Golgi Organization” (812.44), “Regulation of Stress-Activated MAPK Cascade” (778.68), and “T cell Homeostasis” (742.19), along with various pathways related to cellular structure maintenance, immune homeostasis, hormone response, and fatty acid biosynthesis. Subsequently, pathway analysis was performed on these genes, to identify their signaling and metabolic pathways. In total, 140 enriched entries were identified; specifically, among the top-ranked pathways based on combined scores, highly ranked pathways included “Bladder cancer” (528.78), “Endometrial cancer” (327.24), “Long-term depression” (312.19), “Sphingolipid signaling pathway” (239.58), “AMPK signaling pathway” (236.73), and “PI3K-Akt signaling pathway” (134.47). These pathways are known to contribute to cancer cell proliferation, survival, and metabolic adaptation [35]; the PI3K-Akt and AMPK signaling pathways are particularly recognized for their central roles in cancer cell viability and energy metabolism reprogramming [36,37,38]. Additionally, various tumor type-related pathways, such as Melanoma, Pancreatic cancer, Glioma, and Non-small cell lung cancer, as well as key signaling pathways, including Hippo signaling, TGF- β signaling, and mTOR signaling, were significantly enriched (Figure 5B). These results suggest that the candidate genes derived based on SMAD4 mutations are involved in major functional pathways related to tumor signaling network reorganization, microenvironment regulation, and therapeutic resistance.
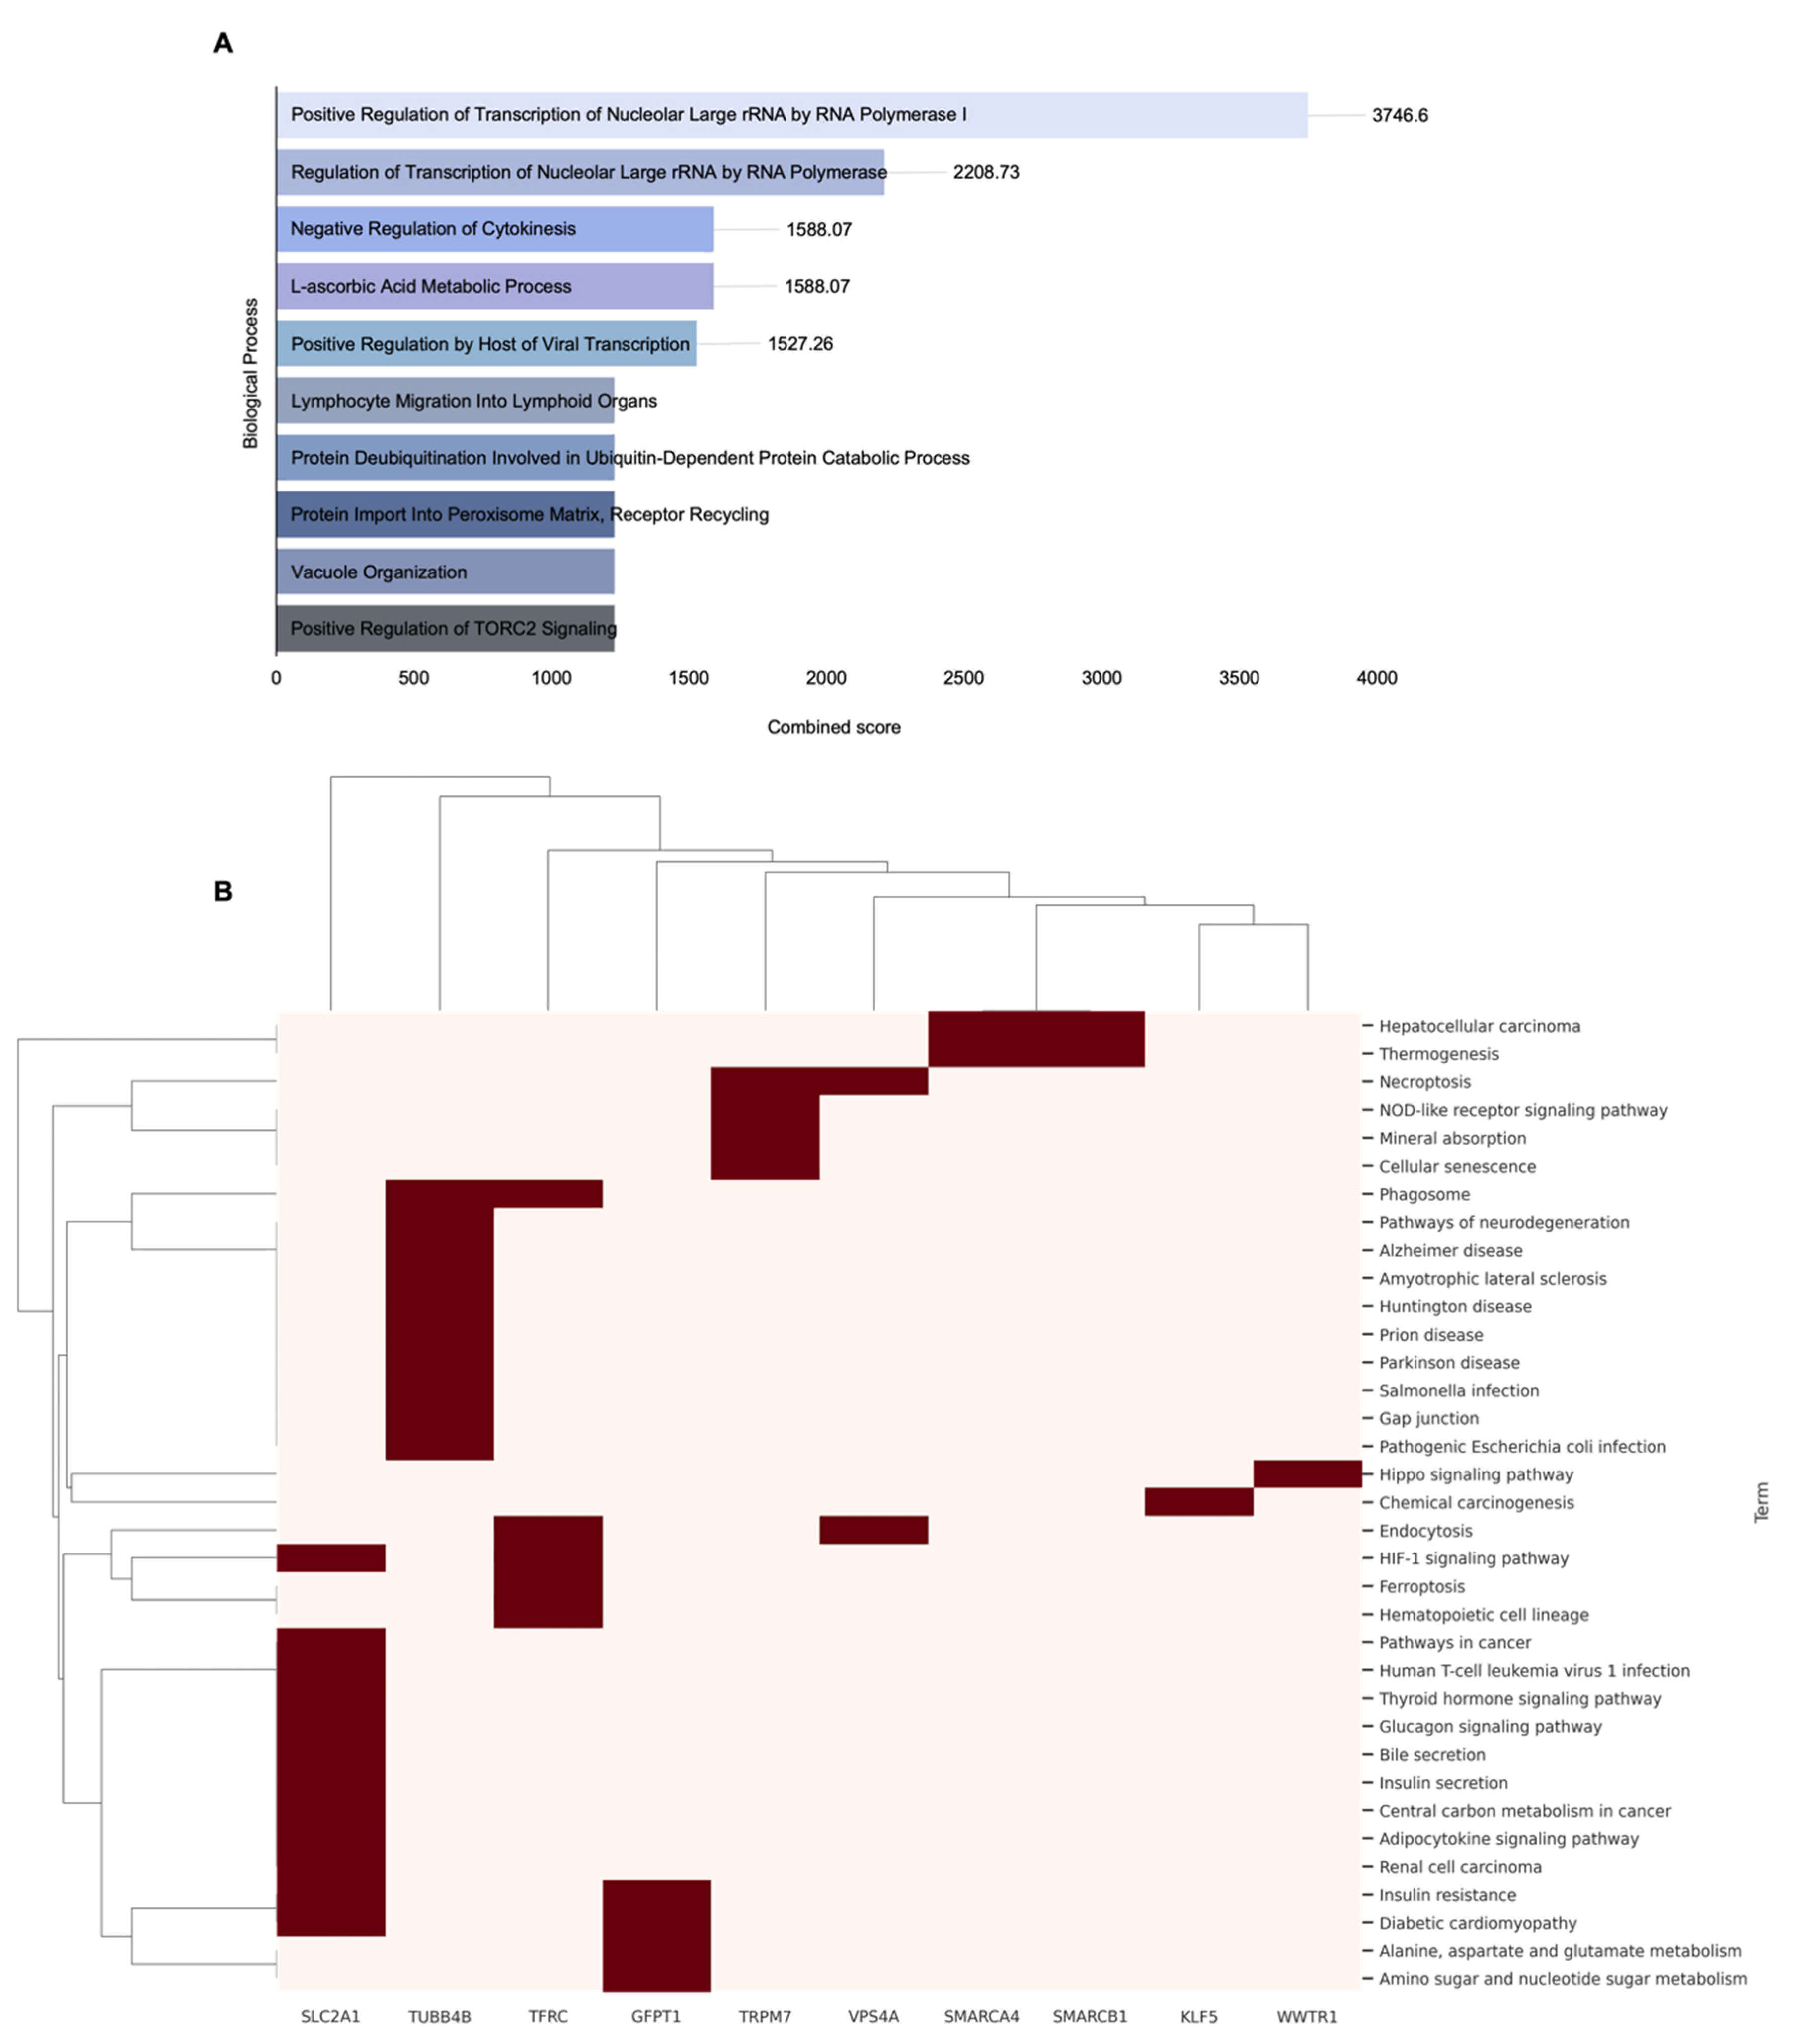
Subsequently, GO biological process analysis was performed on the 18 potential target genes selected based on SMAD4 expression levels (Table 4), to identify their major biological functions. When sorted according to combined scores, these genes showed significant associations, primarily with pathways related to transcriptional regulation, intracellular protein metabolism, immune cell migration, and metabolic response regulation (Figure 6A). In total, 369 enriched entries were identified, and the entry with the highest combined score was “Positive Regulation of Transcription of Nuclear Large rRNA by RNA polymerase I” with a score of 3746.6, including SMARCA4 and SMARCB1. Other highly ranked pathways included “Regulation of Transcription of Nucleolar Large rRNA by RNA Polymerase” (2208.73), “Negative Regulation of Cytokinesis” (1588.07), “L-ascorbic Acid Metabolic Process” (1588.07), and “Lymphocyte Migration into Lymphoid Organs” (1227.64). Entries involving four or more genes included “Regulation of Transcription by RNA Polymerase II” and “Positive Regulation of Transcription by RNA Polymerase II,” suggesting that these genes are involved in transcriptional regulatory functions closely related to cell growth and proliferation. The inclusion of pathways related to rRNA transcriptional regulation and negative regulation of cytokinesis among the top entries suggests that these genes may significantly affect protein synthesis and cell cycle regulation. Subsequently, pathway analysis revealed that these genes were mainly involved in metabolic homeostasis maintenance, apoptosis regulation, and tumor-related signaling pathways (Figure 6B). In total, 35 enriched entries were identified, and in the specific results, the pathway with the highest combined score was “Insulin resistance” with a score of 128.40, which included GFPT1 and SLC2A1. This pathway plays a crucial role in glucose metabolism and energy regulation and contributes to cancer cell adaptation in highly metabolic environments [39]. Additionally, the “HIF-1 signaling pathway” also ranked highly with a combined score of 126.77, including TFRC and SLC2A1. The HIF-1 signaling pathway is closely related to gene expression regulation in hypoxic environments and cancer cell survival strategies [40,41,42]. Other highly ranked pathways included “phagosomes” (79.57), “necroptosis” (74.63), “Hepatocellular carcinoma” (68.98), and “diabetic cardiomyopathy” (52.42), which included genes such as TFRC, TRPM7, VPS4A, SMARCA4, SMARCB1, and VPS4A. These pathways are associated with cancer cell apoptosis regulation, pathological metabolic changes, and tumor progression [43,44]. These results demonstrate that genes derived based on SMAD4 expression levels are extensively involved in cellular transcription regulation, energy metabolism, stress responses, and survival-related signaling pathways. In summary, genes related to SMAD4 expression, through their involvement in various cancer-related biological functions and pathways, can provide important biological clues for elucidating the molecular mechanisms underlying SMAD4-mediated drug resistance.
To elucidate the functional association between SMAD4 and the 51 potential target genes identified based on SMAD4 mutation status and expression levels, protein–protein interaction (PPI) network analysis was performed using the STRING database and analytical tools (https://string-db.org/). Several genes exhibited moderate or stronger interactions, with USP9X (0.971), YAP1 (0.943), WWTR1 (0.875), SOX2 (0.820), and MAPK1 (0.816) recording combined scores of 0.8 or higher, indicating high potential for functional linkage with SMAD4 (Figure 7). USP9X, which showed the highest combined score, is a protein-deubiquitinating enzyme and maintains protein stability by inhibiting the ubiquitination of SMAD4 [45]. Indeed, in colorectal cancer cell models, USP9X expression inhibition decreases SMAD4 protein levels, suggesting that USP9X is essential for SMAD4-mediated tumor suppression [46]. These results confirm that USP9X may also play an important role in regulating SMAD4-mediated resistance in ovarian cancer cells. Additionally, YAP1 and WWTR1, which are core regulatory factors of the Hippo signaling pathway [47], showed high interaction scores of 0.943 and 0.875, respectively. These genes act as transcriptional cofactors that promote cancer cell growth and survival. Although YAP1 showed weak co-expression with SMAD4 in PPI analysis, it notably displayed a positive correlation with ovarian cancer. Furthermore, MAPK1 (0.816) and MAP2K1 (0.695) are major components of the MAPK signaling pathway that intersect with TGF- β signaling, potentially forming indirect functional links with SMAD4. SOX2 (0.820), a transcription factor involved in maintaining pluripotency and regulating cell differentiation [48], suggests the possibility of a functional intersection with SMAD4 in pathways related to targeted therapy resistance and cancer stem cell characteristics. In contrast, SMARCB1 (0.514), CDK4 (0.552), and KLF5 (0.572) showed relatively low combined scores and their functional associations with SMAD4 can be interpreted at a supplementary level. In particular, considering that the expression correlation pattern of SMARCB1 with SMAD4 in ovarian cancer appeared to be positive, the possibility of biological significance cannot be completely ruled out. Overall, these PPI analysis results indicate that multiple genes with direct or indirect functional links to SMAD4 may be associated with PARP inhibitor resistance, and these genes hold potential as novel therapeutic targets for overcoming SMAD4-mediated drug resistance in ovarian cancer.

2.4. Correlation and Survival Analysis of SMAD4-Associated Genes

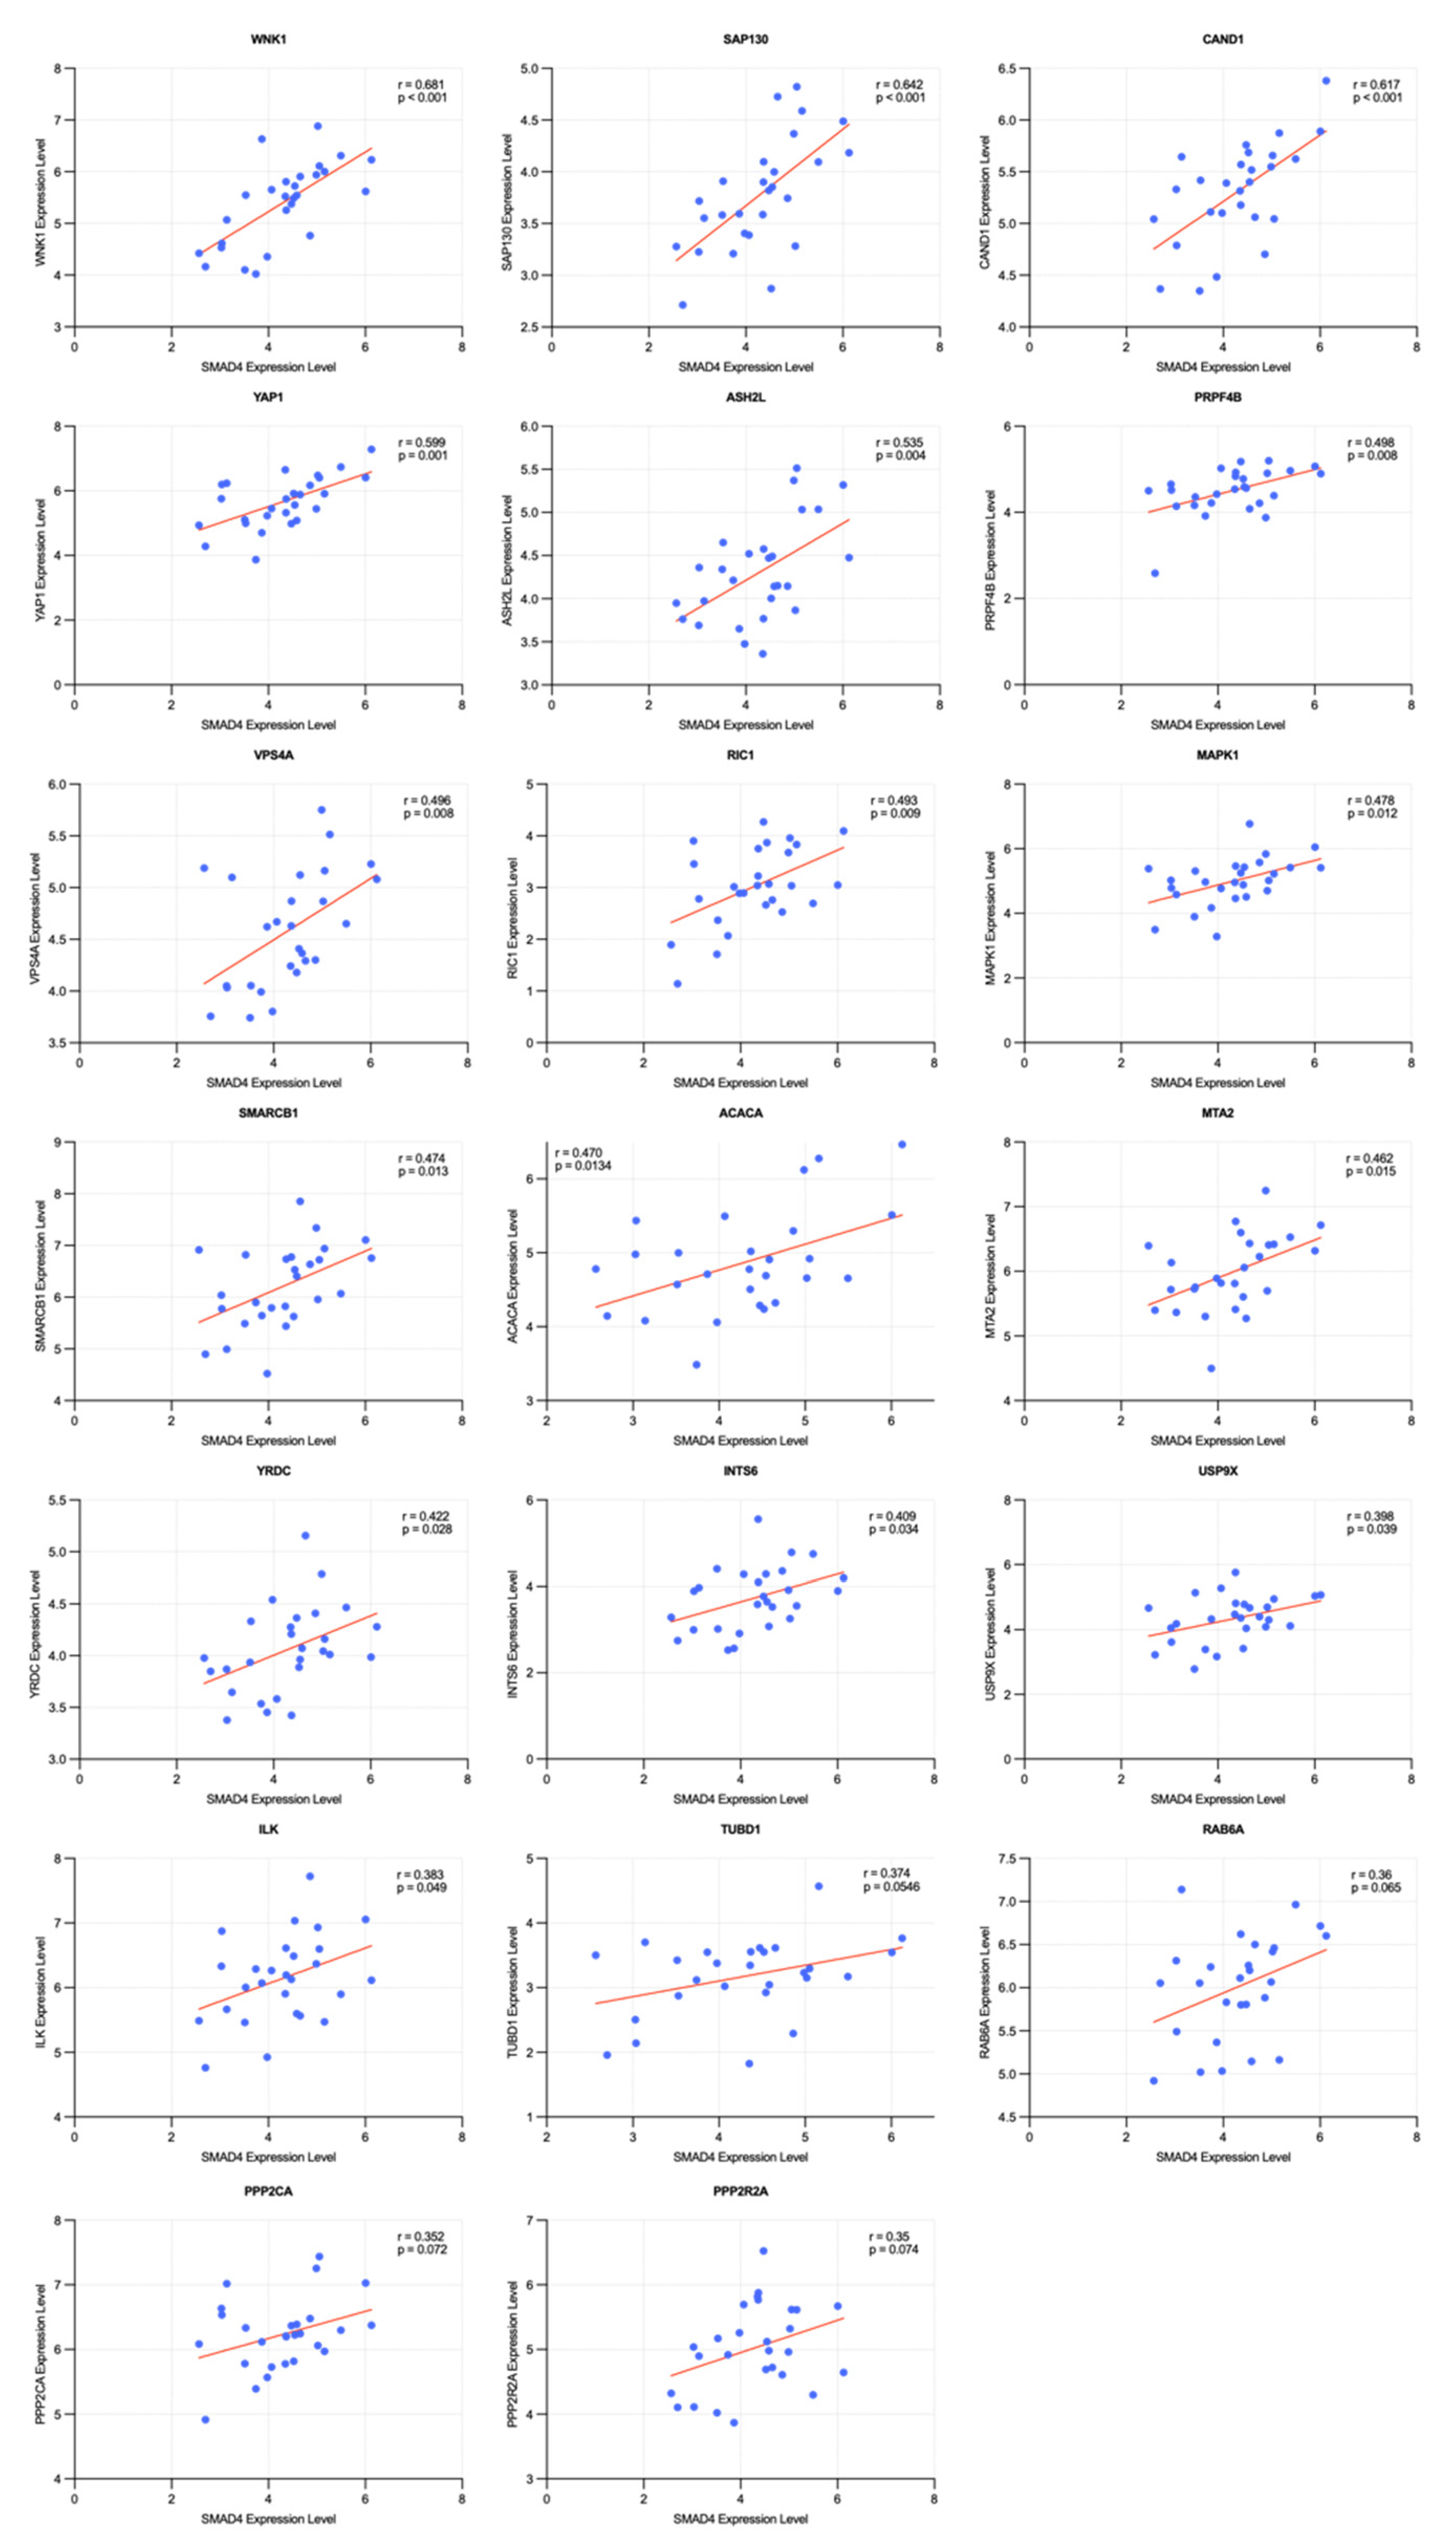
The 51 SMAD4-associated candidate genes identified in previous analyses were confirmed to be involved in various biological pathways and functional mechanisms. To verify their expression associations, Pearson’s correlation coefficient analysis was performed between each candidate gene and SMAD4 in ovarian cancer cell lines (Figure S3). This analysis identified the following 20 genes at a threshold of | r | 0.35, listed in descending order of correlation: WNK1, SAP130, CAND1, YAP1, ASH2L, PRPF4B, VPS4A, RIC1, MAPK1, SMARCB1, ACACA, MTA2, YRDC, INTS6, USP9X, ILK, TUBD1, RAB6A, PPP2CA, and PPP2R2A. All these genes positively correlated with SMAD4 (Figure 8). WNK1 ( r = 0.681), SAP130 ( r = 0.642), and CAND1 ( r = 0.617) showed particularly high correlation coefficients, confirming their close association with SMAD4 expression regulation.
Subsequently, Kaplan–Meier survival analysis and log-rank tests were performed to evaluate the association of these 20 genes with survival rates in patients with ovarian cancer (Figure S4). As the aim of this analysis was to identify genes that could overcome PARP inhibitor resistance in SMAD4 mutant or low expression states, patients with ovarian cancer exhibiting low SMAD4 expression were targeted. The analysis was conducted based on TCGA data by distinguishing patient groups with the highest and lowest 20% expression levels for each candidate gene. Consequently, three genes, ACACA, PRPF4B, and TUBD1, showed significant differences in survival rates (p 0.05) (Figure 9).
PRPF4B exhibited a distinct positive correlation with SMAD4 with a Pearson correlation coefficient of 0.498. According to the survival analysis results, patient groups with low expressions of both SMAD4 and PRPF4B showed significantly lower survival rates than those with high PRPF4B expression. Therefore, the co-expression of these two genes may influence patient prognosis. TUBD1 expression showed a weak positive correlation with SMAD4 expression ( r = 0.374). Similar to PRPF4B, the survival analysis results indicated that patient groups with simultaneously low expression of SMAD4 and TUBD1 tended to have lower survival rates than those in the control group. Therefore, low PRPF4B and TUBD1 expression in ovarian cancer may negatively affect the survival of patients with ovarian cancer having low SMAD4 expression.
Conversely, although ACACA showed a distinct positive correlation with SMAD4, with a Pearson correlation coefficient of 0.470, survival analysis revealed contrasting findings. Within the low SMAD4 expression group, patients with low ACACA expression showed higher survival rates than patients in the comparison group, suggesting that reduced ACACA expression could overcome the low survival rates caused by decreased SMAD4 expression.
Based on a comprehensive evaluation using both Pearson correlation and survival analyses, 20 genes were found to have significant expression associations with SMAD4 in ovarian cancer. Among these, ACACA, PRPF4B, and TUBD1 were identified as potential target genes affecting survival rates, all showing significant positive correlations with SMAD4, indicating a tendency to increase or decrease in expression concordantly with SMAD4 expression levels. Survival analysis revealed that, within the low SMAD4 expression patient group, patients with low expression of both PRPF4B and TUBD1 had significantly lower survival rates than patients with relatively high expression. These results suggest that PRPF4B and TUBD1 may function as negative modifiers, which can decrease survival rates in low SMAD4 expression states. ACACA also showed a positive correlation with SMAD4 and shared expression patterns; however, in the low SMAD4 expression patient group, low ACACA expression tended to significantly improve patient survival rates relative to those with high expression. This suggests that ACACA may aid in overcoming the decreased survival rate caused by low SMAD4 expression.
Therefore, ACACA has potential as a therapeutic target for overcoming SMAD4-mediated resistance to PARP inhibitors. In particular, the prognostic value of SMAD4 expression highlights the clinical relevance of this strategy, as tumors with low SMAD4 expression may benefit from ACACA inhibition as a combinatorial approach. This interpretation is consistent with previous studies that have proposed therapeutic targets based on correlations between gene expression and patient survival, supporting the reliability of the present study interpretations [49,50].

3. Materials and Methods

3.1. Data Acquisition and Target Gene Selection

In this study, we utilized genomic drug sensitivity data to identify biomarkers for PARP inhibitors in ovarian cancer and additional candidate genes which could regulate these biomarkers. Using the ovarian cancer analysis of variance data obtained from the GDSC database (https://www.cancerrxgene.org/, accessed on 15 December 2023), we screened genomic features with p-value 0.05, to identify statistically significant candidate genes [51]. We confirmed that mutations in five candidate genes—BRCA1, MLL2, NF1, SMAD4, and SMARCA4— significantly altered the responses to five PARP inhibitor drugs (niraparib, olaparib, rucaparib, talazoparib, and veliparib). Results with p 0.05 were considered statistically significant (* p 0.05, ** p 0.01, *** p 0.001). Subsequently, we obtained gene mutation data for ovarian cancer cell lines from the DepMap portal (https://depmap.org/portal/, accessed on 15 December 2023); the detailed information is presented in Table 2 [30,31].

3.2. Drug Sensitivity Analysis

IC50 values were used to analyze the differences in sensitivity to PARP inhibitors based on the mutation status of each gene. IC50 is the half-maximal inhibitory concentration of a substance required to inhibit a biological process by 50% and is commonly used in method development for drug discovery [52]. For each of the five candidate genes, the mean and standard deviation of IC50 values for the PARP inhibitors (niraparib, olaparib, rucaparib, talazoparib, and veliparib) were calculated and compared between ovarian cancer cell lines with and without mutations.

3.3. Survival Analysis

Survival analysis was performed using patient survival data for ovarian cancer from TCGA database (https://www.cancer.gov/ccg/research/genome-sequencing/tcga, accessed on 15 December 2023) [53]. The survival data included information regarding the survival status of each patient and duration of survival. The gene expression levels of the patients were categorized for analysis based on the top and bottom 20% of patients with high and low expression, respectively. This top and bottom 20% cutoff was employed to maximize the contrast between groups and to exclude the intermediate range where the possibility of misclassification is high.

3.3.1. Kaplan–Meier Estimator

Kaplan–Meier survival analysis is used for estimating the cumulative survival probability over time. The survival probability for each patient S ( t ) was cumulatively calculated based on the probability of death at a specific time t , and the Kaplan–Meier estimator was defined as follows:
S t = i : t i t 1 d i n i   ,
where t i represents the time of death, d i is the number of patients who died at time point t i , and n i is the number of patients alive at time point t i . The survival probability at each time interval was calculated by multiplying the survival probability at the previous time point with the survival rate at the current time point.

3.3.2. Log-Rank Test

The log-rank test is a survival analysis method testing the null hypothesis that there is no difference in the probability of event occurrence between two groups at all time points [54]. To verify whether the difference between two survival curves was statistically significant, we performed the log-rank test, where the test statistic Q was defined as
Q = i = 1 k O i E i 2 E i ,
where O i is the number of deaths observed in the i -th group and E i is the number of deaths expected in the i -th group based on the overall survival data. The test statistic Q follows a chi-square distribution with 1 degree of freedom ( X 2 ); a p-value 0.05 indicated a significant difference.

3.4. Gene Dependency Score Analysis

The GDS, a quantitative value indicating how essential each gene is for the survival of cancer cells, was obtained from the DepMap portal, and the data were obtained using CRISPR-Cas9 technology [30,31]. GDS is expressed on a scale ranging from −1 to 1. Genes with a GDS close to −1 are considered highly essential for cell viability, while those with scores near 0 have minimal impact. Conversely, genes with a GDS close to 1 are typically associated with growth suppression or tumor suppressor functions.
An independent samples t-test was then conducted to compare GDS values for each gene according to SMAD4 mutation status and expression levels. Consequently, genes showing significant differences were initially screened with p-value 0.05. In the second step, genes with mean GDS values < −0.5 in SMAD4 mutant or low expression cell lines were further filtered as essential genes. This cutoff was applied as the criterion because genes within this range typically indicate essentiality for cell survival. Finally, genes whose mean GDS values in SMAD4 mutant or low expression groups differed by at least 1.5-fold relative to their counterparts were selected through final screening, to identify potential targets influencing ovarian cancer cell viability.

3.5. Enrichment and Functional Analysis

3.5.1. Gene Ontology Biological Process Analysis and Pathway Analysis

Enrichment analysis evaluates whether a set of genes of interest is significantly enriched for specific biological functions or pathways [32]. In this study, we performed GO biological process analysis based on the GO Biological Process 2025 gene set library and pathway analysis was performed using the Enrichr platform (https://maayanlab.cloud/Enrichr/, accessed on 15 December 2023) provided by the Ma’ayan Laboratory, based on the Kyoto Encyclopedia of Genes and Genomes (KEGG) 2021 pathway database [55,56]. Enrichr is a web-based tool that integrates various biological databases to analyze the enrichment of gene sets and provides prioritization through a combined score for each entry [57]. The formula for calculating the combined score is as follows:
c = log p · z   ,
where c is the combined score, p is the p-value calculated using Fisher’s exact test, and z is the z-score calculated by evaluating the deviation from the expected ranking. Fisher’s exact test is a proportion test that assumes a binomial distribution and independence regarding the probability of any gene belonging to a particular set [57].
Researchers use various cutoffs for the combined score to evaluate the significance of gene set/functional enrichment findings in Enrichr. Generally, entries are identified by sorting the combined score in descending order after applying an adjusted p-value cutoff of 0.05–0.1 [58]. Similar criteria were used to sort the gene enrichment analysis results in this study.

3.5.2. Hierarchical Clustering and Visualization

To visualize the functional similarities of the candidate genes, the results of GO biological process analysis are presented as bar graphs based on combined scores, and the results of pathway analysis are visualized as cluster maps combining heatmaps and dendrograms. To create cluster maps, we first constructed a binary matrix by extracting information regarding each biological pathway entry and the genes included in the respective pathways from the pathway analysis results. Subsequently, distances (similarities) between rows and columns were calculated based on the Euclidean distance, followed by hierarchical clustering using the average linkage method and visualization. This process was implemented in Python (version 3.10.0) using the SciPy (version 1.10.1) and Seaborn (version 0.12.2) libraries.

3.5.3. Protein–Protein Interaction Network Analysis

To identify genes that could be functionally associated with SMAD4, a PPI network analysis was performed on selected candidate genes. The database and analytical tools provided by STRING (https://string-db.org/, accessed on 15 December 2023) were used to conduct an analysis based on the reported physical and functional interaction information in humans (Homo sapiens) [59]. STRING collects interaction information from various sources, including co-expression data, experimental results, curated databases such as KEGG or Reactome, and literature-based text mining, and provides a combined confidence score for each interaction. In this analysis, the significance of the interactions was determined based on the combined score, which assigned higher values when multiple types of evidence simultaneously supported the interaction [60].

3.6. Correlation Analysis

To evaluate the expression correlation between SMAD4 and 51 potential candidate genes, Pearson correlation coefficient analysis was performed using gene expression data from the DepMap portal. Correlation between the expression values of each gene and SMAD4 was calculated using Pearson’s correlation coefficient, defined as follows:
r = X i X ¯ Y i Y ¯ X i X ¯ 2 · Y i Y ¯ 2 ,
where X i and Y i represent the expression levels of SMAD4 and the target gene, respectively, and X ¯ and Y ¯ indicate the mean expression levels of each gene. According to the absolute value criteria for the Pearson correlation coefficient, while interpretations may vary, generally 0 < | r | 0.2 indicates a very weak correlation, 0.2 < | r | 0.4 indicates a weak correlation, 0.4 < | r | 0.65 indicates a moderate correlation, 0.65 < | r | 0.85 indicates a strong correlation, and 0.85 < | r | 1 indicates a very strong correlation. Based on these criteria, genes with | r | 0.35 were considered to have a significant correlation, and this threshold was used for initial screening to select candidate genes for survival analysis.

4. Conclusions

In the present study, we identified biomarkers for PARP inhibitor sensitivity and resistance in ovarian cancer through genomic drug sensitivity data and biological big data analysis (Figure 1). Drug sensitivity analysis using GDSC data revealed that BRCA1, MLL2, NF1, and SMARCA4 mutations enhance sensitivity to PARP inhibitors, suggesting synthetic lethal relationships with PARP1 and their potential as predictive biomarkers. Conversely, SMAD4 mutations increased resistance to PARP inhibitors in ovarian cancer cell lines, and survival analysis using TCGA data confirmed that patients with low SMAD4 expression exhibit significantly poor survival rates. These findings highlight SMAD4 as a major biomarker, potentially involving a DD-type synthetic rescue relationship with PARP1. However, the approach adopted in this study has not been experimentally validated and will require targeted in vitro/in vivo functional studies.
Through GDS analysis of DepMap data, we identified 51 potential target genes related to SMAD4-mediated resistance. Enrichment analysis revealed their involvement in cellular stress responses, lipid biosynthesis, PI3K–Akt and MAPK signaling, transcriptional regulation, and energy metabolism. PPI network analysis confirmed strong functional associations between SMAD4 and USP9X, YAP1, and MAPK1. Gene expression correlation and survival analysis identified three genes—ACACA, PRPF4B, and TUBD1—as significantly influencing survival rates. Notably, decreased ACACA expression in patients with low SMAD4 expression was associated with improved survival, suggesting its potential for overcoming SMAD4-mediated PARP inhibitor resistance. In this study, the clinical application of SMAD4 as a biomarker of resistance to PARP inhibitors is possibly specific to ovarian cancer.
This study also has certain limitations, as it relies on computational predictions derived from multiple datasets and does not incorporate direct functional validation. Moreover, the cell line and TCGA data analyzed here may not fully capture the complexity of individual patient responses to treatment.
Taken together, these findings contribute to personalized treatment strategies by providing biomarkers for predicting PARP inhibitor efficacy and identifying potential targets for overcoming resistance in patients with ovarian cancer, while underscoring the need for further experimental and clinical validation.

Supplementary Materials

The supporting information can be downloaded at https://www.mdpi.com/article/10.3390/ijms26199530/s1.

Author Contributions

J.Y.R. and Y.S. conceived the study and analyzed the results. Y.S. analyzed the data and wrote the manuscript. All authors have read and agreed to the published version of the manuscript.

Funding

This study was funded by the National Research Foundation of Korea (NRF) grant funded by the Korean Government (MSIT) (Grant number RS-2023-00240248).

Institutional Review Board Statement

Not applicable.

Informed Consent Statement

Not applicable.

Data Availability Statement

The datasets used and/or analyzed during the current study are available from the corresponding author on reasonable request.

Conflicts of Interest

The authors declare no conflicts of interest.

Abbreviations

The following abbreviations are used in this manuscript:
CIConfidence Interval
DepMapCancer Dependency Map
FDAFood and Drug Administration
GDSCThe Genomics of Drug Sensitivity in Cancer
GOGene Ontology
HRHazard Ratio
HRDHomologous Recombination Deficiency
PARPPoly (ADP-ribose) polymerase
KEGGKyoto Encyclopedia of Genes and Genomes
MSTMedian Survival Time
PPIProtein–Protein Interaction
TCGAThe Cancer Genome Atlas

References

  1. Reid, B.M.; Permuth, J.B.; Sellers, T.A. Epidemiology of ovarian cancer: A review. Cancer Biol. Med. 2017, 14, 9–32. [Google Scholar] [CrossRef]
  2. Jones, P.M.; Drapkin, R. Modeling High-Grade Serous Carcinoma: How Converging Insights into Pathogenesis and Genetics are Driving Better Experimental Platforms. Front. Oncol. 2013, 3, 217. [Google Scholar] [CrossRef]
  3. Gloeckler Ries, L.A.; Reichman, M.E.; Lewis, D.R.; Hankey, B.F.; Edwards, B.K. Cancer survival and incidence from the Surveillance, Epidemiology, and End Results (SEER) program. Oncologist 2003, 8, 541–552. [Google Scholar] [CrossRef]
  4. Chen, G.M.; Kannan, L.; Geistlinger, L.; Kofia, V.; Safikhani, Z.; Gendoo, D.M.A.; Parmigiani, G.; Birrer, M.; Haibe-Kains, B.; Waldron, L. Consensus on Molecular Subtypes of High-Grade Serous Ovarian Carcinoma. Clin. Cancer Res. 2018, 24, 5037–5047. [Google Scholar] [CrossRef]
  5. Stewart, M.D.; Merino Vega, D.; Arend, R.C.; Baden, J.F.; Barbash, O.; Beaubier, N.; Collins, G.; French, T.; Ghahramani, N.; Hinson, P.; et al. Homologous Recombination Deficiency: Concepts, Definitions, and Assays. Oncologist 2022, 27, 167–174. [Google Scholar] [CrossRef] [PubMed]
  6. Hoppe, M.M.; Sundar, R.; Tan, D.S.P.; Jeyasekharan, A.D. Biomarkers for Homologous Recombination Deficiency in Cancer. J. Natl. Cancer Inst. 2018, 110, 704–713. [Google Scholar] [CrossRef] [PubMed]
  7. Cortesi, L.; Rugo, H.S.; Jackisch, C. An Overview of PARP Inhibitors for the Treatment of Breast Cancer. Target. Oncol. 2021, 16, 255–282. [Google Scholar] [CrossRef] [PubMed]
  8. Bryant, H.E.; Schultz, N.; Thomas, H.D.; Parker, K.M.; Flower, D.; Lopez, E.; Kyle, S.; Meuth, M.; Curtin, N.J.; Helleday, T. Specific killing of BRCA2-deficient tumours with inhibitors of poly(ADP-ribose) polymerase. Nature 2005, 434, 913–917. [Google Scholar] [CrossRef]
  9. Farmer, H.; McCabe, N.; Lord, C.J.; Tutt, A.N.; Johnson, D.A.; Richardson, T.B.; Santarosa, M.; Dillon, K.J.; Hickson, I.; Knights, C.; et al. Targeting the DNA repair defect in BRCA mutant cells as a therapeutic strategy. Nature 2005, 434, 917–921. [Google Scholar] [CrossRef]
  10. Huang, A.; Garraway, L.A.; Ashworth, A.; Weber, B. Synthetic lethality as an engine for cancer drug target discovery. Nat. Rev. Drug Discov. 2020, 19, 23–38. [Google Scholar] [CrossRef]
  11. Hartwell, L.H.; Szankasi, P.; Roberts, C.J.; Murray, A.W.; Friend, S.H. Integrating genetic approaches into the discovery of anticancer drugs. Science 1997, 278, 1064–1068. [Google Scholar] [CrossRef] [PubMed]
  12. Li, S.; Topatana, W.; Juengpanich, S.; Cao, J.; Hu, J.; Zhang, B.; Ma, D.; Cai, X.; Chen, M. Development of synthetic lethality in cancer: Molecular and cellular classification. Signal Transduct. Target. Ther. 2020, 5, 241. [Google Scholar] [CrossRef] [PubMed]
  13. Daly, G.R.; AlRawashdeh, M.M.; McGrath, J.; Dowling, G.P.; Cox, L.; Naidoo, S.; Vareslija, D.; Hill, A.D.K.; Young, L. PARP Inhibitors in Breast Cancer: A Short Communication. Curr. Oncol. Rep. 2024, 26, 103–113. [Google Scholar] [CrossRef] [PubMed]
  14. Teyssonneau, D.; Margot, H.; Cabart, M.; Anonnay, M.; Sargos, P.; Vuong, N.S.; Soubeyran, I.; Sevenet, N.; Roubaud, G. Prostate cancer and PARP inhibitors: Progress and challenges. J. Hematol. Oncol. 2021, 14, 51. [Google Scholar] [CrossRef]
  15. Burger, R.A.; Brady, M.F.; Bookman, M.A.; Fleming, G.F.; Monk, B.J.; Huang, H.; Mannel, R.S.; Homesley, H.D.; Fowler, J.; Greer, B.E.; et al. Incorporation of bevacizumab in the primary treatment of ovarian cancer. N. Engl. J. Med. 2011, 365, 2473–2483. [Google Scholar] [CrossRef]
  16. Johnson, N.; Johnson, S.F.; Yao, W.; Li, Y.C.; Choi, Y.E.; Bernhardy, A.J.; Wang, Y.; Capelletti, M.; Sarosiek, K.A.; Moreau, L.A.; et al. Stabilization of mutant BRCA1 protein confers PARP inhibitor and platinum resistance. Proc. Natl. Acad. Sci. USA 2013, 110, 17041–17046. [Google Scholar] [CrossRef]
  17. Sahu, A.D.; Lee, J.S.; Wang, Z.; Zhang, G.; Iglesias-Bartolome, R.; Tian, T.; Wei, Z.; Miao, B.; Nair, N.U.; Ponomarova, O.; et al. Genome-wide prediction of synthetic rescue mediators of resistance to targeted and immunotherapy. Mol. Syst. Biol. 2019, 15, e8323. [Google Scholar] [CrossRef]
  18. Schaffer, A.A.; Chung, Y.; Kammula, A.V.; Ruppin, E.; Lee, J.S. A systematic analysis of the landscape of synthetic lethality-driven precision oncology. Med 2024, 5, 73–89.e9. [Google Scholar] [CrossRef]
  19. Sahu, D.; Shi, J.; Segura Rueda, I.A.; Chatrath, A.; Dutta, A. Development of a polygenic score predicting drug resistance and patient outcome in breast cancer. NPJ Precis. Oncol. 2024, 8, 219. [Google Scholar] [CrossRef]
  20. Levatic, J.; Salvadores, M.; Fuster-Tormo, F.; Supek, F. Mutational signatures are markers of drug sensitivity of cancer cells. Nat. Commun. 2022, 13, 2926. [Google Scholar] [CrossRef]
  21. Garnett, M.J.; Edelman, E.J.; Heidorn, S.J.; Greenman, C.D.; Dastur, A.; Lau, K.W.; Greninger, P.; Thompson, I.R.; Luo, X.; Soares, J.; et al. Systematic identification of genomic markers of drug sensitivity in cancer cells. Nature 2012, 483, 570–575. [Google Scholar] [CrossRef] [PubMed]
  22. Hu, Y.; Guo, M. Synthetic lethality strategies: Beyond BRCA1/2 mutations in pancreatic cancer. Cancer Sci. 2020, 111, 3111–3121. [Google Scholar] [CrossRef] [PubMed]
  23. Tsujino, T.; Takai, T.; Hinohara, K.; Gui, F.; Tsutsumi, T.; Bai, X.; Miao, C.; Feng, C.; Gui, B.; Sztupinszki, Z.; et al. CRISPR screens reveal genetic determinants of PARP inhibitor sensitivity and resistance in prostate cancer. Nat. Commun. 2023, 14, 252. [Google Scholar] [CrossRef] [PubMed]
  24. Wang, J.; Wu, M.; Huang, X.; Wang, L.; Zhang, S.; Liu, H.; Zheng, J. SynLethDB 2.0: A web-based knowledge graph database on synthetic lethality for novel anticancer drug discovery. Database 2022, 2022, baac030. [Google Scholar] [CrossRef]
  25. Chang, A.; Liu, L.; Ashby, J.M.; Wu, D.; Chen, Y.; O’Neill, S.S.; Huang, S.; Wang, J.; Wang, G.; Cheng, D.; et al. Recruitment of KMT2C/MLL3 to DNA Damage Sites Mediates DNA Damage Responses and Regulates PARP Inhibitor Sensitivity in Cancer. Cancer Res. 2021, 81, 3358–3373. [Google Scholar] [CrossRef]
  26. Yano, K.; Kato, M.; Endo, S.; Igarashi, T.; Wada, R.; Kohno, T.; Zimmermann, A.; Dahmen, H.; Zenke, F.T.; Shiotani, B. PARP inhibition-associated heterochromatin confers increased DNA replication stress and vulnerability to ATR inhibition in SMARCA4-deficient cells. Cell Death Discov. 2025, 11, 31. [Google Scholar] [CrossRef]
  27. Lee, J.S.; Nair, N.U.; Dinstag, G.; Chapman, L.; Chung, Y.; Wang, K.; Sinha, S.; Cha, H.; Kim, D.; Schperberg, A.V.; et al. Synthetic lethality-mediated precision oncology via the tumor transcriptome. Cell 2021, 184, 2487–2502 e2413. [Google Scholar] [CrossRef]
  28. Han, D.J.; Kim, S.; Lee, S.Y.; Moon, Y.; Kang, S.J.; Yoo, J.; Jeong, H.Y.; Cho, H.J.; Jeon, J.Y.; Sim, B.C.; et al. Evolutionary dependency of cancer mutations in gene pairs inferred by nonsynonymous-synonymous mutation ratios. Genome Med. 2024, 16, 103. [Google Scholar] [CrossRef]
  29. Arildsen, N.S.; Jonsson, J.M.; Bartuma, K.; Ebbesson, A.; Westbom-Fremer, S.; Masback, A.; Malander, S.; Nilbert, M.; Hedenfalk, I.A. Involvement of Chromatin Remodeling Genes and the Rho GTPases RhoB and CDC42 in Ovarian Clear Cell Carcinoma. Front. Oncol. 2017, 7, 109. [Google Scholar] [CrossRef]
  30. Krill-Burger, J.M.; Dempster, J.M.; Borah, A.A.; Paolella, B.R.; Root, D.E.; Golub, T.R.; Boehm, J.S.; Hahn, W.C.; McFarland, J.M.; Vazquez, F.; et al. Partial gene suppression improves identification of cancer vulnerabilities when CRISPR-Cas9 knockout is pan-lethal. Genome Biol. 2023, 24, 192. [Google Scholar] [CrossRef]
  31. Meyers, R.M.; Bryan, J.G.; McFarland, J.M.; Weir, B.A.; Sizemore, A.E.; Xu, H.; Dharia, N.V.; Montgomery, P.G.; Cowley, G.S.; Pantel, S.; et al. Computational correction of copy number effect improves specificity of CRISPR-Cas9 essentiality screens in cancer cells. Nat. Genet. 2017, 49, 1779–1784. [Google Scholar] [CrossRef] [PubMed]
  32. Subramanian, A.; Tamayo, P.; Mootha, V.K.; Mukherjee, S.; Ebert, B.L.; Gillette, M.A.; Paulovich, A.; Pomeroy, S.L.; Golub, T.R.; Lander, E.S.; et al. Gene set enrichment analysis: A knowledge-based approach for interpreting genome-wide expression profiles. Proc. Natl. Acad. Sci. USA 2005, 102, 15545–15550. [Google Scholar] [CrossRef] [PubMed]
  33. Hung, J.H.; Yang, T.H.; Hu, Z.; Weng, Z.; DeLisi, C. Gene set enrichment analysis: Performance evaluation and usage guidelines. Brief. Bioinform. 2012, 13, 281–291. [Google Scholar] [CrossRef] [PubMed]
  34. Kuleshov, M.V.; Jones, M.R.; Rouillard, A.D.; Fernandez, N.F.; Duan, Q.; Wang, Z.; Koplev, S.; Jenkins, S.L.; Jagodnik, K.M.; Lachmann, A.; et al. Enrichr: A comprehensive gene set enrichment analysis web server 2016 update. Nucleic Acids Res. 2016, 44, W90–W97. [Google Scholar] [CrossRef]
  35. Ogretmen, B.; Hannun, Y.A. Biologically active sphingolipids in cancer pathogenesis and treatment. Nat. Rev. Cancer 2004, 4, 604–616. [Google Scholar] [CrossRef]
  36. Fresno Vara, J.A.; Casado, E.; de Castro, J.; Cejas, P.; Belda-Iniesta, C.; Gonzalez-Baron, M. PI3K/Akt signalling pathway and cancer. Cancer Treat. Rev. 2004, 30, 193–204. [Google Scholar] [CrossRef]
  37. Yuan, J.; Dong, X.; Yap, J.; Hu, J. The MAPK and AMPK signalings: Interplay and implication in targeted cancer therapy. J. Hematol. Oncol. 2020, 13, 113. [Google Scholar] [CrossRef]
  38. Hoxhaj, G.; Manning, B.D. The PI3K-AKT network at the interface of oncogenic signalling and cancer metabolism. Nat. Rev. Cancer 2020, 20, 74–88. [Google Scholar] [CrossRef]
  39. Arcidiacono, B.; Iiritano, S.; Nocera, A.; Possidente, K.; Nevolo, M.T.; Ventura, V.; Foti, D.; Chiefari, E.; Brunetti, A. Insulin resistance and cancer risk: An overview of the pathogenetic mechanisms. Exp. Diabetes Res. 2012, 2012, 789174. [Google Scholar] [CrossRef]
  40. Semenza, G.L. HIF-1: Upstream and downstream of cancer metabolism. Curr. Opin. Genet. Dev. 2010, 20, 51–56. [Google Scholar] [CrossRef]
  41. Semenza, G.L. HIF-1 and mechanisms of hypoxia sensing. Curr. Opin. Cell Biol. 2001, 13, 167–171. [Google Scholar] [CrossRef]
  42. Chen, W.; Wu, P.; Yu, F.; Luo, G.; Qing, L.; Tang, J. HIF-1alpha Regulates Bone Homeostasis and Angiogenesis, Participating in the Occurrence of Bone Metabolic Diseases. Cells 2022, 11, 3552. [Google Scholar] [CrossRef]
  43. Montcourrier, P.; Mangeat, P.H.; Valembois, C.; Salazar, G.; Sahuquet, A.; Duperray, C.; Rochefort, H. Characterization of very acidic phagosomes in breast cancer cells and their association with invasion. J. Cell Sci. 1994, 107 Pt 9, 2381–2391. [Google Scholar] [CrossRef]
  44. Gong, Y.; Fan, Z.; Luo, G.; Yang, C.; Huang, Q.; Fan, K.; Cheng, H.; Jin, K.; Ni, Q.; Yu, X.; et al. The role of necroptosis in cancer biology and therapy. Mol. Cancer 2019, 18, 100. [Google Scholar] [CrossRef]
  45. Dupont, S.; Mamidi, A.; Cordenonsi, M.; Montagner, M.; Zacchigna, L.; Adorno, M.; Martello, G.; Stinchfield, M.J.; Soligo, S.; Morsut, L.; et al. FAM/USP9x, a deubiquitinating enzyme essential for TGFbeta signaling, controls Smad4 monoubiquitination. Cell 2009, 136, 123–135. [Google Scholar] [CrossRef]
  46. Harris, D.R.; Mims, A.; Bunz, F. Genetic disruption of USP9X sensitizes colorectal cancer cells to 5-fluorouracil. Cancer Biol. Ther. 2012, 13, 1319–1324. [Google Scholar] [CrossRef] [PubMed]
  47. Plouffe, S.W.; Lin, K.C.; Moore, J.L., 3rd; Tan, F.E.; Ma, S.; Ye, Z.; Qiu, Y.; Ren, B.; Guan, K.L. The Hippo pathway effector proteins YAP and TAZ have both distinct and overlapping functions in the cell. J. Biol. Chem. 2018, 293, 11230–11240. [Google Scholar] [CrossRef]
  48. Zhang, S.; Cui, W. Sox2, a key factor in the regulation of pluripotency and neural differentiation. World J. Stem Cells 2014, 6, 305–311. [Google Scholar] [CrossRef] [PubMed]
  49. Yang, F.; Gao, B.; Li, R.; Li, W.; Chen, W.; Yu, Z.; Zhang, J. Expression levels of resistant genes affect cervical cancer prognosis. Mol. Med. Rep. 2017, 15, 2802–2806. [Google Scholar] [CrossRef] [PubMed]
  50. Zhang, K.; Zhu, Z.; Zhou, J.; Shi, M.; Wang, N.; Yu, F.; Xu, L. Disulfidptosis-related gene expression reflects the prognosis of drug-resistant cancer patients and inhibition of MYH9 reverses sorafenib resistance. Transl. Oncol. 2024, 49, 102091. [Google Scholar] [CrossRef]
  51. Yang, W.; Soares, J.; Greninger, P.; Edelman, E.J.; Lightfoot, H.; Forbes, S.; Bindal, N.; Beare, D.; Smith, J.A.; Thompson, I.R.; et al. Genomics of Drug Sensitivity in Cancer (GDSC): A resource for therapeutic biomarker discovery in cancer cells. Nucleic Acids Res. 2013, 41, D955–D961. [Google Scholar] [CrossRef] [PubMed]
  52. Kalliokoski, T.; Kramer, C.; Vulpetti, A.; Gedeck, P. Comparability of mixed IC(5)(0) data—A statistical analysis. PLoS ONE 2013, 8, e61007. [Google Scholar] [CrossRef] [PubMed]
  53. Tomczak, K.; Czerwinska, P.; Wiznerowicz, M. The Cancer Genome Atlas (TCGA): An immeasurable source of knowledge. Contemp. Oncol. 2015, 19, A68–A77. [Google Scholar] [CrossRef] [PubMed]
  54. Bland, J.M.; Altman, D.G. The logrank test. BMJ 2004, 328, 1073. [Google Scholar] [CrossRef]
  55. Ashburner, M.; Ball, C.A.; Blake, J.A.; Botstein, D.; Butler, H.; Cherry, J.M.; Davis, A.P.; Dolinski, K.; Dwight, S.S.; Eppig, J.T.; et al. Gene ontology: Tool for the unification of biology. The Gene Ontology Consortium. Nat. Genet. 2000, 25, 25–29. [Google Scholar] [CrossRef]
  56. Kanehisa, M.; Goto, S. KEGG: Kyoto encyclopedia of genes and genomes. Nucleic Acids Res. 2000, 28, 27–30. [Google Scholar] [CrossRef]
  57. Chen, E.Y.; Tan, C.M.; Kou, Y.; Duan, Q.; Wang, Z.; Meirelles, G.V.; Clark, N.R.; Ma’ayan, A. Enrichr: Interactive and collaborative HTML5 gene list enrichment analysis tool. BMC Bioinform. 2013, 14, 128. [Google Scholar] [CrossRef]
  58. Reimand, J.; Isserlin, R.; Voisin, V.; Kucera, M.; Tannus-Lopes, C.; Rostamianfar, A.; Wadi, L.; Meyer, M.; Wong, J.; Xu, C.; et al. Pathway enrichment analysis and visualization of omics data using g:Profiler, GSEA, Cytoscape and EnrichmentMap. Nat. Protoc. 2019, 14, 482–517. [Google Scholar] [CrossRef]
  59. Szklarczyk, D.; Kirsch, R.; Koutrouli, M.; Nastou, K.; Mehryary, F.; Hachilif, R.; Gable, A.L.; Fang, T.; Doncheva, N.T.; Pyysalo, S.; et al. The STRING database in 2023: Protein-protein association networks and functional enrichment analyses for any sequenced genome of interest. Nucleic Acids Res. 2023, 51, D638–D646. [Google Scholar] [CrossRef]
  60. Szklarczyk, D.; Franceschini, A.; Kuhn, M.; Simonovic, M.; Roth, A.; Minguez, P.; Doerks, T.; Stark, M.; Muller, J.; Bork, P.; et al. The STRING database in 2011: Functional interaction networks of proteins, globally integrated and scored. Nucleic Acids Res. 2011, 39, D561–D568. [Google Scholar] [CrossRef]
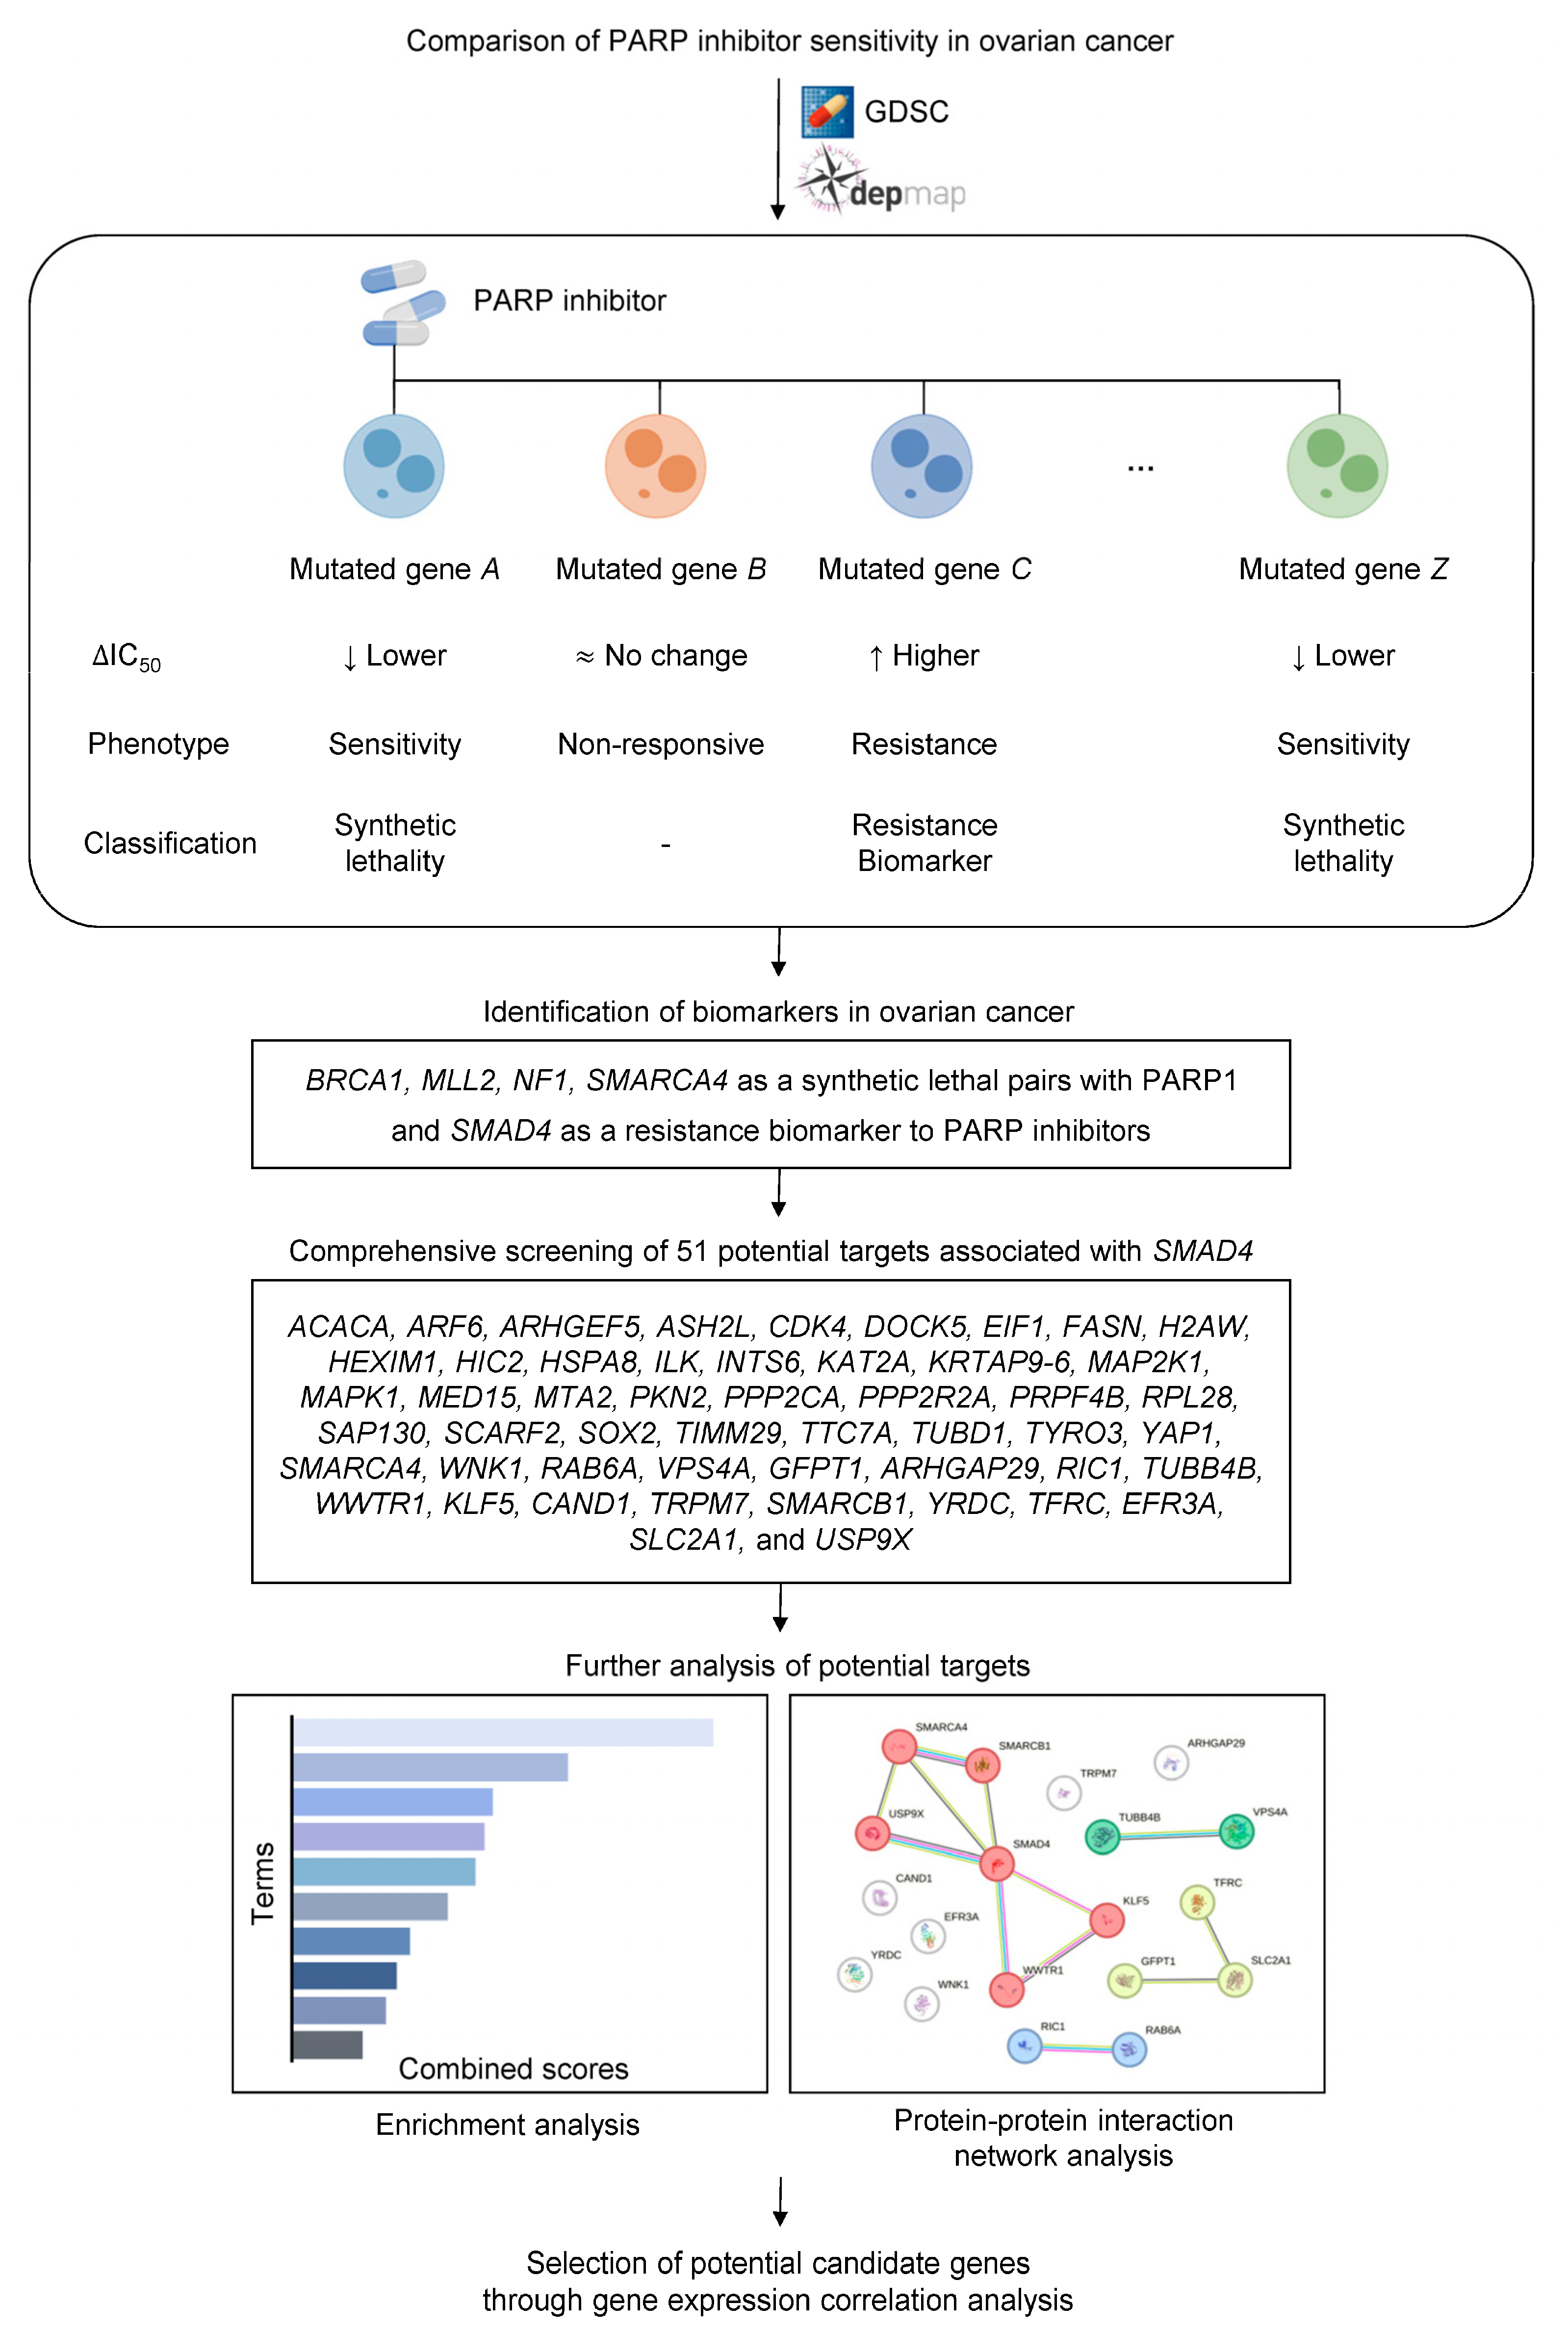
Figure 1. Overall scheme of the study. The workflow illustrates the data acquisition approach using the Genomics of Drug Sensitivity in Cancer (GDSC) database and DepMap portal to analyze drug sensitivity patterns. Changes in IC50 values (∆IC50) between wild-type and mutated genes were categorized into the following three phenotypes: lower IC50 indicating sensitivity, no change indicating non-responsiveness, and higher IC50 indicating resistance. Following drug sensitivity analysis, enrichment and protein–protein interaction network analyses were performed to identify additional potential targets. In the protein–protein interaction network analysis, the circles represent proteins.
Ijms 26 09530 g001
Figure 2. Drug sensitivity analysis of PARP inhibitors in relation to gene mutations in ovarian cancer cell lines. Box plots comparing the IC50 values of five PARP inhibitors (Niraparib, Olaparib, Rucaparib, Talazoparib, and Veliparib) between wild-type (blue boxes) and mutant (red boxes) ovarian cancer cell lines for BRCA1, MLL2, NF1, SMAD4, and SMARCA4. The y-axis represents the IC50 values (µM) for each drug, indicating the concentration required to inhibit cell growth by 50%. * p < 0.05, ** p < 0.01, *** p < 0.001.
Ijms 26 09530 g002
Figure 3. Kaplan–Meier survival curves comparing patients with ovarian cancer exhibiting high and low gene expression. Survival analysis of patients with ovarian cancer stratified by gene expression levels (highest and lowest 20%) of BRCA1, MLL2, NF1, SMAD4, and SMARCA4. The x-axis represents time in days, and the y-axis represents survival probability. Blue and red lines indicate patients with high and low gene expression, respectively. Statistical significance was determined using the log-rank test.
Ijms 26 09530 g003
Figure 4. Heatmap analysis of gene dependency scores (GDS) in ovarian cancer cell lines based on SMAD4 status. (A) Heatmap showing 33 genes with significantly different GDS values between SMAD4 mutant and wild-type ovarian cancer cell lines. Cell lines are categorized as mutant (SW626, OV-90, IGROV-1) or wild-type along the y-axis, and target genes are displayed along the x-axis. (B) Heatmap depicting 18 genes with significantly different GDS values between ovarian cancer cell lines with high and low SMAD4 expression. Cell lines are grouped by SMAD4 expression levels along the y-axis, with low expression cell lines clustered at the top and high expression cell lines at the bottom, and target genes are displayed along the x-axis. Detailed cell line classifications are provided in Table 2. The color scale represents GDS values, with blue indicating lower scores (greater dependency) and red indicating higher scores (less dependency). Clustering was performed using Euclidean distance calculation and the average linkage method.
Ijms 26 09530 g004
Figure 5. Enrichment analysis of 33 genes screened based on SMAD4 mutation status. (A) Gene Ontology (GO) biological process analysis results, presented as a bar graph of the top 10 enriched processes sorted by the combined score. (B) Pathway analysis results are presented as a clustered heatmap with a dendrogram, showing genes significantly associated with multiple pathways. Only genes associated with two or more pathways and showing significant enrichment were included in the visualization. Clustering was performed using Euclidean distance calculation and the average linkage method between clusters. Red blocks indicate the association of genes (shown along the bottom axis) with the corresponding pathways.
Ijms 26 09530 g005
Figure 6. Enrichment analysis of 18 genes screened based on SMAD4 expression levels. (A) GO biological process analysis results, presented as a bar graph of the top 10 enriched processes sorted by the combined score. (B) Pathway analysis results are presented as a clustered heatmap with a dendrogram, showing genes significantly associated with multiple pathways. Only genes associated with two or more pathways and those showing significant enrichment were included in the visualization. Clustering was performed using Euclidean distance calculation and the average linkage method between clusters. Red blocks indicate the association of genes (shown along the bottom axis) with the corresponding pathways.
Ijms 26 09530 g006
Figure 7. Protein–protein interaction (PPI) network analysis of potential target genes associated with SMAD4. Network visualization showing functional relationships between genes, where connecting lines indicate various types of associations, including co-expression, experimental/biochemical data, curated database entries, or co-mention in published literature. Genes showing direct interactions with SMAD4 are highlighted in red, while other colors represent distinct functional clusters of genes associated with each other rather than directly with SMAD4. (A) PPI network of SMAD4 and 33 genes screened based on SMAD4 mutation status. (B) PPI network of SMAD4 and 18 genes screened based on SMAD4 expression levels. The analysis was performed using the STRING database. In the protein–protein interaction network analysis, the circles represent proteins.
Ijms 26 09530 g007
Figure 8. Correlation analysis of gene expression between SMAD4 and potential target genes in ovarian cancer cell lines. Scatter plots showing the expression correlation between SMAD4 (x-axis) and 20 potential target genes (y-axis) from 51 screened candidates. Genes are arranged in the order of decreasing Pearson correlation coefficient (r), with only those having absolute r values > 0.35 included. Each plot displays the correlation coefficient and p-value. Blue dots represent individual ovarian cancer cell lines, and red lines indicate the linear regression fit. Expression data were obtained from the DepMap portal, with raw data presented in Supplementary Table S2.
Ijms 26 09530 g008
Figure 9. Kaplan–Meier survival analysis of three potential target genes in patients with low SMAD4 expression. Survival curves comparing patients with ovarian cancer showing low SMAD4 expression stratified by expression levels of (A) ACACA, (B) PRPF4B, and (C) TUBD1. For each gene, patients were categorized into high expression (blue lines) and low expression (red lines) groups. The x-axis represents the time in days, and the y-axis represents survival probability. All three genes showed significant differences in survival outcomes (p < 0.05) among patients with low SMAD4 expression. The number of patients in each group is indicated in parentheses. Survival data for the remaining 17 potential target genes are presented in Figure S4.
Ijms 26 09530 g009
Table 1. IC50 values of five PARP inhibitors in mutant and wild-type ovarian cancer cell lines for BRCA1, MLL2, NF1, SMAD4, and SMARCA4. IC50 values are presented as mean ± standard deviation (Mean ± SD) and expressed in μM (micromolar).
GeneDrugWild-Type (n)IC50 (WT*) ± SDMutant (n)IC50 (MT) ± SD
BRCA1 Niraparib24149.2 ± 125.8436.8 ± 14.1
Olaparib29297.3 ± 495.8477.9 ± 84.7
Rucaparib27163.3 ± 344.9428.1 ± 10.2
Talazoparib29247.2 ± 688.1412.2 ± 15.7
Veliparib28505.3 ± 677.04280.7 ± 240.6
MLL2 Niraparib26141.4 ± 123.8225.5 ± 3.5
Olaparib30291.0 ± 473.7367.8 ± 43.4
Rucaparib26165.4 ± 351.6330.7 ± 15.3
Talazoparib30239.3 ± 677.5312.5 ± 16.7
Veliparib29516.5 ± 661.2397.3 ± 49.3
NF1 Niraparib24149.4 ± 125.4435.5 ± 26.7
Olaparib29288.9 ± 481.34138.9 ± 163.2
Rucaparib27162.1 ± 345.3435.8 ± 2.1
Talazoparib28233.0 ± 700.9413.4 ± 12.3
Veliparib28517.2 ± 676.54197.5 ± 65.7
SMAD4 Niraparib25124.0 ± 117.83209.3 ± 166.9
Olaparib29171.9 ± 148.04987.1 ± 1110.1
Rucaparib2781.3 ± 58.24581.5 ± 855.7
Talazoparib29123.1 ± 337.14911.5 ± 1641.8
Veliparib28331.5 ± 211.741497.0 ± 1501.3
SMARCA4 Niraparib25144.2 ± 125.5340.6 ± 24.9
Olaparib30291.7 ± 473.5361.6 ± 10.3
Rucaparib28154.2 ± 340.7367.8 ± 28.6
Talazoparib30240.3 ± 677.232.8 ± 1.3
Veliparib29503.4 ± 667.33223.8 ± 148.1
WT*; Wild-type, MT; Mutant.
Table 2. Classification of ovarian cancer cell lines based on SMAD4 status. Ovarian cancer cell lines were classified according to both SMAD4 mutation status based on genomic analysis from the Genomics of Drug Sensitivity in Cancer (GDSC) databases and SMAD4 expression levels based on the genomic analysis from DepMap databases. For expression-based classification, cell lines were categorized using the highest and lowest 30% of SMAD4 expression levels as the criteria.
GroupCell Lines
Wild-typePEO1, FU-OV-1, DOV13, OAW42, OVK18, UWB1.289, Caov-3, OVTOKO, OV-17R, OVCA433, OVCAR-4, JHOS-3, Caov-4, TOV-21G, OAW28, JHOS-4, SK-OV-3, OVCAR-8, OV-56, OVCAR-3, OVMIU, OVCA420, TOV-112D, OC-314, OVCAR-5, JHOS-2, OVISE, Hey, OV-7
SMAD4 MutantIGROV-1, OVKATE, SW626, OV-90
High SMAD4 ExpressionOAW28, SK-OV-3, JHOS-4, JHOM-1, JHOC-5, NZOV9, PEA1, A2780, BIN-67, COV504, TOV-112D, OC-316, OVCAR-8, FU-OV-1, COV434, OVK18, OV-7, OVSAHO
Low SMAD4 ExpressionJHOM-2B, OVTOKO, MCAS, OCI-P5x, 59M, OAW42, UWB1.289, OCI-C4P, OCI-C5x, OVKATE, COV413A, OVCAR-5, OVCAR-4, PEO1, OV-90, PEO4, OVMANA, RMUG-S
Table 3. Gene dependency scores (GDS) of potential target genes in ovarian cancer cell lines based on SMAD4 mutation status. List of 33 genes showing significantly different GDS values between SMAD4 mutant and wild-type cell lines. The numerical values in the table represent the average GDS values for each gene in the respective cell line groups, with p-values indicating the statistical significance of differences between groups. Negative GDS values indicate greater dependency, suggesting that these genes are essential for cell survival in the respective SMAD4 context.
Genep-ValueGDS in Mutant Cell LinesGDS in Wild-Type Cell Lines
MAPK1 0.0004−0.9643−0.1284
INTS6 0.0007−1.7723−0.6206
TTC7A 0.0008−0.5756−0.1820
MTA2 0.0018−0.8225−0.2730
SOX2 0.0034−0.5008−0.1705
MAP2K1 0.0053−0.5004−0.1118
PPP2R2A 0.0060−0.5252−0.1287
RPL28 0.0083−1.3475−0.8033
TYRO3 0.0093−0.6591−0.3882
KAT2A 0.0093−0.5809−0.2899
ARHGEF5 0.0095−0.6281−0.3619
DOCK5 0.0098−0.5625−0.1139
HSPA8 0.0109−1.4931−0.6527
HIC2 0.0121−0.5542−0.0774
PKN2 0.0124−0.8481−0.4446
SCARF2 0.0145−0.5807−0.1586
MED15 0.0159−0.6711−0.1594
ARF6 0.0171−0.6359−0.2516
CDK4 0.0186−1.4800−0.6004
TIMM29 0.0197−0.8811−0.5807
HEXIM1 0.0218−0.6848−0.3736
YAP1 0.0261−1.2623−0.5317
ASH2L 0.0264−0.6810−0.3158
TUBD1 0.0283−0.7341−0.4012
H2AW 0.0299−0.5787−0.3424
EIF1 0.0357−1.6192−1.0654
PPP2CA 0.0452−1.5073−0.7478
PRPF4B 0.0455−0.9152−0.6036
ACACA 0.0462−0.6231−0.3011
SAP130 0.0465−0.7302−0.4637
KRTAP9-6 0.0468−0.6083−0.3868
ILK 0.0478−0.8788−0.4457
FASN 0.0497−0.5177−0.2311
Table 4. GDS of potential target genes in ovarian cancer cell lines based on SMAD4 expression levels. List of 18 genes displaying significantly different GDS values between cell lines with low and high SMAD4 expression levels. The numerical values in the table represent the average GDS values for each gene in the respective cell line groups, with p-values indicating the statistical significance of differences between groups. Negative GDS values indicate greater dependency, suggesting these genes are essential for cell survival in the respective SMAD4 context.
Genep-ValueGDS in Low Expression Cell LinesGDS in High Expression Cell Lines
SMARCA4 0.0019−0.6337−0.2506
WNK1 0.0025−0.7793−0.4229
RAB6A 0.0044−0.5010−0.1044
VPS4A 0.0047−0.7433−0.3425
GFPT1 0.0124−0.7171−0.4088
ARHGAP29 0.0129−0.5395−0.1669
RIC1 0.0135−0.7341−0.3076
TUBB4B 0.0147−0.5456−0.3078
WWTR1 0.0152−0.5619−0.3043
KLF5 0.0154−0.6163−0.2499
CAND1 0.0157−0.5319−0.2209
TRPM7 0.0199−0.7870−0.4315
SMARCB1 0.0240−0.8087−0.4964
YRDC 0.0340−2.2461−1.4869
TFRC 0.0342−0.9311−0.5985
EFR3A 0.0422−0.6048−0.3122
SLC2A1 0.0458−0.5958−0.3070
USP9X 0.0491−0.6929−0.3983
Disclaimer/Publisher’s Note: The statements, opinions and data contained in all publications are solely those of the individual author(s) and contributor(s) and not of MDPI and/or the editor(s). MDPI and/or the editor(s) disclaim responsibility for any injury to people or property resulting from any ideas, methods, instructions or products referred to in the content.