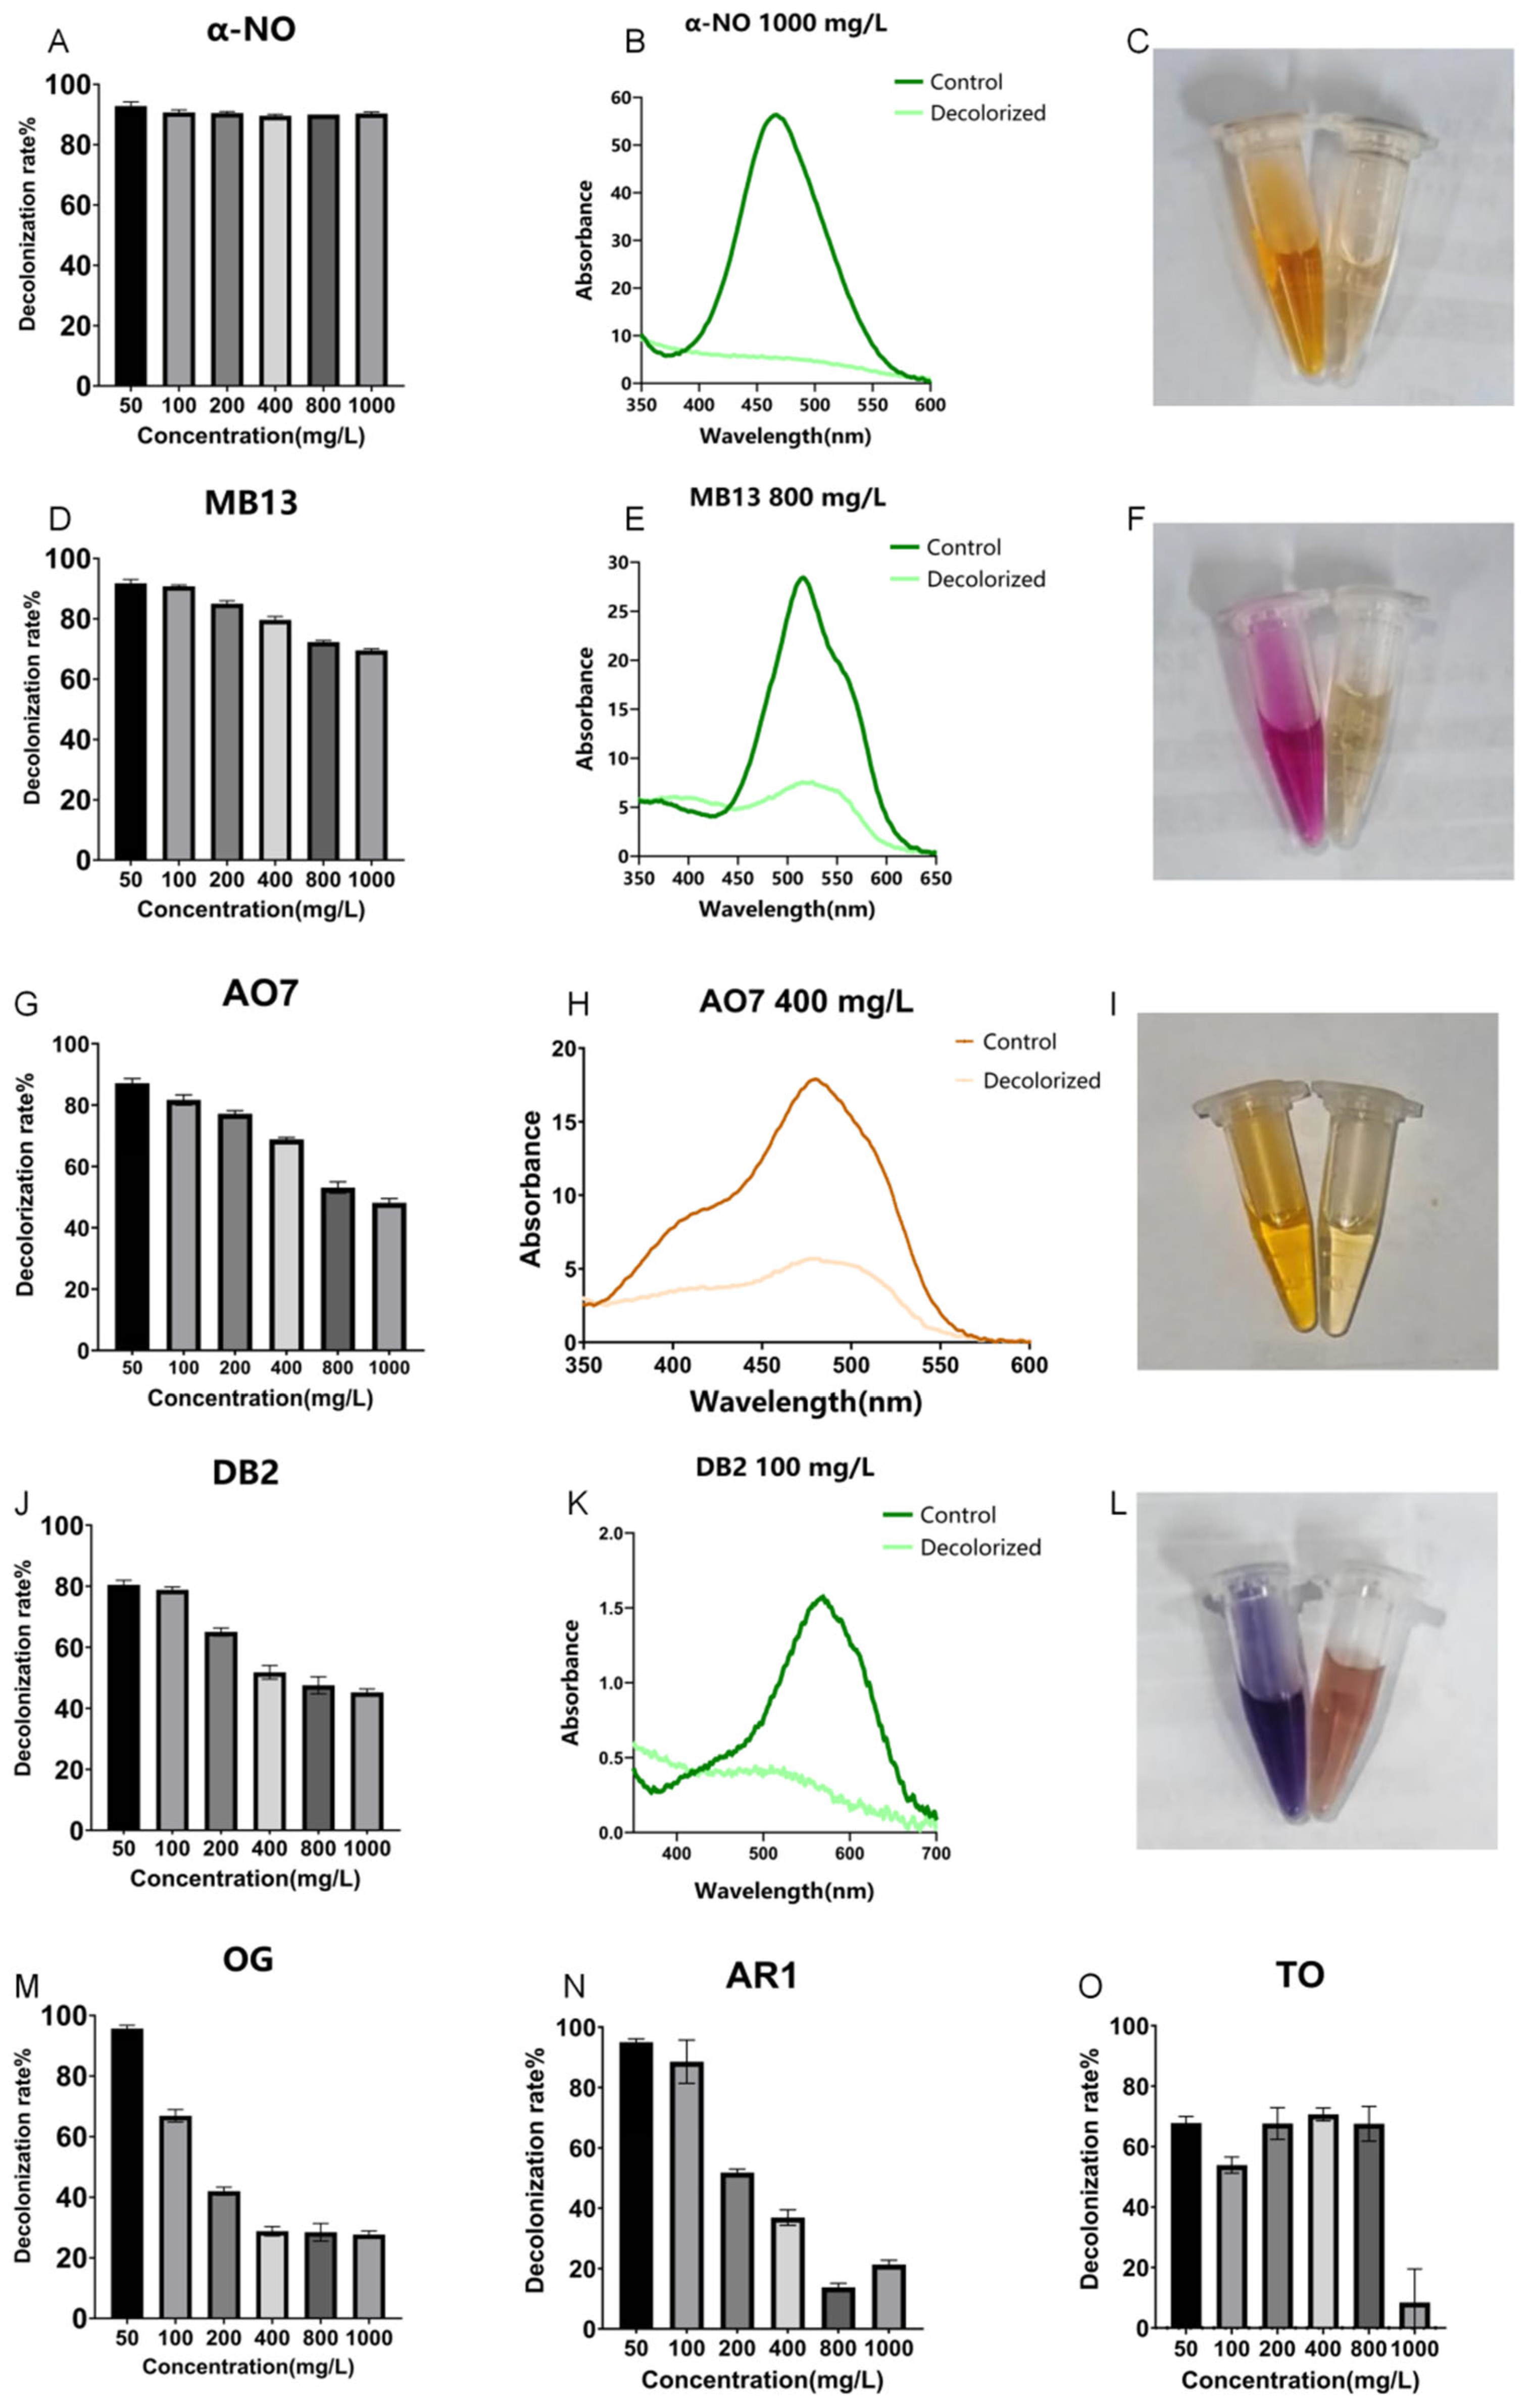
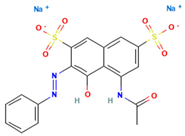
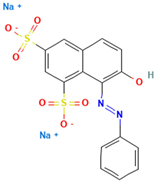
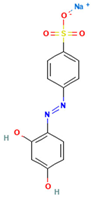
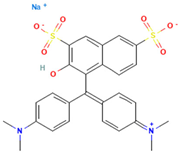
Figure 1.
Decolorization of different azo dyes by crude laccase from the yang1 strain (1 U/mL) at 30 °C. (A). Decolorization efficiencies of different concentrations of azo dye α-NO treated with 1 U/mL crude laccase (24 h). (B). Spectral scanning graph of azo dye α-NO before and after treatment with 1 U/mL crude laccase (dye concentration: 1000 mg/L). (C). Color change diagram of azo dye α-NO before and after laccase decolorization (left—before decolorization, right—after decolorization). (D). Decolorization efficiencies of different concentrations of azo dye MB13 treated with 1 U/mL crude laccase (24 h). (E). Spectral scanning graph of azo dye MB13 before and after treatment with 1 U/mL crude laccase (dye concentration: 800 mg/L). (F). Color change diagram of azo dye MB13 before and after laccase decolorization (left—before decolorization, right—after decolorization). (G). Decolorization efficiencies of different concentrations of azo dye AO7 treated with 1 U/mL crude laccase (24 h). (H). Spectral scanning graph of azo dye AO7 before and after treatment with 1 U/mL crude laccase (dye concentration: 400 mg/L). (I). Color change diagram of azo dye AO7 before and after laccase decolorization (left—before decolorization, right—after decolorization). (J). Decolorization efficiencies of different concentrations of azo dye DB2 treated with 1 U/mL crude laccase (24 h). (K). Spectral scanning graph of azo dye DB2 before and after treatment with 1 U/mL crude laccase (dye concentration: 100 mg/L). (L). Color change diagram of azo dye DB2 before and after laccase decolorization (left—before decolorization, right—after decolorization). (M). Decolorization efficiencies of different concentrations of azo dye OG treated with 1 U/mL crude laccase (24 h). (N). Decolorization efficiencies of different concentrations of azo dye AR1 treated with 1 U/mL crude laccase (24 h). (O). Decolorization efficiencies of different concentrations of azo dye TO treated with 1 U/mL crude laccase (24 h).
![Ijms 26 08363 g001 Ijms 26 08363 g001]()
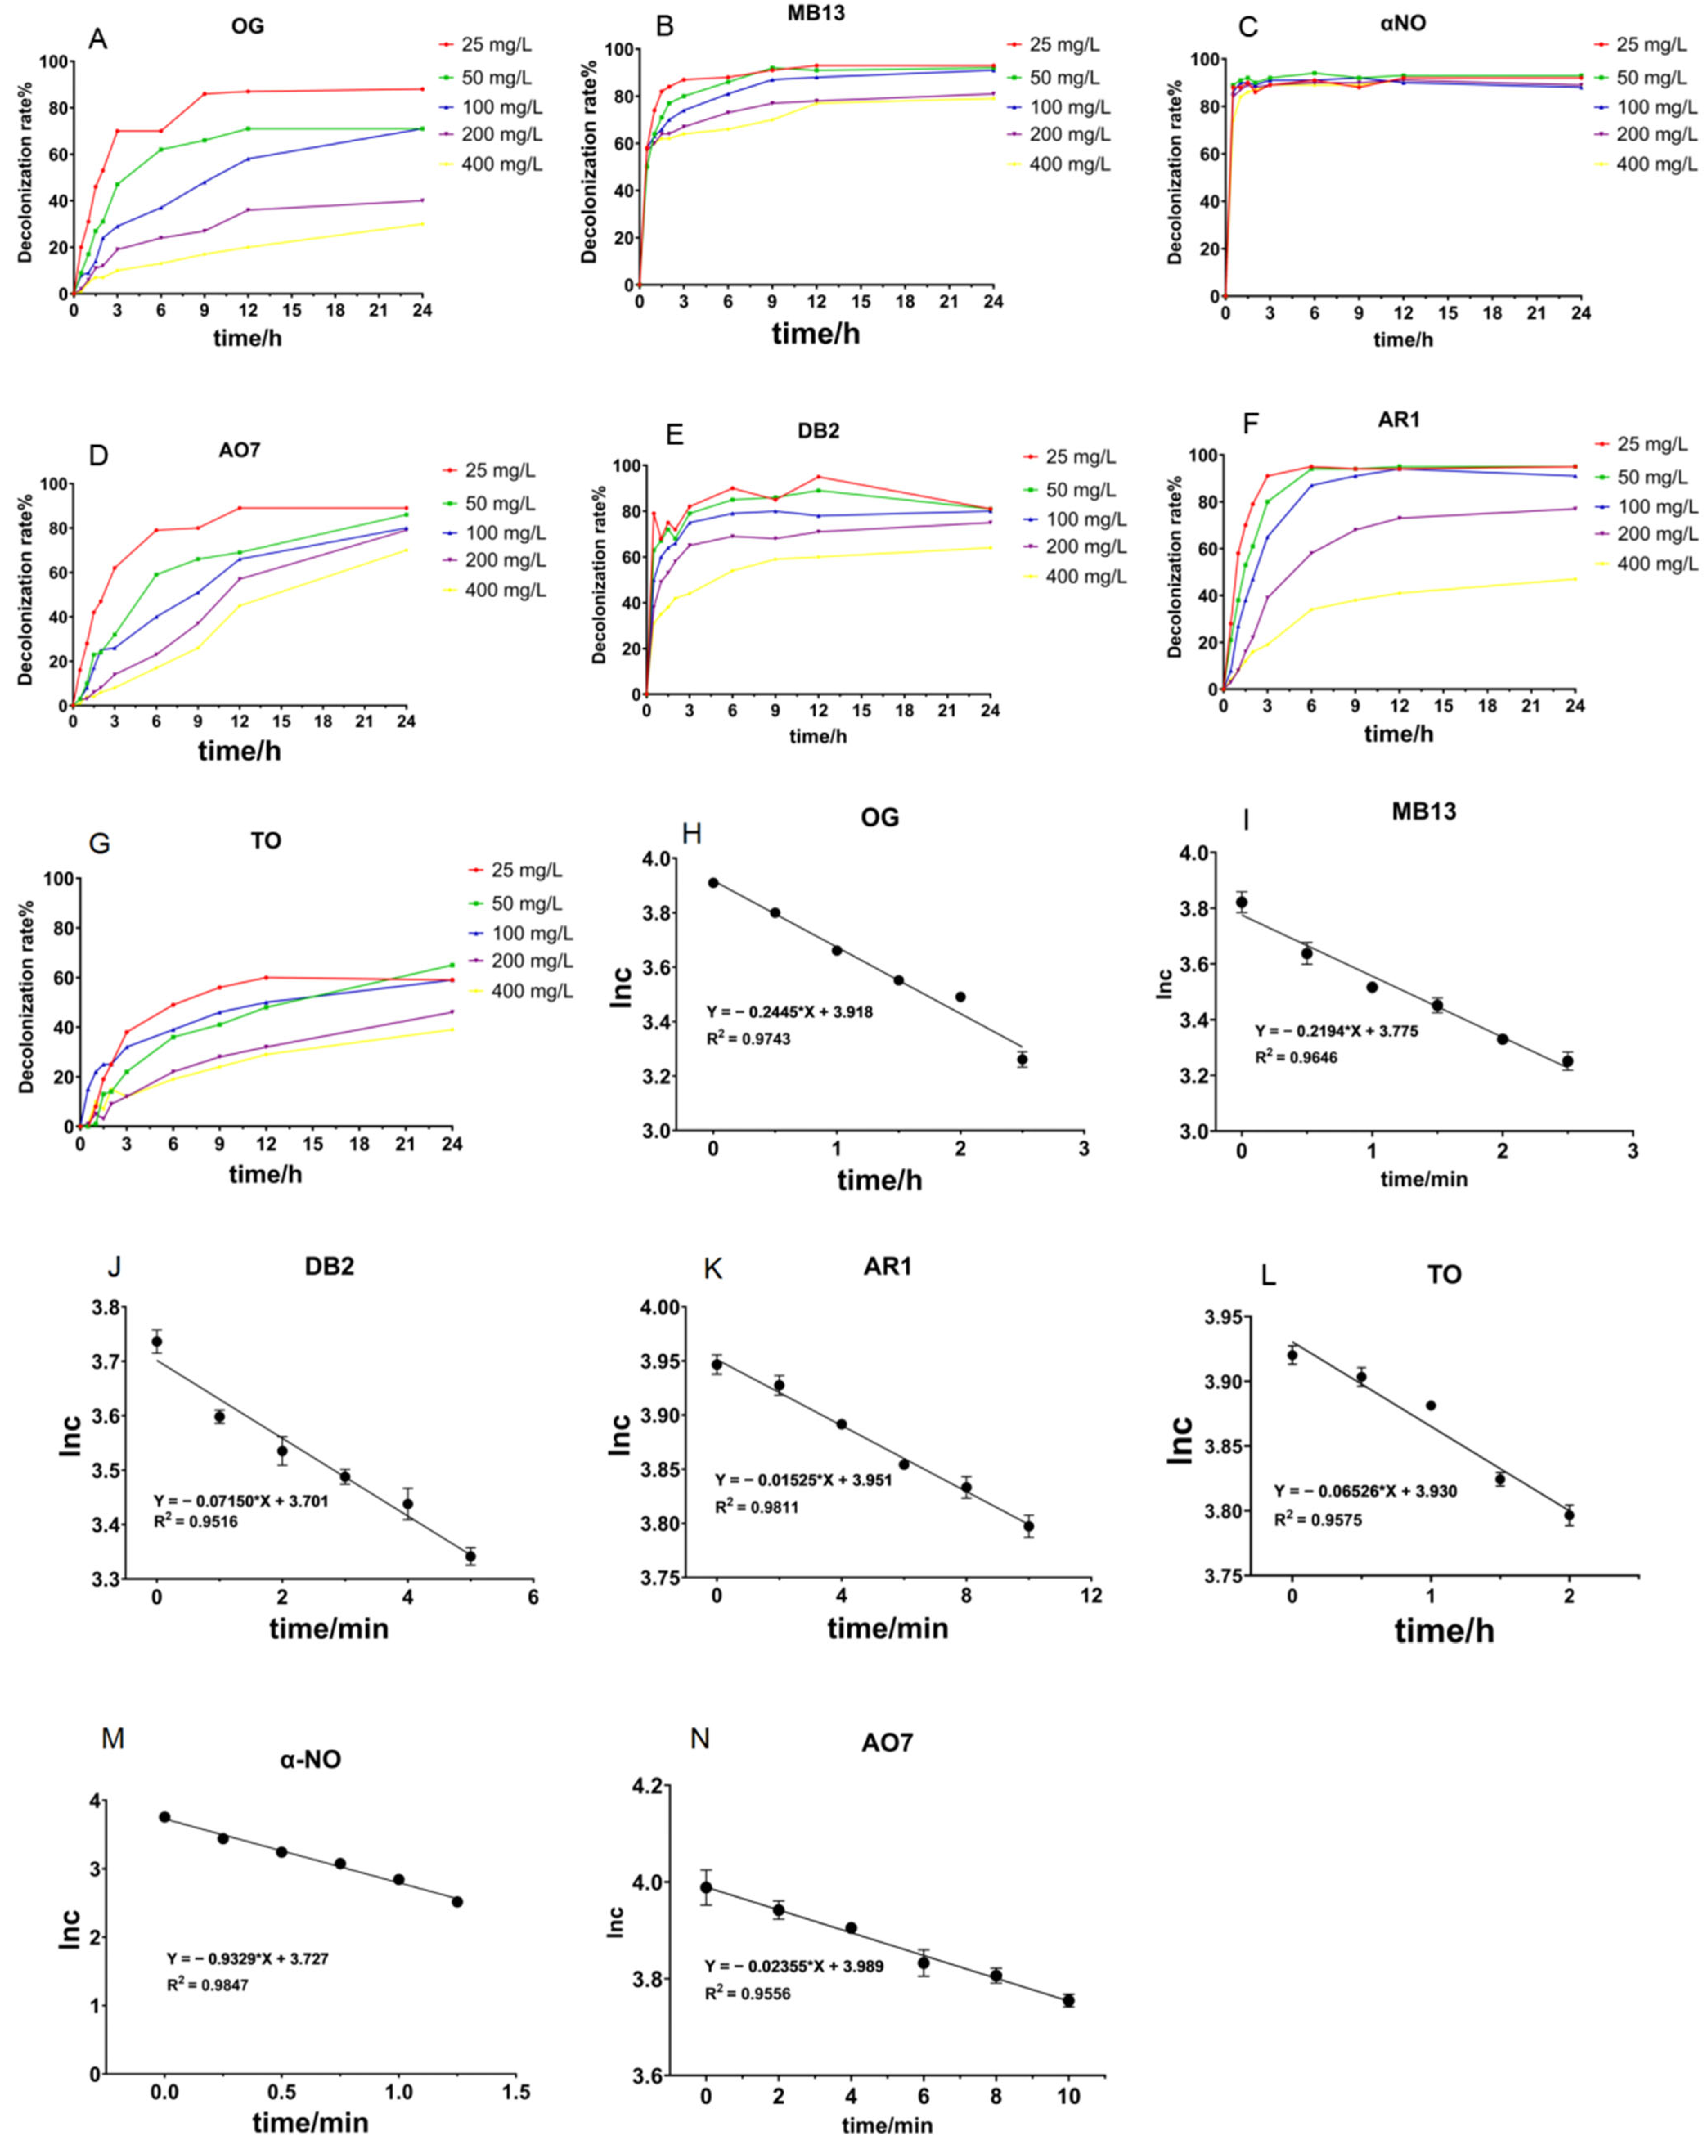
Figure 2.
Decolorization of different azo dyes by crude laccase from the yang1 strain (2 U/mL) at 30 °C. (A). Decolorization efficiencies of different concentrations of azo dye DB2 treated with 2 U/mL crude laccase (24 h). (B). Decolorization efficiencies of different concentrations of azo dye AR1 treated with 2 U/mL crude laccase (24 h). (C). Decolorization efficiencies of different concentrations of azo dye TO treated with 2 U/mL crude laccase (24 h).
Figure 3.
Time course decolorization of different azo dyes by crude laccase from the yang1 strain (1 U/mL) at 30 °C and ln c–t curves of the decolorization process of azo dyes. (A–G): Time course decolorization of different azo dyes by crude laccase ((A–D) at 1 U/mL, (E–G) at 2 U/mL). (H–N): ln c–t curves of the decolorization process of azo dyes by crude laccase. The unit of measurement for c is mg/L.
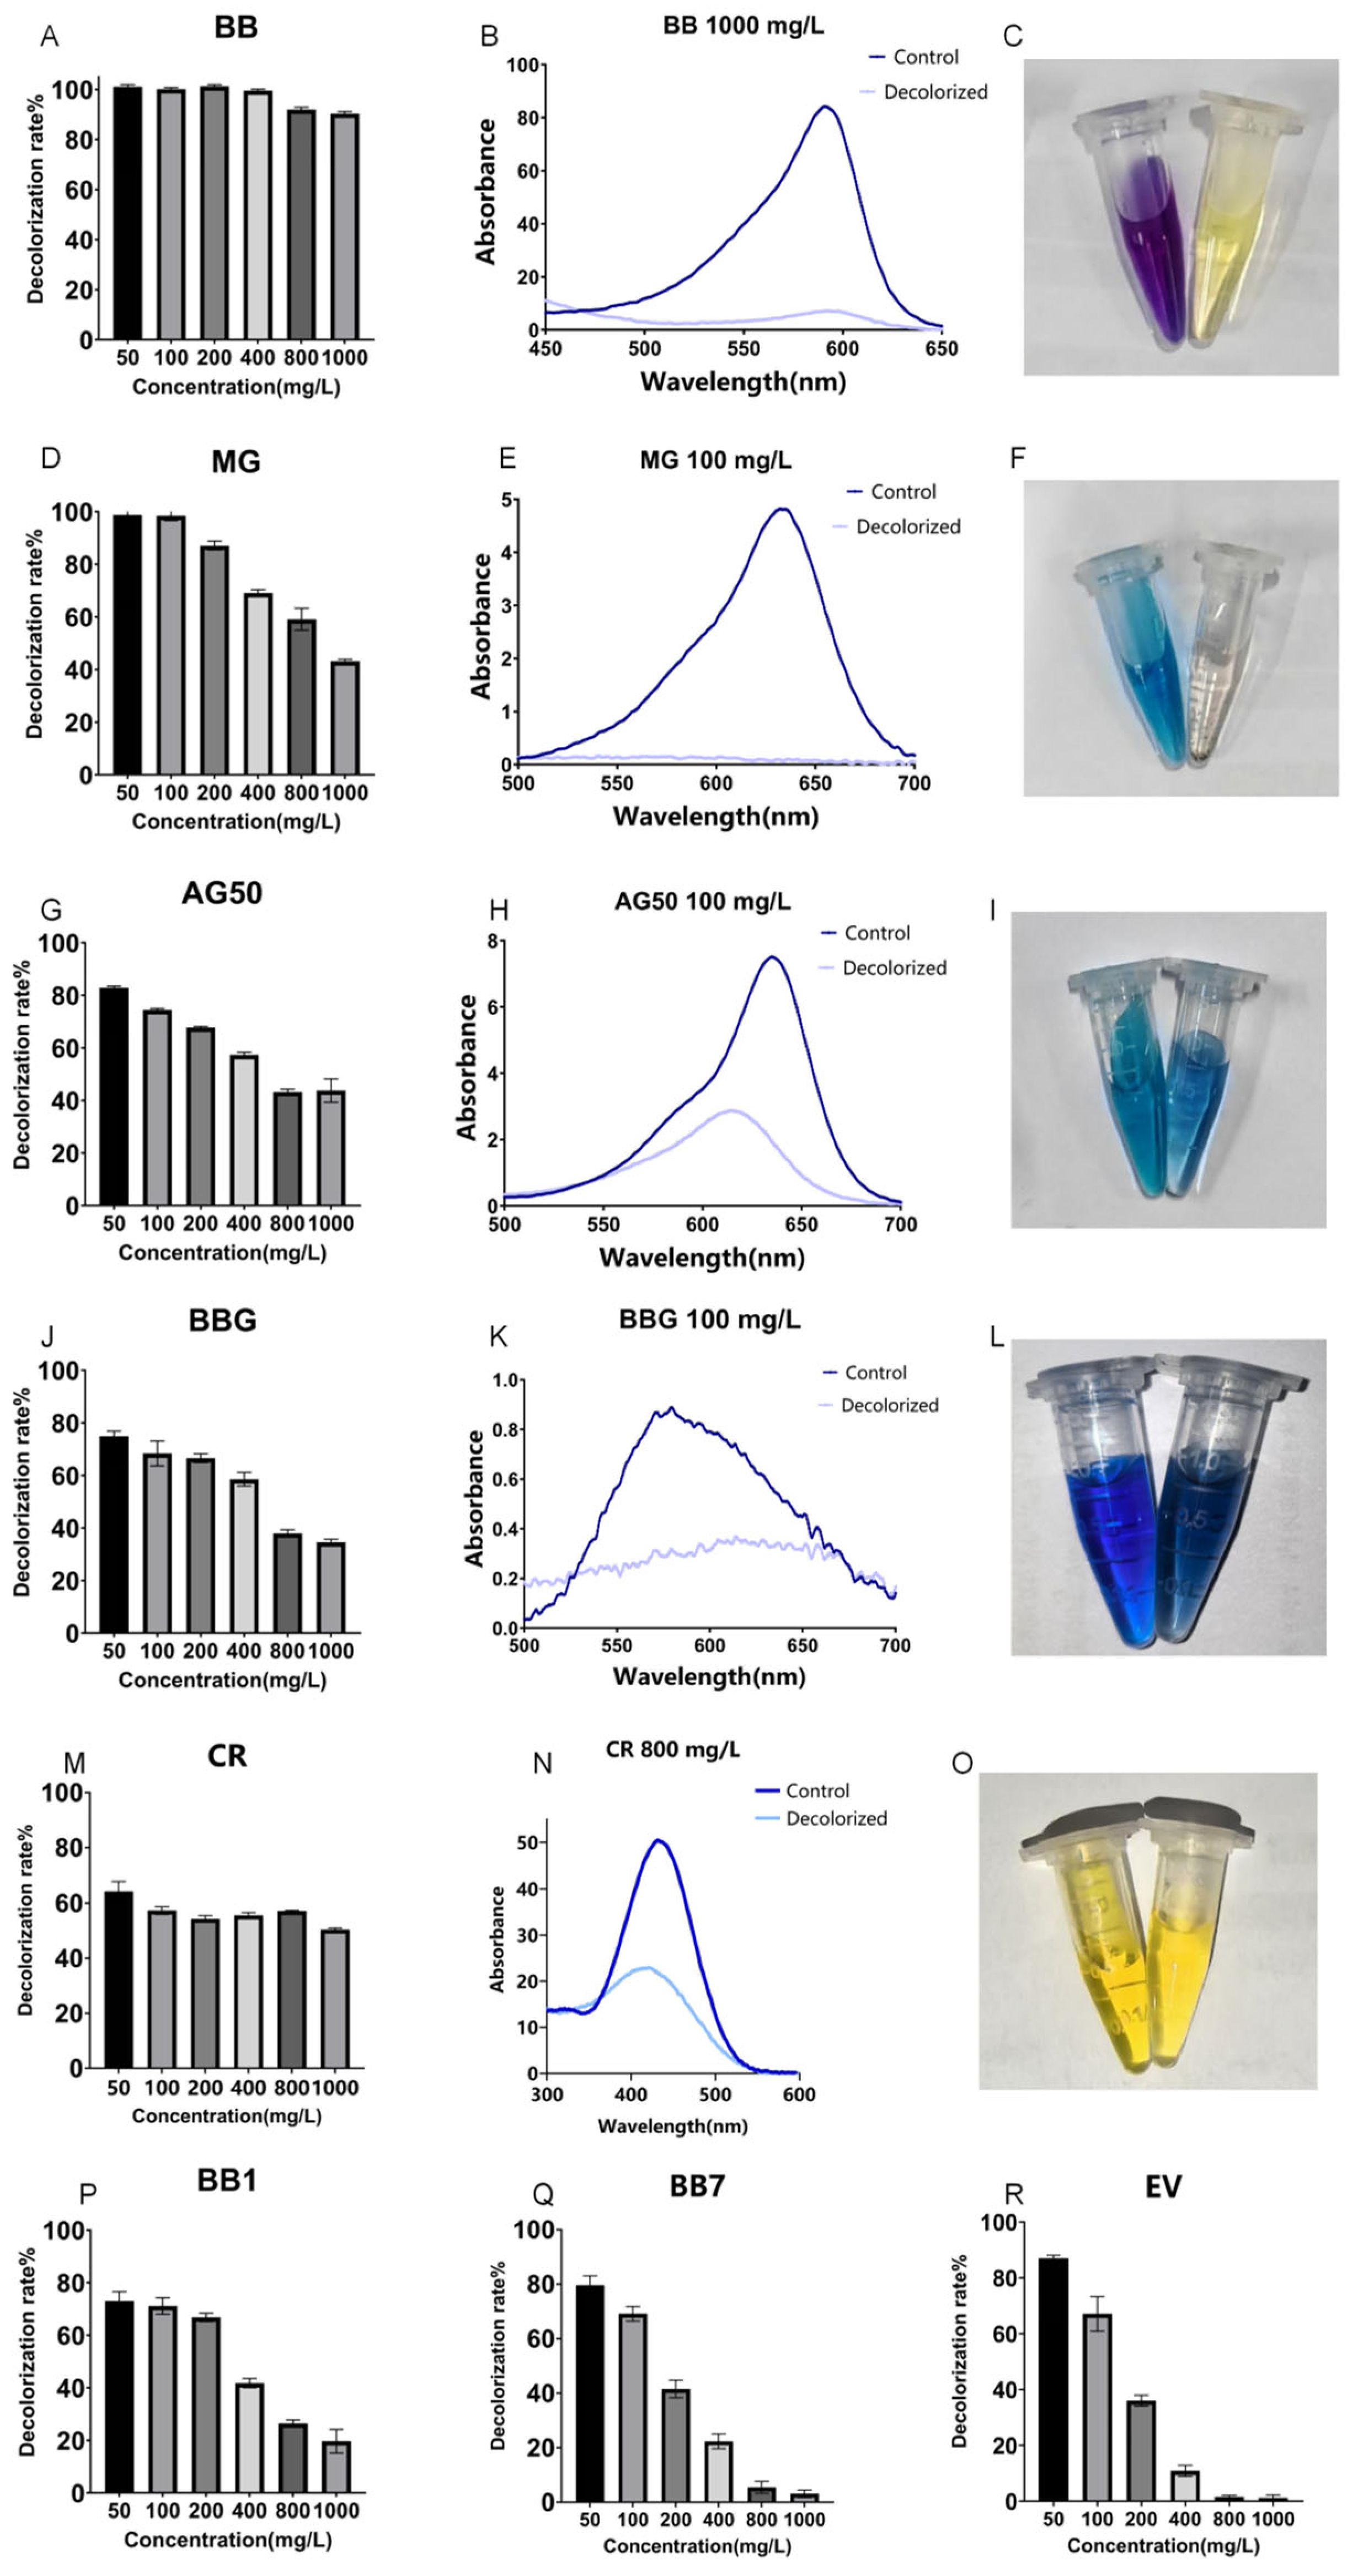
Figure 4.
Decolorization of different triphenylmethane dyes by crude laccase from the yang1 strain at 30 °C. (A,D,G,J,M,P,Q,R): Decolorization efficiencies of different concentrations of triphenylmethane dyes BB, MG, AG50, BBG, CR, BB1, BB7, and EV treated with 1 U/mL crude laccase (24 h). (B,E,H,K,N): Spectral scanning graph of triphenylmethane dyes BB, MG, AG50, BBG, and CR before and after treatment with 1 U/mL crude laccase. (C,F,I,L,O): Color change diagram of the BB, MG, AG50, BBG, and CR dyes before and after laccase decolorization (left—before decolorization, right—after decolorization).
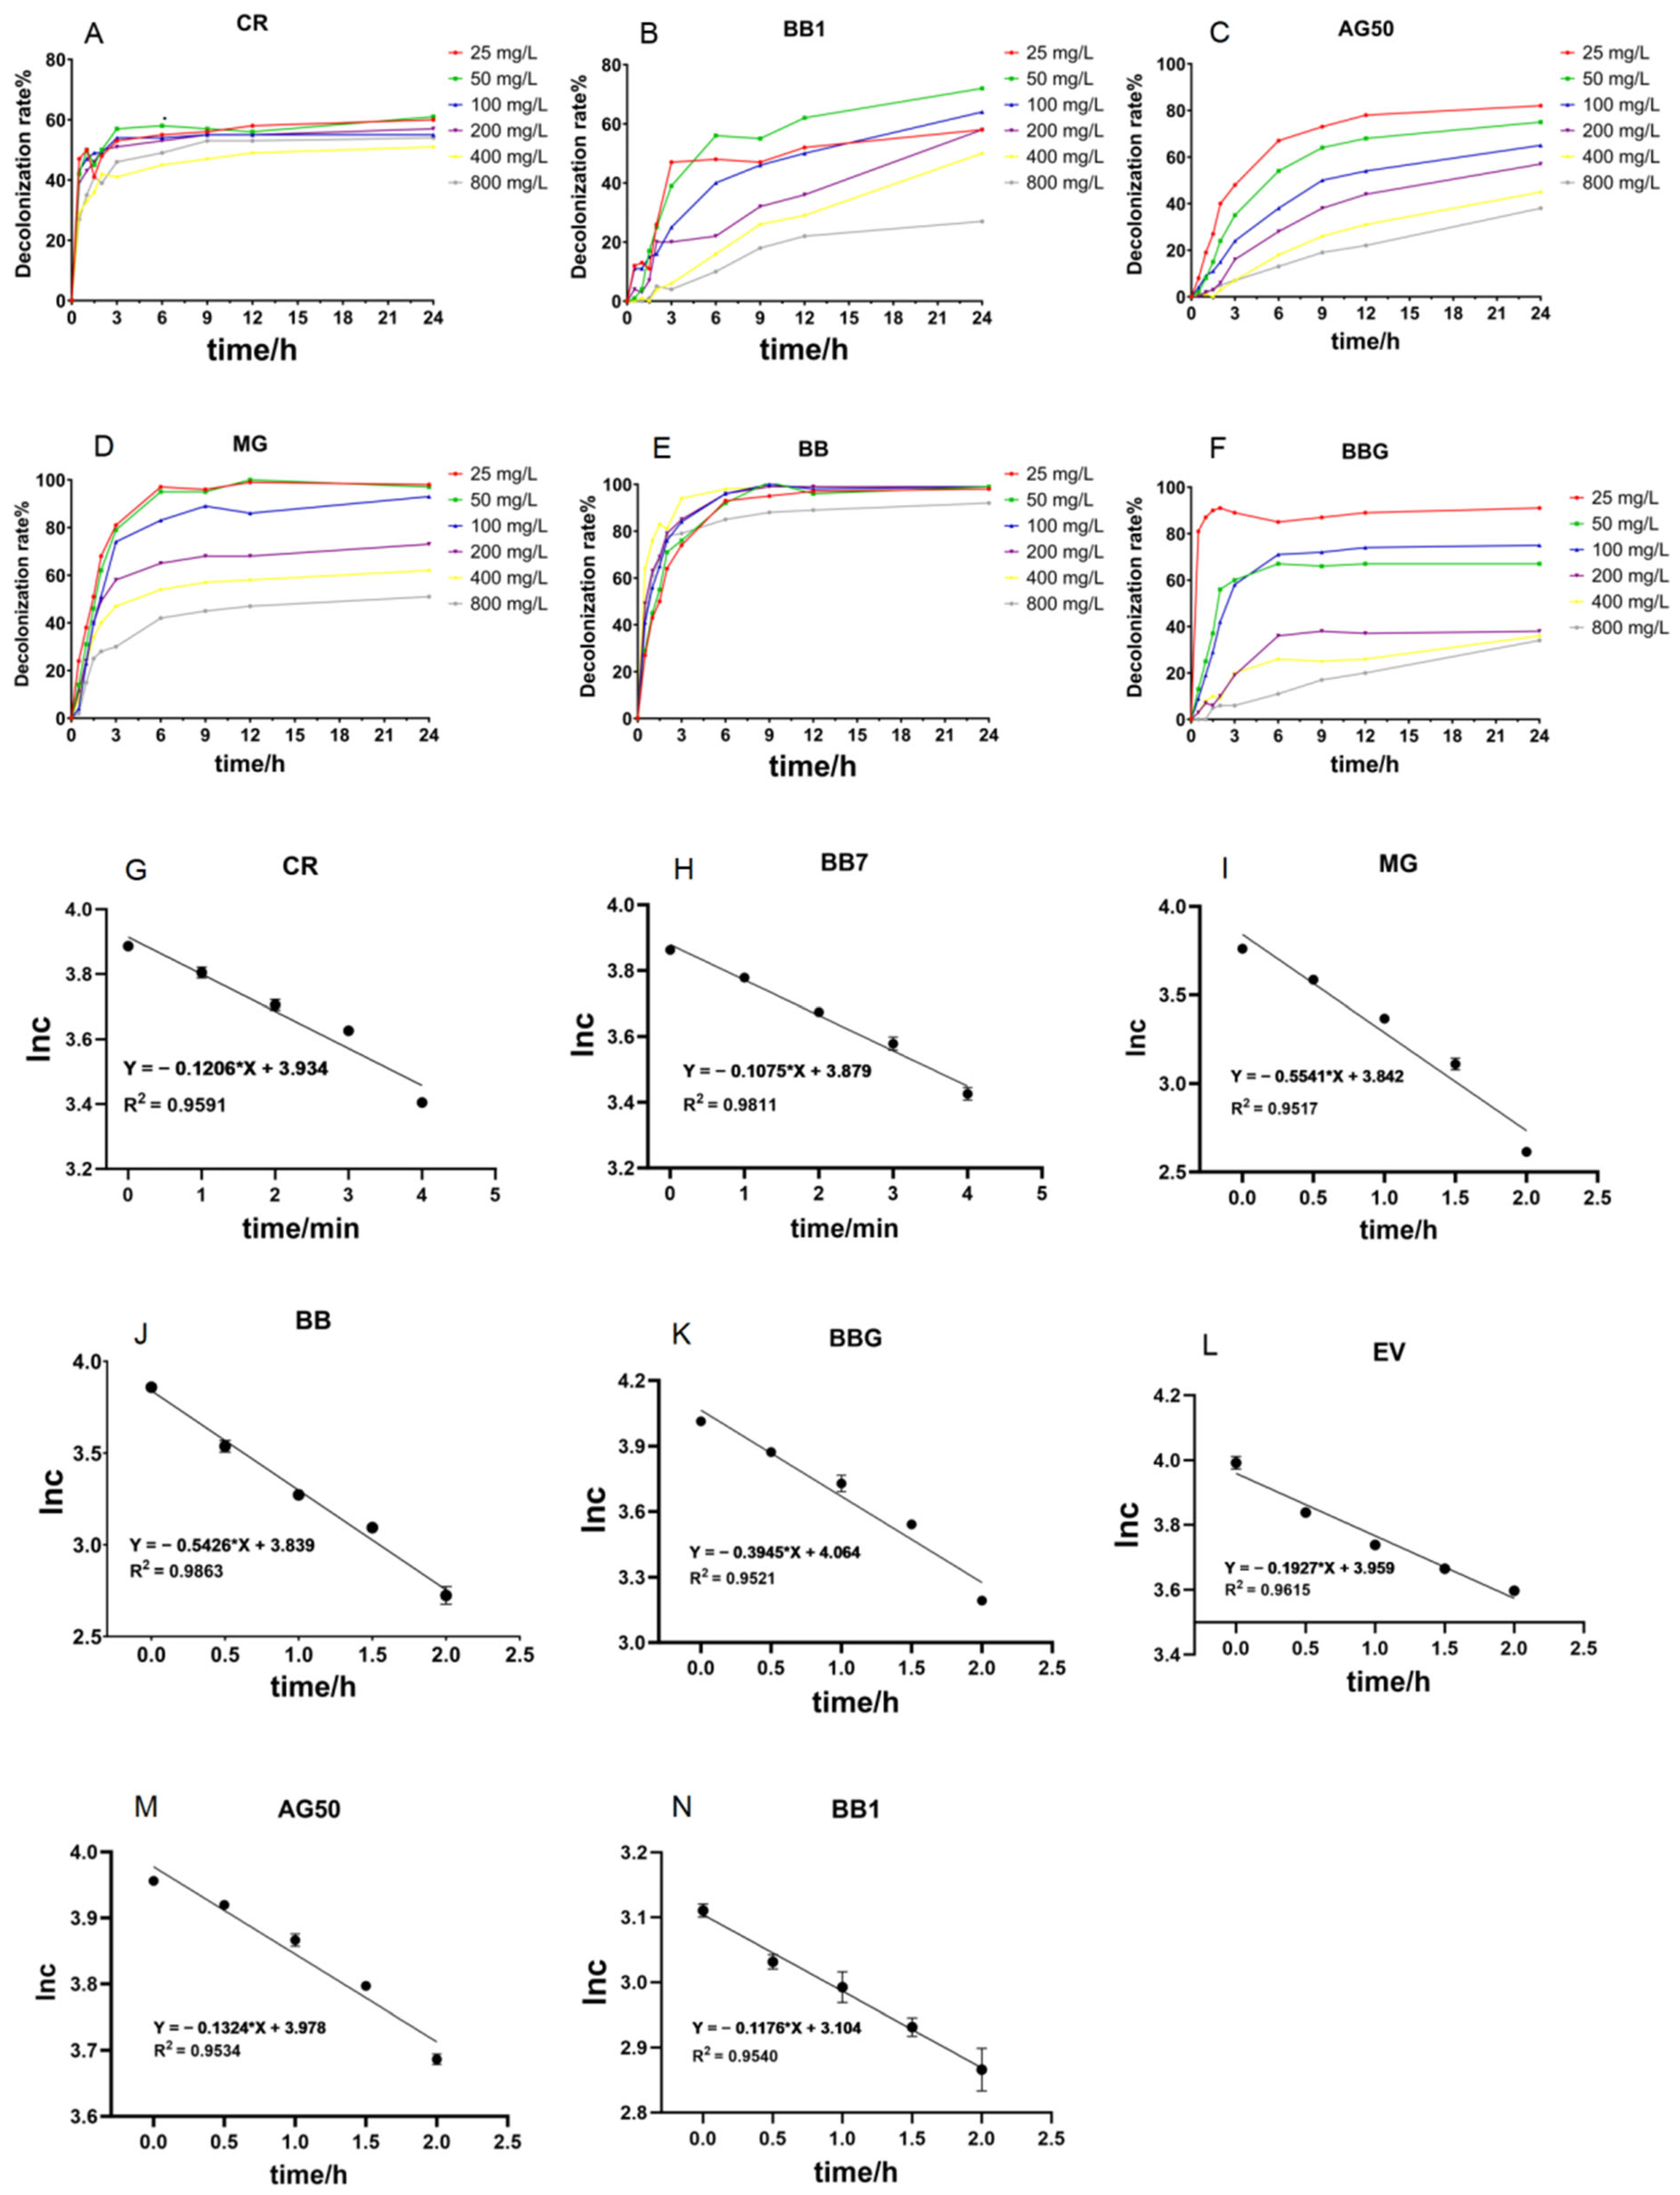
Figure 5.
Time course decolorization of different triphenylmethane dyes by crude laccase from the yang1 strain (1 U/mL) at 30 °C and ln c–t curves of the decolorization process of triphenylmethane dyes. (A–F): Time course decolorization of different triphenylmethane dyes by crude laccase (1 U/mL). (G–N): ln c–t curves of the decolorization process of triphenylmethane dyes by crude laccase. The unit of measurement for c is mg/L.
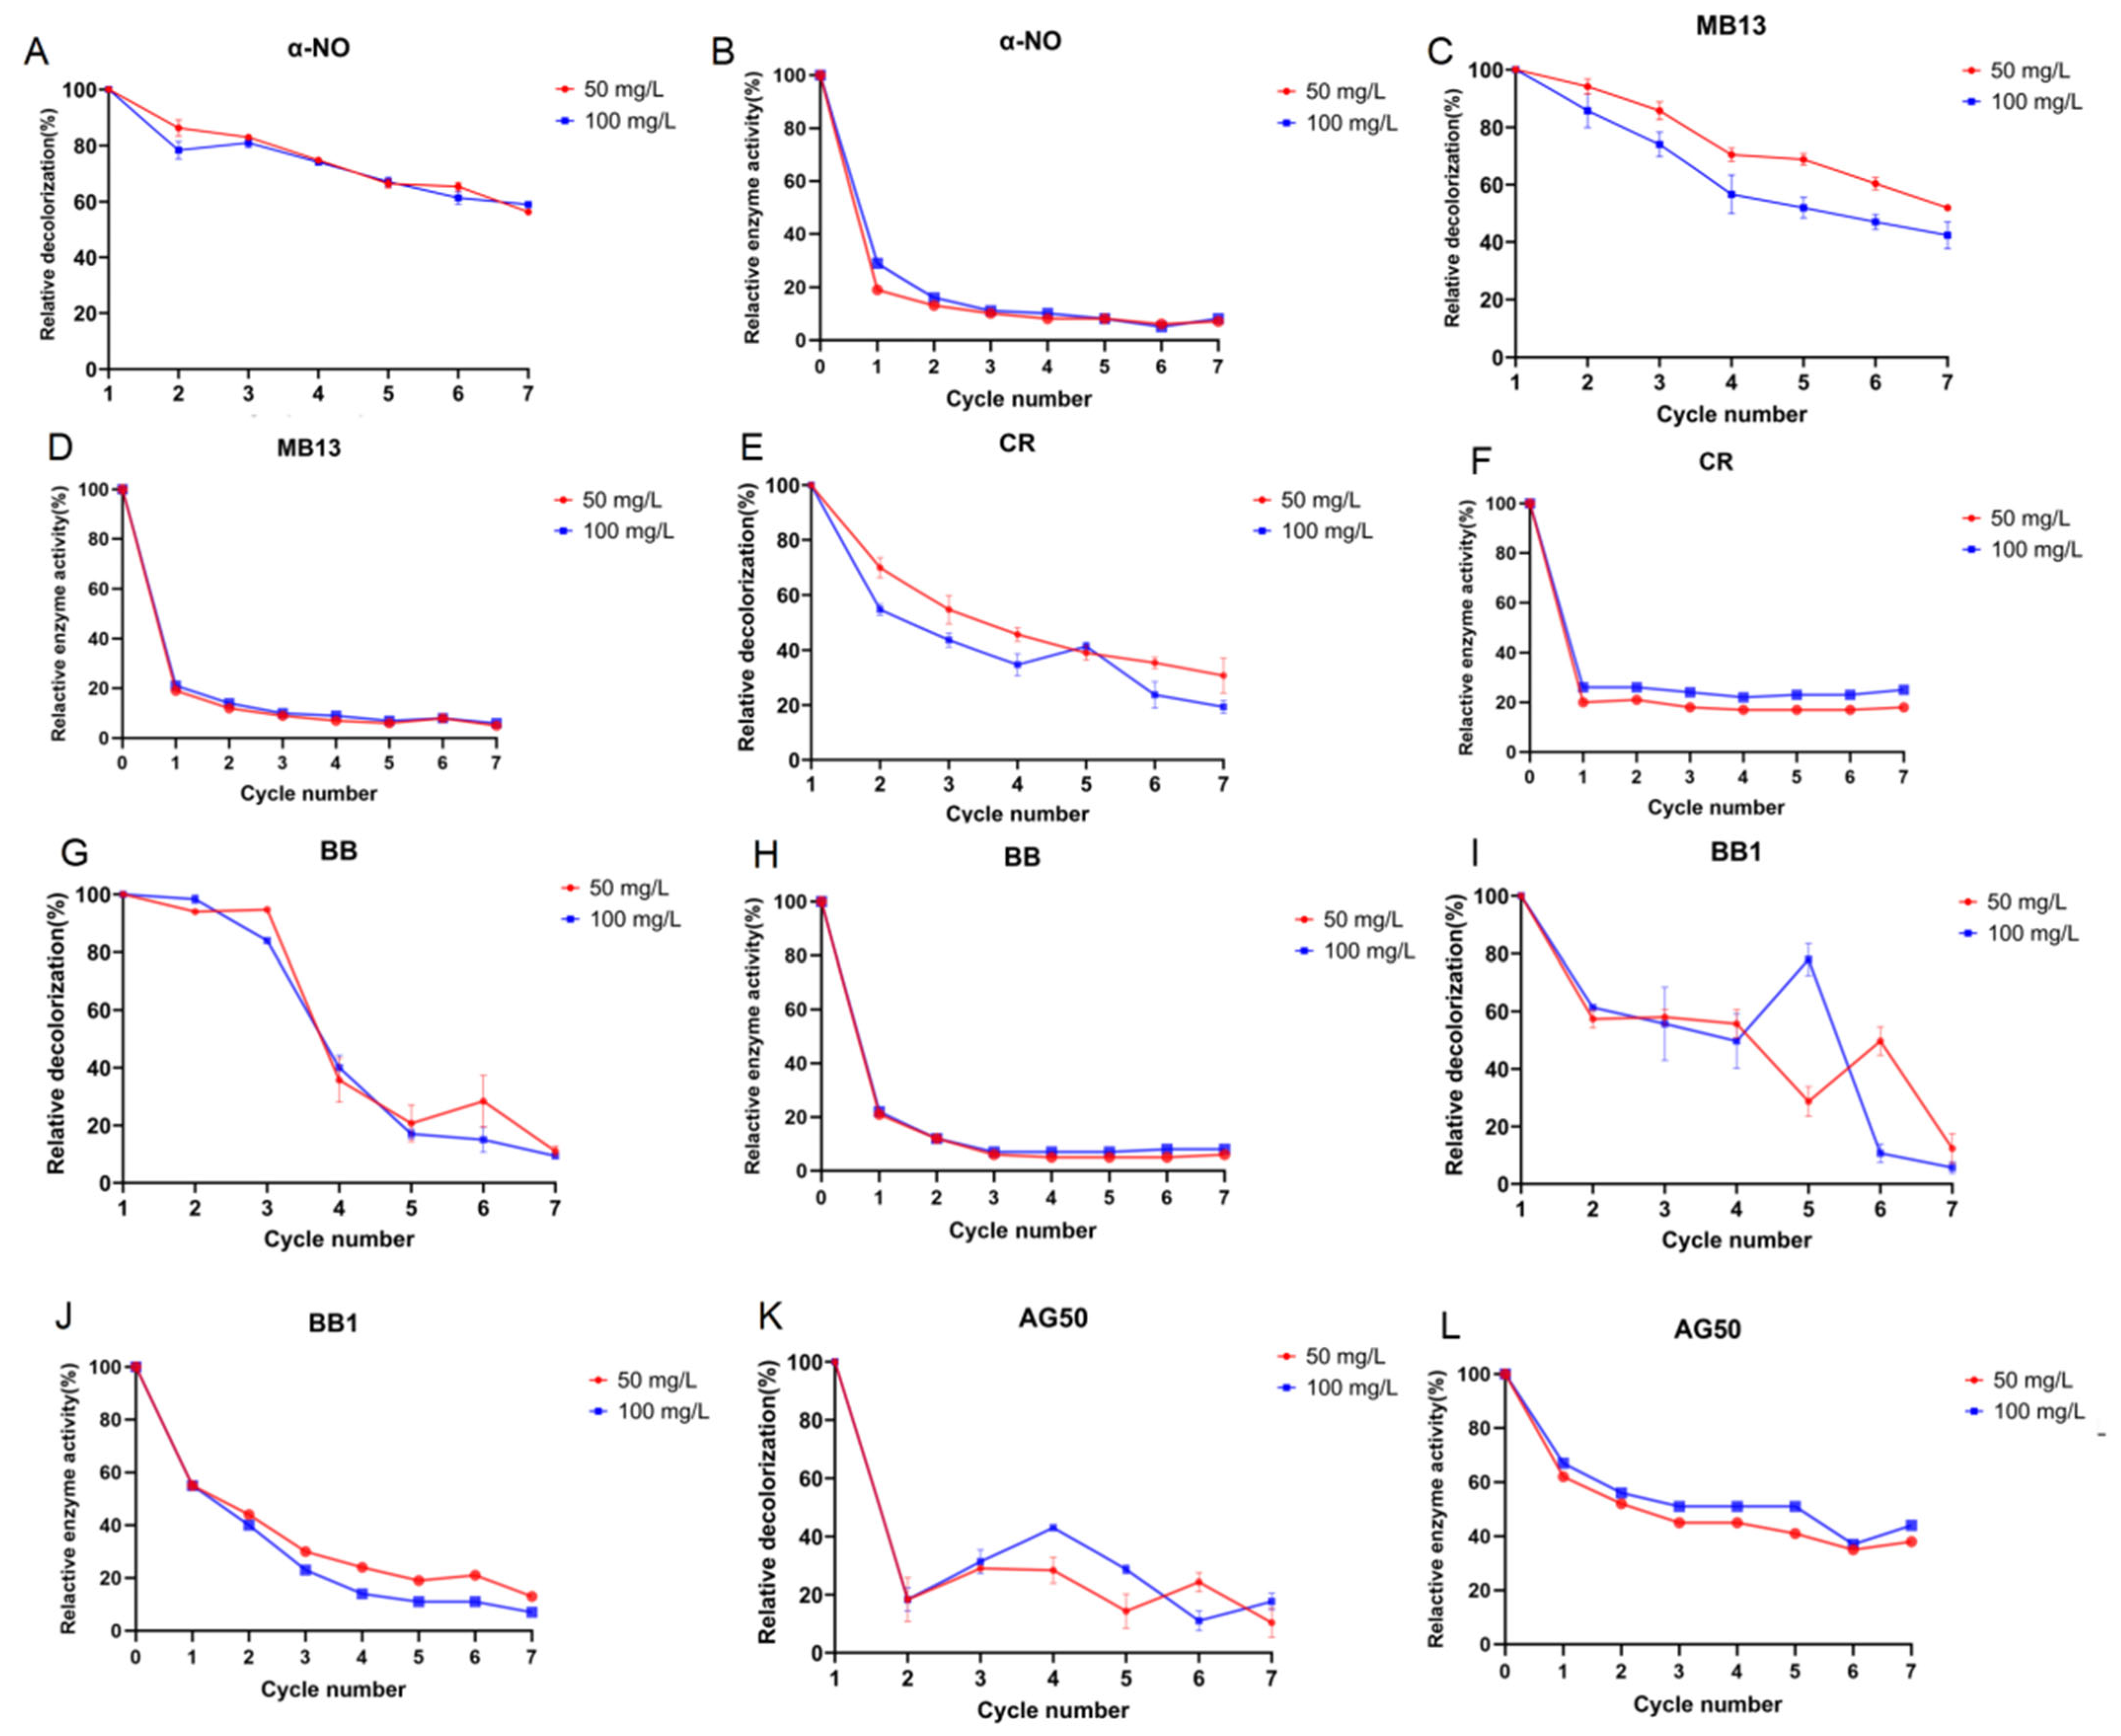
Figure 6.
Continuous batch decolorization of various azo and triphenylmethane dyes using crude laccase at 30 °C. (A): The relative decolorization efficiency of crude laccase for azo dye α-NO over 7 consecutive 24 h batch decolorization rounds. (B): The relative laccase activity of crude laccase in the decolorization of azo dye α-NO across 7 consecutive 24 h batches. (C): The relative decolorization efficiency of crude laccase for azo dye MB13 over 7 consecutive 24 h batch decolorization rounds. (D): The relative laccase activity of crude laccase in the decolorization of azo dye MB13 across 7 consecutive 24 h batches. (E): The relative decolorization efficiency of crude laccase for triphenylmethane dye CR over 7 consecutive 24 h batch decolorization rounds. (F): The relative laccase activity of crude laccase in the decolorization of triphenylmethane dye CR across 7 consecutive 24 h batches. (G): The relative decolorization efficiency of crude laccase for triphenylmethane dye BB over 7 consecutive 24 h batch decolorization rounds. (H): The relative laccase activity of crude laccase in the decolorization of triphenylmethane dye BB across 7 consecutive 24 h batches. (I): The relative decolorization efficiency of crude laccase for triphenylmethane dye BB1 over 7 consecutive 24 h batch decolorization rounds. (J): The relative laccase activity of crude laccase in the decolorization of triphenylmethane dye BB1 across 7 consecutive 24 h batches. (K): The relative decolorization efficiency of crude laccase for triphenylmethane dye AG50 over 7 consecutive 24 h batch decolorization rounds. (L): The relative laccase activity of crude laccase in the decolorization of triphenylmethane dye AG50 across 7 consecutive 24 h batches.
![Ijms 26 08363 g006 Ijms 26 08363 g006]()
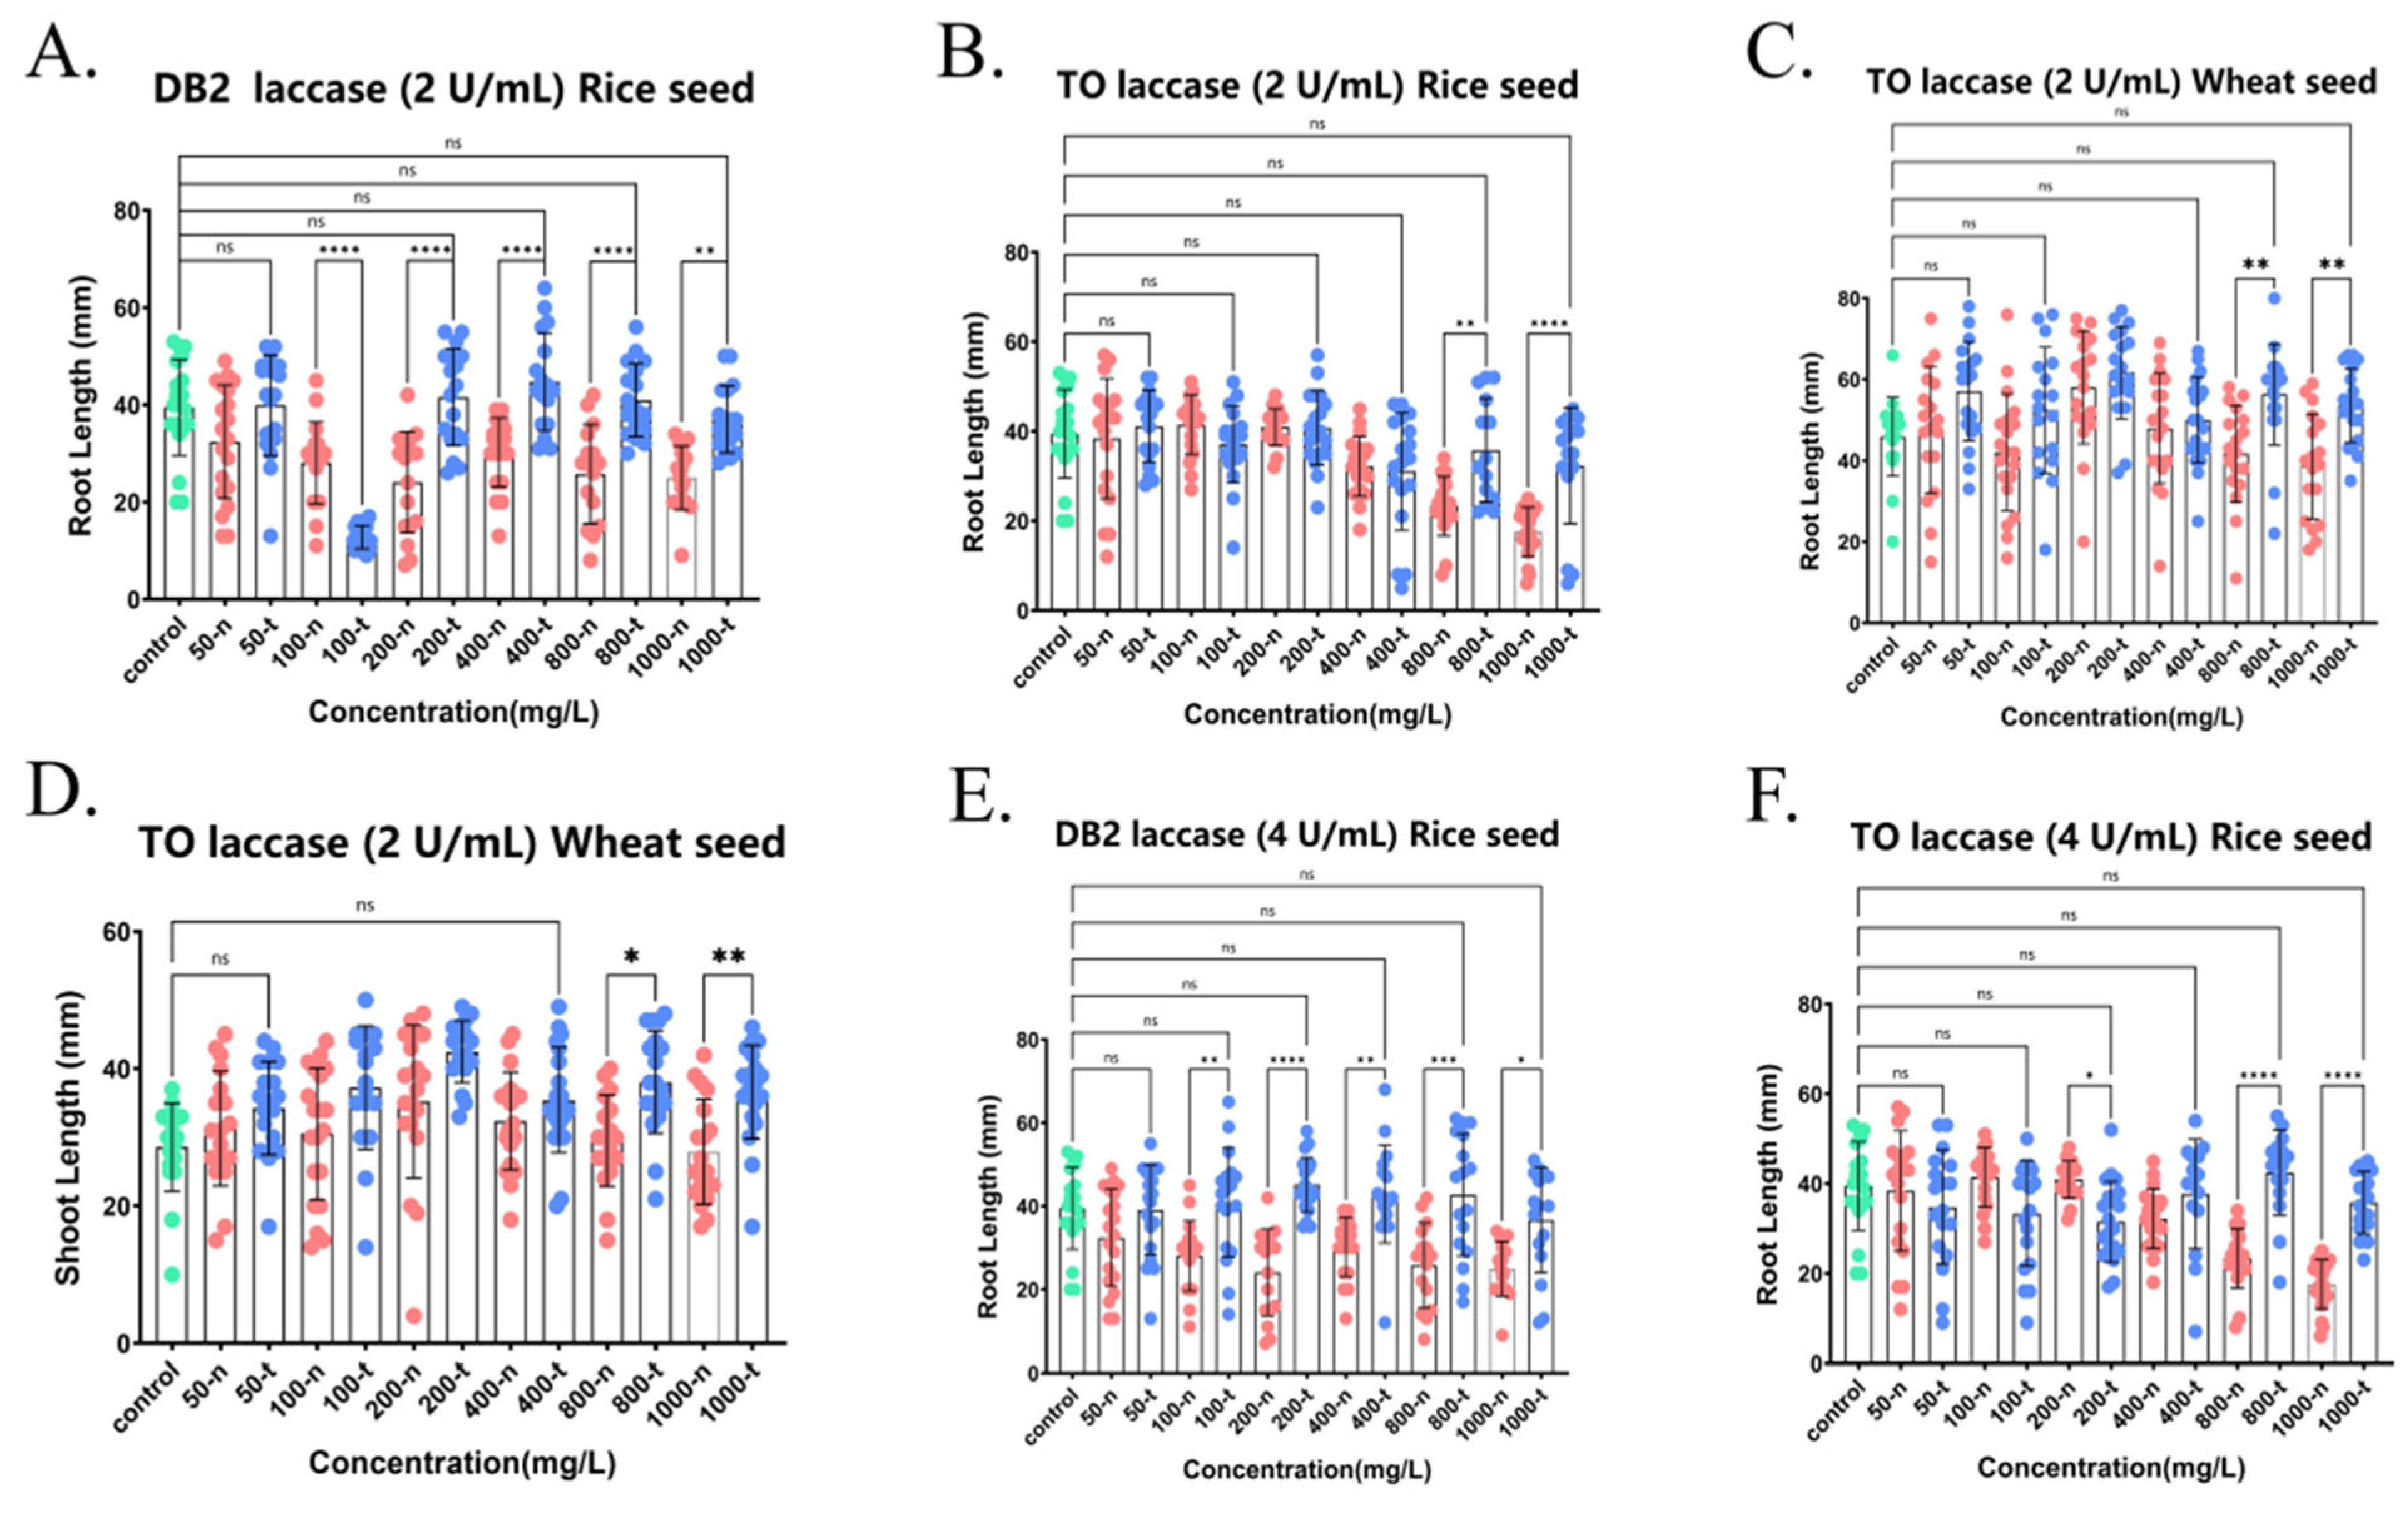
Figure 7.
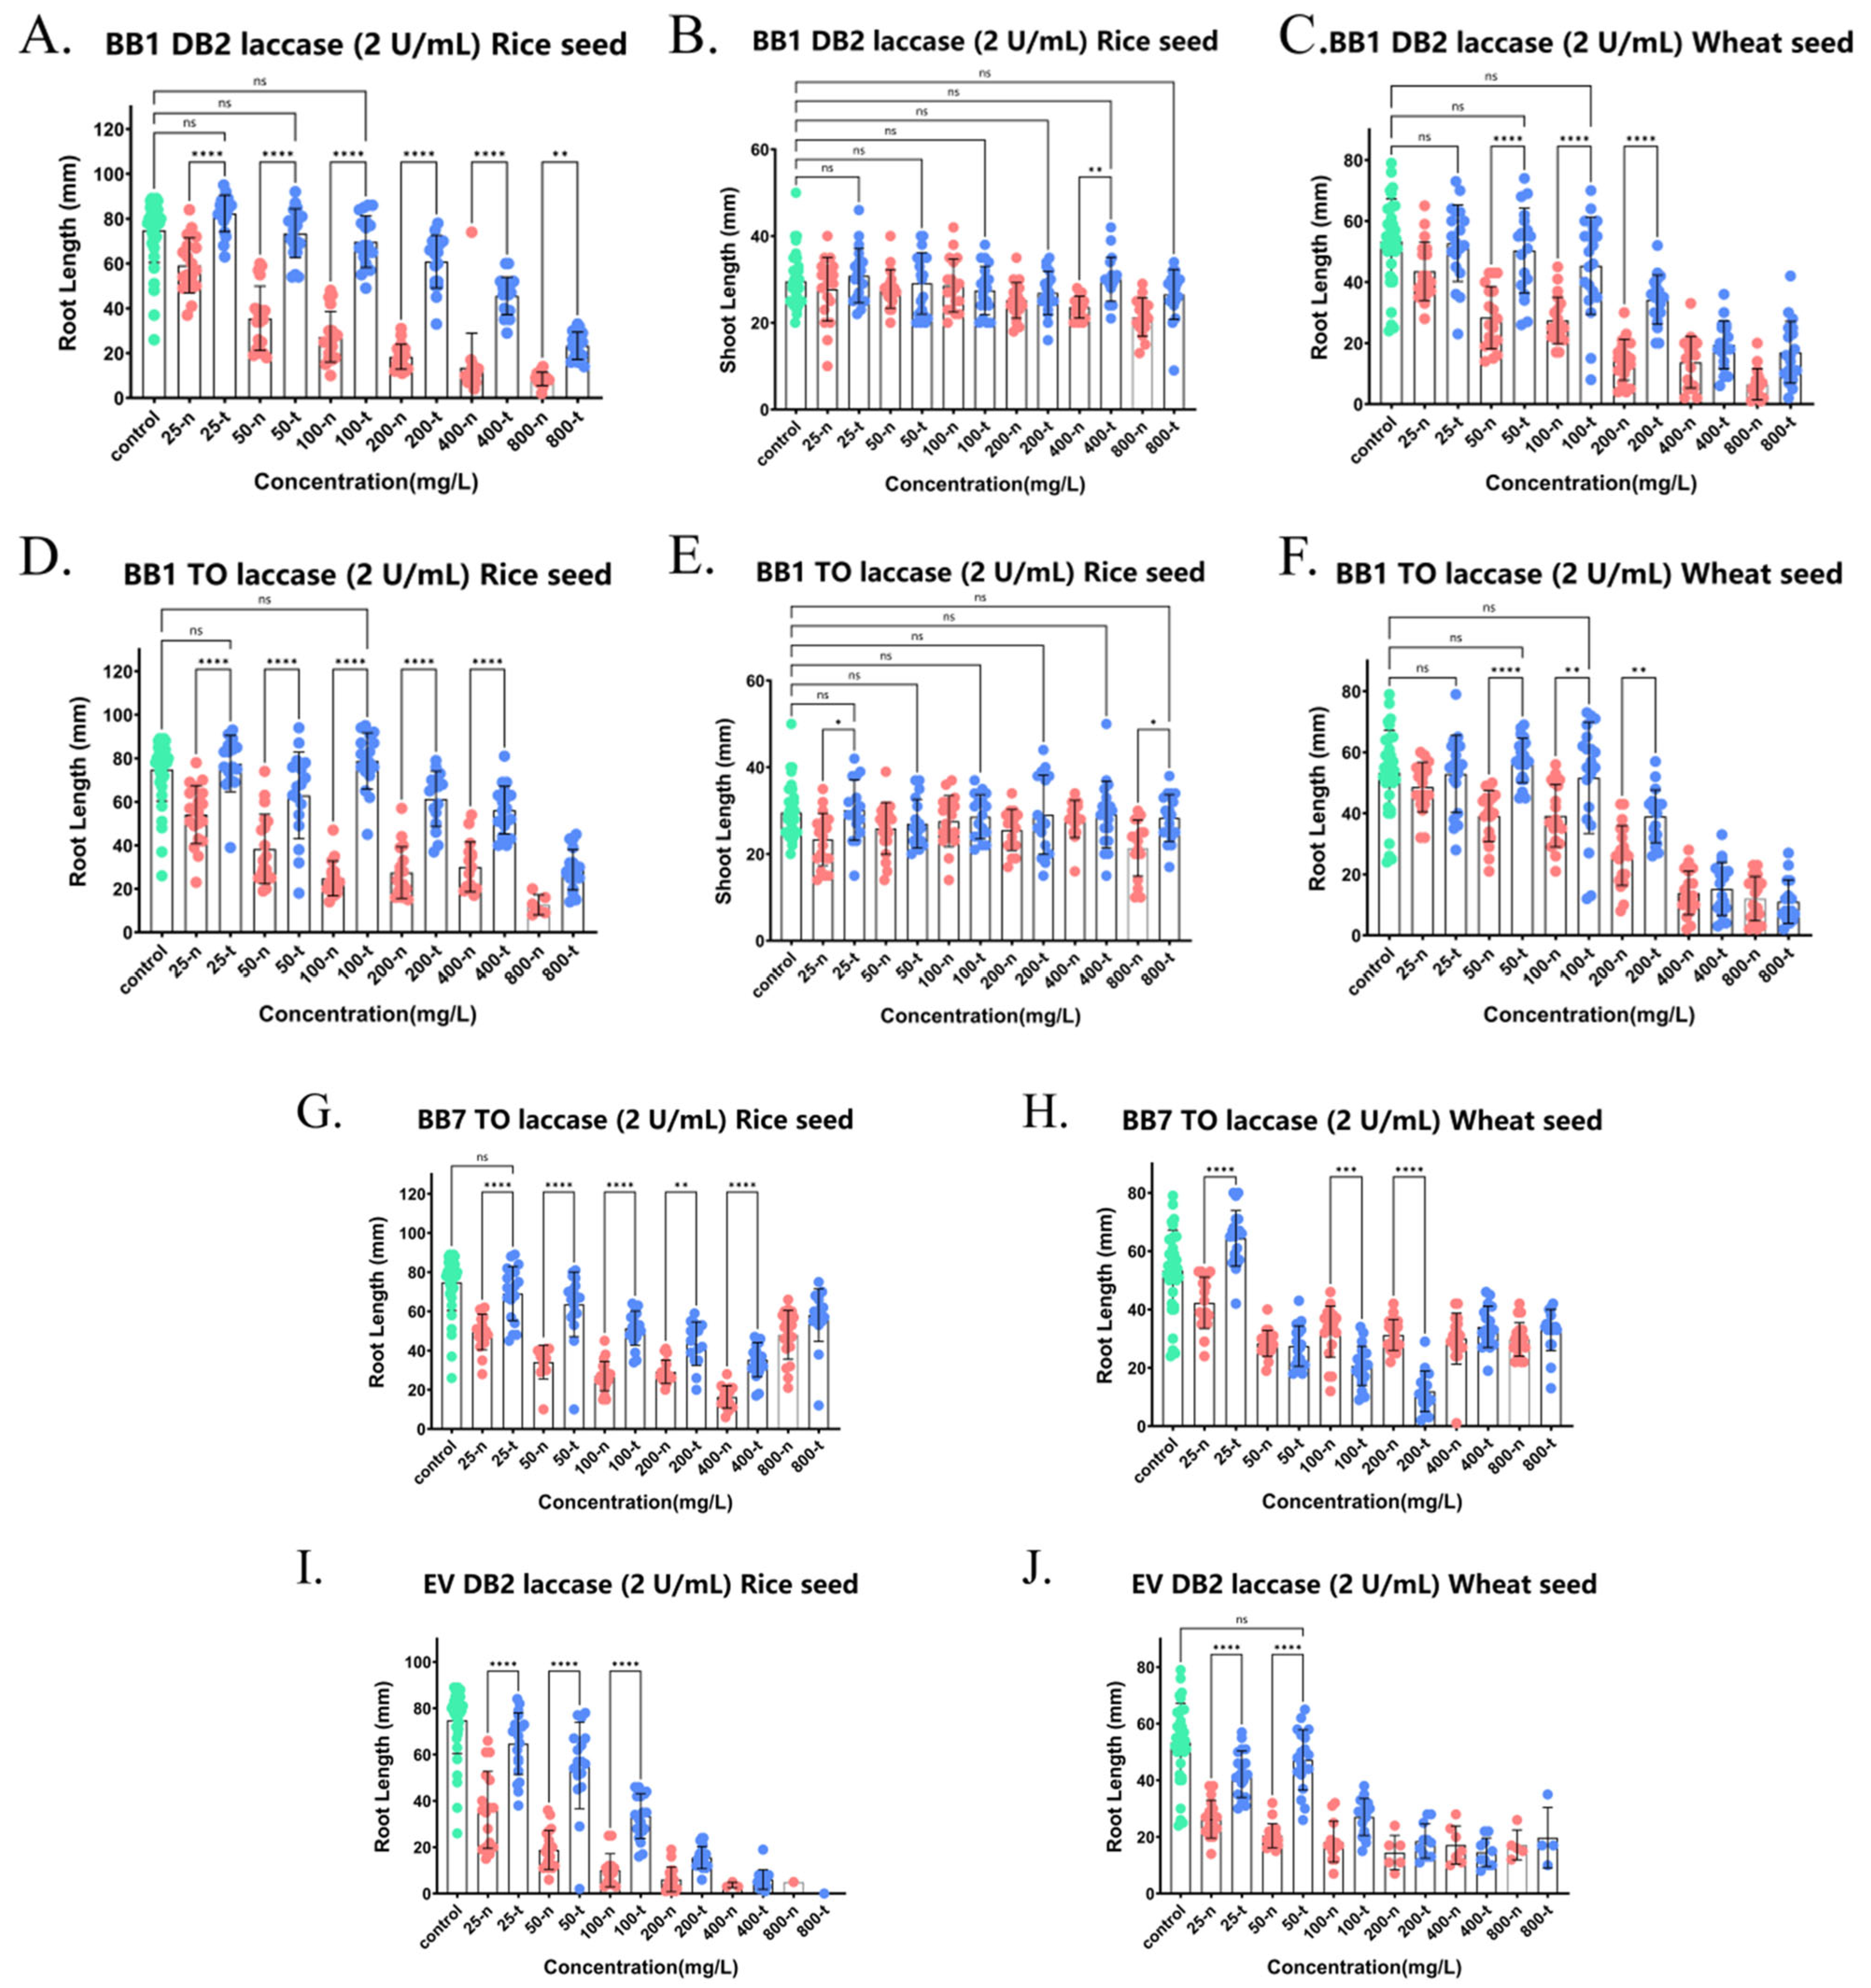
Detoxification of phytotoxicity of various azo dyes, DB2 and TO, by crude laccase (2 U/mL, 4 U/mL). (A). Effects of DB2 not treated by 2 U/mL crude laccase and DB2 treated by 2 U/mL crude laccase on the root growth of rice seeds. (B). Effects of TO not treated by 2 U/mL crude laccase and TO treated by 2 U/mL crude laccase on the root growth of rice seeds. (C). Effects of TO not treated by 2 U/mL crude laccase and TO treated by 2 U/mL crude laccase on the root growth of wheat seeds. (D). Effects of TO not treated by 2 U/mL crude laccase and TO treated by 2 U/mL crude laccase on the shoot growth of wheat seeds. (E). Effects of DB2 not treated by 4 U/mL crude laccase and DB2 treated by 4 U/mL crude laccase on the root growth of rice seeds. (F). Effects of TO not treated by 4 U/mL crude laccase and TO treated by 4 U/mL crude laccase on the root growth of rice seeds. ns meant no significant difference between groups, p > 0.05; * meant a significant difference between groups, p ≤ 0.05; ** meant a highly significant difference between groups, p ≤ 0.01; *** meant an extremely significant difference between groups, p ≤ 0.001; and **** meant an exceedingly significant difference between groups, p ≤ 0.0001. Green dots represents the blank control group. Red dots represents the control group (with dye, no crude laccase). Blue dots represents the experimental group (with both dye and crude laccase).
![Ijms 26 08363 g007 Ijms 26 08363 g007]()
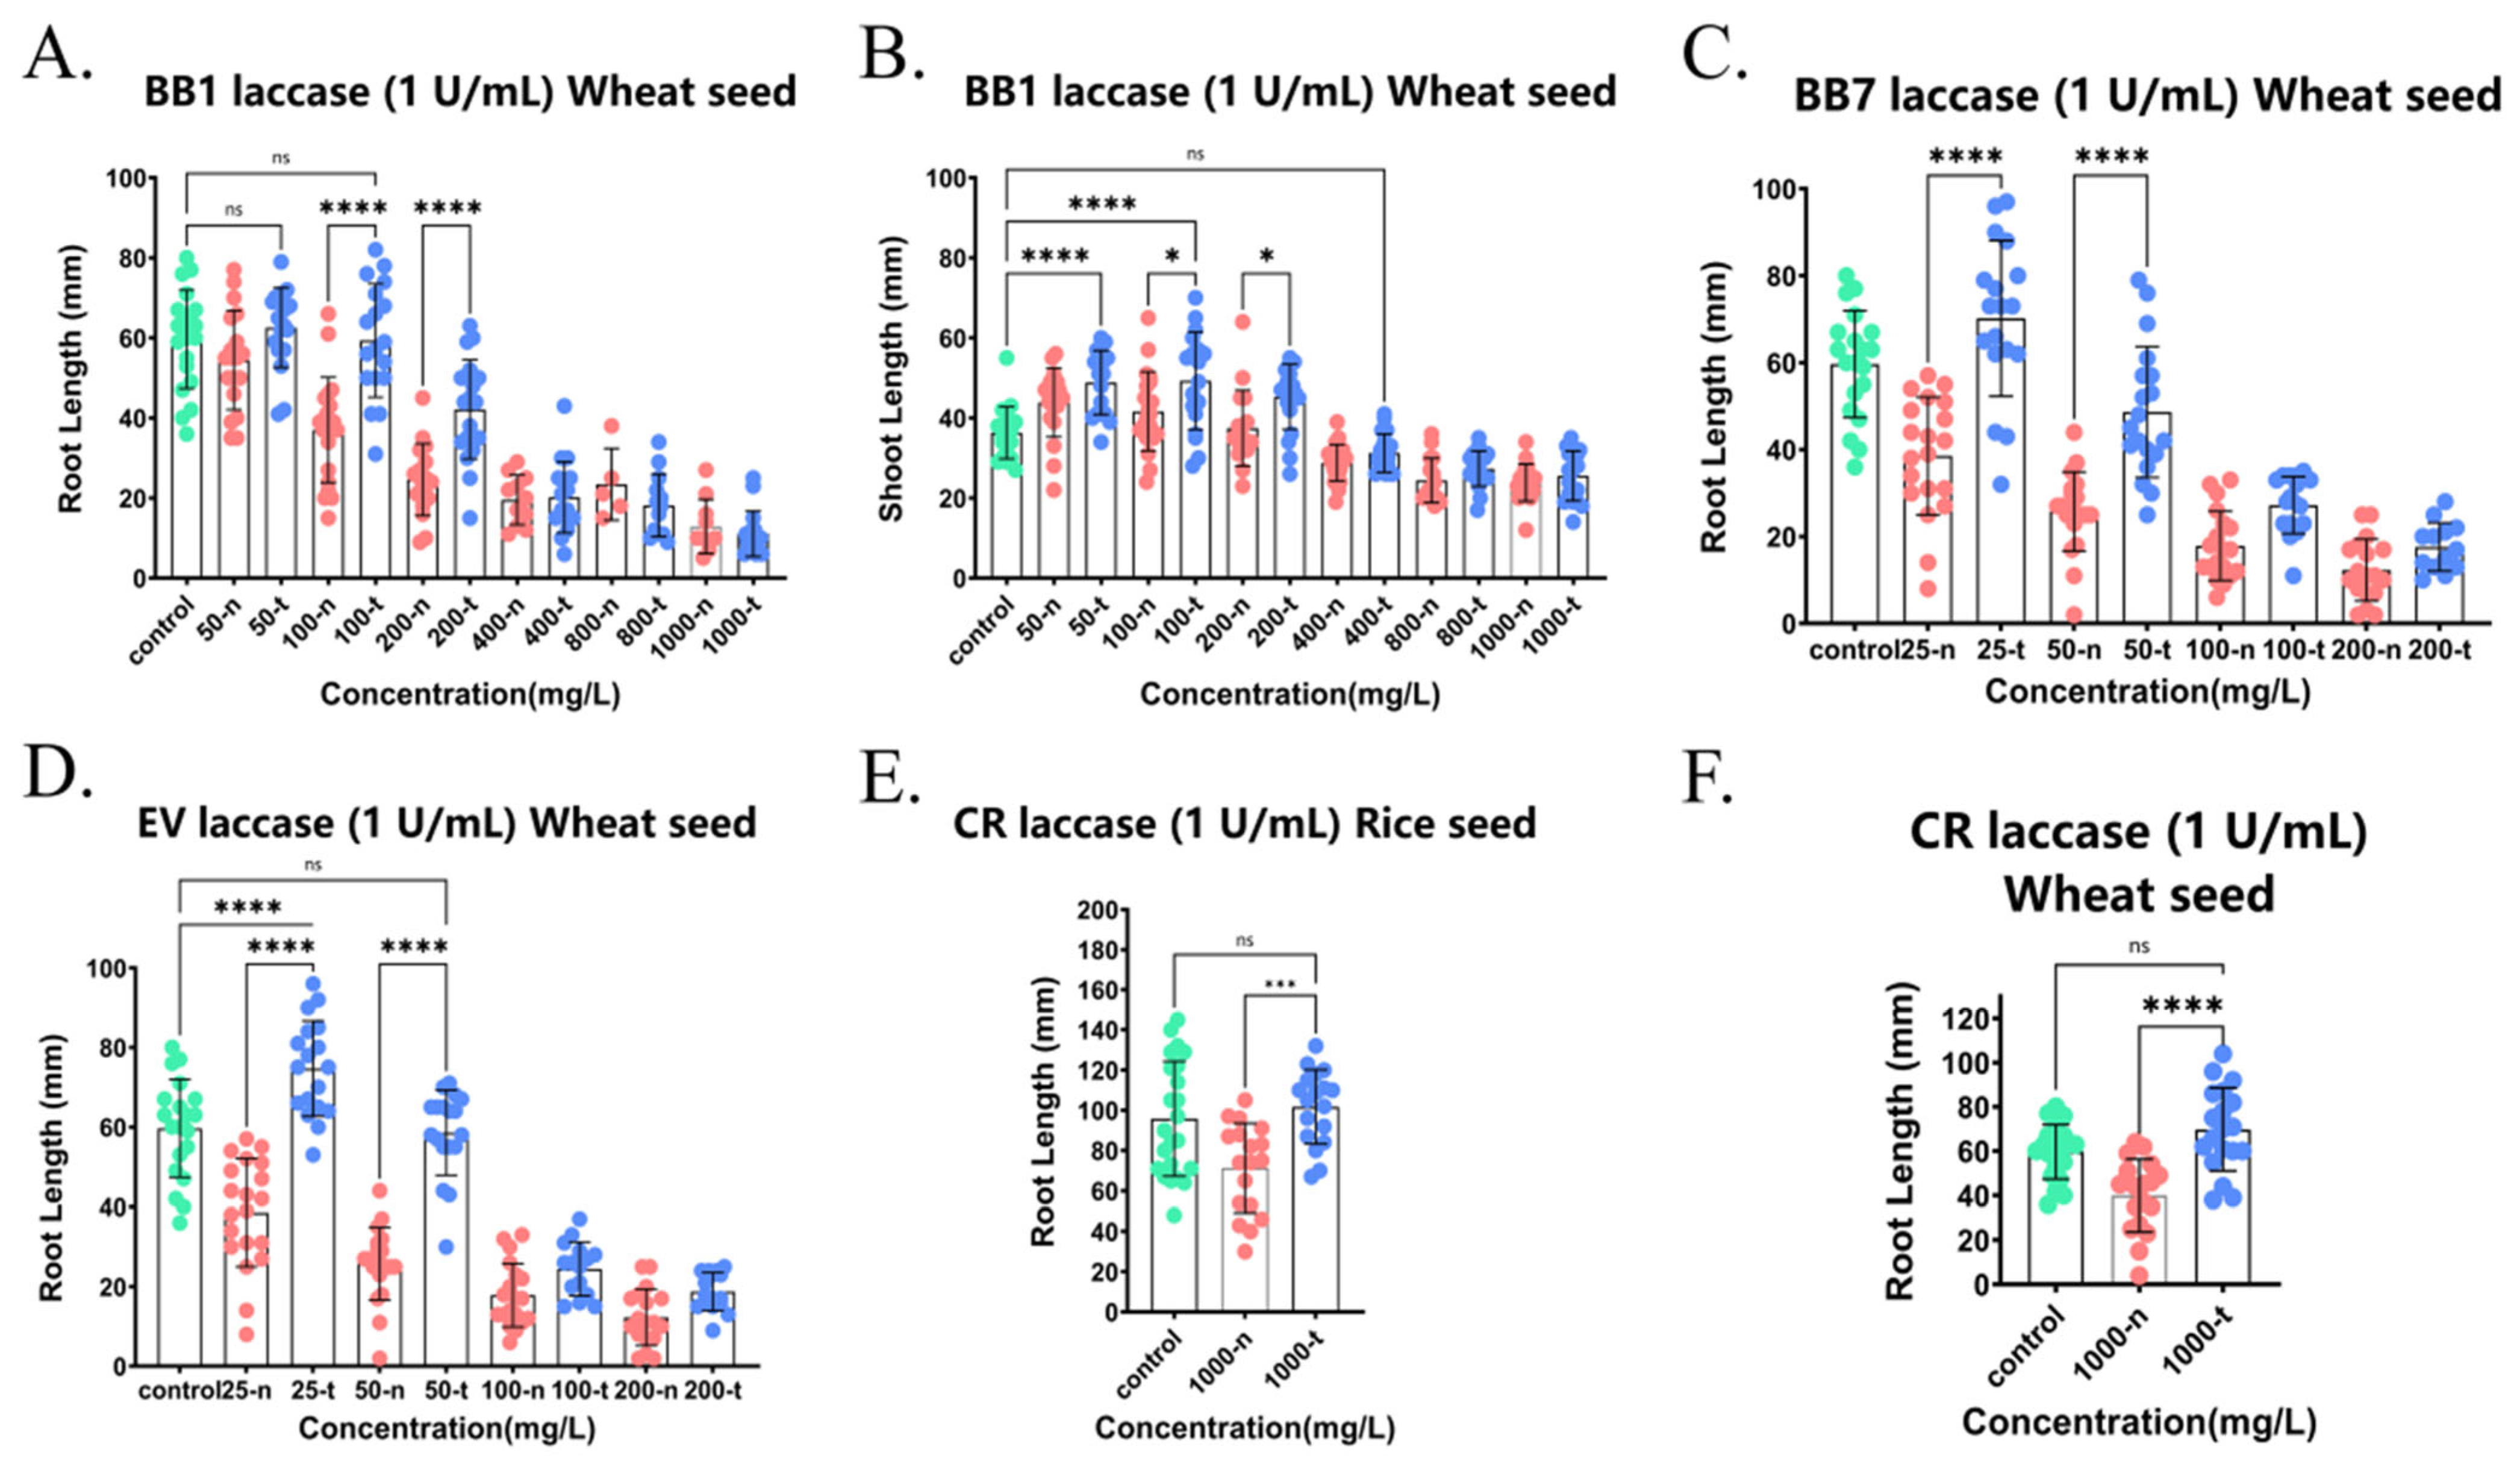
Figure 8.
Detoxification of phytotoxicity of various triphenylmethane dyes BB1, BB7, EV, and CR by crude laccase (1 U/mL). (A). Effects of BB1 not treated by 1 U/mL crude laccase and BB1 treated by 1 U/mL crude laccase on the root growth of wheat seeds. (B). Effects of BB1 not treated by 1 U/mL crude laccase and BB1 treated by 1 U/mL crude laccase on the shoot growth of wheat seeds. (C). Effects of BB7 not treated by 1 U/mL crude laccase and BB7 treated by 1 U/mL crude laccase on the root growth of wheat seeds. (D). Effects of EV not treated by 1 U/mL crude laccase and EV treated by 1 U/mL crude laccase on the root growth of wheat seeds. (E). Effects of CR not treated by 1 U/mL crude laccase and CR treated by 1 U/mL crude laccase on the root growth of rice seeds. (F). Effects of CR not treated by 1 U/mL crude laccase and CR treated by 1 U/mL crude laccase on the root growth of wheat seeds. ns meant no significant difference between groups, p > 0.05; * meant a significant difference between groups, p ≤ 0.05; *** meant an extremely significant difference between groups, p ≤ 0.001; and **** meant an exceedingly significant difference between groups, p ≤ 0.0001. Green dots represents the blank control group. Red dots represents the control group (with dye, no crude laccase). Blue dots represents the experimental group (with both dye and crude laccase).
![Ijms 26 08363 g008 Ijms 26 08363 g008]()
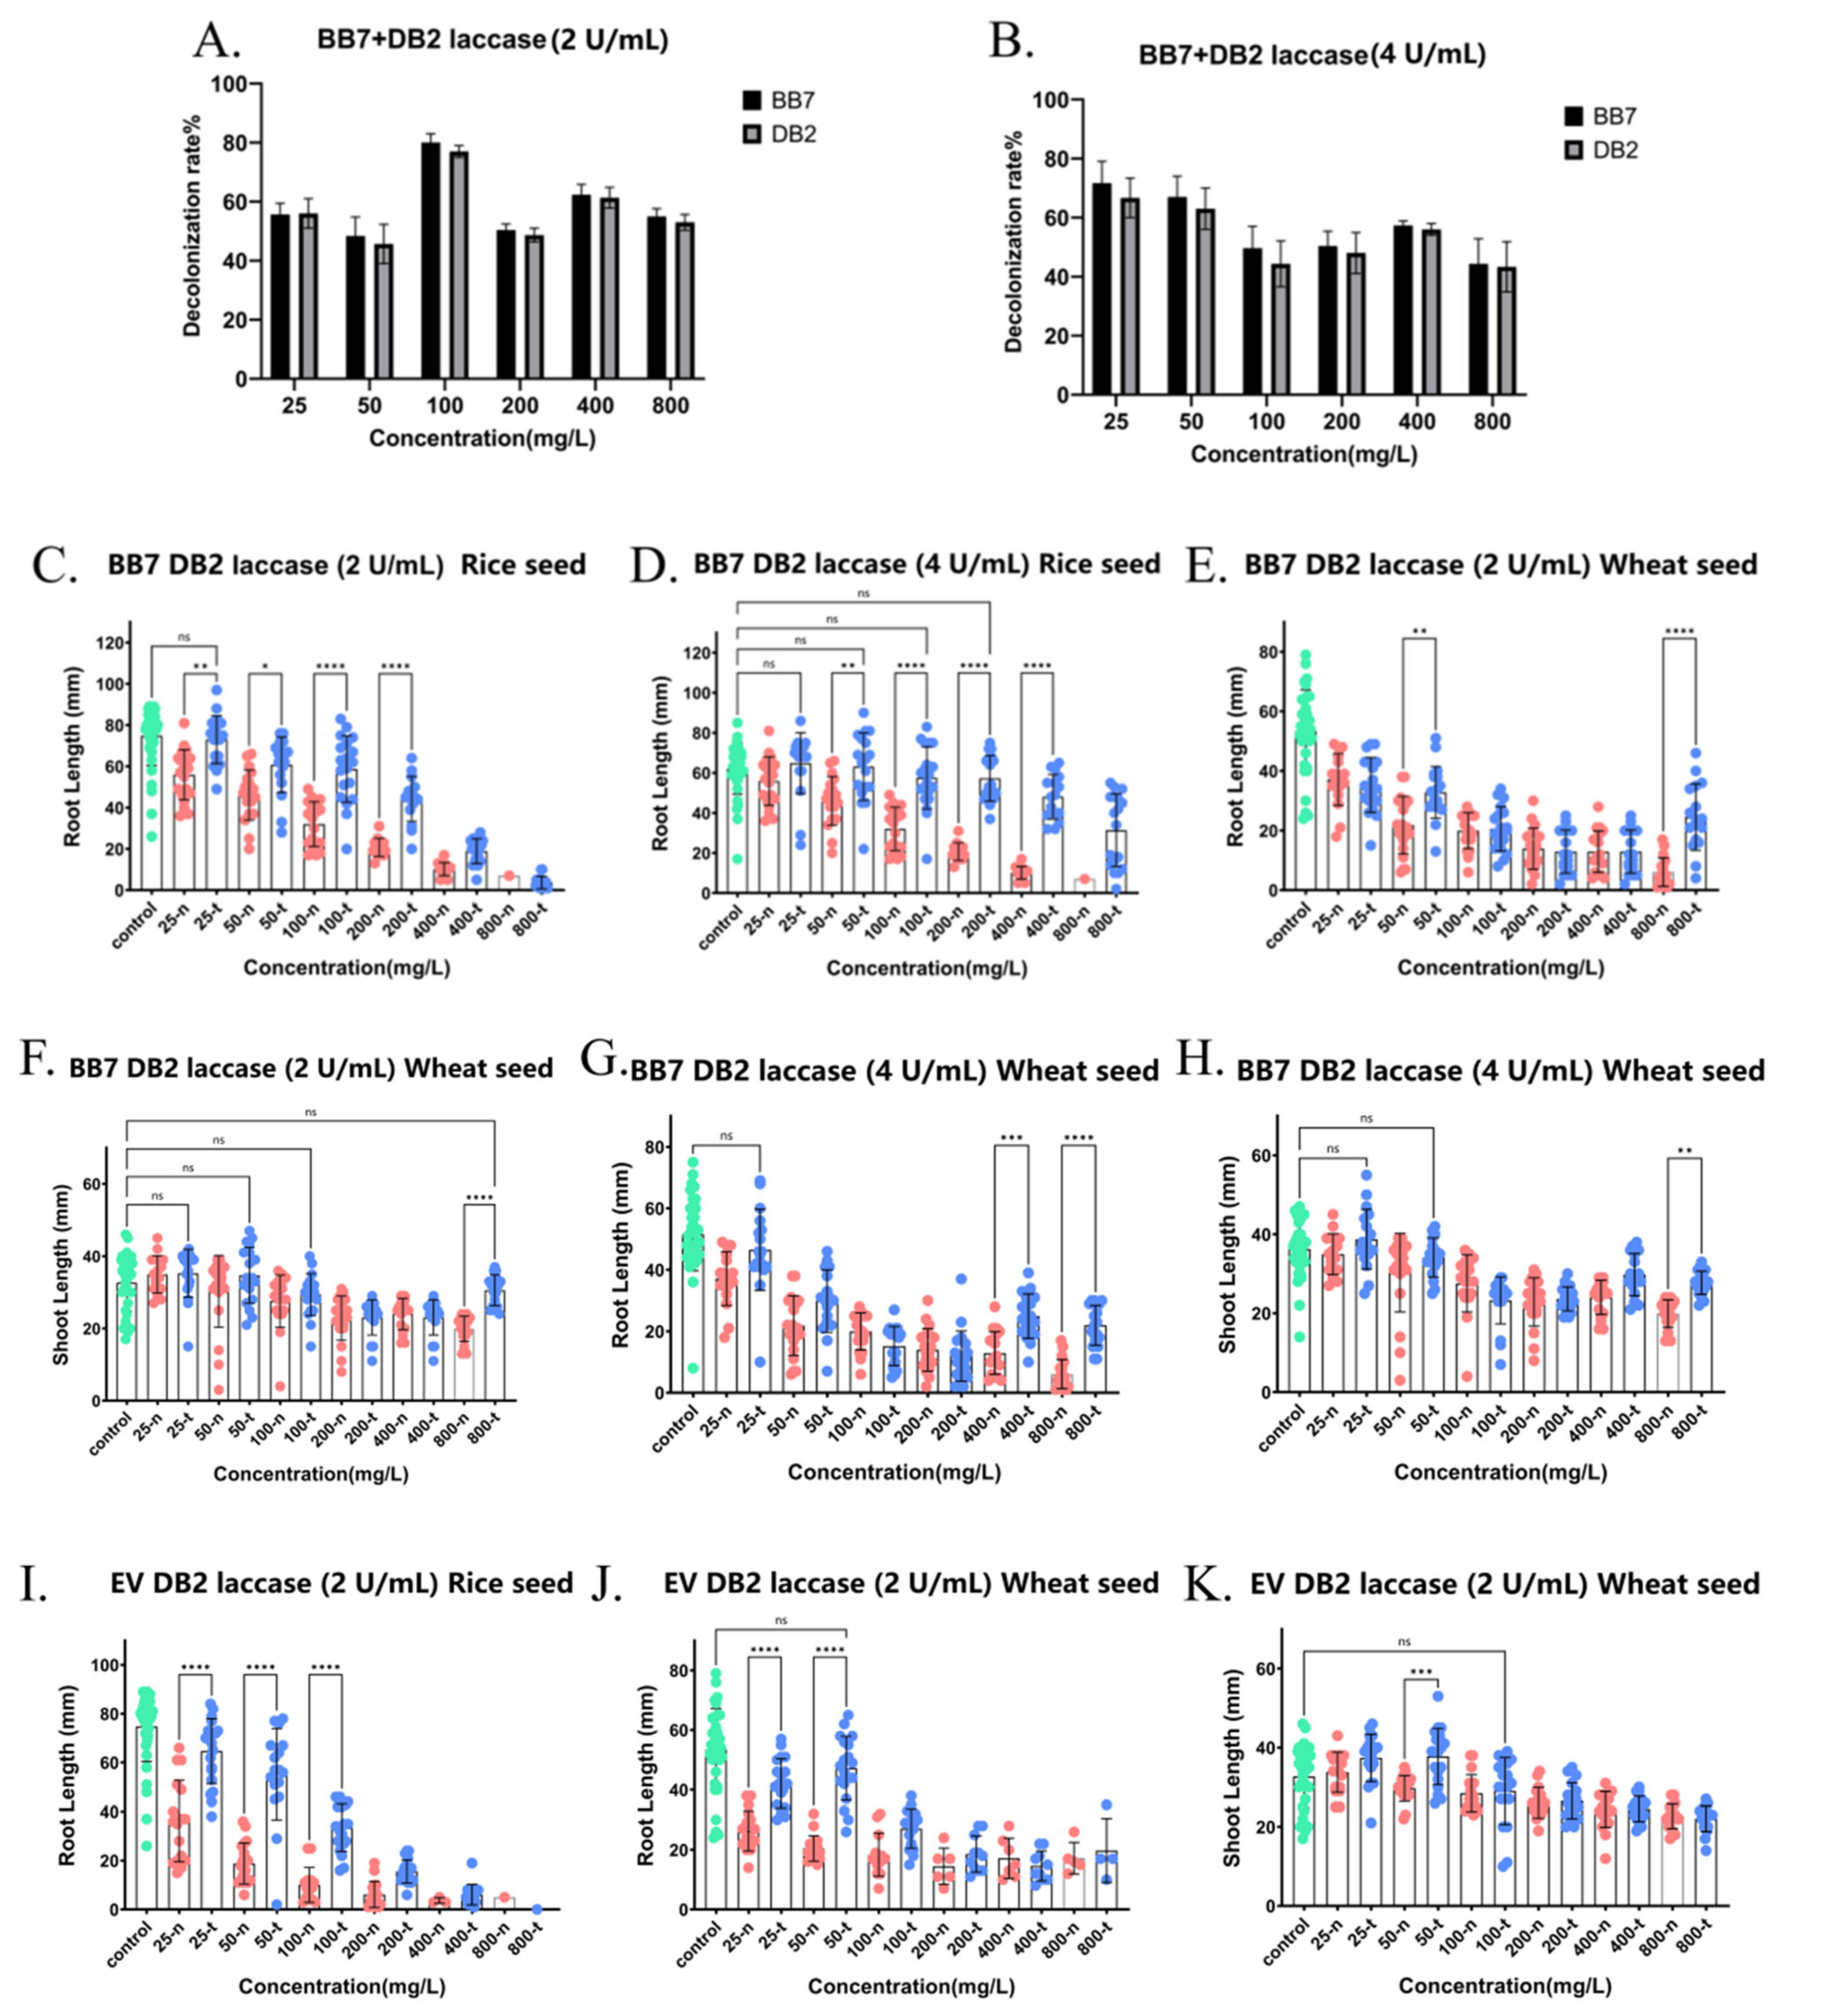
Figure 9.
Detoxification of phytotoxicity of mixtures of two dyes (azo dye + triphenylmethane dye, BB7 + DB2, EV + DB2, EV + TO) by crude laccase. (A). 24 h decolorization efficiencies for BB7 + DB2 mixture at varying concentrations treated with 2 U/mL crude laccase. (B). 24 h decolorization efficiencies for BB7 + DB2 mixture at varying concentrations treated with 4 U/mL crude laccase. (C). Effects of BB7 + DB2 not treated by 2 U/mL crude laccase and BB7 + DB2 treated by 2 U/mL crude laccase on the root growth of rice seeds. (D). Effects of BB7 + DB2 not treated by 4 U/mL crude laccase and BB7 + DB2 treated by 4 U/mL crude laccase on the root growth of rice seeds. (E). Effects of BB7 + DB2 not treated by 2 U/mL crude laccase and BB7 + DB2 treated by 2 U/mL crude laccase on the root growth of wheat seeds. (F). Effects of BB7 + DB2 not treated by 2 U/mL crude laccase and BB7 + DB2 treated by 2 U/mL crude laccase on shoot growth of wheat seeds. (G). Effects of BB7 + DB2 not treated by 4 U/mL crude laccase and BB7 + DB2 treated by 4 U/mL crude laccase on root growth of wheat seeds. (H). Effects of BB7 + DB2 not treated by 4 U/mL crude laccase and BB7 + DB2 treated by 4 U/mL crude laccase on shoot growth of wheat seeds. (I). Effects of EV + DB2 not treated by 2 U/mL crude laccase and EV + DB2 treated by 2 U/mL crude laccase on root growth of rice seeds. (J). Effects of EV + DB2 not treated by 2 U/mL crude laccase and EV + DB2 treated by 2 U/mL crude laccase on root growth of wheat seeds. (K). Effects of EV + DB2 not treated by 2 U/mL crude laccase and EV + DB2 treated by 2 U/mL crude laccase on shoot growth of wheat seeds. (L). Effects of EV + DB2 not treated by 4 U/mL crude laccase and EV + DB2 treated by 4 U/mL crude laccase on root growth of rice seeds. (M). Effects of EV + DB2 not treated by 4 U/mL crude laccase and EV + DB2 treated by 4 U/mL crude laccase on shoot growth of wheat seeds. (N). Effects of EV + DB2 not treated by 4 U/mL crude laccase and EV + DB2 treated by 4 U/mL crude laccase on root growth of wheat seeds. (O). 24 h decolorization efficiencies for EV + TO mixture at varying concentrations treated with 2 U/mL crude laccase. (P). Effects of EV + TO not treated by 2 U/mL crude laccase and EV + TO treated by 2 U/mL crude laccase on root growth of wheat seeds. (Q). Effects of EV + TO not treated by 2 U/mL crude laccase and EV + TO treated by 2 U/mL crude laccase on shoot growth of rice seeds. (R). Effects of EV + TO not treated by 2 U/mL crude laccase and EV + TO treated by 2 U/mL crude laccase on root growth of rice seeds. xx-n: untreated by laccase. xx-t: treated by laccase. ns meant no significant difference between groups, p > 0.05; * meant a significant difference between groups, p ≤ 0.05; ** meant a highly significant difference between groups, p ≤ 0.01; *** meant an extremely significant difference between groups, p ≤ 0.001; and **** meant an exceedingly significant difference between groups, p ≤ 0.0001. Green dots represents the blank control group. Red dots represents the control group (with dye, no crude laccase). Blue dots represents the experimental group (with both dye and crude laccase).
![Ijms 26 08363 g009a Ijms 26 08363 g009a]()
![Ijms 26 08363 g009b Ijms 26 08363 g009b]()
Figure 10.
Detoxification of phytotoxicity of mixtures of two dye (azo dye + triphenylmethane dye, BB1 + DB2, BB1 + TO, BB7 + TO, EV + DB2) by crude laccase. (A). Effects of untreated BB1 + DB2 mixture and BB1 + DB2 mixture treated with 2 U/mL crude laccase on root growth of rice seeds. (B). Effects of untreated BB1 + DB2 mixture and BB1 + DB2 mixture treated with 2 U/mL crude laccase on shoot growth of rice seeds. (C). Effects of untreated BB1 + DB2 mixture and BB1 + DB2 mixture treated with 2 U/mL crude laccase extract on root growth of wheat seeds. (D). Effects of untreated BB1 + TO mixture and BB1 + TO mixture treated with 2 U/mL crude laccase on root growth of rice seeds. (E). Effects of untreated BB1 + TO mixture and BB1 + TO mixture treated with 2 U/mL crude laccase on shoot growth of rice seeds. (F). Effects of untreated BB1 + TO mixture and BB1 + TO mixture treated with 2 U/mL crude laccase on root growth of wheat seeds. (G). Effects of untreated BB7 + TO mixture and BB7 + TO mixture treated with 2 U/mL crude laccase extract on root growth of rice seeds. (H). Effects of untreated BB7 + TO mixture and BB7 + TO mixture treated with 2 U/mL crude laccase on root growth of wheat seeds. (I). Effects of untreated EV + DB2 mixture and EV + DB2 mixture treated with 2 U/mL crude laccase on root growth of rice seeds. (J). Effects of untreated EV + DB2 mixture and EV + DB2 mixture treated with 2 U/mL crude laccase on root growth of wheat seeds. xx-n: untreated by laccase. xx-t: treated by laccase. ns meant no significant difference between groups, p > 0.05; * meant a significant difference between groups, p ≤ 0.05; ** meant a highly significant difference between groups, p ≤ 0.01; *** meant an extremely significant difference between groups, p ≤ 0.001; and **** meant an exceedingly significant difference between groups, p ≤ 0.0001. Green dots represents the blank control group. Red dots represents the control group (with dye, no crude laccase). Blue dots represents the experimental group (with both dye and crude laccase).
![Ijms 26 08363 g010 Ijms 26 08363 g010]()
Figure 11.
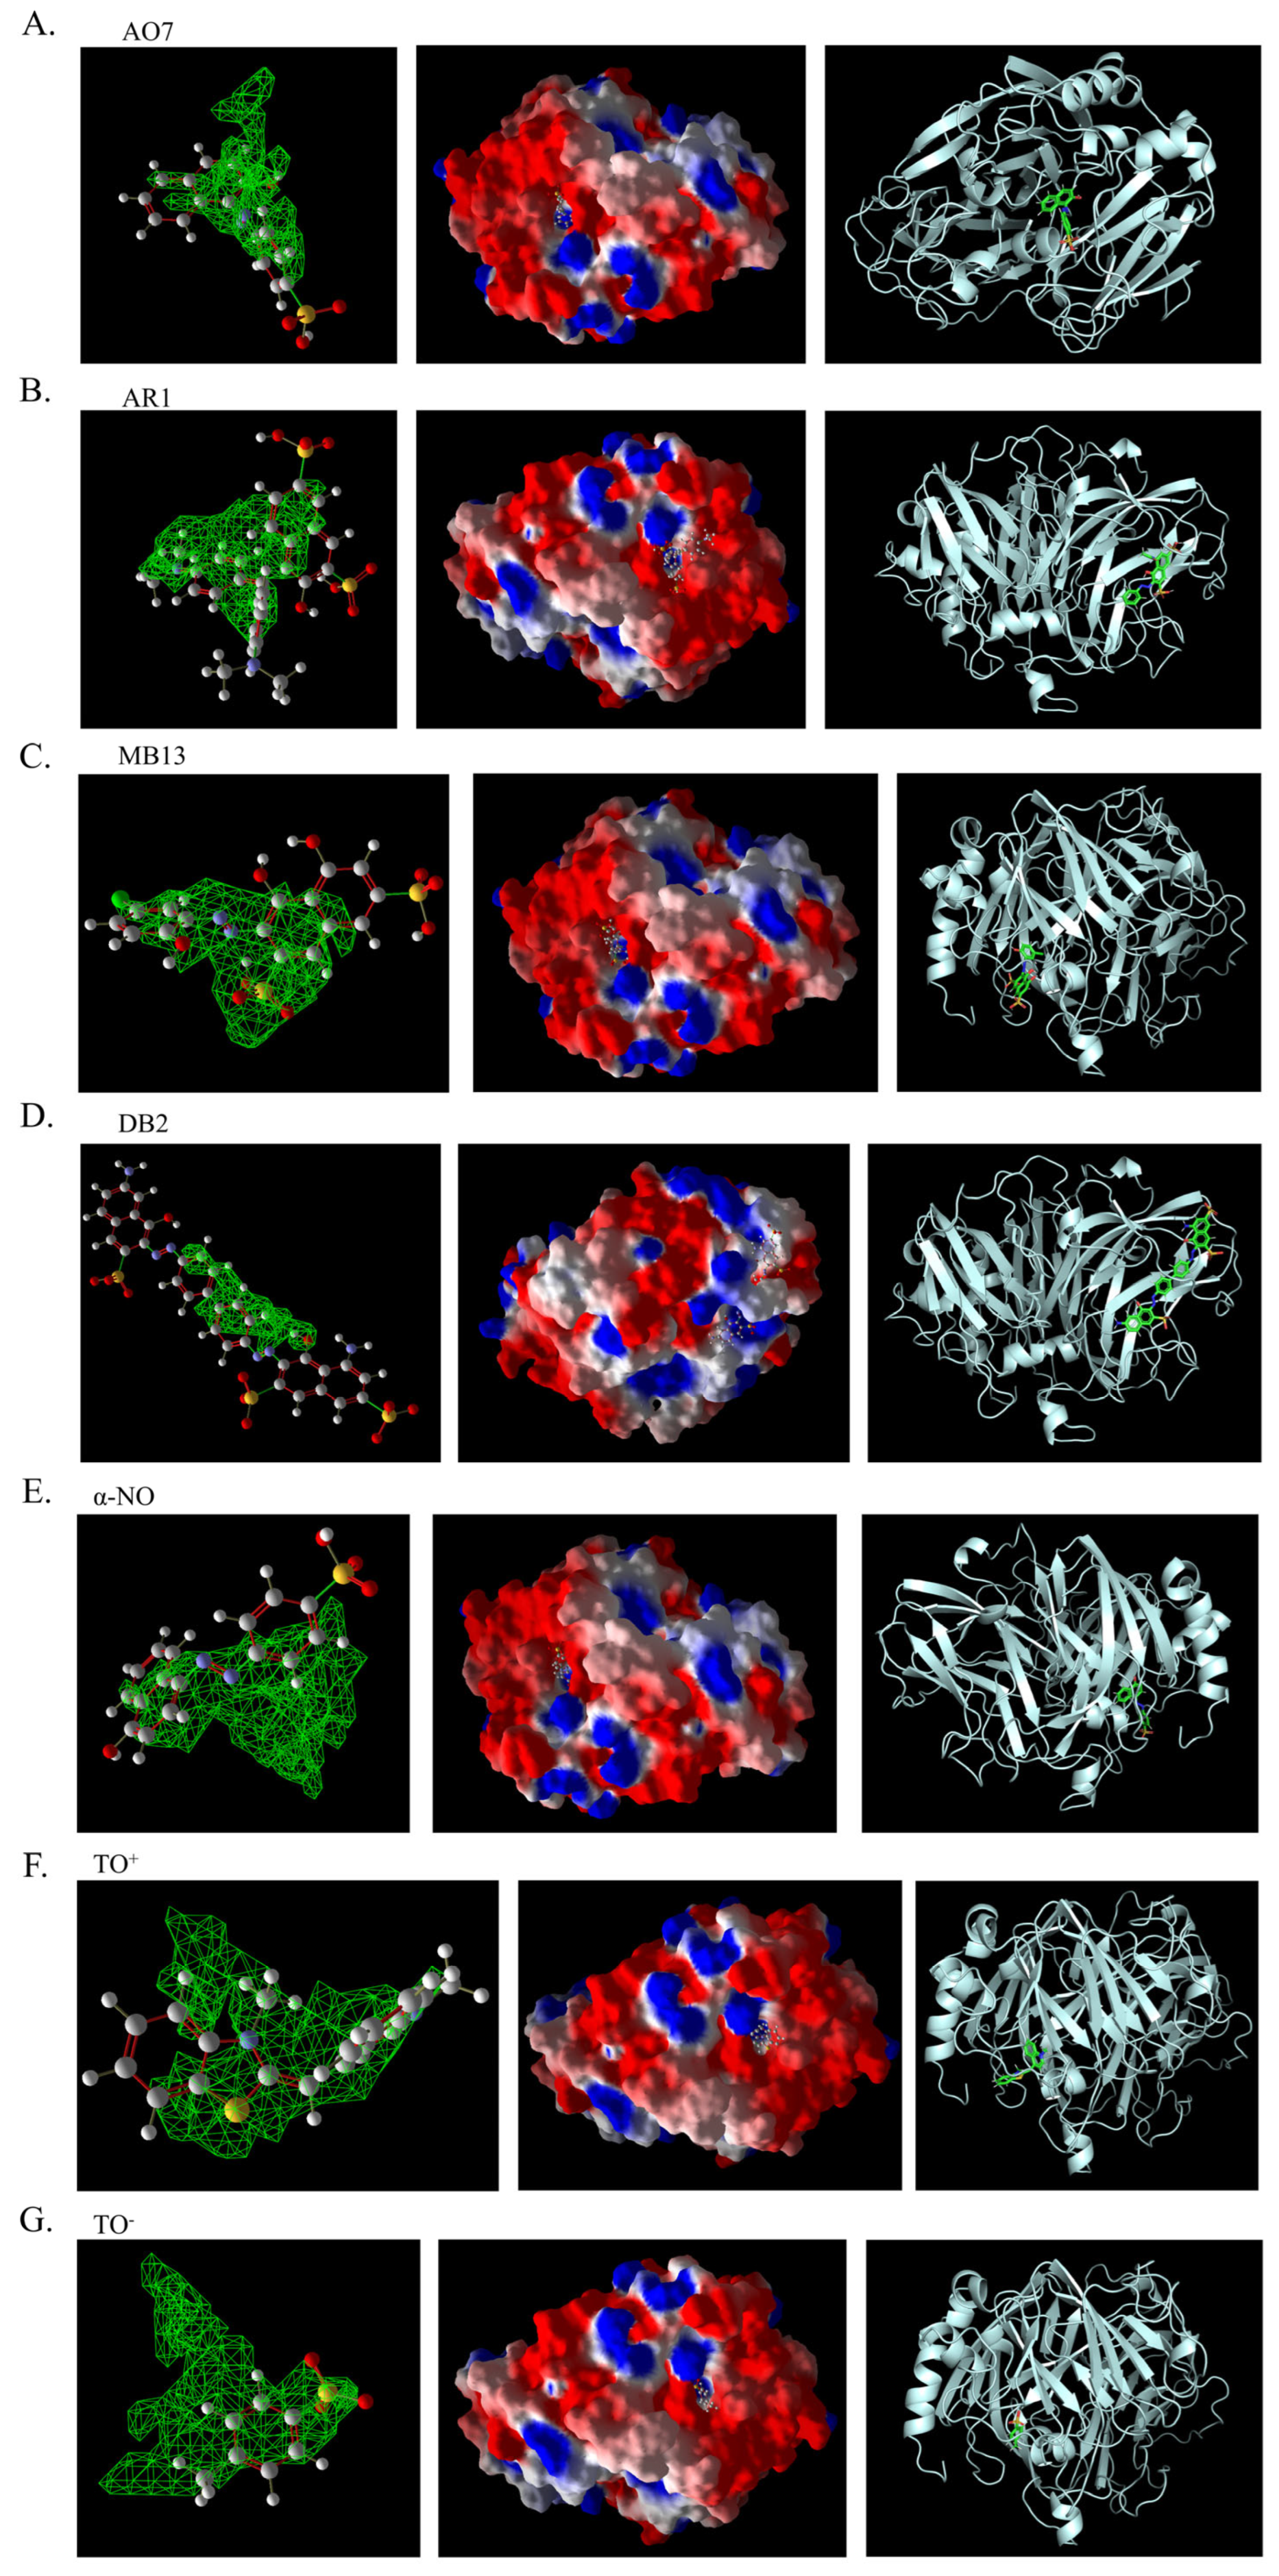
Three-dimensional structural images of molecular docking of different azo dyes and laccase using Molegro Virtual Docker (MVD). The first column is the 3D binding image of the dye ligand to the predicted binding pocket generated by MVD; the second column is the 3D binding image of the dye to the electrostatic surface of laccase generated by MVD; and the third column is the 3D binding image of the dye to laccase generated by PyMOL. (A). AO7. (B). AR1. (C). MB13. (D) DB2. (E). α-NO. (F). TO+. (G). TO-.
Figure 12.
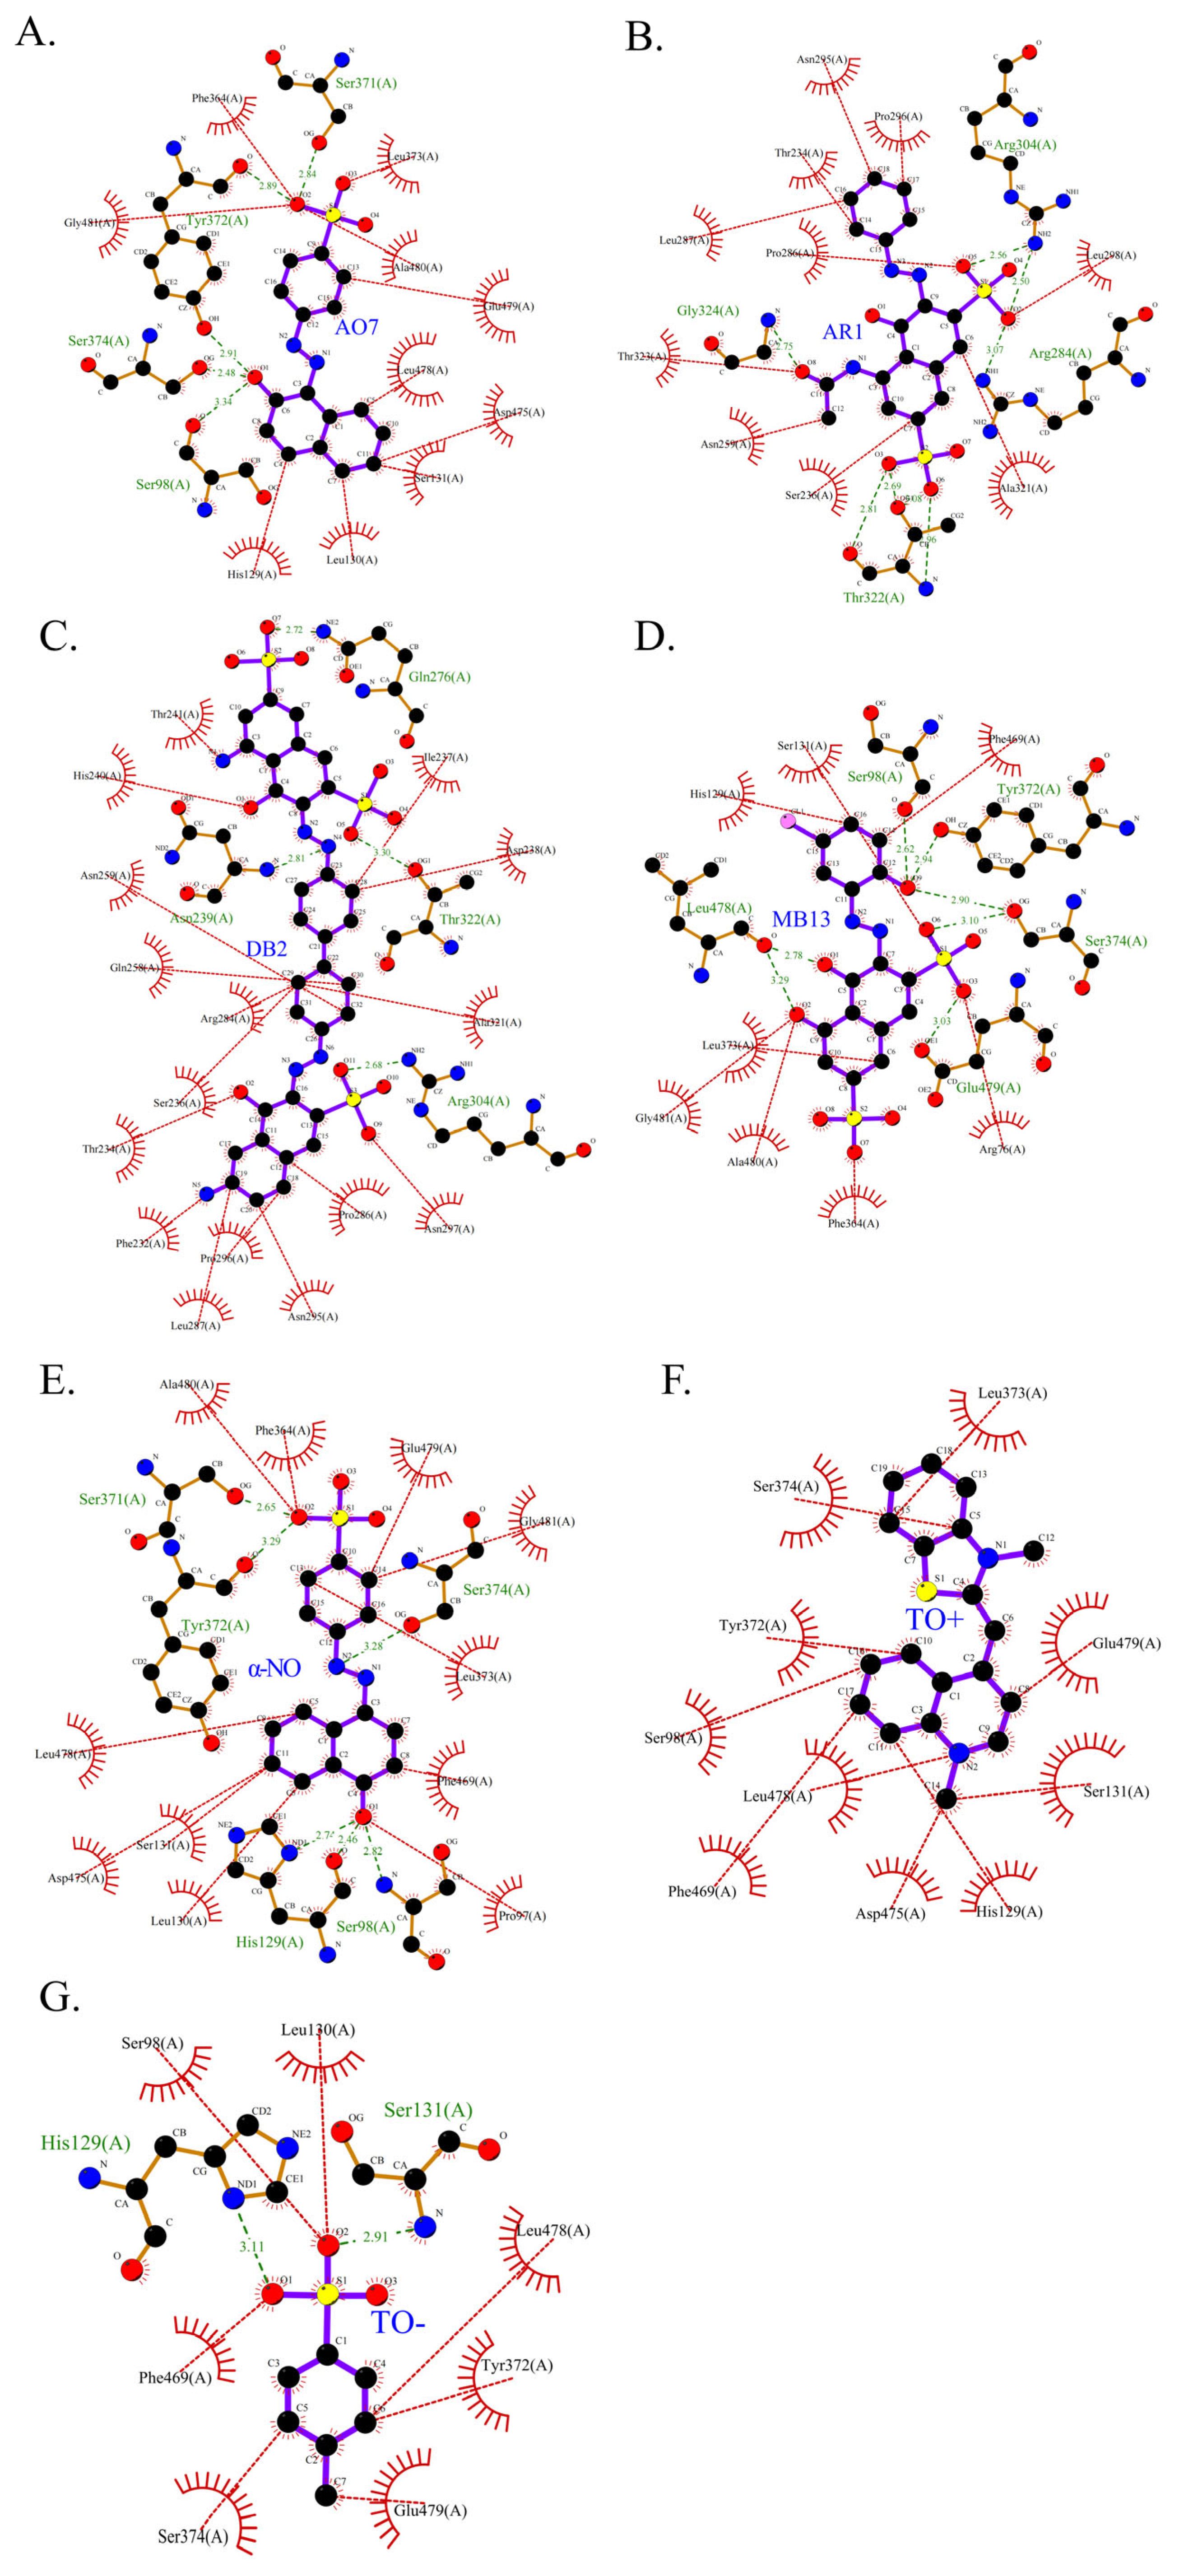
Two-dimensional structure of molecular docking of different azo dyes and laccase. The purple stick model represents the ligand, the orange stick model represents the protein structure, the red dashed line represents representative hydrophobic interactions, the red serrated semicircle represents amino acid residues that have hydrophobic interactions with the ligand, and the green dashed line represents hydrogen bonds. (A–G). (A). AO7. (B). AR1. (C). DB2. (D). MB13. (E). α-NO. (F). TO+. (G). TO-.
Figure 13.
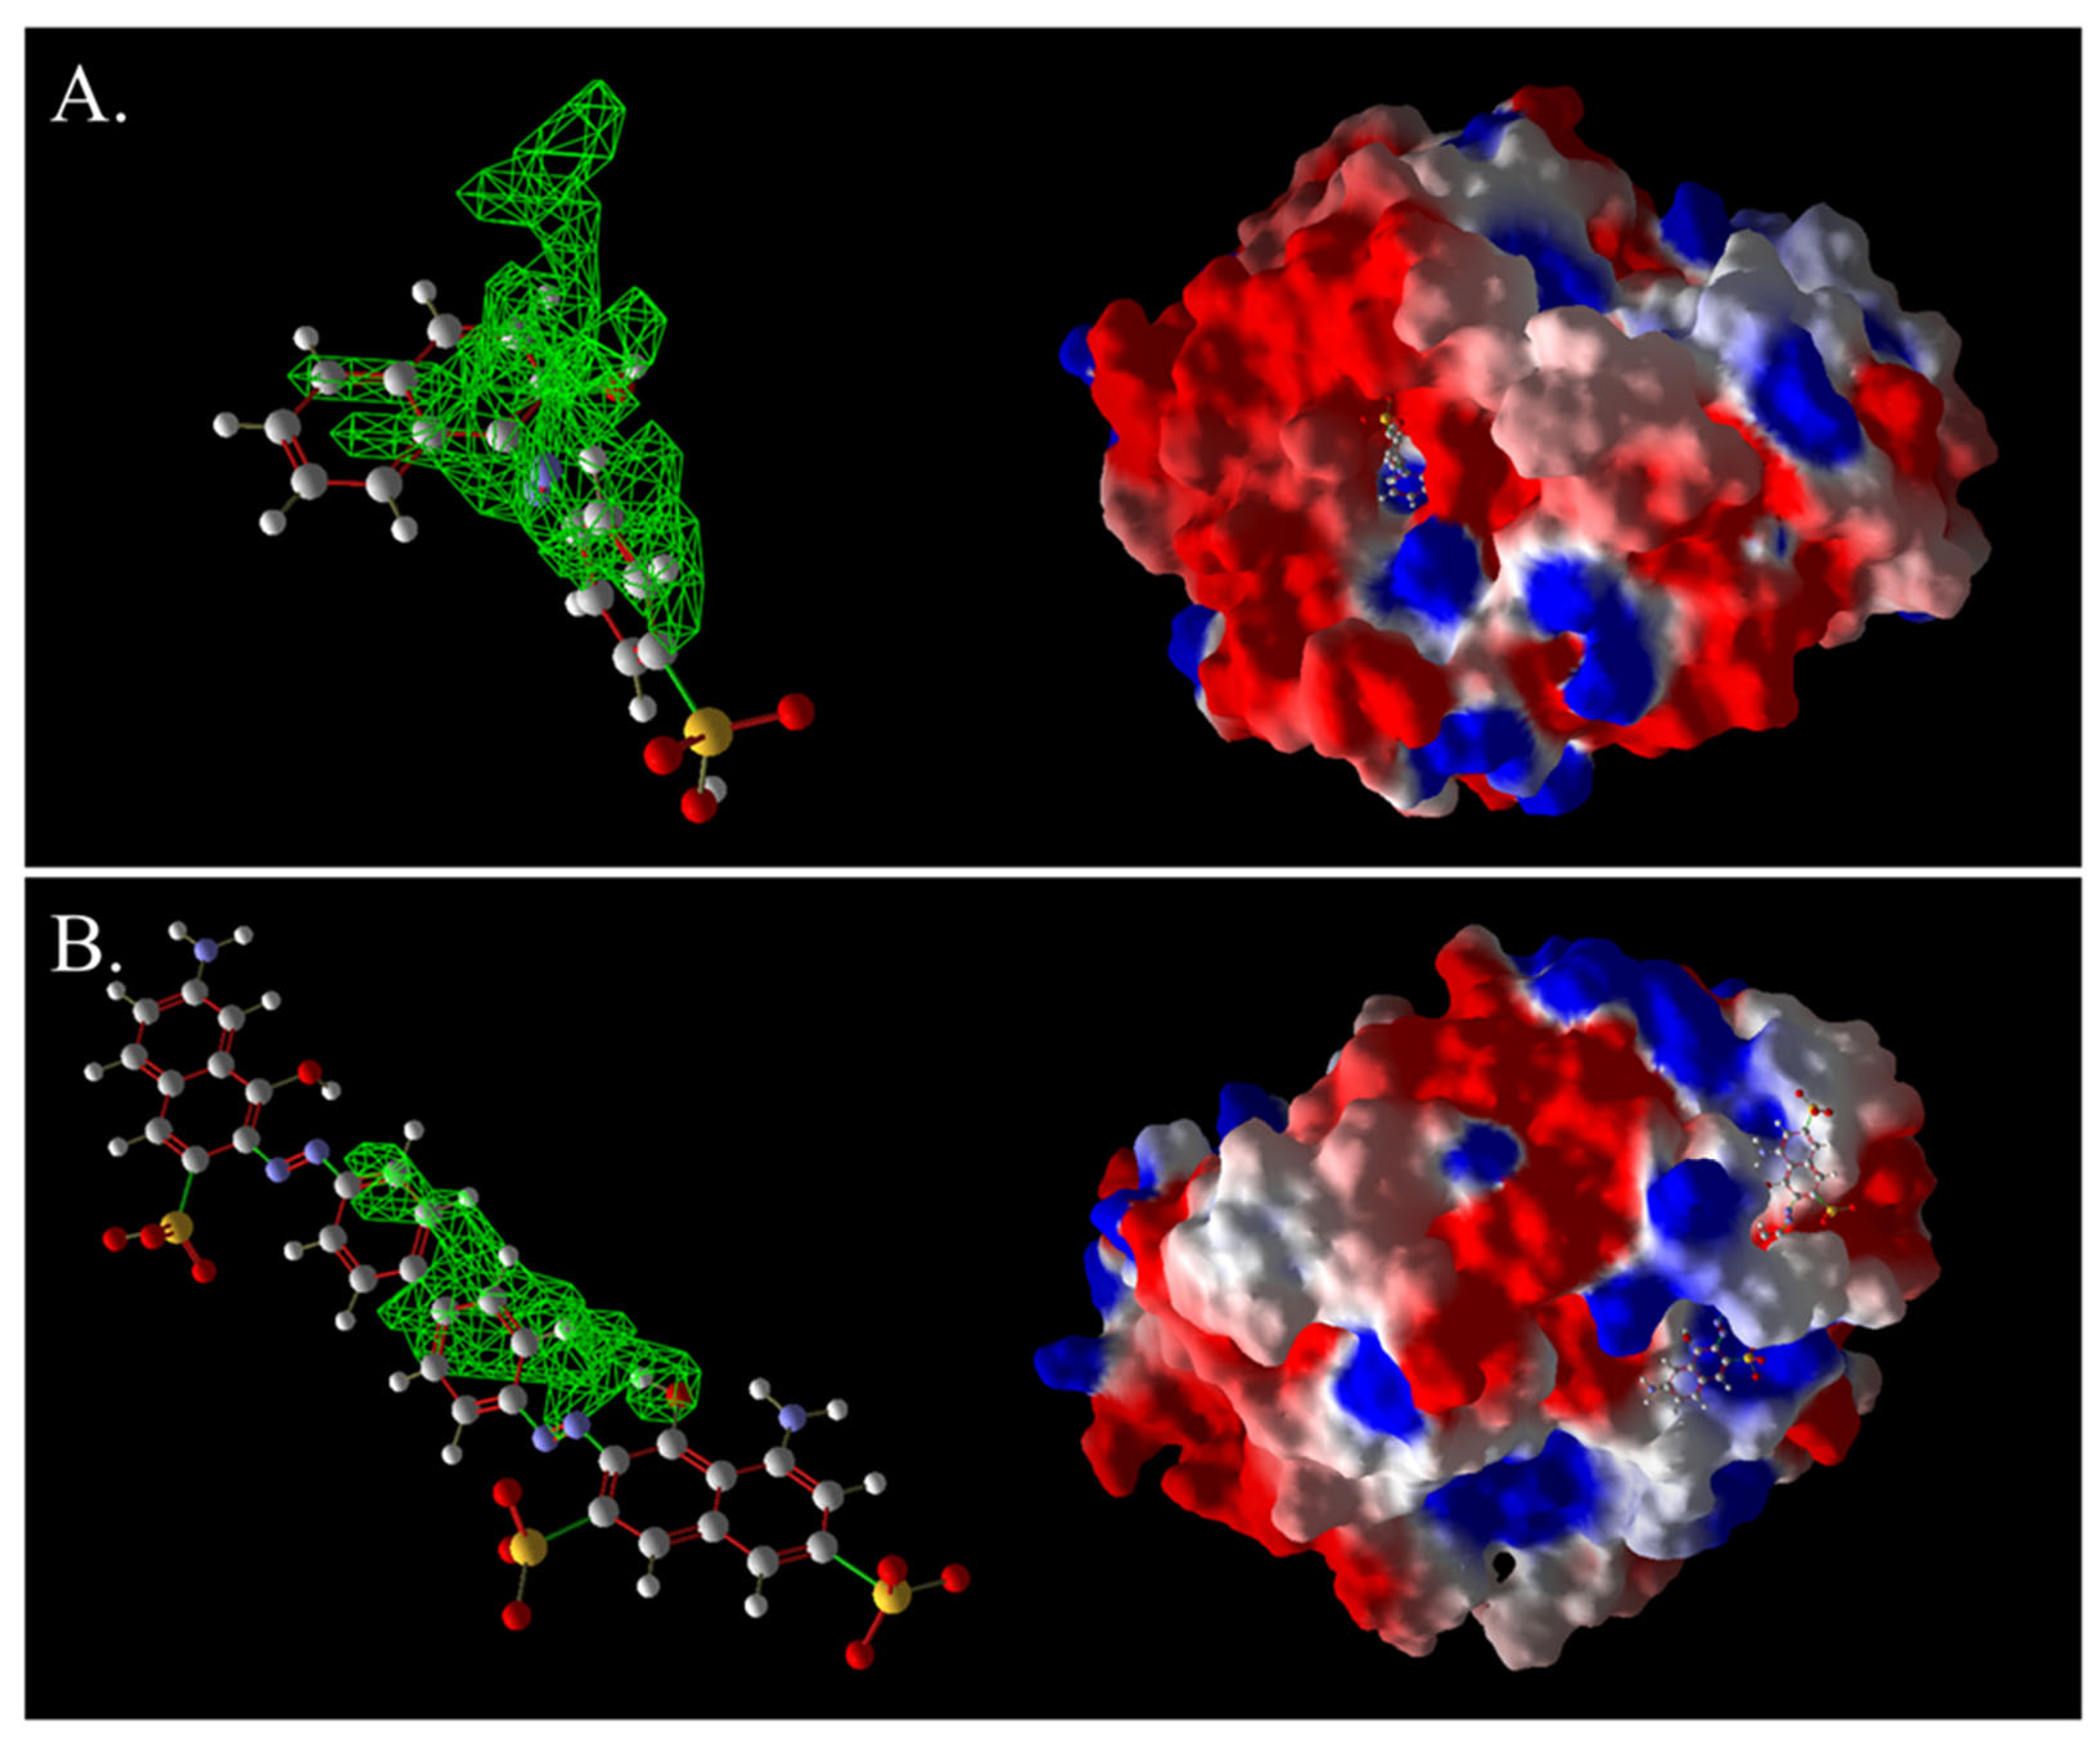
Three-dimensional images of AO7 and laccase complexes (A) and 3D images of DB2 and laccase complexes (B). The green grid represents a predictive docking pocket.
Figure 13.
Three-dimensional images of AO7 and laccase complexes (A) and 3D images of DB2 and laccase complexes (B). The green grid represents a predictive docking pocket.
Figure 14.
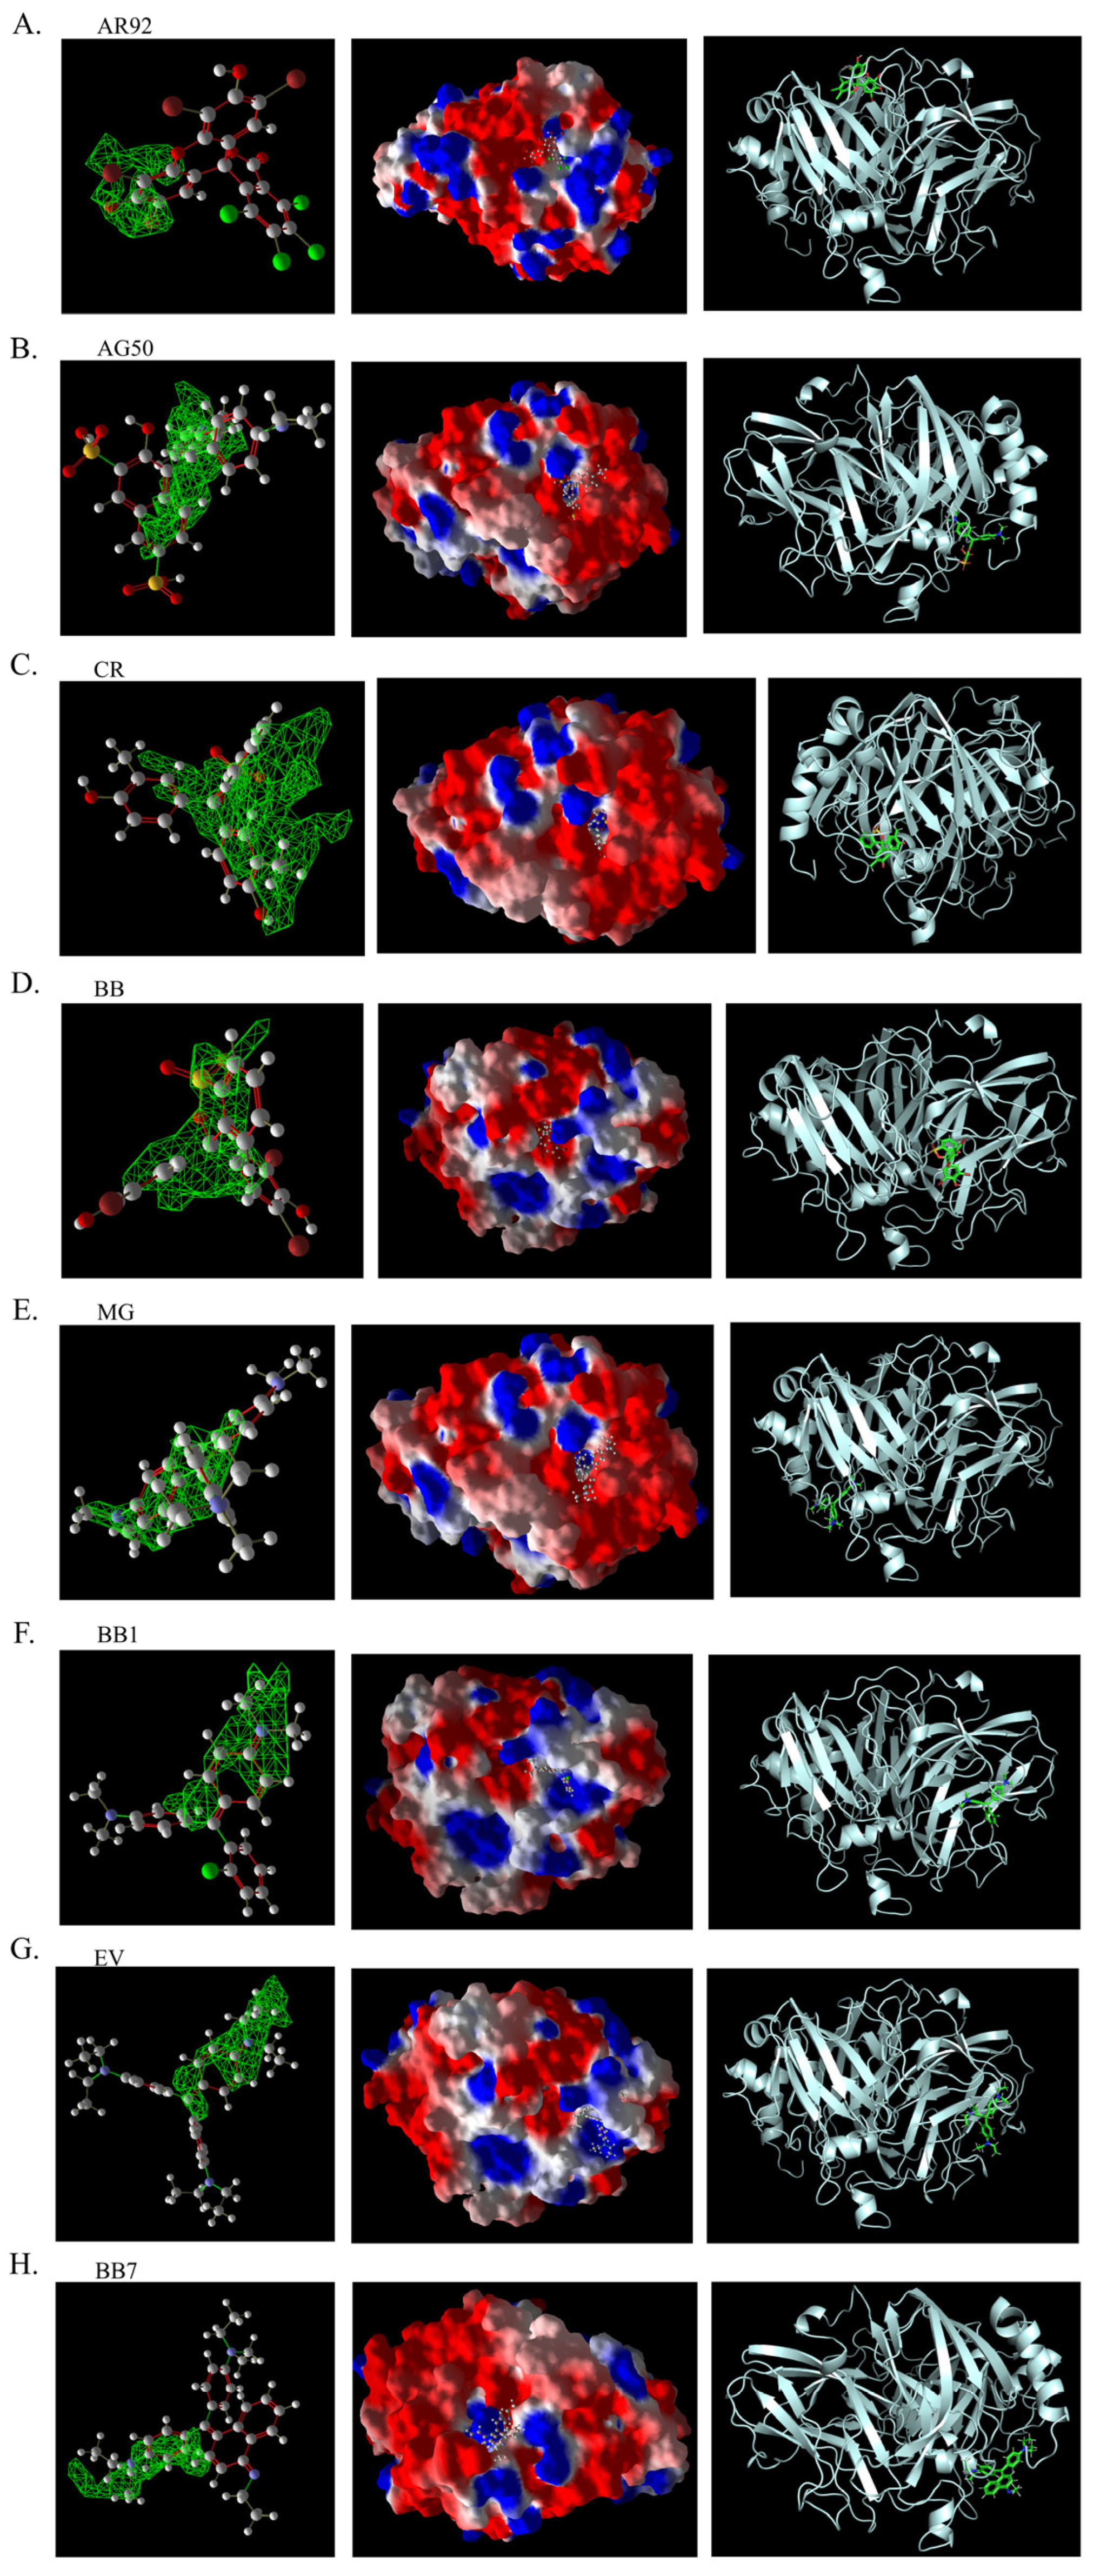
Three-dimensional structural images of molecular docking of different triphenylmethane dyes and laccase using Molegro Virtual Docker (MVD). The first column is the 3D binding image of the dye ligand to the predicted binding pocket generated by MVD; the second column is the 3D binding image of the dye to the electrostatic surface of laccase generated by MVD; and the third column is the 3D binding image of the dye to laccase generated by PyMOL. (A). AR92. (B). AG50. (C). CR. (D) BB. (E). MG. (F). BB1. (G). EV. (H). BB7.
Figure 15.
Two-dimensional structure of molecular docking of different triphenylmethane dyes and laccase. The purple stick model represents the ligand, the orange stick model represents the protein structure, the red dashed line represents representative hydrophobic interactions, the red serrated semicircle represents amino acid residues that have hydrophobic interactions with the ligand, and the green dashed line represents hydrogen bonds. (A). AG50. (B). AR92. (C). BB. (D). BB1. (E). BB7. (F). CR. (G). EV. (H). MG.
Figure 16.
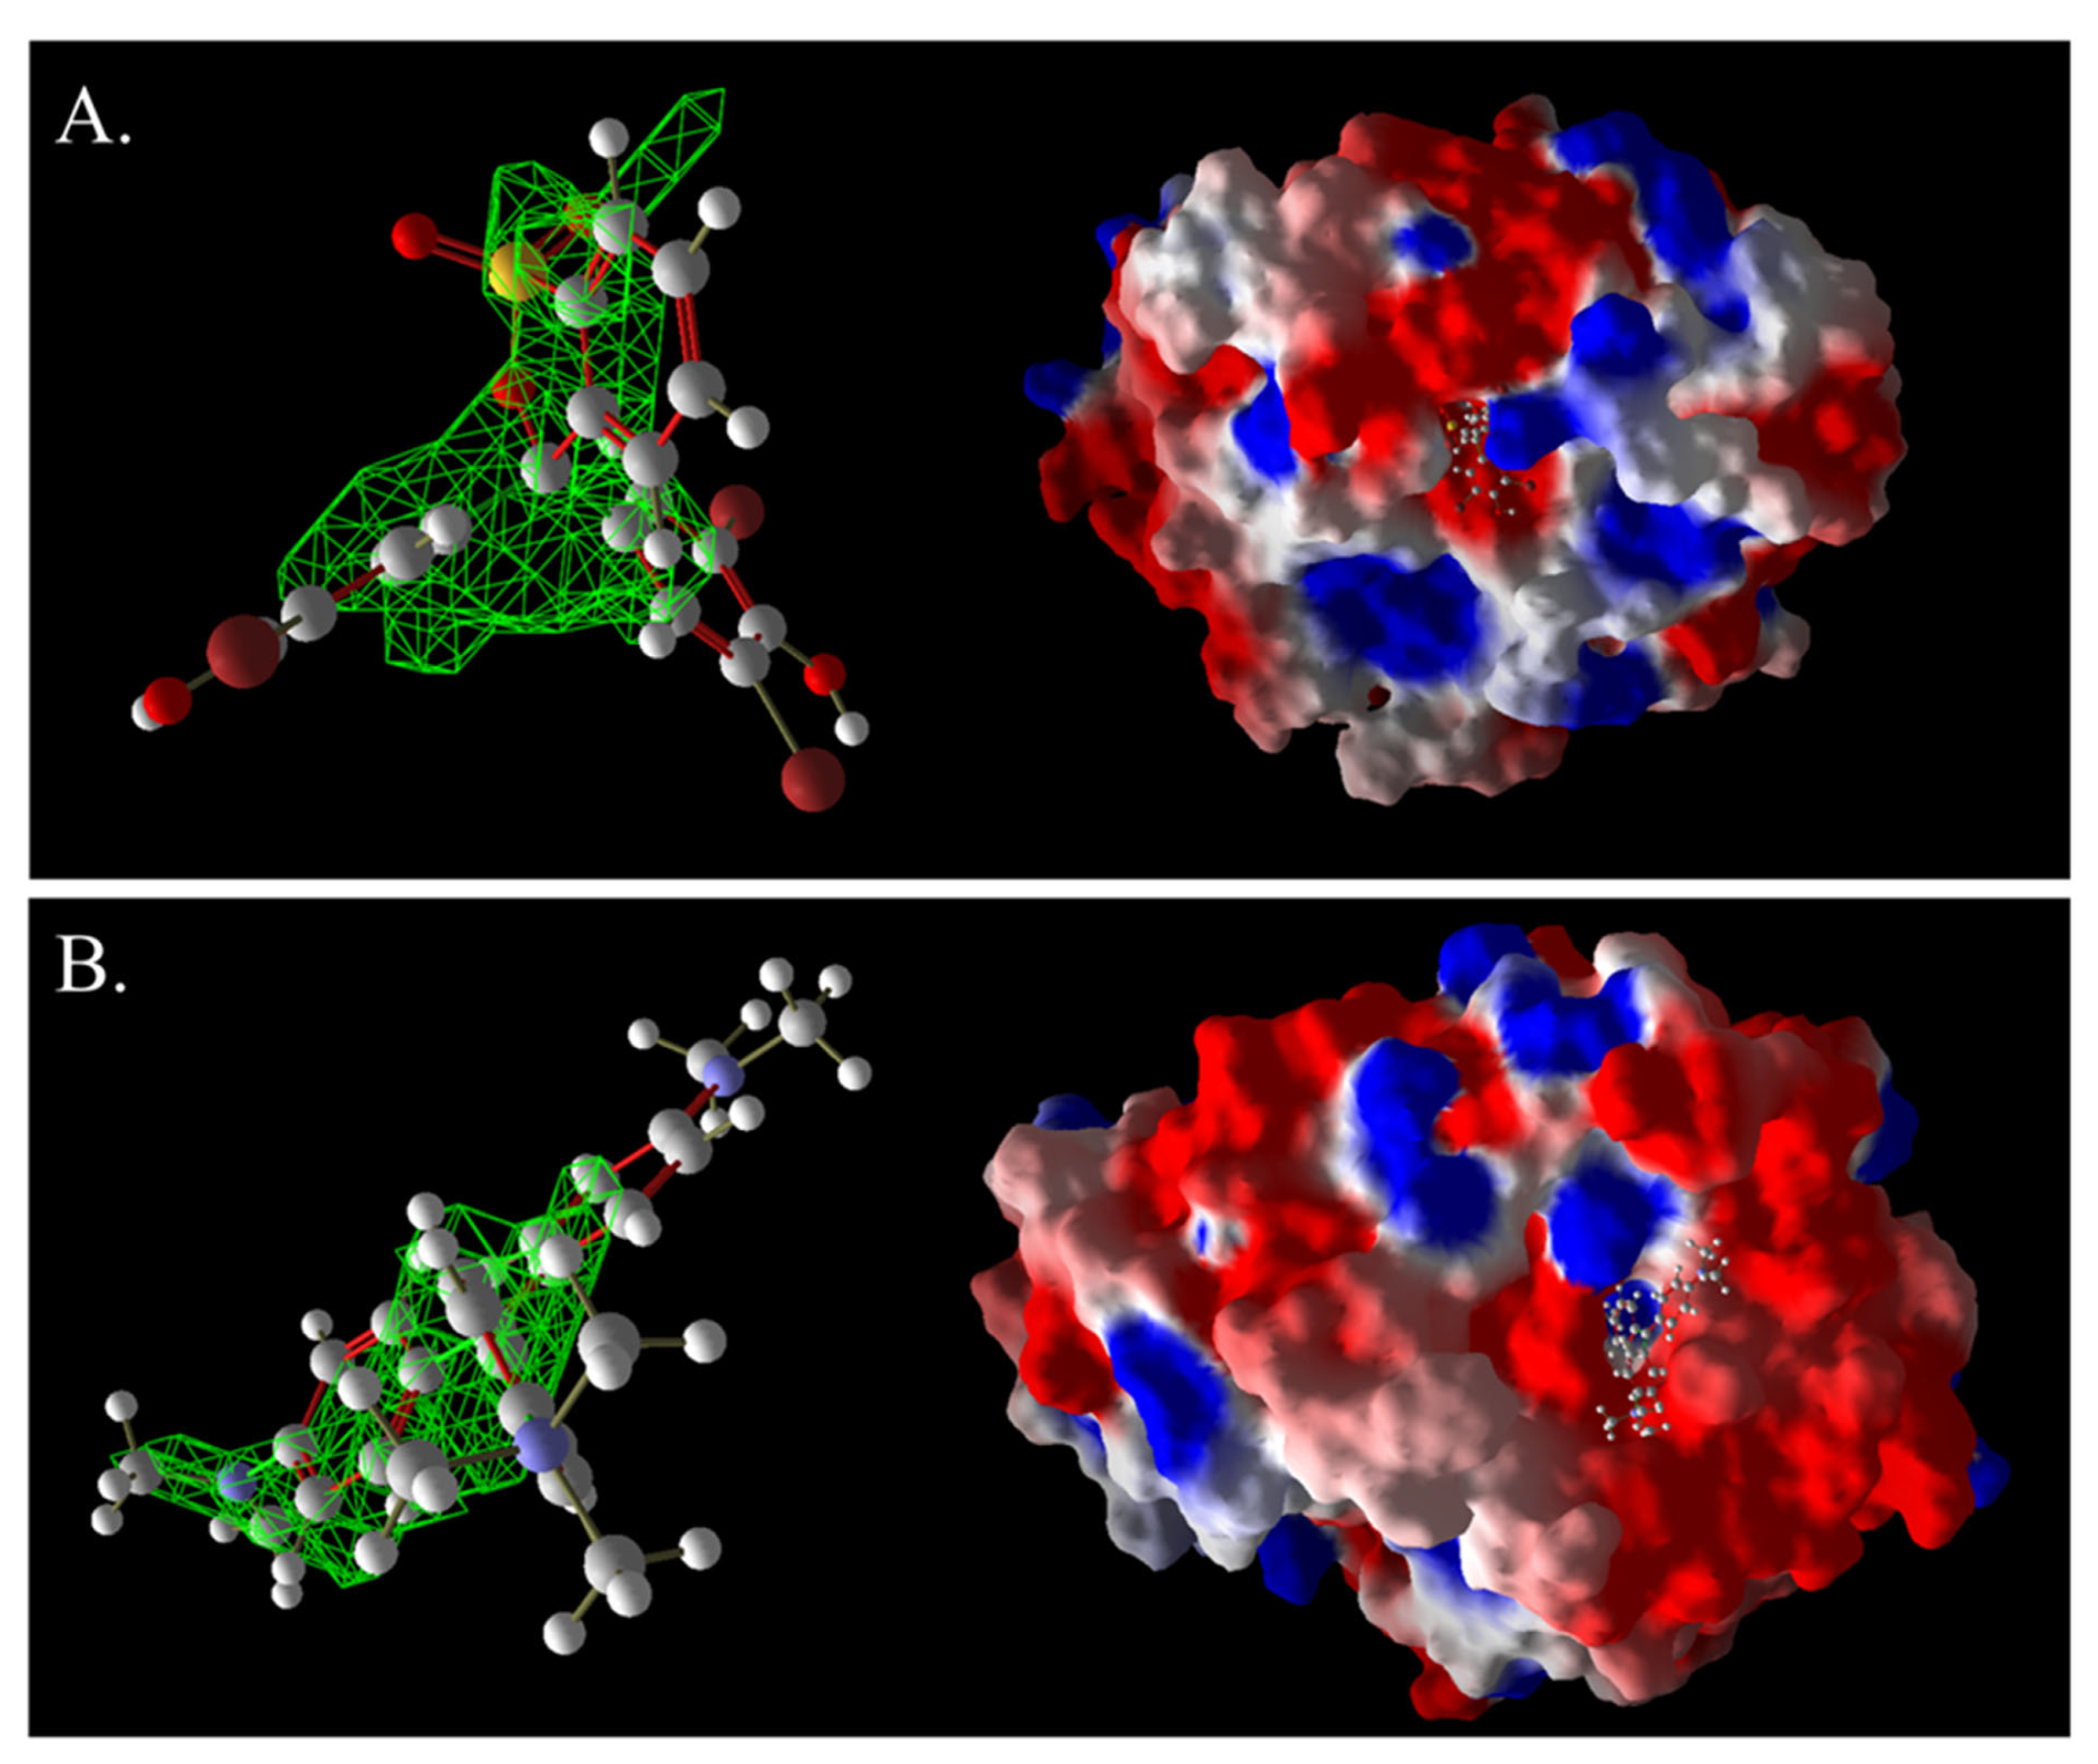
Three-dimensional images of BB and laccase complexes (A) and 3D images of MG and laccase complexes (B). The green grid represents a predictive docking pocket.
Figure 16.
Three-dimensional images of BB and laccase complexes (A) and 3D images of MG and laccase complexes (B). The green grid represents a predictive docking pocket.
Figure 17.
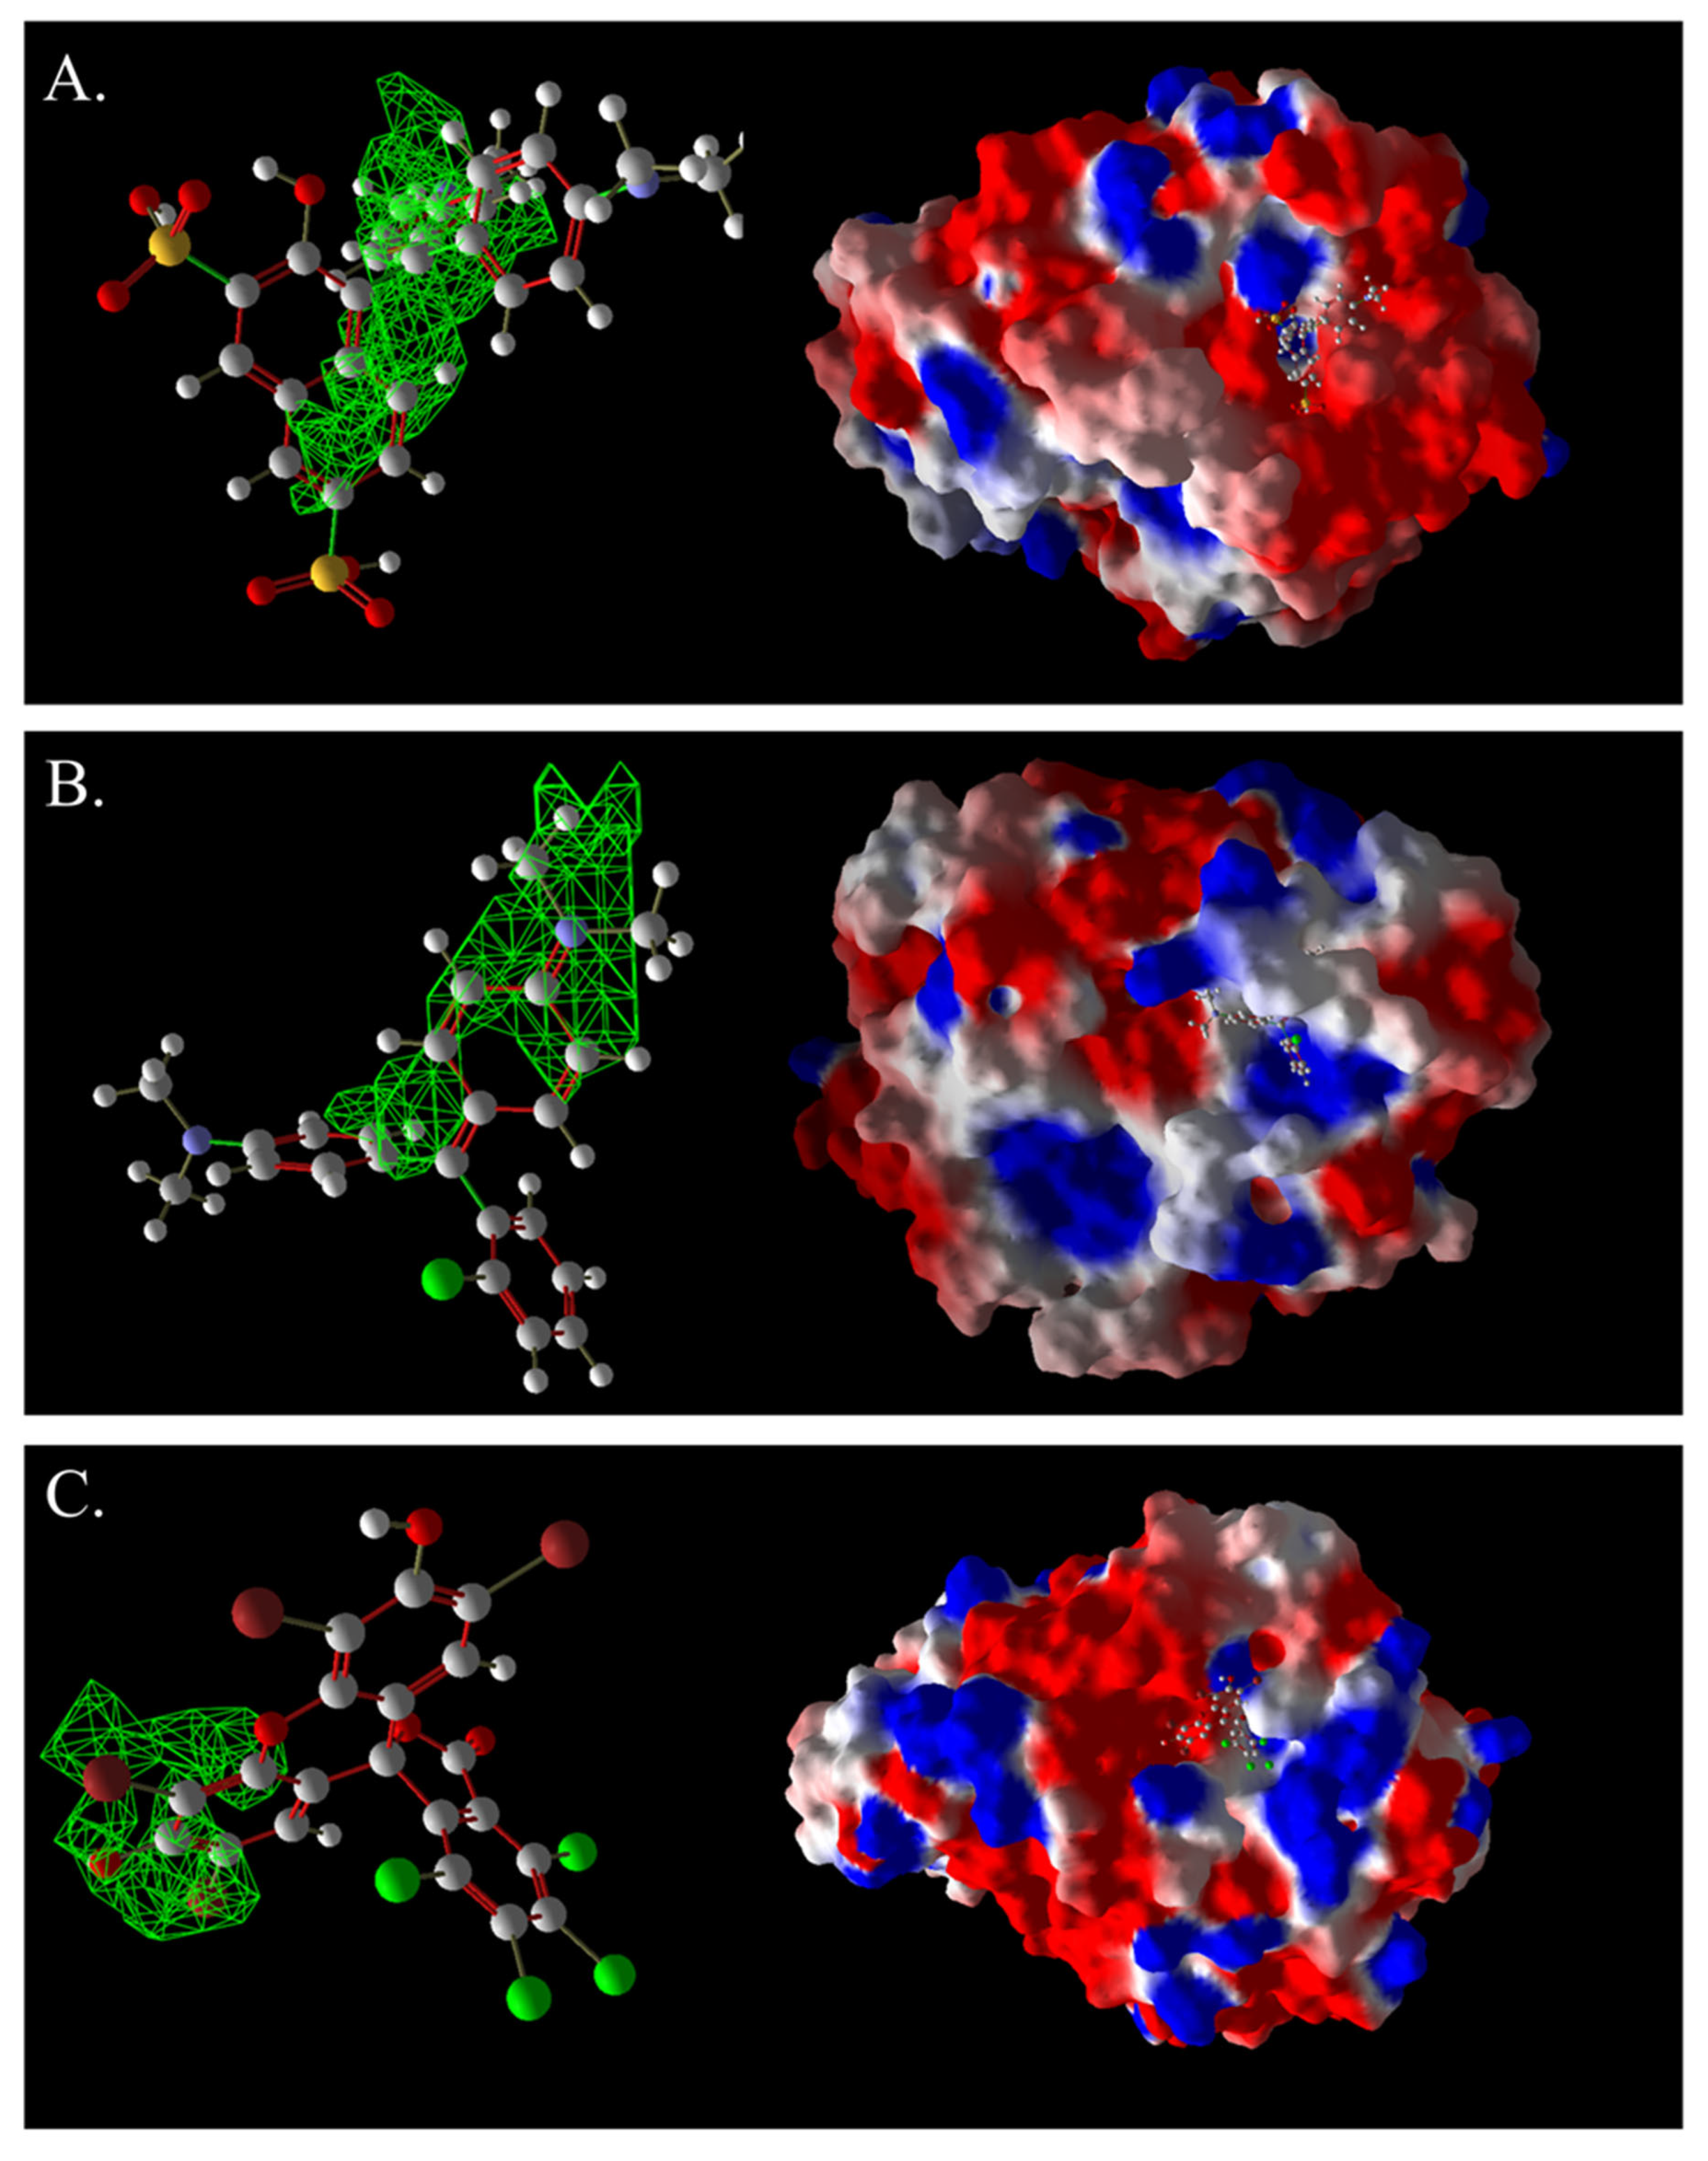
Three-dimensional images of AG50, BB7, AR92, and laccase complexes. (A): AG50; (B): BB7; (C): AR92. The green grid represents a predictive docking pocket.
Figure 17.
Three-dimensional images of AG50, BB7, AR92, and laccase complexes. (A): AG50; (B): BB7; (C): AR92. The green grid represents a predictive docking pocket.
Table 1.
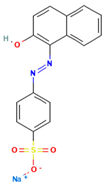
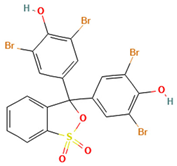
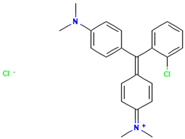
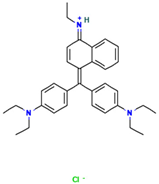
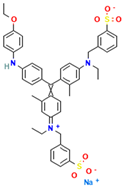
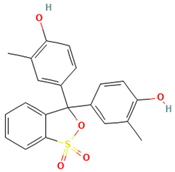
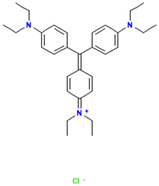
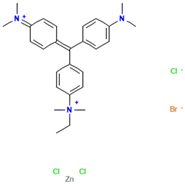
Names, abbreviations, molecular weights, chemical structures, maximum absorption wavelengths, and types of all dyes used in this study.
Table 2.
Comparison between results of decolorization efficiencies of azo dyes by the laccase and molecular docking results (HBond: Hydrogen bonding energy).
Table 2.
Comparison between results of decolorization efficiencies of azo dyes by the laccase and molecular docking results (HBond: Hydrogen bonding energy).
| Name | Dye Concentration (mg/L) | MolDock
Score | Re-Rank
Score | HBond
(kJ/mol) | Binding Affinity
(kJ/mol) |
|---|
| 10 | 25 | 50 |
|---|
| AO7 | 82% | 92% | 88% | −114.519 | −95.4339 | −5.82743 | −24.0421 |
| AR1 | 89% | 75% | 66% | −114.354 | −96.3192 | −9.50236 | −22.0926 |
| DB2 | 100% | 83% | 71% | −152.437 | −111.212 | −6.91448 | −38.4061 |
| MB13 | 93% | 94% | 92% | −118.308 | −90.0838 | −12.877 | −23.5246 |
| α-NO | 100% | 92% | 95% | −121.386 | −48.5297 | −6.63471 | −24.925 |
| TO+ | 51% | 47% | 34% | −107.139 | −70.8275 | −0.46999 | −33.1705 |
| TO- | −69.5667 | −61.6063 | −3.45049 | −21.8967 |
Table 3.
Statistics on the number of interactions between azo dyes and laccase.
Table 3.
Statistics on the number of interactions between azo dyes and laccase.
| Ligand | Hydrophobic Interaction | Representative
Hydrophobic Interaction | Hydrogen Bond |
|---|
| AO7 | 54 | 10 | 5 |
| AR1 | 53 | 10 | 8 |
| DB2 | 86 | 16 | 4 |
| MB13 | 55 | 8 | 7 |
| α-NO | 77 | 11 | 6 |
| TO+ | 39 | 10 | 0 |
| TO- | 21 | 7 | 2 |
Table 4.
Comparison between results of decolorization efficiencies of triphenylmethane dyes by the laccase and molecular docking results. HBond: Hydrogen bonding energy. “—” represents not decolorization.
Table 4.
Comparison between results of decolorization efficiencies of triphenylmethane dyes by the laccase and molecular docking results. HBond: Hydrogen bonding energy. “—” represents not decolorization.
| Name | Dye Concentration (mg/L) | MolDock
Score | Re-Rank
Score | HBond
(kJ/mol) | Binding Affinity
(kJ/mol) |
|---|
| 10 | 25 | 50 |
|---|
| AR92 | — | — | — | −113.844 | −68.075 | −4.02983 | −56.0656 |
| AG50 | 80% | 64% | 62% | −130.848 | −89.8571 | −8.28465 | −15.8195 |
| CR | 51% | 54% | 57% | −128.55 | −21.4867 | 0.504288 | −22.5065 |
| BB | 97% | 100% | 100% | −116.665 | −72.0983 | −3.62004 | −38.4771 |
| MG | 99% | 98% | 98% | −108.117 | −78.5417 | −0.405233 | −18.2366 |
| BB1 | 88% | 78% | 73% | −113.282 | −88.3131 | −0.378087 | −22.6697 |
| EV | 75% | 76% | 73% | −129.258 | −72.5065 | 0 | −25.3519 |
| BB7 | 33% | 71% | 76% | −125.383 | −86.5739 | −0.436326 | −31.3687 |
Table 5.
Statistics on the number of interactions between triphenylmethane dyes and laccase.
Table 5.
Statistics on the number of interactions between triphenylmethane dyes and laccase.
| Ligand | Hydrophobic Interaction | Representative
Hydrophobic Interaction | Hydrogen Bond |
|---|
| AR92 | 35 | 4 | 5 |
| AG50 | 54 | 13 | 4 |
| CR | 88 | 10 | 3 |
| BB | 42 | 6 | 4 |
| MG | 47 | 13 | 0 |
| BB1 | 44 | 14 | 0 |
| EV | 56 | 17 | 0 |
| BB7 | 57 | 14 | 0 |
