Article

SALL2-Mediated Suppression of WNT Signaling Through Transcriptional Control of AXIN2 in Colorectal Cancer Cells

by
Aracelly Quiroz
1,2,3,
Emilia Escalona
4,
Carlos Farkas
5,
Diego Benítez-Riquelme
1,2,
Paulina Sepúlveda
1,2,
Mario Palma
1,2,†,
Paula Medina
1,2,
Carolina Delgado
3,
Matías I. Hepp
5,
Franz Villarroel-Espindola
6,
Ariel F. Castro
1,2,* and
Roxana Pincheira
1,2,*
1
Departamento de Bioquímica y Biología Molecular, Facultad de Ciencias Biológicas, Universidad de Concepción, Concepción 4070409, Chile
2
Laboratorio de Transducción de Señales y Cáncer, Facultad de Ciencias Biológicas, Universidad de Concepción, Concepción 4070409, Chile
3
Departamento de Especialidades, Facultad de Medicina, Universidad de Concepción, Concepción 4070409, Chile
4
MARLab, Instituto de Ciencias Biomédicas, Facultad de Ciencias de la Salud, Universidad Autónoma de Chile, Talca 3460000, Chile
5
Laboratorio de Investigación en Ciencias Biomédicas, Departamento de Ciencias Básicas y Morfología, Facultad de Medicina, Universidad Católica de la Santísima Concepción, Concepción 4030000, Chile
6
Translational Medicine Laboratory, Fundación Arturo López Pérez Cancer Center, Santiago 7500921, Chile
*
Authors to whom correspondence should be addressed.
Current address: Department of Molecular Metabolism, Harvard T.H. Chan School of Public Health, Boston, MA 02115, USA.
Int. J. Mol. Sci. 2025, 26(16), 7896; https://doi.org/10.3390/ijms26167896
Submission received: 17 June 2025 / Revised: 31 July 2025 / Accepted: 10 August 2025 / Published: 15 August 2025

Abstract

Colorectal cancer (CRC) remains the second leading cause of cancer-related mortality worldwide, with aberrant activation of the Wnt/β-catenin signaling pathway constituting a key driver of tumorigenesis. SALL2, a zinc finger transcription factor deregulated in various cancers, has been implicated in Wnt signaling regulation through its Xenopus ortholog; however, its role in human CRC remains unclear. In this study, we investigated the expression and function of SALL2 in CRC. Immunohistochemical analysis revealed that SALL2 is present in the epithelium and stroma of normal colon tissue but is significantly downregulated in adenomas, carcinomas, and CRC cell lines. Reduced SALL2 expression was associated with elevated levels of active β-catenin and poorer overall patient survival. Functional assays demonstrated that SALL2 transcriptionally activates AXIN2, a key negative regulator of the Wnt/β-catenin pathway. Chromatin immunoprecipitation and promoter-reporter assays confirmed SALL2 binding to the AXIN2 proximal promoter and enhanced promoter activity. Furthermore, SALL2 expression potentiated the pro-apoptotic effects of the Wnt pathway inhibitor XAV939 in CRC cells, suggesting a role in sensitizing cells to Wnt-targeted therapies. Collectively, these findings identify SALL2 as a negative regulator of Wnt/β-catenin signaling and support its potential as a prognostic biomarker and therapeutic target in colorectal cancer.

1. Introduction

Colorectal cancer (CRC), by definition, includes carcinomas arising in the anatomical locations of the colon and rectum, and remains the second leading cause of cancer-related mortality worldwide [1,2]. Environmental factors and lifestyle choices are significant determinants of CRC development, as evidenced by the fact that most cases arise sporadically in patients without a family history of the disease [3]. CRC can be classified into four Consensus Molecular Subtypes (CMSs): CMS1, characterized by carcinomas with microsatellite instability and strong immune activation; CMS2, including canonical carcinomas with an epithelial phenotype; CMS3, comprising tumors with an epithelial phenotype and evident metabolic dysregulation; and CMS4, encompassing cancer with a stromal phenotype, prominent transforming growth factor-β (TGF-β) activation, high invasion, and angiogenesis [4]. Among these subtypes, CMS2 has the highest incidence (37%) and is characterized by hyperactivation of the Wnt/β-catenin pathway [5,6].
The canonical Wnt/β-catenin pathway is crucial for embryonic development and cell differentiation [7]. Activation of β-catenin depends on Wnt ligands binding to the Frizzled receptor and LRP co-receptor. This interaction disrupts the β-catenin destruction complex, which comprises AXIN1/2, APC, CK1, and GSK3β. In the absence of this complex, β-catenin accumulates in the cytosol and translocates into the nucleus, where it associates with TCF family transcription factors and co-activators to drive the transcription of target genes involved in cell proliferation, survival, cell adhesion, migration, stemness, and angiogenesis [8,9]. Multiple Wnt modulators and pharmacological approaches with therapeutic potential are currently in preclinical phases [10]. Therefore, identifying novel targets or genetic biomarkers is crucial for improving CRC therapies.
SALL2/Sall2 is a transcription factor member of the Spalt-like (SALL) family, conserved across many organisms, from nematodes to humans [11]. It has two main isoforms, E1 and E1A, which are generated by two alternative promoters, P1 and P2, respectively. These isoforms differ by only 25 amino acids in the N-terminal domain. The E1 isoform contains a nuclear localization sequence and a conserved repressor motif absent in E1A, suggesting distinct functions for each isoform. The E1 isoform is restricted to specific tissues, such as the thymus, testis, and colon, whereas E1A is widely expressed in tissues and is mainly related to cancer [11,12,13,14].
SALL2 is involved in brain and eye development and is implicated in the regulation of key cellular processes, including cell proliferation, migration, and survival [11,15]. SALL2 negatively regulates the cell cycle by repressing CCDN1 and CCNE1 expression and increasing CDKN2A and CDKN1A expression through transcriptional mechanisms [16,17,18]. Additionally, SALL2 is a proapoptotic regulator that increases the expression of BAX and PMAIP1 under genotoxic stress [19]. SALL2 is mutated and/or downregulated in various cancers; however, its role has been investigated only in a few, such as ovarian, breast, and leukemia [12,15], confirming its tumor suppressor activity [16,19]. Interestingly, SALL2 is upregulated in glioblastoma, and together with other neurodevelopmental factors, it promotes glioblastoma propagation [20], suggesting a dual role for SALL2 in cancer.
Previous analyses of public datasets have shown a significant downregulation of SALL2 mRNA expression in CRC samples compared to normal tissues [12], suggesting that its tumor suppressor activity is involved in colon carcinogenesis. Interestingly, the Xenopus sal (XsalF) ortholog negatively regulates the Wnt/β-catenin pathway by transcriptionally activating the negative regulators tcf3 and gsk3b, resulting in the overall suppression of the pathway activity [21]. However, the relationship between SALL2 and CRC, the role of the human ortholog in the Wnt/β-catenin pathway, and its influence on tumor progression and CRC molecular features remain unexplored.
Here, we aimed to investigate the role of SALL2 in CRC by evaluating its protein expression levels in a cohort of human CRC samples and delving into the molecular mechanisms of SALL2 function over the Wnt/β-catenin pathway using both loss and gain of function CRC cell models.
We found that SALL2 is expressed in normal colon tissues but is significantly downregulated in adenoma and carcinoma samples, as well as cancer cell lines. Mechanistically, our study identified an inverse correlation between SALL2 expression and nuclear β-catenin accumulation in both tissues and cell lines, suggesting that SALL2 negatively regulates Wnt signaling. Furthermore, we demonstrated that SALL2 transcriptionally upregulates AXIN2 expression, a well-characterized negative regulator of the Wnt/β-catenin pathway. Finally, we showed that SALL2 expression sensitizes CRC cells to death after treatment with a well-established Wnt signaling pathway inhibitor, highlighting the potential importance of SALL2 in the effectiveness of future Wnt-targeted therapies for CRC.

2. Results

2.1. SALL2 Is Expressed in Normal Colon but Is Downregulated in Colorectal Cancer (CRC)

A previous report indicated that SALL2-E1A mRNA levels decreased in CRC samples [11]. In line with this, analyses of the UALCAN and GEPIA datasets revealed a significant reduction (p < 0.05) in SALL2 mRNA levels in CRC tissues compared to normal tissues (Supplementary Figure S1a,b). However, SALL2 protein expression has not been evaluated in CRC tissues. Therefore, we assessed SALL2 expression through IHC on human CRC samples.
Our cohort consisted of 130 paraffin-embedded samples from CRC patients, which included 42 normal adjacent tissues, 40 adenomas, and 48 adenocarcinoma samples. Colorectal cancer is generally considered a single clinical and pathological entity encompassing both colon and rectal tumors. Although some molecular differences exist, the distinction is primarily anatomical and does not impact the overall classification or staging. According to the 9th edition of the TNM Classification [2] and major pathological guidelines (e.g., Pathology Outlines, https://www.pathologyoutlines.com/ and WHO, https://www.who.int, accessed on 17 April 2023), both tumor types are staged and categorized under colorectal adenocarcinoma. Our cohort included 4 rectal tumors among the 48 CRC cases analyzed. The average age of patients was 67.7 years, and the cohort included individuals of both sexes (Supplementary Table S1).
The percentage of SALL2-positive cells was 90.6% in adjacent normal tissues, 74.3% in adenomas, and 25.4% in CRC tissues (Figure 1a). Analysis of SALL2 intensity revealed that SALL2 is expressed in both the stroma and epithelium of the normal colon, with higher abundance in the stromal compartment (Figure 1b). Additionally, SALL2 was localized in the crypts of the colonic epithelium, where it was notably concentrated in the basal regions, particularly within Lieberkühn’s crypts associated with proliferative niches (Figure 1c). We evaluated the nuclear localization of SALL2 because its function depends on this subcellular localization [11]. In adjacent normal tissue, nuclear SALL2 staining was more prominent in stromal cells (23.3%) compared to in epithelial cells (or glands, 15.4%) (indicated by yellow arrows in Figure 1a). However, there was a significant decrease in nuclear SALL2 staining in both cell types as the tissue progressed from normal to adenoma and CRC (Figure 1d). In summary, SALL2 protein levels were significantly reduced in adenomas and adenocarcinoma tissues (p < 0.01) compared to in adjacent normal tissues.
We then examined the specific stromal cell types that express SALL2. We generated two triple-staining panels: one labeling SALL2, vimentin (a fibroblast marker), and cytokeratin (an epithelial cell or enterocyte marker), and the other labeling SALL2, CD8 (a cytotoxic lymphocyte marker), and CD68 (a macrophage marker) to identify immune cells. IHC analysis using QuPath software revealed that 40.3% of cytokeratin-positive cells in normal tissue were also SALL2-positive, compared to just 7.5% in cancer tissue. Similarly, 21.8% of vimentin-positive cells were SALL2-positive in normal tissue, whereas only 1% in cancer tissue showed this positivity (Figure 1e). These findings indicated that SALL2 is primarily localized in epithelial enterocytes and fibroblast cells in normal colon tissue. From panel two, SALL2-CD8-positive cells were sparse (less than 10%) in both normal and cancer tissues. In contrast, SALL2-CD68-positive cells were significantly more abundant in CRC (65.7%) compared to normal tissue (7.5%) (Figure 1f).
SALL2 has been characterized as a tumor suppressor in various tissues, including the ovary and breast [13,14]. Loss of SALL2 expression in CRC may correlate with a worse patient prognosis. Notably, data from public data sets provided by R2 Genomics show that patients with the lowest levels of SALL2 in CRC tissues have worse survival outcomes than those with higher SALL2 expression. Our local study showed a similar trend (Supplementary Figure S1c,d).
In summary, we presented evidence that SALL2 is predominantly expressed in the stroma and epithelium of the colon and is significantly decreased in CRC tissues. These results and the association between lower SALL2 expression and poor patient survival support the notion of SALL2 functioning as a tumor suppressor in CRC.

2.2. The Loss of SALL2 Is Associated with an Increase in Nuclear β-Catenin in CRC Cells and Tissue Samples

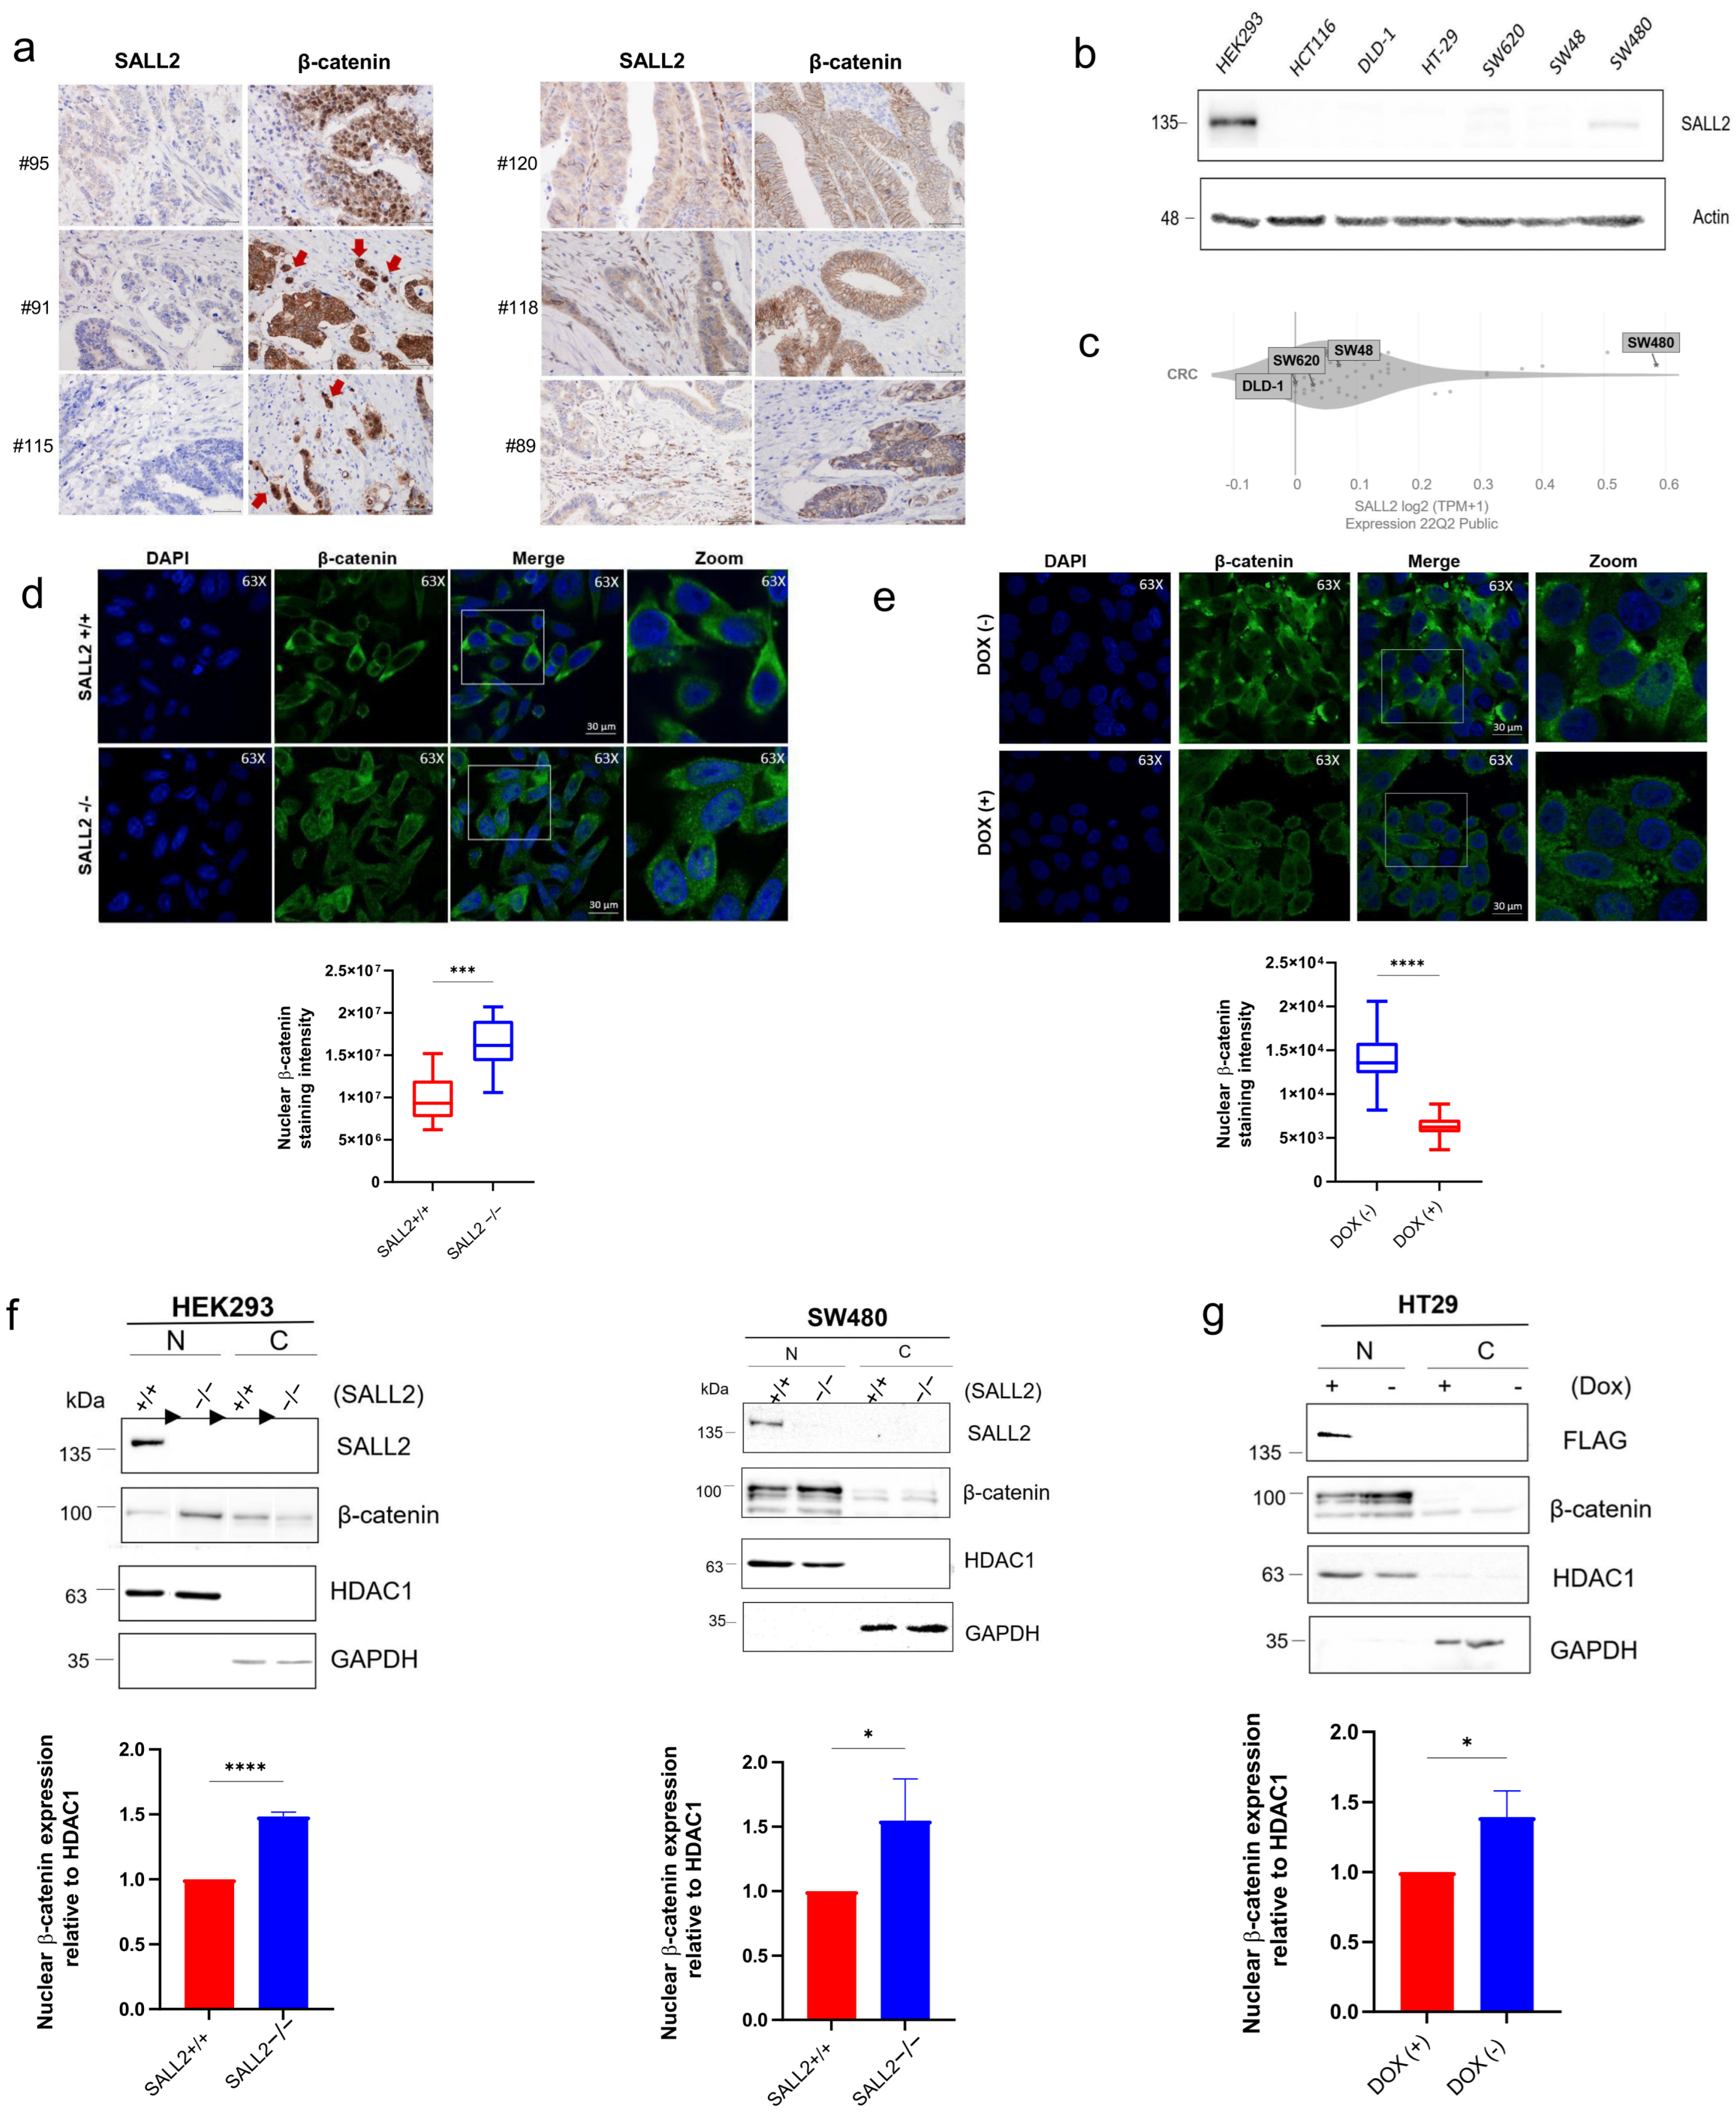
Beta-catenin is a key component of the Wnt signaling pathway, acting as a master regulator of cell motility and playing a crucial role in colon cancer invasion and progression [8,9]. The abnormal accumulation of nuclear β-catenin and a mixed staining pattern encompassing nuclear and cytoplasmic localization are positive markers for CRC progression [22,23]. Conversely, when β-catenin is exclusively located at the cell membrane, it indicates negative cancer progression and is associated with the inactivation of the Wnt pathway. Therefore, to evaluate the association between SALL2 expression and Wnt pathway activity in clinical samples, we used the β-catenin staining pattern as a marker. We found a negative association between SALL2 and nuclear β-catenin staining. In cases where SALL2 showed negative staining, β-catenin was positive at the migratory front in 80% of patients (Supplementary Table S2). SALL2-negative CRC samples correlated with strong nuclear β-catenin staining at the migratory front and positive lymphovascular permeation (Figure 2a, left). In contrast, SALL2-positive CRC samples correlated with β-catenin localized at the plasma membrane and negative lymphovascular permeation (representative images are shown in Figure 2a, right).
These findings were also related to tumor invasion to the serosal surface; in the absence of SALL2, 75.61% of CRC tissues exhibited higher invasion than the SALL2-positive tissues (24.39%) (Supplementary Table S2). Otherwise, the expression of SALL2 did not correlate with microsatellite stability or proliferation (Supplementary Table S2). Our analysis indicated that the loss of SALL2 during CRC progression correlates with active β-catenin, suggesting that SALL2 regulates the Wnt pathway.
Next, we conducted Western blot analysis to evaluate SALL2 expression in various CRC cell lines. Using lysates from HEK293 cells as a positive control for SALL2 expression [24], we observed a marked reduction in SALL2 levels in most CRC cell lines tested (Figure 2b), with detectable expression observed only in SW480 cells. These results were consistent with a Depmap RNA analysis of CRC cells, where SALL2 mRNA was expressed in SW480 but not DLD-1, SW48, and SW620 cell lines (Figure 2c).
To better understand the SALL2−β-catenin relationship, we used SALL2 loss-of-function and gain-of-function CRC models. Confocal microscopy analysis showed an increased nuclear distribution of endogenous β-catenin in SALL2KO (SALL2−/−) SW480 cells compared to that of SALL2+/+ SW480 cells (Figure 2d). This phenotype was reversed by doxycycline-induced expression of SALL2 in the SALL2−/− cells (Figure 2e). These results were confirmed by cell fractionation and Western blot analysis. In addition to the SW480 cells, we used HEK293 cells because they have an intact Wnt network, respond to canonical Wnt ligands [25,26] and express high levels of SALL2 [24]. We extracted the cytoplasmic and nuclear proteins from the SALL2 wild type (SALL2+/+) and deficient (SALL2−/−) models (HEK293 and SW480) and evaluated β-catenin expression by Western blot. SALL2−/− cells showed significantly higher levels of nuclear β-catenin than the SALL2+/+ models (Figure 2f). Conversely, the gain of SALL2 expression in another CRC cell model (doxycycline-inducible HT29 cells) significantly decreased nuclear β-catenin levels (Figure 2g).
These results suggest that SALL2 expression attenuates the nuclear accumulation of β-catenin in colon tissues and cells, indicating that SALL2 restrains the Wnt/β-catenin signaling pathway.

2.3. SALL2 Is an Antagonistic Mediator of Wnt/β-Catenin Signaling in CRC Cells

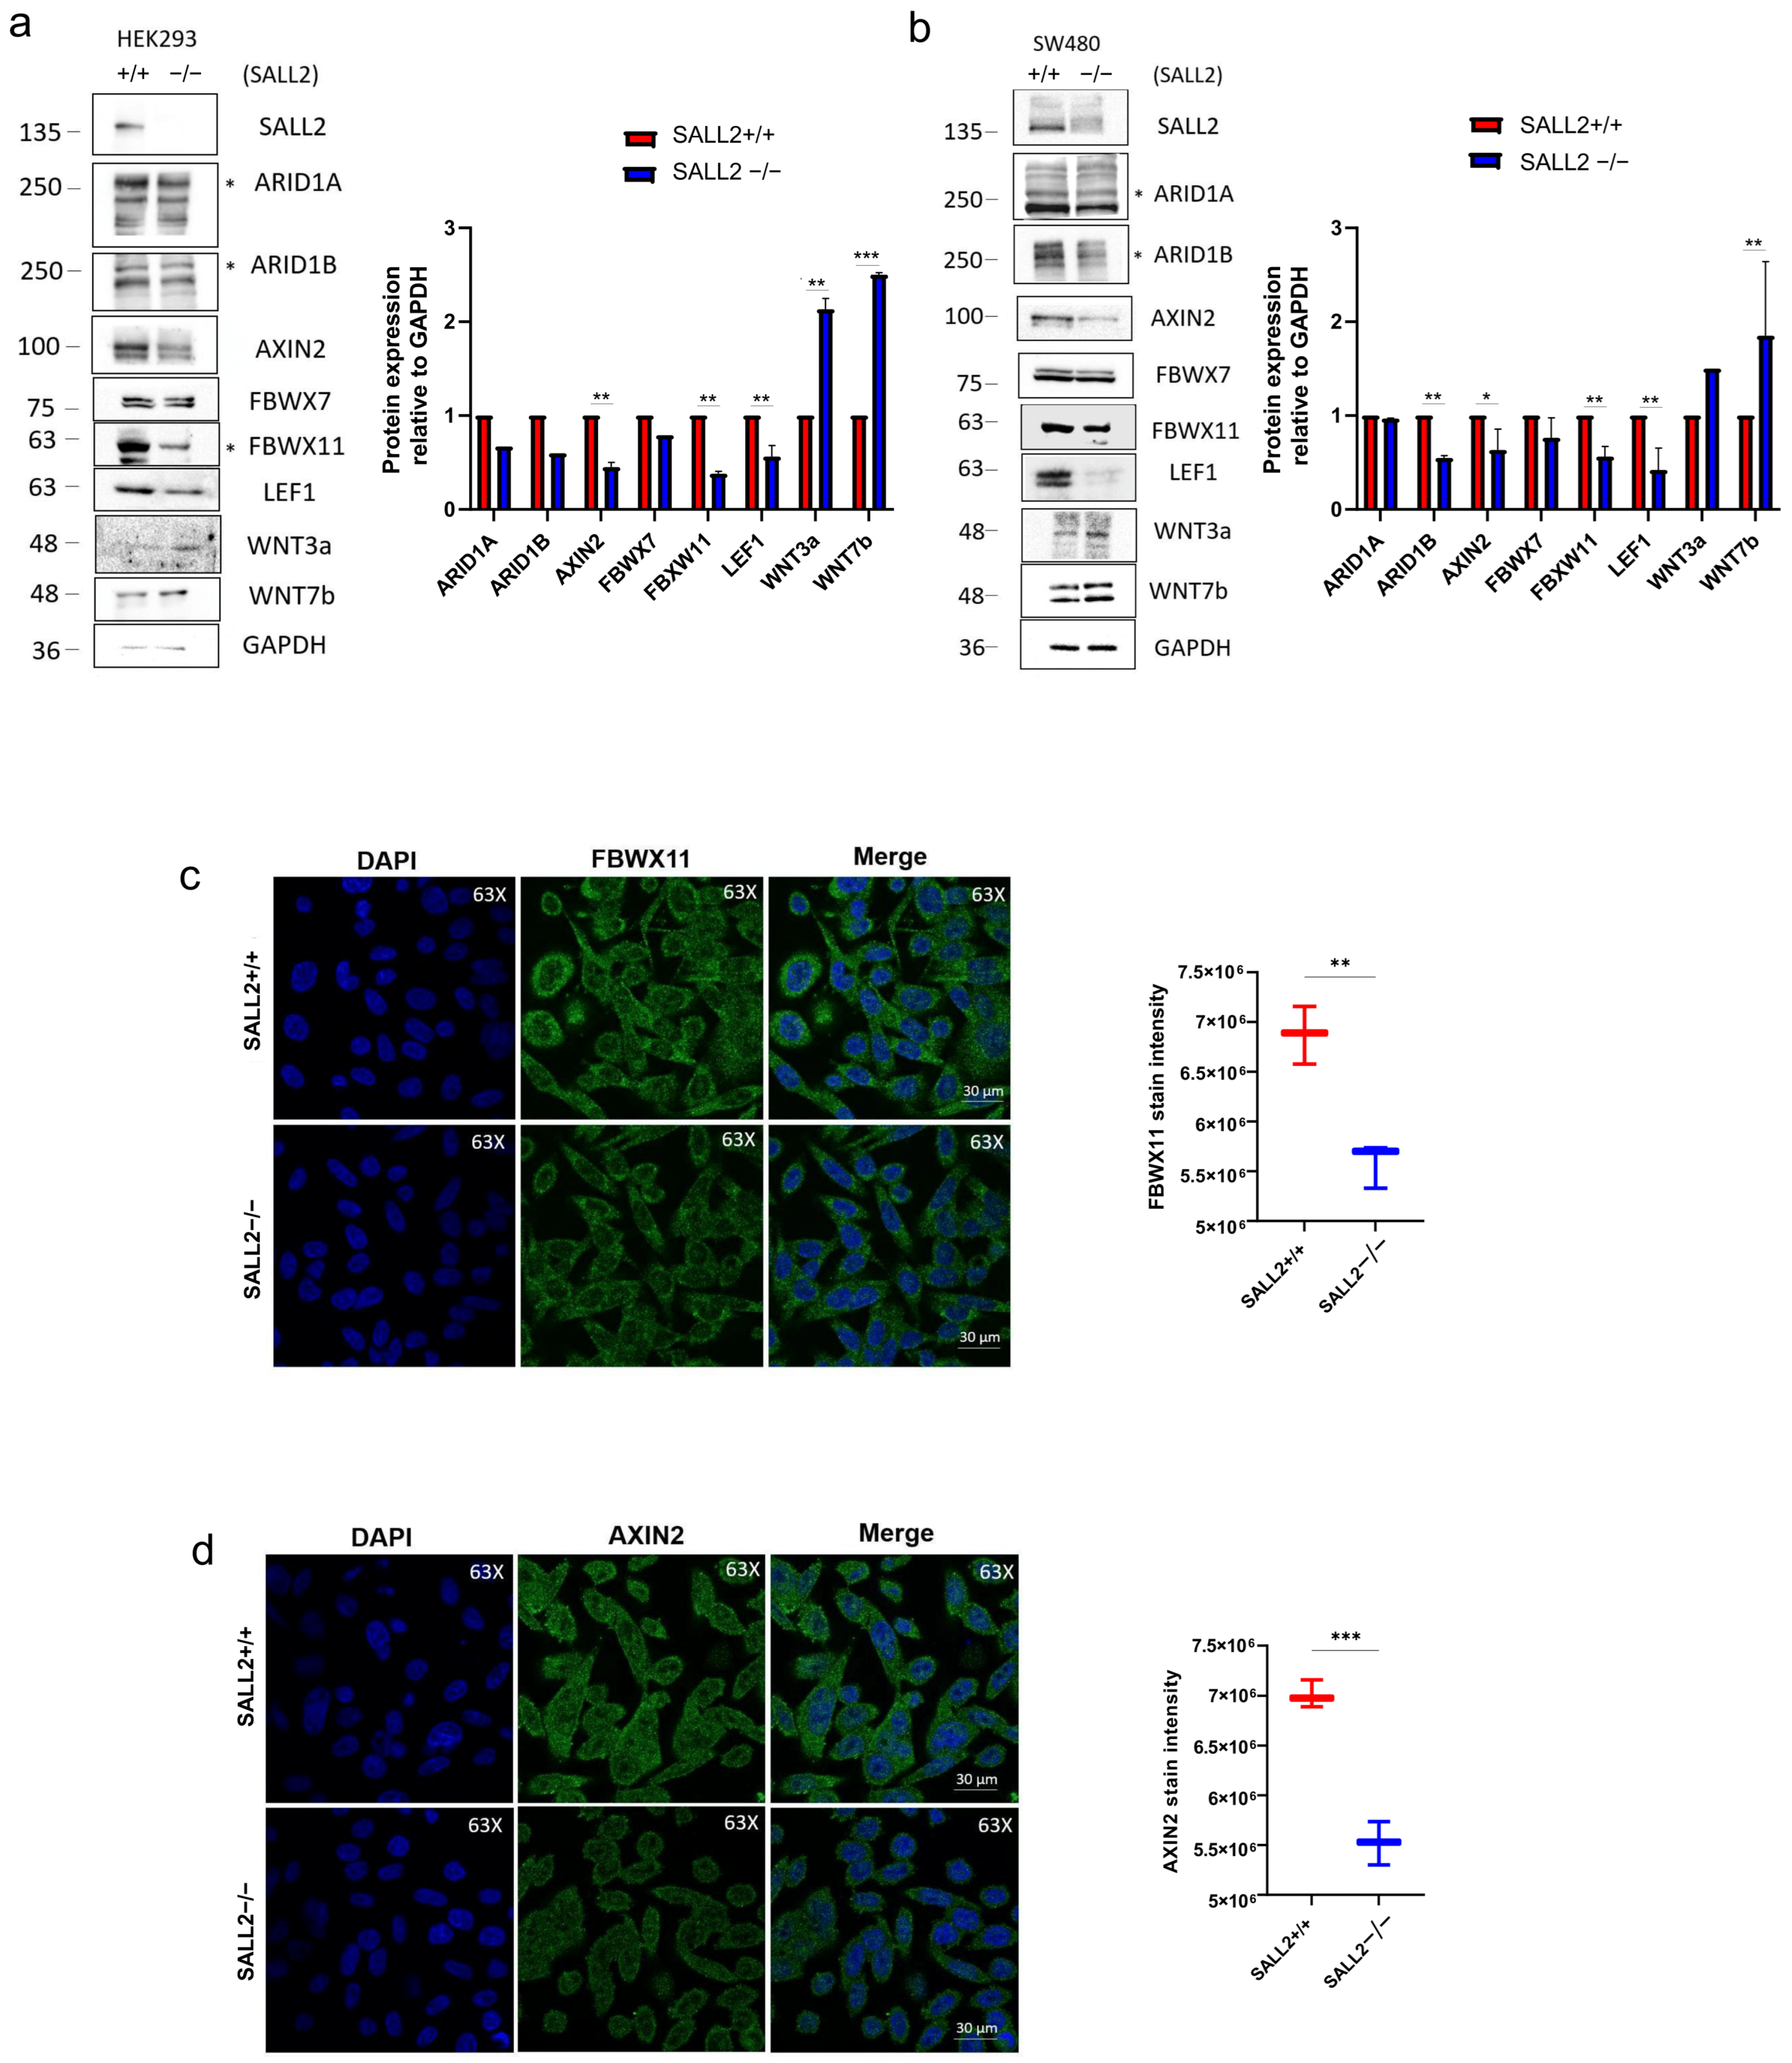
To investigate how SALL2 modulates the Wnt pathway, we assessed the expression changes of both negative and positive regulators of the Wnt/β-catenin pathway in our cell models using Western blot analysis. In SALL2−/− cells, we observed a significant increase in the levels of the Wnt agonists WNT3A and WNT7B, alongside a notable decrease in the levels of two negative Wnt/β-catenin pathway regulators, AXIN2 and FBXW11, compared to the SALL2 +/+ cells (Figure 3a,b).
Given the important roles of FBXW11 and AXIN2 in regulating cytoplasmic β-catenin stability [27,28], we further analyzed their expression and subcellular localization using confocal microscopy. Consistent with the Western blot results, the loss of SALL2 significantly decreased the signal intensity of both cytoplasmic AXIN2 (Figure 3c) and FBXW11 (Figure 3d). However, the subcellular localization of these proteins seemed to be independent of SALL2.
Additionally, we conducted a differential expression analysis to investigate the association between SALL2 and the Wnt pathway-related genes in cancer. This analysis, conducted in 14 major cancers using the web tool TIMER 2.0 confirmed our previous observations. Specifically, cancers with SALL2 mutations displayed upregulated WNT7B and downregulated AXIN2 (Supplementary Figure S2). The findings indicate that loss of SALL2 in CRC cells is linked to changes in the expression of important Wnt pathway regulators, implying a connection between SALL2 and the suppression of the Wnt/β-catenin pathway.

2.4. The Expression of the Wnt/β-Catenin Regulator AXIN2 Depends on SALL2 Expression

We focused our analysis on understanding the SALL2-AXIN2 relationship. We analyzed whether AXIN2 mRNA expression depends on SALL2 using non-tumor HEK293 and several CRC cell models. Loss of SALL2 in HEK293 cells led to a significant decrease in AXIN2 mRNA levels compared to those in the SALL2+/+ condition (Figure 4a, left). This decrease in AXIN2 mRNA expression was correlated with a decrease in AXIN2 protein expression (Figure 4a, right). As SW480 cells were the only CRC cell line with detectable SALL2 expression, we investigated how the loss of SALL2 affects AXIN2 mRNA levels in CRC cells. Similar to the HEK293 cells, loss of SALL2 was correlated with a decrease in AXIN2 mRNA and protein levels (Figure 4b, left). This decrease in AXIN2 expression was reversed by reintroducing SALL2, confirming the rescue of AXIN2 regulation (Figure 4b, right).
We further investigated the SALL2-AXIN2 relationship in other CRC cell models. As SALL2 expression was undetectable in HT29, SW620, and SW48 CRC cells, we analyzed how inducible knock-in of SALL2 affected AXIN2 mRNA in these cells. Rescue of SALL2 expression significantly increased AXIN2 mRNA and protein levels in HT29 and SW620 CRC cells (Figure 4c, left and middle). Although a similar trend was observed in SW48 CRC cells, the increase in AXIN2 expression was not significant (Figure 4c, right).
Because AXIN2 is a direct target of the Wnt pathway, regulated by TCF/LEF factors [28], we examined the function of SALL2 in the context of two established activators of the canonical Wnt signaling pathway: lithium chloride (LiCl) and CHIR99021. These compounds inhibit GSK3β activity and stabilize cytosolic β-catenin [29,30]. Nevertheless, due to LiCl’s potential to influence additional pathways, our primary focus was on CHIR99021, which serves as a more targeted inhibitor of GSK3 [30,31,32]. AXIN2 expression relied on SALL2 under the Wnt pathway activation in HEK293 cells (Figure 4d,e). In the presence of both Wnt agonists, AXIN2 expression increased dose-dependently. This effect was abolished in the SALL2−/− HEK293 cells (Figure 4d,e). The qPCR analysis confirmed that AXIN2 mRNA induction depended on SALL2 and CHIR99021 (Figure 4f). Similarly, both agonists significantly increased AXIN2 mRNA in the SALL2+/+ SW480 cells but not in the SALL2−/− SW480 cells (Figure 4g,h), indicating that SALL2 is required for AXIN2 transcription, even under the Wnt pathway activation.
Altogether, our results strongly suggest that SALL2 is a novel positive regulator of AXIN2 gene transcription in the absence and presence of Wnt agonists.

2.5. SALL2 Attenuates Wnt/β-Catenin Signaling by Directly Transactivating the AXIN2 Promoter in CRC Cells

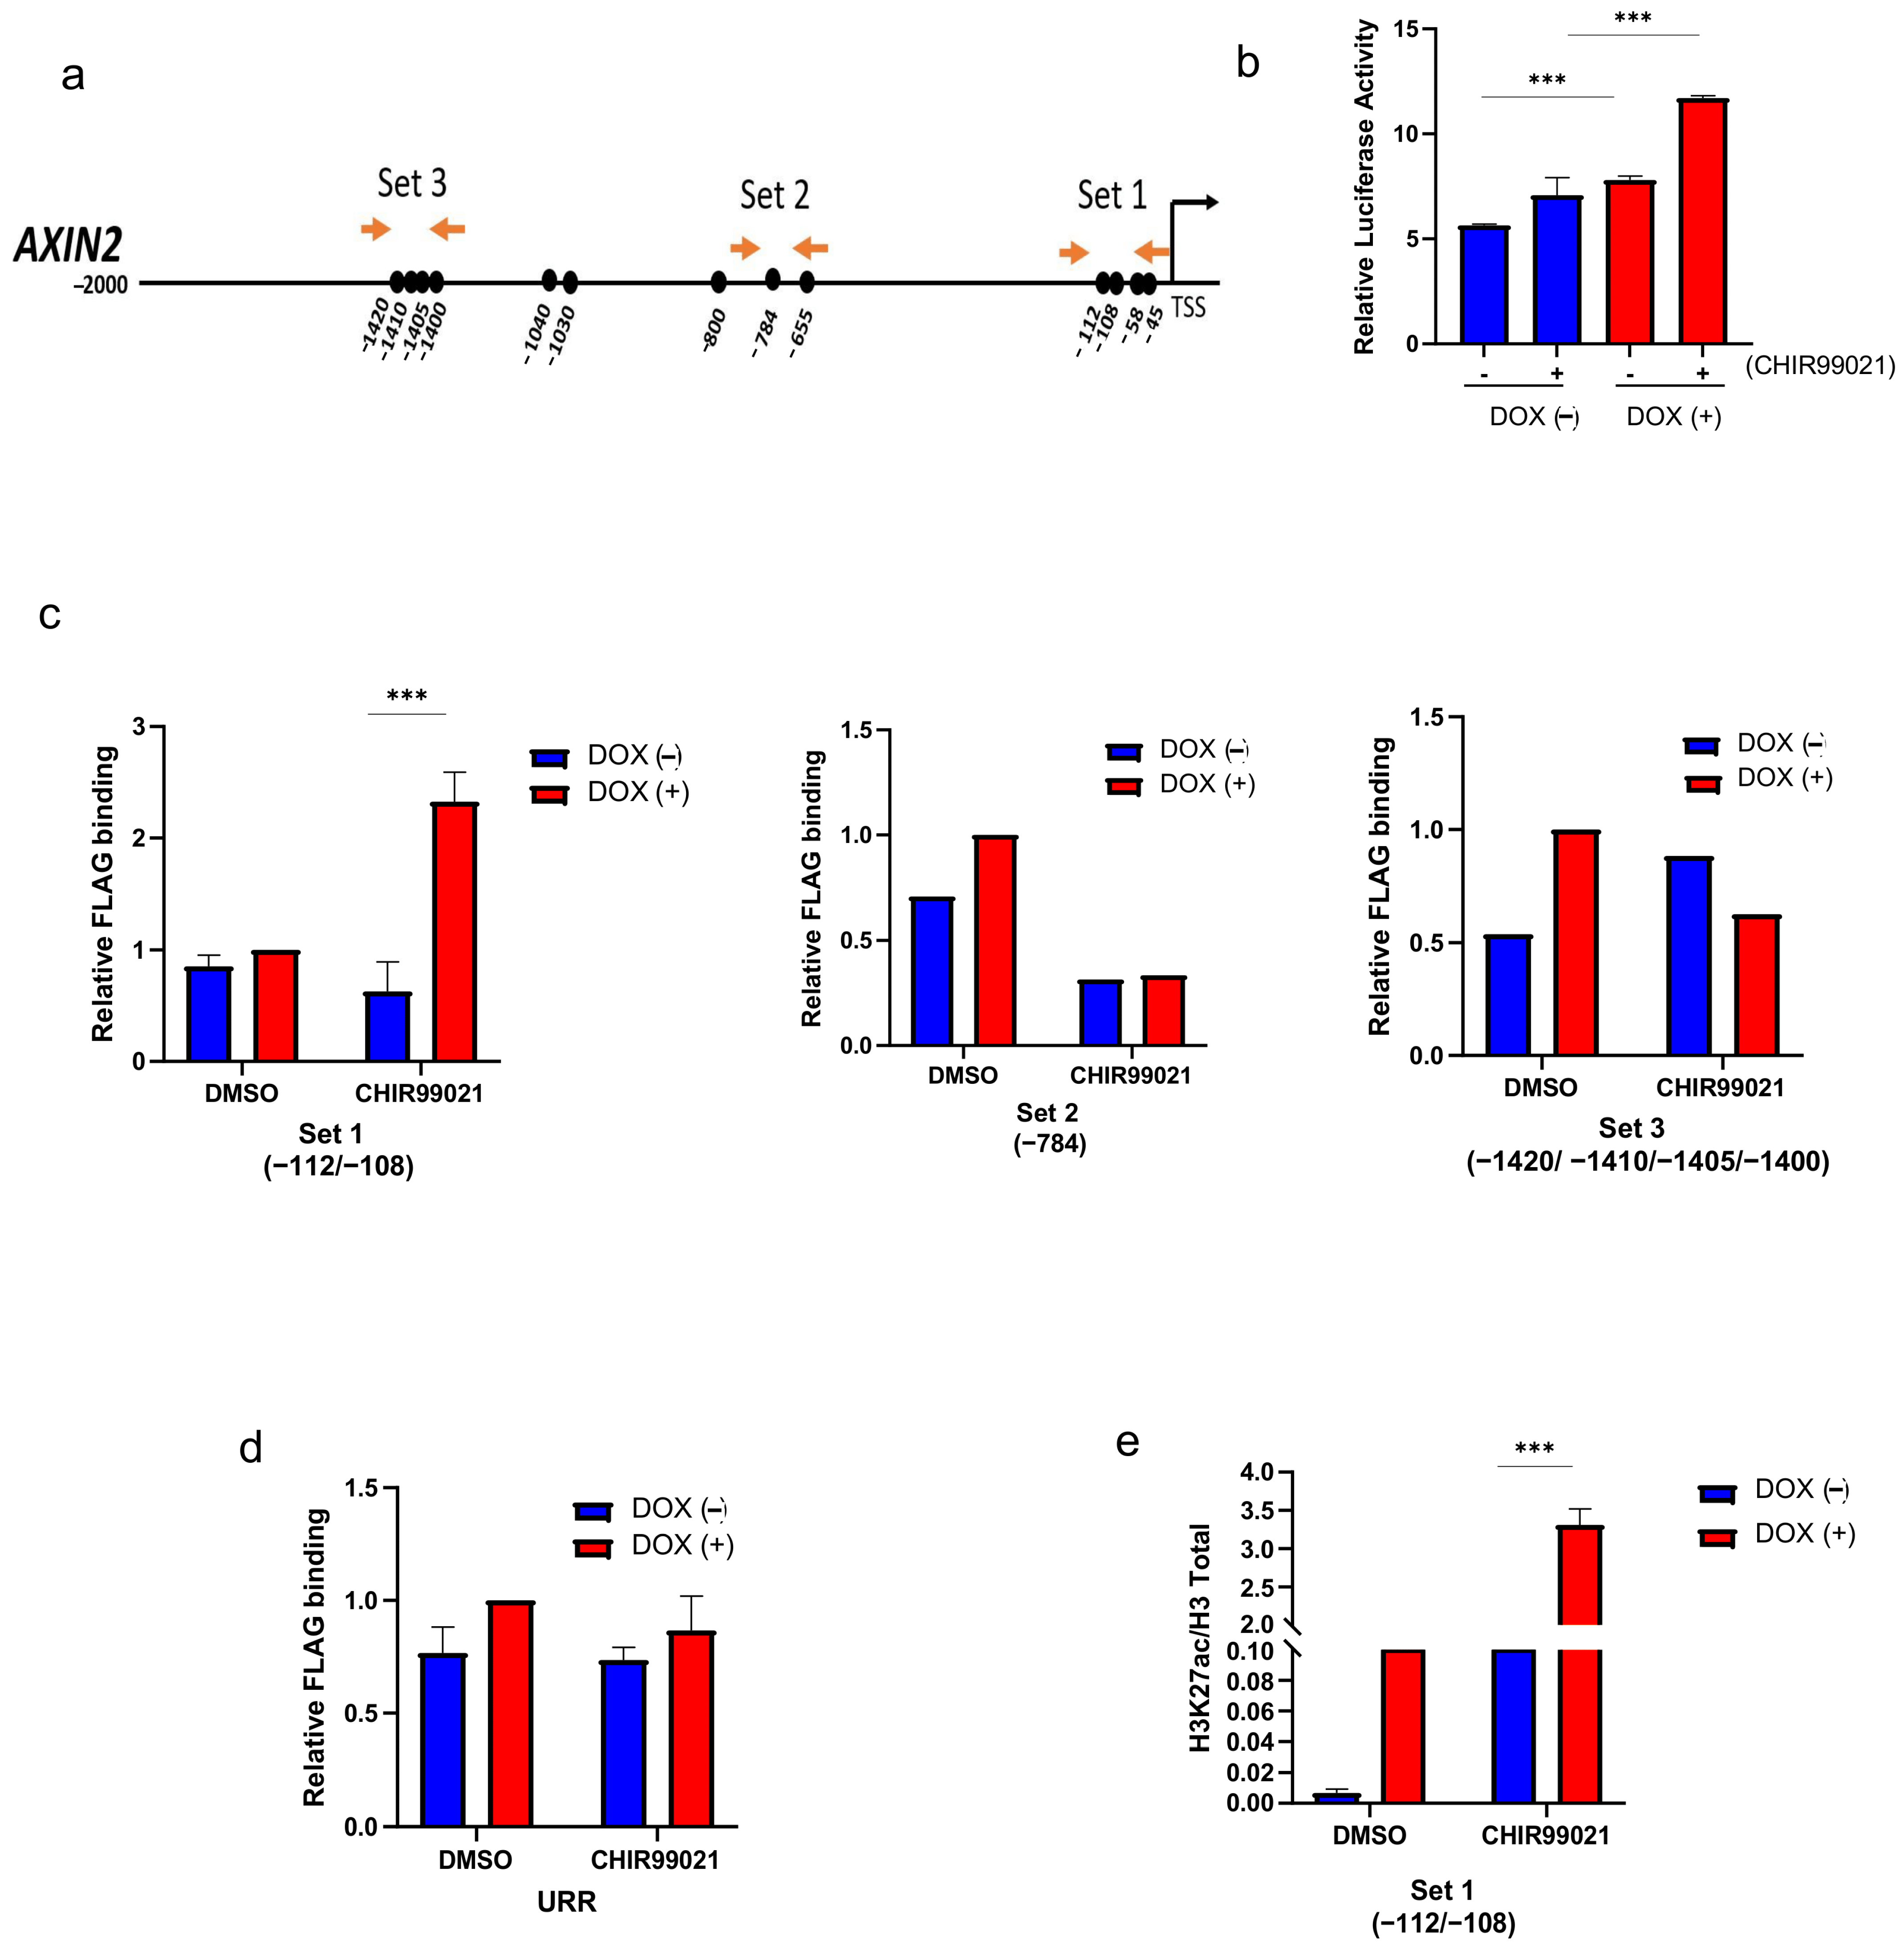
To further investigate the SALL2-dependent transcriptional regulation of AXIN2, we conducted a bioinformatics analysis of SALL2 binding sites within the 2 kb regions of the human AXIN2 promoter (ENSG00000168646). We used a previously reported binding site matrix [33,34]. Interestingly, we identified thirteen putative SALL2 binding sites in the AXIN2 promoter, as illustrated in Figure 5a. Seven of these sites were located within the proximal promoter region.
Next, through a luciferase-reporter assay, we evaluated the responsiveness of a previously reported human 1 Kb AXIN2 promoter [35], which contains 7 out of 13 SALL2 putative sites. We focused on the SALL2 E1A isoform because it exhibits the most significant overall change in expression levels in cancer [12]. Using the SALL2−/− HEK293 cells, we generated the SALL2E1A doxycycline-inducible HEK293 model. Cells were cultured in the absence and presence of doxycycline for 24 h, followed by treatment with CHIR99021 for 4 h. SALL2 E1A significantly increased the basal and the Wnt pathway-dependent AXIN2 promoter activity (Figure 5b), indicating that the SALL2 E1A isoform positively regulates the AXIN2 promoter activity.
To demonstrate the in vivo interaction of SALL2 E1A with the AXIN2 promoter, we performed a chromatin immunoprecipitation (ChIP) assay using the inducible SALL2E1A-HEK293 cells in the absence and presence of doxycycline and CHIR99021. Three specific primer sets (1 to 3) were used to evaluate SALL2 binding to different regions of the AXIN2 promoter (Figure 5a).
SALL2 E1A was bound to the proximal region of the AXIN2 promoter (-108/-112 from TSS), amplified by primers set 1, and its binding increased under CHIR99021 treatment; SALL2 binding was not observed in other distant regions (set 2 and set 3) (Figure 5c). In contrast, no SALL2 binding was detected in a non-related region [33] (URR; Figure 5d). The increase in SALL2 binding to the proximal region (set 1) after CHIR99021 treatment was correlated with a significant increase in histone H3 acetylation (H3K27ac) (Figure 5e), which is a marker of transcriptional activation [36,37]. These results demonstrated that SALL2 E1A binds and activates the AXIN2 promoter.

2.6. Suppression of Wnt Signaling by XAV939 Increased CRC Apoptosis in a SALL2-Dependent Manner

Tankyrase 1 inhibitor XAV939 is a small molecule inhibitor of the Wnt signaling pathway; it blocks Wnt signaling by stabilizing the AXIN2 protein, which leads to increased β-catenin destruction [38,39]. It was shown that AXIN2 gene silencing in embryonic stem cells (ESCs) reduces apoptosis by regulating the mitochondria-associated apoptosis pathway and modulating the Wnt/β-catenin signaling [40]. Consistent with the association of AXIN2 with apoptosis, the XAV939 inhibitor has been reported to significantly enhance apoptosis in SW480 cells, along with an increase in AXIN2 protein levels [41].
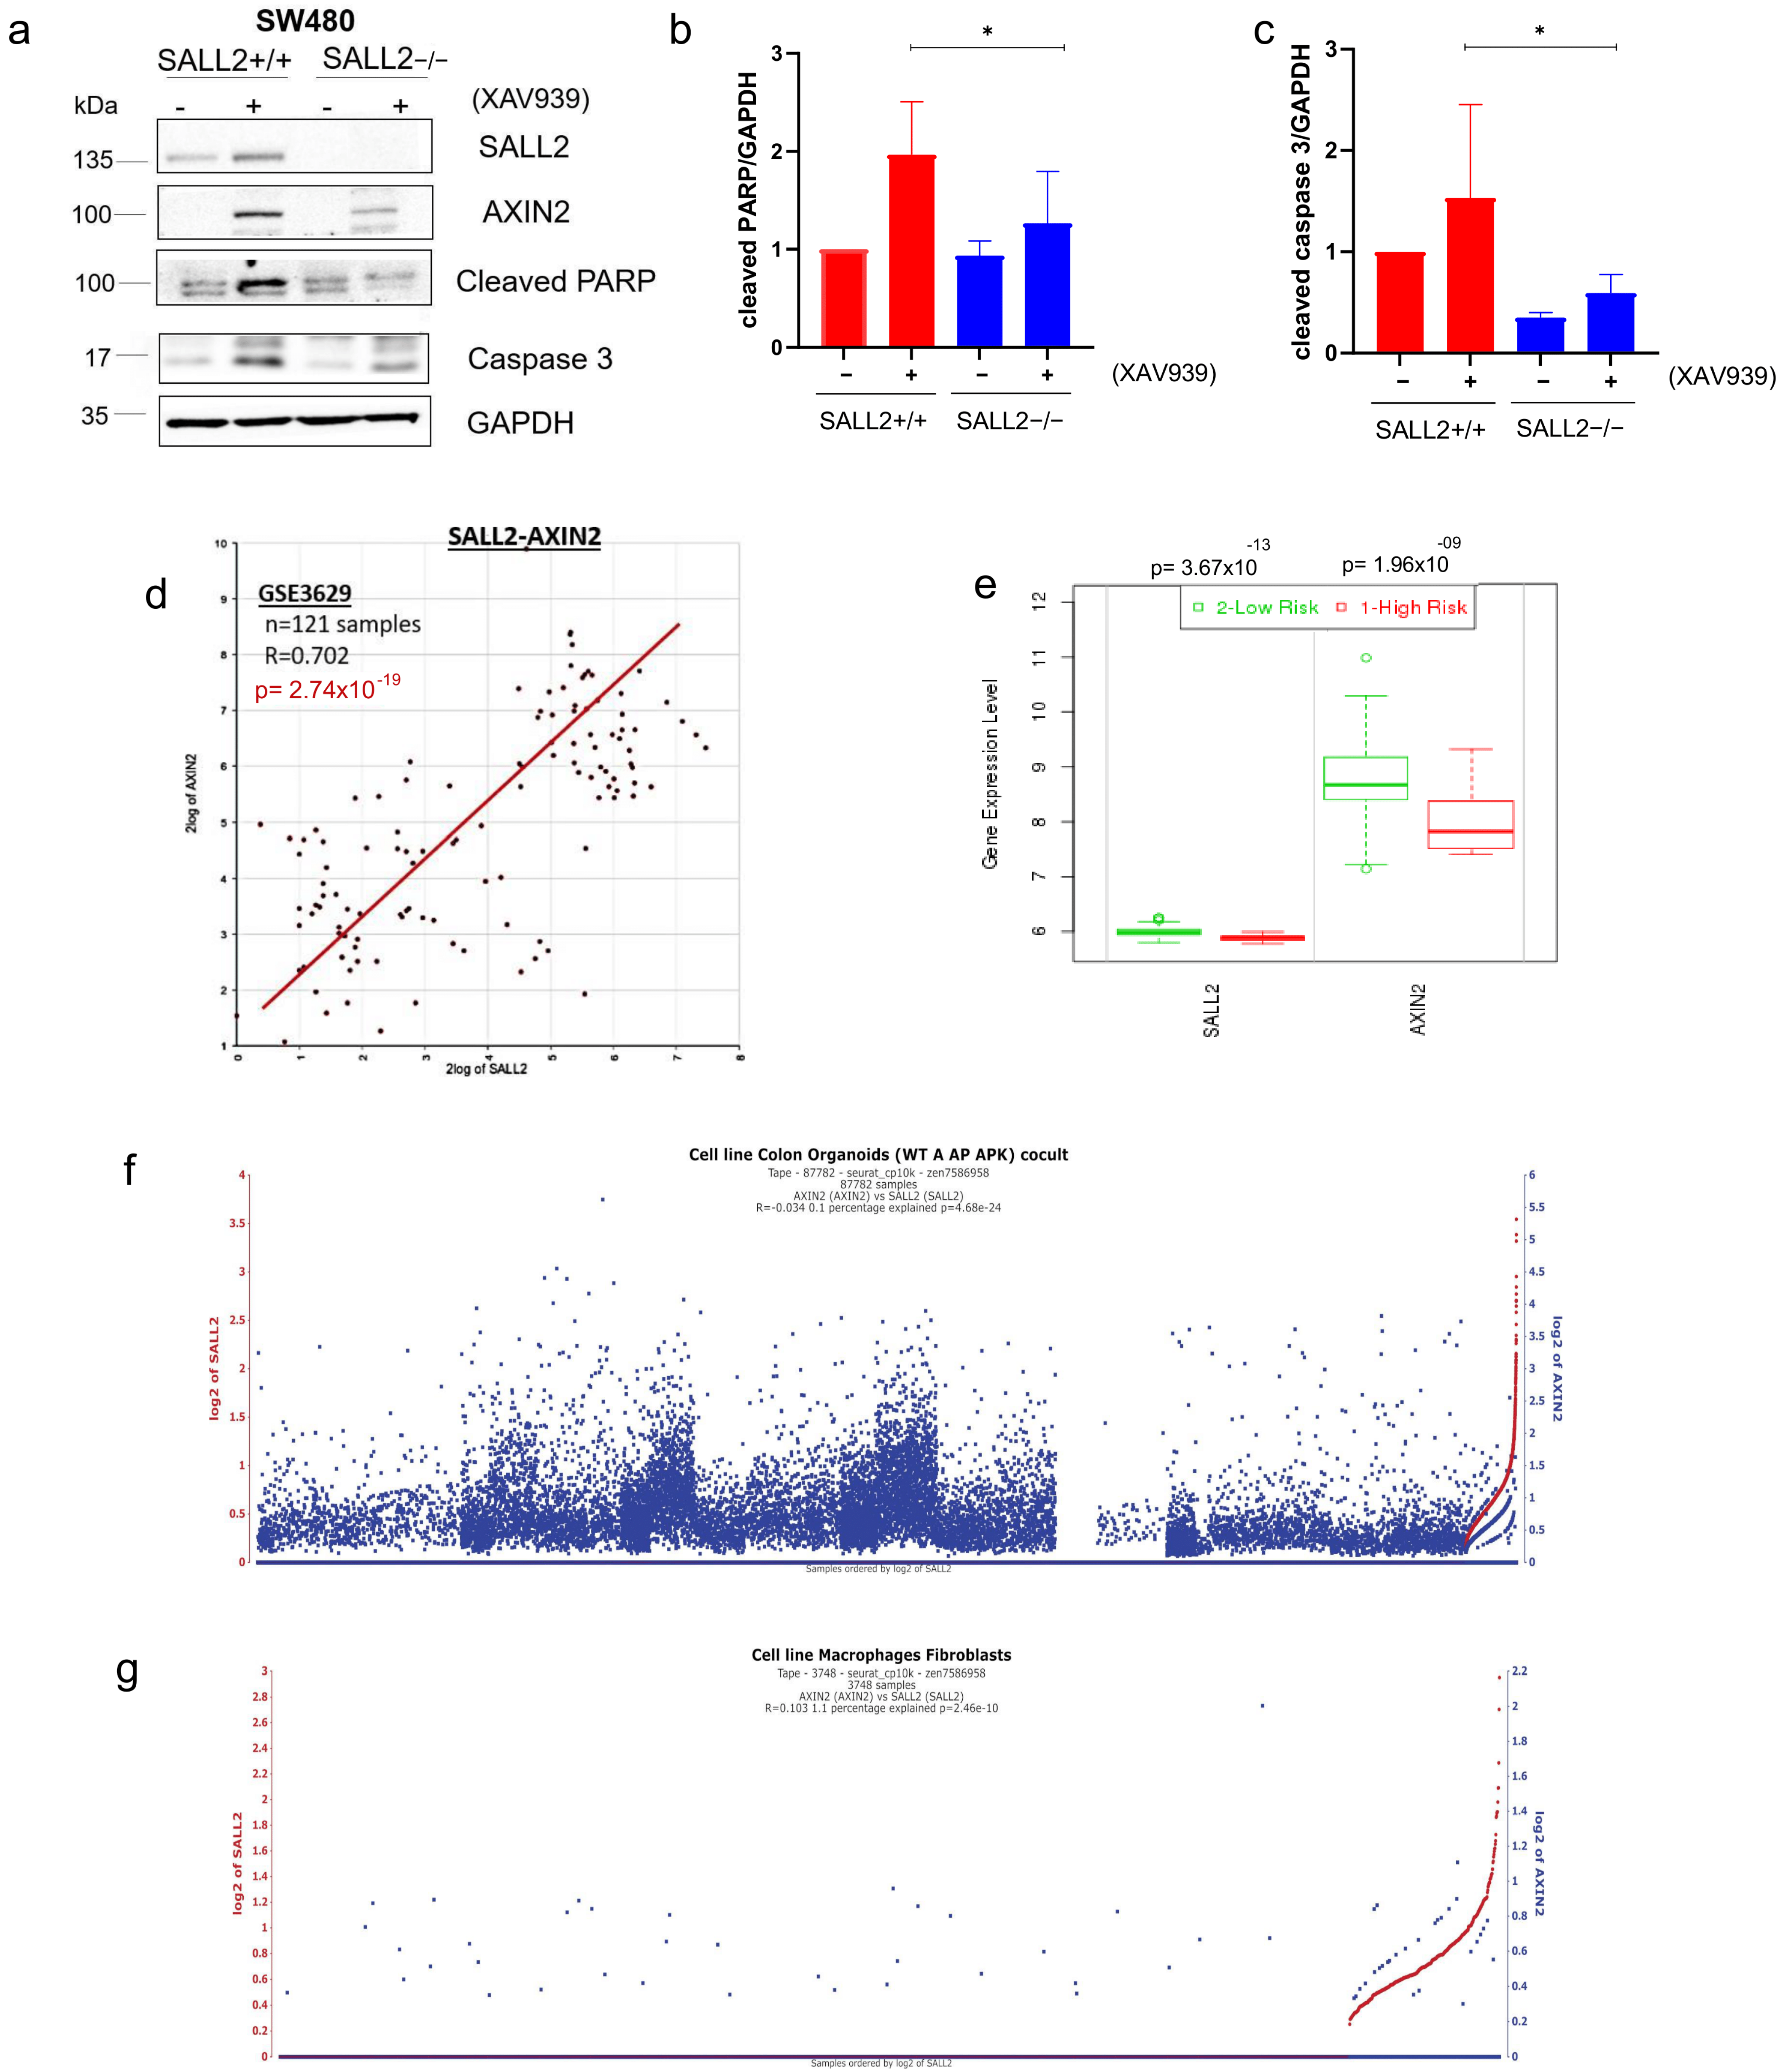
Therefore, we investigated the role of SALL2 in the XAV939-mediated apoptosis of CRC cells. Initially, SALL2+/+ SW480 cells were treated with XAV939 at various times to determine the optimal treatment conditions. AXIN2 and β-catenin were used as controls to assess the effects of the inhibitor. As expected, AXIN2 protein levels increased after 12 h, reaching maximum accumulation at 24 h; consequently, β-catenin levels significantly decreased at that time. Interestingly, SALL2 levels also increased at 24 h (Figure 6a).
Next, we evaluated the expression of apoptotic markers in the SALL2+/+ and SALL2−/− SW480 cells treated with XAV939 for 24 h. Consistent with a previous report, XAV939 treatment increased cellular apoptosis, as evidenced by the marked increase in cleaved caspase 3 and PARP (Figure 6a–c). However, levels of AXIN2 and the apoptotic markers were significantly diminished in the SALL2−/− cells (Figure 6a). These results suggest that the loss of SALL2 is associated with resistance to the Wnt pathway inhibition and cell death induced by XAV939.
Finally, we analyzed the potential clinical significance of the association between SALL2 and AXIN2. Further reinforcing their association, we found a positive correlation (R = 0.702, p = 2.74 × 10⁻¹⁹) in a colon cancer study (GSE3629) using R2 analysis (Figure 6d). Additionally, we examined a single-cell RNAseq analysis of CRC tumor microenvironment organoids [wild-type (WT), shApc (A), shApc and KrasG12D/+ (AK), shApc, KrasG12D/+, and Trp53R172H (AKP)] [42]. This analysis showed that a subset of AXIN2 positive/SALL2-positive cells in the tumor organoids microenvironment depicts a strong positive correlation between the two genes. Notice the steep correlation curve at the end between AXIN2 expression and SALL2-positive cells, regardless of global correlation (Figure 6e,f). Both studies demonstrate a positive correlation between SALL2 and AXIN2 in CRC. Moreover, employing the SurvExpress platform, we found evidence that colon cancer patients with higher cancer risk exhibited lower levels of SALL2 and AXIN2 compared to those with lower cancer risk (Figure 6g). However, data from primary CRC tumors (TCGA) and CBioportal web [43] showed a negative association between SALL2 and AXIN2 mRNA levels (Supplementary Figure S3), suggesting that the effect of SALL2 on AXIN2 might be context-dependent.
In summary, we showed that SALL2 is required for the sensitivity of CRC cells to the Wnt pathway inhibition. We also found evidence of a positive association between SALL2 and AXIN2 in CRC and that their loss is associated with higher CRC risk. Overall, we suggest that the SALL2-AXIN2 axis is an essential novel component of the Wnt/β-catenin signaling pathway and a potential molecular target for reversing drug resistance in colon cancer.

3. Discussion

SALL2 is a transcription factor that plays key roles in embryonic development, cell growth, programmed cell death, and cancer progression. It is regarded as a potential tumor suppressor because of its ability to inhibit cell proliferation and promote apoptosis in response to genotoxic stress [11]. SALL2 regulates the expression of tumor suppressor genes, including CDKN1A, CDKN2A, PMAP1, and PTEN, while repressing oncogenes such as CCND1, CCNE1, and c-MYC [14,16,18,19,44]. Studies have shown that SALL2 mRNA levels are diminished in several types of cancer, with a particularly significant reduction in the SALL2E1A isoform mRNA in colon cancer [12,13,14]. However, no functional studies have been conducted on SALL2 in colorectal cancer.
This study is the first to examine SALL2 protein expression and subcellular localization in CRC. Previous studies have shown that the expression and localization of SALL2 vary among different tissue types in a context-dependent manner. SALL2 is primarily nuclear in normal ovarian tissue but becomes undetectable in ovarian cancer. In breast cancer, it displays both nuclear and cytoplasmic patterns in primary tumors, but its expression disappears in advanced metastatic stages [14]. Our findings revealed that SALL2 is present in the normal colonic mucosa in both the nucleus and cytoplasm, with a predominant presence in the cytoplasm. Notably, SALL2 expression was significantly decreased in neoplastic tissues. We also observed higher levels of nuclear SALL2 expression in the stroma than in normal glands. SALL2 might be latent in the cytoplasm, as reported in neuronal cells [45], whereas nuclear SALL2 in stromal cells could play a role in maintaining tissue homeostasis. Consistent with our findings, a recent large-scale bioinformatic study of cancer showed a positive correlation between SALL2 and the stromal score in colon adenocarcinoma (COAD), stomach adenocarcinoma (STAD), and rectal adenocarcinoma (READ) [46]. Our multiplex IHC analysis indicated that SALL2-positive cells include epithelial enterocytes and fibroblasts in normal tissue. However, in colon adenocarcinoma, SALL2 expression decreased in both cell types and increased in type 1 macrophages (CD68+). The p53 tumor suppressor controls the tumor microenvironment (TME) through various mechanisms, primarily by regulating the cellular secretome [47]. Like wild-type p53, we hypothesize that a decrease in SALL2 levels in cancer-associated fibroblasts might influence the cellular secretome and, consequently, the tumor microenvironment. Given the essential role of the stroma in both normal colon epithelium and cancer progression, further investigation into the function of the SALL2 transcription factor in stromal cells is necessary.
When investigating the Wnt/β-catenin signaling pathway, it is essential to evaluate the nuclear concentrations of β-catenin, as these levels correlate with the pathway’s transcriptional activity and serve as a prognostic indicator of cancer development [48]. Our data from human tissues and CRC cells revealed an inverse correlation between SALL2 protein expression and the Wnt/β-catenin pathway activity. We demonstrated that SALL2 positively regulates AXIN2, an inhibitor of the Wnt pathway, and loss of SALL2 is associated with increased nuclear β-catenin levels. Additionally, SALL2 may negatively regulate the Wnt3A and Wnt7B activators and positively regulate the Wnt pathway inhibitor FBXW11. Although further studies are necessary, these findings support the notion that SALL2 functions as a novel regulator of the Wnt/β-catenin pathway. Interestingly, Onai et al. found that the Xenopus SALL2 orthologue, XsalF, negatively affects the Wnt/β-catenin pathway by promoting the transcription of pathway inhibitors like tcf3 and gsk3-β [21], suggesting a conserved regulatory mechanism of the Wnt pathway by SALLs.
ChIP experiments demonstrated that SALL2 binds to the AXIN2 proximal promoter in vivo; however, it remains uncertain whether this binding occurs directly to the consensus sequence or indirectly, as seen with its paralog SALL1. SALL1 influences the canonical Wnt pathway without directly binding to chromatin; instead, it interacts with β-catenin and, along with pathway activators such as Wnt3A, enhances Wnt signaling as a co-regulator [49]. Similarly, SALL4 upregulates the Wnt/β-catenin pathway activity by directly binding to and transactivating the CTNNB1 gene promoter [50]. Regardless of the mechanism, SALL2 functions in opposition to SALL1 and SALL4 in the Wnt/β-catenin pathway. Intriguingly, SALL1 is downregulated in colon cancer [51], whereas SALL4 is overexpressed in it [52]. These observations suggest a potential interplay between SALL family members and the Wnt signaling pathway in colorectal cancer.
Consistent with SALL2’s role in the Wnt pathway, similar to other negative regulators, such as AXIN2 [53], activating this pathway with CHIR99021 or LiCl increases SALL2 protein expression, which is likely necessary to control the level of pathway activation. The SALL2 promoter contains TCF-LEF binding sites, which may explain transcriptional regulation [54]. Nonetheless, SALL2 post-translational regulation may be involved. We recently demonstrated the regulation of SALL2 stability by phosphorylation and proteasome-induced degradation via CK2. Treatment of SW480 CRC cells with CX4549, a CK2 inhibitor, increased SALL2 protein levels and function [24]. Similarly, a post-translational regulation mediated by kinases of the Wnt pathway such as GSK3β could also exist, considering that both CHI99021 and LiCl inhibit GSK3 activity. Similarly, we observed that the inhibition of tankyrase with XAV939 increased SALL2 protein levels.
Previous studies have shown that XAV939 induces apoptosis in the SW480 cell model, making it more susceptible to treatment with 5-fluorouracil (5-FU) or cisplatin [41]. SALL2 plays a pro-apoptotic role by regulating various transcriptional targets [19,44]. Furthermore, its levels increase in response to chemotherapeutic agents such as doxorubicin, which may explain the observed elevation following XAV939 treatment. Therefore, our findings highlight the importance of evaluating SALL2’s role in apoptotic mechanisms when using combination therapies involving XAV939 and chemotherapeutic agents such as 5-FU or oxaliplatin/cisplatin. Further research is needed to understand how the Wnt pathway regulates SALL2 expression.
The regulation of AXIN2 by SALL2 may have significant implications for controlling the aberrant activation of the Wnt/β-catenin pathway in diseases. However, AXIN2 regulation is complex and depends on several mechanisms, including epigenetics [55], post-transcriptional via ALKBH5-mediated m6A demethylation [56], transcriptional via CDX2 [57], or post-translational via tankyrase [58], among others. Thus, it is not surprising that, contrary to our main findings, some dataset analysis showed a negative association between SALL2 and AXIN2 mRNA levels in CRC. These results suggest that the effect of SALL2 on AXIN2 expression may be context-dependent.
AXIN2 plays a crucial role in the phosphorylation and breakdown of β-catenin, forming a part of the destruction complex along with AXIN1. Despite their similarities, AXIN1 and AXIN2 are not interchangeable; AXIN2 is vital for β-catenin degradation, as its suppression halts this process, whereas silencing AXIN1 does not [59]. AXIN2, although typically a negative regulator of the Wnt/β-catenin pathway, can act as a promoter of oncogenesis by enhancing Snail1-driven epithelial−mesenchymal transition (EMT), which contributes to cancer cell invasion and metastasis [60], and has been detected overexpressed in CRC tissues, mainly in the cytoplasm of tumor epithelial cells [61]. In addition, AXIN2 has important functions in the nucleus. It acts as a bridge between the transcription factors TCF and β-catenin, aiding in the reduction of target expression in the c-MYC pathway [62]. Nuclear import of AXIN is essential for relocating β-catenin to the cytoplasm. The shuttling of AXIN between the nucleus and cytoplasm enhances the export of β-catenin from the nucleus, facilitating its breakdown or interaction with E-cadherin in the cytoplasm, thereby modulating β-catenin signaling in the absence of Wnt signals. Future studies should clarify which AXIN functions depend on its regulation by SALL2.
Recent studies have identified AXIN2 as a promising therapeutic target in the context of APC mutations [63,64,65,66]. Mechanistically, AXIN1/2 proteins are continuously degraded by tankyrase, an enzyme responsible for ADP-ribosylation [64]. Therefore, inhibiting tankyrase has been proposed to stabilize AXIN2, significantly suppressing the Wnt signaling pathway. Our research showed that SALL2 is associated with an enhanced cell death response to XAV939 in colon cancer cells compared to CRC cells lacking SALL2. This finding suggests that SALL2 enhances the effectiveness of the Wnt pathway inhibitor. However, it remains uncertain whether SALL2 contributes to apoptosis in these cells independently of AXIN2 in this context.
SALL2 may serve as a potential biomarker for the suspicion of polyps, as there was a significant downregulation of SALL2 in the early stages of CRC progression, such as adenoma, in our cohort. Although our study provided the first evidence for SALL2 downregulation in CRC at the protein level, this observation was consistent with two previous studies showing a decrease in SALL2 mRNA in this disease [12,46]. Together, these findings indicate the role of SALL2 as a tumor suppressor in CRC. SALL2 repression of the Wnt/β-catenin pathway via regulation of AXIN2 and other WNT pathway regulators supports this notion. Moreover, survival analyses of our CRC patients suggested poorer outcomes for those with low SALL2 expression. While earlier studies, such as Ma, T. et al., have linked SALL2 expression to unfavorable outcomes in rectal cancer [46], our CRC dataset was primarily composed of colon cancer cases (44 out of 48 colorectal cancer instances), with only a small number of rectal cancer cases (n = 4), limiting any significant site-specific comparison. Nonetheless, the genetic context, or SALL2 carrying some activating mutations, as demonstrated for p53, may shed light on this controversy. Further studies with additional patient cohorts, along with sequencing and transcriptome analyses, could help clarify the significance of SALL2 expression in colon and rectal cancers.

4. Materials and Methods

4.1. Bioinformatics Analysis

We used the UALCAN database (http://ualcan.path.uab.edu/, accessed on 25 January 2025) to correlate tumor gene expression and survival. The screening conditions set in this study were as follows: “Gene: SALL2”, “Analysis Type: colon cancer vs. normal analysis”, and “Data Type: TCGA dataset”. We used the TIMER Database Analysis to analyze the differentially expressed genes in the context of CRC with SALL2 mutations (http://cistrome.shinyapps.io/timer, accessed on 15 May 2025). This evaluation was conducted through the “Gene mutation” feature. In addition, we generated scatter plots of SALL2 and AXIN2 using publicly available databases and R2 software: Genomics Analysis and Visualization Platform (http://r2.amc.nl, accessed on 15 May 2025) using single-cell data [42,67]. Pearson’s correlation coefficients (r) and associated p-values (p) were calculated using the default HugoOnce algorithm and ANOVA statistical test.

4.2. Patients and Tissue Microarray Construction

The cohort was 130 paraffin-embedded human samples from colon cancer patients diagnosed at Guillermo Grant Benavente Hospital between 2018 and 2021, comprising adenomas (n = 40), CRC (n = 48; 44 colon and 4 rectal tumors), and healthy adjacent mucosa (n = 42). Formalin-fixed paraffin-embedded (FFPE) samples were obtained from patients, following a protocol approved by the Ethics Committee of the Universidad de Concepción and Guillermo Grant Benavente Hospital (Protocol #20-03-12, Concepción, Chile). The clinicopathological information obtained from each biopsy report was summarized in Supplementary Tables S1 and S2. Supplementary Table S2 focuses exclusively on the data from CRC patients (n = 48). A tissue microarray (TMA) was generated. Before TMA construction, tumor areas were identified and marked on hematoxylin/eosin-stained slices by specialized pathologists. TMA samples were prepared to comprise a core of 3.0 mm from each tumor. TMA sections of 4 μm (µm) were processed on microscope slides (FLEX IHC, Dako, Stockholm, Sweden) and dried in an oven for two hours at 60 °C.

4.3. Immunohistochemistry (IHC)

Protein expression in histological samples was analyzed in the TMA by IHC. Per the manufacturer’s instructions, we used 4 µm-thin sections from FFPE TMA on the EnVision™ FLEX, High pH (Dako Autostainer, Glostrup, Denmark). We used antibodies against SALL2, Ki-67, and β-Catenin, as detailed in Supplementary Table S3. For the previously characterized SALL2 antibody [12,16,33,68], we standardized the optimal conditions to maximize SALL2 antigen recovery in the colon samples. (Supplementary Figure S4a). To validate SALL2 staining, SALL2-positive HEK293 cells were used as a positive control. Negative controls included the SALL2-positive HEK293 cells and normal colon tissue without the anti-SALL2 antibody. Moreover, to confirm the specificity of the SALL2 antibody, we utilized a previously described SALL2 knockout (SALL2−/−) HEK293 cell model [16] (Supplementary Figure S4b).

4.4. Multiplexed Immunofluorescence (mIF)

Immunostaining was carried out as published [69] and each primary cocktail (or panel) was developed using validated antibodies [69,70]. Panels included Vimentin (clone V9, Thermo Scientific, Waltham, MA, USA), Cytokeratin (clone AE1/AE3, Invitrogen, Carlsbad, MA, USA), CD68 (clone PG-M1, Abcam, Cambridge, UK), CD8a (clone C8/144B, Dako, Glostrup, Denmark), and DAPI. All slides were scanned at a 20X magnification using an Aperio VERSA 200 microscope (Leica Biosystems, Vista, CA, USA). In the mIF analysis, segmentation of either the cytoplasm or nucleus was conducted as necessary using the open-source software QuPath v0.6.0. The quantification process relied on selecting regions of interest (ROIs) and co-localizing markers by employing automated thresholding.

4.5. IHC Analysis

The percentage of SALL2-positive cells was determined by counting 100 cells per image from 3 randomly selected high-power fields per sample at a 10× magnification using the cell counter tool of Image J software Version 1.54p. The analysis considered epithelial versus stromal cells and nuclear versus cytoplasmic localization. A positive staining was considered if SALL2 was nuclear. Thus, the percentage of SALL2-positive nuclei in epithelium or stroma was obtained. Furthermore, SALL2 staining intensity in the nucleus and cytoplasm was scored from 0 to 3 (no staining, weak staining, moderate staining, and strong staining). The β-catenin expression was evaluated as reported [71]. Evaluation of immunostaining was independently performed by two observers (A.Q. and C.D.), blinded to clinical data. The agreement between the two observers was >90%.

4.6. Agar-Cyto IHC

Cells (2 × 10⁶) were seeded in 6-well plates. Cells were fixed with methanol and pelleted by centrifugation for 10 min at 2000 rpm. The supernatant was removed, and the pellet was carefully resuspended in 1 mL of 2% liquid agarose at 65 °C (LE, analytical grade; Promega, Madison, WI, USA). The solidified agar was placed in a Tissue-Tek cassette (Sakura FineTek, Nagano, Japan) and embedded in paraffin using an automated tissue processor (Tissue-Tek VIP150; Sakura, Nagano, Japan) under standard conditions for surgical biopsies. Then, the IHC was performed in the agar-cyto.

4.7. Cell Culture and Lentiviral Transduction

HEK293 (ATCC, CRL-1573) and SALL2KO HEK293 [16] cells were cultured in DMEM (HyClone, Logan, UT, USA), with 10% fetal bovine serum (FBS, Biological Industries, Beit HaEmek, Israel) and 0.5% penicillin/streptomycin (Invitrogen, Carlsbad, MA, USA). CRC cell lines HT-29 (ATCC, HTB-38), SW480 (ATCC, CCL-228), SW480 SALL2KO [24], SW620 (ATCC, CCL-227), DLD-1 (ATCC, CCL-221), SW48 (ATCC, CCL-231), and HCT116 (a gift from Dr. Robert Warren, UCSF, USA) were cultured in RPMI-1640 (HyClone, Logan, UT, USA) supplemented with 10% FBS. Cells were cultured in a 37 °C and 5% CO2 atmosphere.

Generation of pCW57 Tet-On FLAGSALL2E1A

The pCW57 Tet-On FLAG-tagged SALL2E1A plasmid was generated by subcloning human FLAG-SALL2E1A, which was previously generated by ligating the human N-terminal FLAG-tagged SALL2E1A with the Exon 2 region of SALL2E1, conserved in both isoforms. The N-terminal exon 1 of SALL2E1A (ENST00000537235.2) tagged with FLAG was synthesized by GeneScript (http://www.genscript.com/, accessed on 15 May 2025) and amplified by PCR using the primers 5′-GCAGACCGGTATGGACTACAAAGACGATGA-3′ (forward) and 5′-TGGCAGCGACCAGGAAATGC-3′ (reverse). Exon 2 of SALL2, shared by both SALL2 E1 and E1A isoforms, was digested from the pCW57 Tet-On FLAG-tagged human SALL2E1 plasmid using BamHI to remove the N-terminal of the E1 isoform. The fragment containing only the Exon 2 was then ligated with the PCR-amplified FLAG-SALL2E1A fragment, generating the human FLAG-SALL2E1A, which was subsequently subcloned into the pCW57-MCS1-2A-MCS2 lentiviral vector using AgeI and AvrII restriction sites. The integrity of the full-length FLAG-tagged SALL2E1A coding sequence was confirmed by sequencing at Macrogen (Seoul, Republic of Korea, https://dna.macrogen.com/, accessed on 15 May 2025). The inducible expression of FLAG-tagged human SALL2E1A was confirmed by Western blot.
The reconstitution of SALL2E1A in the colorectal cancer cell lines HT-29, SW620, SW48, and SW480KO was as previously described for SALL2KO HEK293 cells [16]. For SALL2E1A induction, CRC or HEK293 cell lines were treated with doxycycline (1000 ng/mL) for 48 h before each experiment, and SALL2 expression was confirmed by Western blot. The cell lines used in this study were regularly tested for mycoplasma using the EZ-PCR Mycoplasma Test Kit (Biological Industries, Beit HaEmek, Israel).

4.8. Immunofluorescence Staining

To evaluate the subcellular localization of β-catenin, HT29 and SW480 cell models were placed on coverslips and fixed using 4% paraformaldehyde for 30 min. Coverslips were rinsed with PBS, and cells were permeabilized with 0.2% Triton X-100 for 10 min. Following three PBS washes, cells were incubated with a β-catenin antibody (Supplementary Table S3) for 16 h. After being washed with PBS, cells were incubated with Alexa Fluor-488 conjugated secondary antibody (1:500 goat anti-mouse, Invitrogen) for 2 h and Hoechst 33342. After three times PBS washes, images were captured under confocal microscopy, LSM780 NLO Zeiss, in the Advanced Microscopy Center (CMA) at Universidad de Concepción. Nuclear segmentation utilized the DAPI channel to create a mask, which was then applied to the β-catenin green fluorescence channel to measure the nuclear fluorescence intensity. Image analysis was conducted using Fiji (ImageJ Version 1.54p) software to quantify the mean fluorescence intensity within the segmented nuclear areas.

4.9. Subcellular Fractionation

The nuclear/cytoplasmic fractionation was performed using an in-house protocol [72] with nuclear extraction buffer (10 mM HEPES, pH 7.9; 1.5 mM MgCl2; 10 mM KCl) and cytoplasmic extraction buffer (20 mM HEPES, pH 7.9; 25% (v/v) glycerol; 0.42 M NaCl; 1.5 mM MgCl2; 0.2 mM EDTA), and then, the lysate fractions were separated in an SDS/PAGE. HDAC1 and GAPDH were controls for nuclear and cytoplasmic fractions, respectively.

4.10. Western Blot Analysis

Cells were lysed in 25 mM Tris/HCl pH 7.5, 150 mM NaCl, 1% NP-40, 2 mM MgCl2, and 5% glycerol, supplemented with protease and phosphatase inhibitor cocktails. Cell lysates fractionation and Western blot analysis were performed as previously (for primary antibodies and dilutions; see Supplementary Table S3) [16].

4.11. Real-Time Quantitative Reverse Transcription

Total RNA was extracted from cells with TRIzol reagent (Thermo Fisher Scientific, Waltham, MA, USA) according to the manufacturer’s instructions. RNA was treated with Turbo DNase (Thermo Fisher Scientific, Waltham, MA, USA). The retro-transcription was performed using MMLV-RT (Invitrogen, Carlsbad, MA, USA), 0.25 µg of Anchored Oligo(dT) 20 Primer (catalog 12577-011, Invitrogen, Carlsbad, MA, USA), and 2000 ng of RNA. qPCR was performed using KAPA SYBRG green (Kappa Biosystems, Wilmington, MA, USA). The forward and reverse primers are detailed in Supplementary Table S4.

4.12. Luciferase Reporter Gene

HEK293 SALL2E1A doxycycline-inducible cells (3 × 10⁵) were seeded into 6-well plates and transfected with AXIN2 1000 pb promoter reporter by 24 h (a gift from Eric Fearon (Addgene plasmid # 25701) [35] or pGL3-Basic as a negative control and 0.125 μg of RSV-β-galactosidase (GLB1) used for internal normalization. Cells were harvested after 48 h and lysed using lysis buffer (Promega, Madison, WI, USA). Luciferase reporter gene assay was implemented using the Dual-Luciferase Reporter Assay System (Promega, Madison, WI, USA) as previously described [33].

4.13. Chromatin Immunoprecipitation Assay (ChIP Assay)

The ChIP assay was carried out as previously [33] with the following modifications: HEK293 FLAG-SALL2E1A doxycycline-inducible cells (2 × 10⁶ cells/100 mm plate) were seeded, and then, doxycycline (1μg/mL, for 48 h, Cayman Chemical #14422) was added to induce the expression of FLAG-SALL2E1A. Immunoprecipitations were carried out overnight at 4 °C using 1 μg anti-FLAG (M2, F1804, Sigma-Aldrich, St. Louis, MO, USA) or 5 μg normal mouse IgG antibodies and 40 μg of chromatin. DNA was analyzed by real-time PCR directed to SALL2-specific proximal regions of the AXIN2 promoter. Primer sequences are detailed in Supplementary Table S3. In addition, a previously reported unrelated region (URR) of the PMAIP1 promoter (−869/−756) was used as a negative control of SALL2 binding [33]. All qPCRs were performed using a KAPA SYBR FAST kit (Kappa Biosystems, Wilmington, MA, USA) containing 1 μL of input and 3 μL of IP samples.

4.14. Statistical Analysis

Statistical analyses were performed using GraphPad Prism 8.0 software. Our results were presented as means ± standard deviation. Statistical significance was indicated with asterisks, and p-values were calculated using Chi-square, Student’s t-test, ANOVA, and post hoc analysis, wherein *, **, and *** represented p < 0.05, p < 0.01, and p < 0.001, respectively. Additional methods are available as Supplementary Materials accompanying the online article.

5. Conclusions

Our findings support a tumor suppressor role for SALL2 in colorectal cancer, mediated in part through a previously unrecognized SALL2-dependent regulatory mechanism involving AXIN2, a key negative modulator of Wnt/β-catenin signaling. Loss of SALL2 expression may contribute to hyperactivation of the Wnt/β-catenin pathway, thereby promoting tumor progression and influencing therapeutic responsiveness. Notably, SALL2 enhances the pro-apoptotic effects of the Wnt pathway inhibition, suggesting its involvement in modulating treatment sensitivity. Future studies are warranted to further explore the role of the SALL2AXIN2 axis in response to standard chemotherapeutic agents such as 5-fluorouracil (5-FU) and to validate the clinical utility of SALL2 as a prognostic and predictive biomarker in CRC.

Supplementary Materials

The following supporting information can be downloaded at: https://www.mdpi.com/article/10.3390/ijms26167896/s1.

Author Contributions

A.Q. and R.P. performed conceptualization. A.Q. conducted the main experiments. C.F., E.E., D.B.-R., M.P., P.S. and P.M. contributed to technical support and data analysis. C.D., F.V.-E., M.I.H., A.F.C., and R.P. supervised the research. F.V.-E., C.D., A.F.C. and R.P. provided funding and resources. A.Q., E.E., A.F.C. and R.P. wrote the original draft. All authors have read and agreed to the published version of the manuscript.

Funding

This research was funded by Fondecyt Grants #1191172 and #1241771 to R.P., Fondecyt Grant #1201215 to A.F.C., CONICYT fellowship #21181183 to A.Q., and Fondecyt Grant# 1221415 to F.V-E.

Institutional Review Board Statement

The study was conducted in accordance with the Declaration of Helsinki and approved by the Ethics Committee of UNIVERSIDAD DE CONCEPCION (protocol code #20-03-12; date of approval: 23 June 2020) for studies involving formalin-fixed paraffin-embedded (FFPE) samples obtained from patients.

Informed Consent Statement

The waiver of informed consent was granted due to the retrospective nature of the study and the difficulty in contacting patients under this design, which could compromise the proposed sample size. Additionally, the study used only archived, formalin-fixed paraffin-embedded (FFPE) tissue samples. As an exploratory study, it will not influence or alter any therapeutic decisions yet.

Data Availability Statement

The original contributions presented in this study are included in the article/Supplementary Materials. Further inquiries can be directed to the corresponding author(s).

Acknowledgments

We acknowledge students Angela Ortiz, Constanza Mardones, and José Miguel Navarrete for technical support and the TSC laboratory members for scientific discussions. We also acknowledge Alexis Salas and Victor Fica for bioinformatics support and Juan Pablo Henríquez for helping with specific reagents. Finally, we thank the Centro de Microscopía Avanzada, Universidad de Concepción, for assistance with the immunofluorescence images. This work was supported by Fondecyt Grants #1191172 and #1241771 to R.P., Fondecyt Grant #1201215 to A.F.C., CONICYT fellowship #21181183 to A.Q., and Fondecyt Grant# 1221415 to F.V-E.

Conflicts of Interest

The authors declare no conflicts of interest.

Abbreviations

The following abbreviations are used in this manuscript:
CRC—colorectal cancer; COAD—colon adenocarcinoma; READ—rectal adenocarcinoma; SALL—Spalt-like; AXIN2—axis inhibition protein 2/conductin; ChIP—chromatin immunoprecipitation; DMSO—dimethyl sulfoxide; EDTA—ethylene diamine tetra acetic acid; FBS—fetal bovine serum; GAPDH—glyceraldehyde-3-phosphate dehydrogenase; CK—casein kinase; GSK-3β— glycogen synthase kinase 3; TCF—T-cell factor/lymphoid enhancer factor; NLS—nuclear localization signal; PARP—Poli (ADP-Ribose) Polimerase 1; PFA—p-formaldehyde; LiCl—lithium chloride; PMAIP1—Phorbol-12-Myristate-13-Acetate-Induced Protein 1; SDS—Sodium Dodecyl Sulfate; FDA—food and drug administration; CMS—Consensus Molecular Subtype; SEM—Standard Error of the Media.

References

  1. Bray, F.; Ferlay, J.; Soerjomataram, I.; Siegel, R.L.; Torre, L.A.; Jemal, A. Global cancer statistics 2018: GLOBOCAN estimates of incidence and mortality worldwide for 36 cancers in 185 countries. CA Cancer J. Clin. 2018, 68, 394–424. [Google Scholar] [CrossRef]
  2. Brierley, J.; Eycken, E.V.; Rous, B.A.; Giuliani, M.; O’Sullivan, B. TNM Classification of Malignant Tumours; Wiley: Hoboken, NJ, USA, 2025; ISBN 1394216858. [Google Scholar]
  3. Lin, C.H.; Lin, J.K.; Chang, S.C.; Chang, Y.H.; Chang, H.M.; Liu, J.H.; Li, L.H.; Chen, Y.T.; Tsai, S.F.; Chen, W.S. Molecular profile and copy number analysis of sporadic colorectal cancer in Taiwan. J. Biomed. Sci. 2011, 18, 36. [Google Scholar] [CrossRef]
  4. Hu, F.; Wang, J.; Zhang, M.; Wang, S.; Zhao, L.; Yang, H.; Wu, J.; Cui, B. Comprehensive Analysis of Subtype-Specific Molecular Characteristics of Colon Cancer: Specific Genes, Driver Genes, Signaling Pathways, and Immunotherapy Responses. Front. Cell. Dev. Biol. 2021, 9, 758776. [Google Scholar] [CrossRef] [PubMed]
  5. Menter, D.G.; Davis, J.S.; Broom, B.M.; Overman, M.J.; Morris, J.; Kopetz, S. Back to the Colorectal Cancer Consensus Molecular Subtype Future. Curr. Gastroenterol. Rep. 2019, 21, 5. [Google Scholar] [CrossRef] [PubMed]
  6. Thanki, K.; Nicholls, M.E.; Gomez, G.; Gajjar, A.; Senagore, A.J.; Rashidi, L.; Qiu, S.; Szabo, C.; Hellmich, M.R.; Chao, C. Consensus Molecular Subtypes of Colorectal Cancer and their Clinical Implications. Int. Biol. Biomed. J. 2017, 3, 105–111. [Google Scholar]
  7. Liu, J.; Xiao, Q.; Xiao, J.; Niu, C.; Li, Y.; Zhang, X.; Zhou, Z.; Shu, G.; Yin, G. Wnt/β-catenin signalling: Function, biological mechanisms, and therapeutic opportunities. Signal Transduct. Target. Ther. 2022, 7, 3. [Google Scholar] [CrossRef]
  8. Hrckulak, D.; Kolar, M.; Strnad, H.; Korinek, V. TCF/LEF transcription factors: An update from the internet resources. Cancers 2016, 8, 70. [Google Scholar] [CrossRef]
  9. Zhang, Y.; Wang, X. Targeting the Wnt/β-catenin signaling pathway in cancer. J. Hematol. Oncol. 2020, 13, 165. [Google Scholar] [CrossRef]
  10. Neiheisel, A.; Kaur, M.; Ma, N.; Havard, P.; Shenoy, A.K. Wnt pathway modulators in cancer therapeutics: An update on completed and ongoing clinical trials. Int. J. Cancer 2022, 150, 727–740. [Google Scholar] [CrossRef]
  11. Hermosilla, V.E.; Hepp, M.I.; Escobar, D.; Farkas, C.; Riffo, E.N.; Castro, A.F.; Pincheira, R. Developmental SALL2 transcription factor: A new player in cancer. Carcinogenesis 2017, 38, 680–690. [Google Scholar] [CrossRef]
  12. Farkas, C.; Quiroz, A.; Alvarez, C.; Hermosilla, V.; Aylwin, C.F.; Lomniczi, A.; Castro, A.F.; Hepp, M.I.; Pincheira, R. Characterization of SALL2 Gene Isoforms and Targets Across Cell Types Reveals Highly Conserved Networks. Front. Genet. 2021, 12, 613808. [Google Scholar] [CrossRef]
  13. Sung, C.K.; Li, D.; Andrews, E.; Drapkin, R.; Benjamin, T. Promoter methylation of the SALL2 tumor suppressor gene in ovarian cancers. Mol. Oncol. 2013, 7, 419–427. [Google Scholar] [CrossRef] [PubMed]
  14. Ye, L.; Lin, C.; Wang, X.; Li, Q.; Li, Y.; Wang, M.; Zhao, Z.; Wu, X.; Shi, D.; Xiao, Y.; et al. Epigenetic silencing of SALL 2 confers tamoxifen resistance in breast cancer. EMBO J. 2019, 11, e10638. [Google Scholar] [CrossRef]
  15. Álvarez, C.; Quiroz, A.; Benítez-Riquelme, D.; Pincheira, R.; Riffo, E.; Castro, A.F. SALL proteins; common and antagonistic roles in cancer. Cancers 2021, 13, 6292. [Google Scholar] [CrossRef] [PubMed]
  16. Hermosilla, V.; Salgado, G.; Riffo, E.; Escobar, D.; Hepp, M.I.; Farkas, C.; Galindo, M.; Morín, V.; García-Robles, M.A.; Castro, A.F.; et al. SALL2 represses cyclins D1 and E1 expression and restrains G1/S cell cycle transition and cancer-related phenotypes. Mol. Oncol. 2018, 12, 1026–1046. [Google Scholar] [CrossRef]
  17. Li, D.; Tian, Y.; Ma, Y.; Benjamin, T. p150 (Sal2) is a p53-independent regulator if p21 (WAF/CIP). Mol. Cell. Biol. 2004, 24, 3885–3893. [Google Scholar] [CrossRef] [PubMed]
  18. Wu, Z.; Cheng, K.; Shi, L.; Li, Z.; Negi, H.; Gao, G.; Kamle, S.; Li, D. Sal-like protein 2 upregulates p16 expression through a proximal promoter element. Cancer Sci. 2015, 106, 253–261. [Google Scholar] [CrossRef]
  19. Escobar, D.; Hepp, M.I.; Farkas, C.; Campos, T.; Sodir, N.M.; Morales, M.; Álvarez, C.I.; Swigart, L.; Evan, G.I.; Gutiérrez, J.L.; et al. Sall2 is required for proapoptotic Noxa expression and genotoxic stress-induced apoptosis by doxorubicin. Cell Death Dis. 2015, 6, e1816. [Google Scholar] [CrossRef]
  20. Suvà, M.L.; Rheinbay, E.; Gillespie, S.M.; Patel, A.P.; Wakimoto, H.; Rabkin, S.D.; Riggi, N.; Chi, A.S.; Cahill, D.P.; Nahed, B.V.; et al. Reconstructing and reprogramming the tumor-propagating potential of glioblastoma stem-like cells. Cell 2014, 157, 580–594. [Google Scholar] [CrossRef]
  21. Onai, T.; Sasai, N.; Matsui, M.; Sasai, Y. Xenopus XsalF: Anterior neuroectodermal specification by attenuating cellular responsiveness to Wnt signaling. Dev. Cell 2004, 7, 95–106. [Google Scholar] [CrossRef]
  22. Clevers, H.; Nusse, R. Wnt/β-catenin signaling and disease. Cell 2012, 149, 1192–1205. [Google Scholar] [CrossRef] [PubMed]
  23. Gao, C.; Xiao, G.; Hu, J. Regulation of Wnt/β-catenin signaling by posttranslational modifications. Cell Biosci. 2014, 4, 13. [Google Scholar] [CrossRef] [PubMed]
  24. Hermosilla, V.E.; Gyenis, L.; Rabalski, A.J.; Armijo, M.E.; Sepúlveda, P.; Duprat, F.; Benítez-Riquelme, D.; Fuentes-Villalobos, F.; Quiroz, A.; Hepp, M.I.; et al. Casein kinase 2 phosphorylates and induces the SALL2 tumor suppressor degradation in colon cancer cells. Cell Death Dis. 2024, 15, 223. [Google Scholar] [CrossRef]
  25. Binnerts, M.E.; Kim, K.-A.; Bright, J.M.; Patel, S.M.; Tran, K.; Zhou, M.; Leung, J.M.; Liu, Y.; Lomas, W.E.; Dixon, M.; et al. R-Spondin1 regulates Wnt signaling by inhibiting internalization of LRP6. Proc. Natl. Acad. Sci. USA 2007, 104, 14700–14705. [Google Scholar] [CrossRef]
  26. Upadhyay, G.; Goessling, W.; North, T.E.; Xavier, R.; Zon, L.I.; Yajnik, V. Molecular association between β-catenin degradation complex and Rac guanine exchange factor DOCK4 is essential for Wnt/β-catenin signaling. Oncogene 2008, 27, 5845–5855. [Google Scholar] [CrossRef]
  27. Bernkopf, D.B.; Brückner, M.; Hadjihannas, M.V.; Behrens, J. An aggregon in conductin/axin2 regulates Wnt/β-catenin signaling and holds potential for cancer therapy. Nat. Commun. 2019, 10, 4251. [Google Scholar] [CrossRef]
  28. Jho, E.; Zhang, T.; Domon, C.; Joo, C.-K.; Freund, J.-N.; Costantini, F. Wnt/β-Catenin/Tcf Signaling Induces the Transcription of Axin2, a Negative Regulator of the Signaling Pathway. Mol. Cell. Biol. 2002, 22, 1172–1183. [Google Scholar] [CrossRef]
  29. Galli, C.; Piemontese, M.; Lumetti, S.; Manfredi, E.; Macaluso, G.M.; Passeri, G. GSK3b-inhibitor lithium chloride enhances activation of Wnt canonical signaling and osteoblast differentiation on hydrophilic titanium surfaces. Clin. Oral Implant. Res. 2013, 24, 921–927. [Google Scholar] [CrossRef]
  30. Wang, B.; Khan, S.; Wang, P.; Wang, X.; Liu, Y.; Chen, J.; Tu, X. A Highly Selective GSK-3β Inhibitor CHIR99021 Promotes Osteogenesis by Activating Canonical and Autophagy-Mediated Wnt Signaling. Front. Endocrinol. 2022, 13, 926622. [Google Scholar] [CrossRef]
  31. Makola, R.T.; Kgaladi, J.; More, G.K.; van Vuren, P.J.; Paweska, J.T.; Matsebatlela, T.M. Lithium inhibits NF-κB nuclear translocation and modulate inflammation profiles in Rift valley fever virus-infected Raw 264.7 macrophages. Virol. J. 2021, 18, 116. [Google Scholar] [CrossRef]
  32. Kim, J.Y.; Park, H.H.; Yong, T.-S.; Jeon, S.-H. Lithium chloride inhibits the migration and invasion of osteosarcoma cells by blocking nuclear translocation of phospho-Erk. Biochem. Biophys. Res. Commun. 2021, 581, 74–80. [Google Scholar] [CrossRef] [PubMed]
  33. Riffo, E.; Palma, M.; Hepp, M.I.; Benítez-Riquelme, D.; Torres, V.A.; Castro, A.F.; Pincheira, R. The Sall2 transcription factor promotes cell migration regulating focal adhesion turnover and integrin β1 expression. Front. Cell Dev. Biol. 2022, 10, 1031262. [Google Scholar] [CrossRef] [PubMed]
  34. Gu, H.; Li, D.; Sung, C.K.; Yim, H.; Troke, P.; Benjamin, T. DNA-binding and regulatory properties of the transcription factor and putative tumor suppressor p150Sal2. Biochim. Biophys. Acta Gene Regul. Mech. 2011, 1809, 276–283. [Google Scholar] [CrossRef]
  35. Leung, J.Y.; Kolligs, F.T.; Wu, R.; Zhai, Y.; Kuick, R.; Hanash, S.; Cho, K.R.; Fearon, E.R. Activation of AXIN2 expression by β-catenin-T cell factor: A feedback repressor pathway regulating Wnt signaling. J. Biol. Chem. 2002, 277, 21657–21665. [Google Scholar] [CrossRef]
  36. Karantzali, E.; Schulz, H.; Hummel, O.; Hubner, N.; Hatzopoulos, A.K.; Kretsovali, A. Histone deacetylase inhibition accelerates the early events of stem cell differentiation: Transcriptomic and epigenetic analysis. Genome Biol. 2008, 9, R65. [Google Scholar] [CrossRef]
  37. Pasini, D.; Malatesta, M.; Jung, H.R.; Walfridsson, J.; Willer, A.; Olsson, L.; Skotte, J.; Wutz, A.; Porse, B.; Jensen, O.N.; et al. Characterization of an antagonistic switch between histone H3 lysine 27 methylation and acetylation in the transcriptional regulation of Polycomb group target genes. Nucleic Acids Res. 2010, 38, 4958–4969. [Google Scholar] [CrossRef]
  38. Bao, R.; Christova, T.; Song, S.; Angers, S.; Yan, X.; Attisano, L. Inhibition of Tankyrases Induces Axin Stabilization and Blocks Wnt Signalling in Breast Cancer Cells. PLoS ONE 2012, 7, e48670. [Google Scholar] [CrossRef]
  39. Huang, S.M.A.; Mishina, Y.M.; Liu, S.; Cheung, A.; Stegmeier, F.; Michaud, G.A.; Charlat, O.; Wiellette, E.; Zhang, Y.; Wiessner, S.; et al. Tankyrase inhibition stabilizes axin and antagonizes Wnt signalling. Nature 2009, 461, 614–620. [Google Scholar] [CrossRef]
  40. Fu, F.; Deng, Q.; Li, R.; Wang, D.; Yu, Q.-X.; Yang, X.; Lei, T.-Y.; Han, J.; Pan, M.; Zhen, L.; et al. AXIN2 gene silencing reduces apoptosis through regulating mitochondria-associated apoptosis signaling pathway and enhances proliferation of ESCs by modulating Wnt/β-catenin signaling pathway. Eur. Rev. Med. Pharmacol. Sci. 2020, 24, 418–427. [Google Scholar] [CrossRef]
  41. Wu, X.; Luo, F.; Li, J.; Zhong, X.; Liu, K. Tankyrase 1 inhibitior XAV939 increases chemosensitivity in colon cancer cell lines via inhibition of the Wnt signaling pathway. Int. J. Oncol. 2016, 48, 1333–1340. [Google Scholar] [CrossRef]
  42. Qin, X.; Rodriguez, F.C.; Sufi, J.; Vlckova, P.; Claus, J.; Tape, C.J. An oncogenic phenoscape of colonic stem cell polarization. Cell 2023, 186, 5554–5568.e18. [Google Scholar] [CrossRef]
  43. Cerami, E.; Gao, J.; Dogrusoz, U.; Gross, B.E.; Sumer, S.O.; Arman, B.; Jacobsen, A.; Byrne, C.J.; Heuer, M.L.; Larsson, E.; et al. The cBio Cancer Genomics Portal: An Open Platform for Exploring Multidimensional Cancer Genomics Data. Cancer Discov. 2012, 2, 401–404. [Google Scholar] [CrossRef] [PubMed]
  44. Sung, C.K.; Yim, H.; Gu, H.; Li, D.; Andrews, E.; Duraisamy, S.; Li, C.; Drapkin, R.; Benjamin, T. The Polyoma Virus Large T Binding Protein p150 Is a Transcriptional Repressor of c-MYC. PLoS ONE 2012, 7, e46486. [Google Scholar] [CrossRef] [PubMed]
  45. Pincheira, R.; Baerwald, M.; Dunbar, J.D.; Donner, D.B. Sall2 is a novel p75NTR-interacting protein that links NGF signalling to cell cycle progression and neurite outgrowth. EMBO J. 2009, 28, 261–273. [Google Scholar] [CrossRef] [PubMed]
  46. Ma, T.; Shi, S.; Jiang, H.; Chen, X.; Xu, D.; Ding, X.; Zhang, H.; Xi, Y. A pan-cancer study of spalt-like transcription factors 1/2/3/4 as therapeutic targets. Arch. Biochem. Biophys. 2021, 711, 109016. [Google Scholar] [CrossRef]
  47. Souza, L.C.d.M.e.; Faletti, A.; Veríssimo, C.P.; Stelling, M.P.; Borges, H.L. p53 Signaling on Microenvironment and Its Contribution to Tissue Chemoresistance. Membranes 2022, 12, 202. [Google Scholar] [CrossRef]
  48. Bian, J.; Dannappel, M.; Wan, C.; Firestein, R. Transcriptional Regulation of Wnt/β-Catenin Pathway in Colorectal Cancer. Cells 2020, 9, 2125. [Google Scholar] [CrossRef]
  49. Sato, A.; Kishida, S.; Tanaka, T.; Kikuchi, A.; Kodama, T.; Asashima, M.; Nishinakamura, R. Sall1, a causative gene for Townes–Brocks syndrome, enhances the canonical Wnt signaling by localizing to heterochromatin. Biochem. Biophys. Res. Commun. 2004, 319, 103–113. [Google Scholar] [CrossRef]
  50. Chen, M.; Li, L.; Zheng, P.S. SALL4 promotes the tumorigenicity of cervical cancer cells through activation of the Wnt/β-catenin pathway via CTNNB1. Cancer Sci. 2019, 110, 2794–2805. [Google Scholar] [CrossRef]
  51. Ma, C.; Wang, F.; Han, B.; Zhong, X.; Si, F.; Ye, J.; Hsueh, E.C.; Robbins, L.; Kiefer, S.M.; Zhang, Y.; et al. SALL1 functions as a tumor suppressor in breast cancer by regulating cancer cell senescence and metastasis through the NuRD complex. Mol. Cancer 2018, 17, 78. [Google Scholar] [CrossRef]
  52. Zhang, W.; Hu, Y.; Zhang, W.; Yi, K.; Xu, X.; Chen, Z. The Invasion and Metastasis of Colon Adenocarcinoma (COAD) Induced by SALL4. J. Immunol. Res. 2022, 2022, 1–11. [Google Scholar] [CrossRef]
  53. Bernkopf, D.B.; Hadjihannas, M.V.; Behrens, J. Negative feedback regulation of the Wnt pathway by conductin/AXIN2 involves insensitivity to upstream signalling. J. Cell Sci. 2014, 128, 33–39. [Google Scholar] [CrossRef]
  54. Kelberman, D.; Islam, L.; Lakowski, J.; Bacchelli, C.; Chanudet, E.; Lescai, F.; Patel, A.; Stupka, E.; Buck, A.; Wolf, S.; et al. Mutation of SALL2 Causes Recessive Ocular Coloboma in Humans and Mice. Hum. Mol. Genet. 2014, 23, 2511–2526. [Google Scholar] [CrossRef] [PubMed]
  55. Koinuma, K.; Yamashita, Y.; Liu, W.; Hatanaka, H.; Kurashina, K.; Wada, T.; Takada, S.; Kaneda, R.; Choi, Y.L.; Fujiwara, S.-I.; et al. Epigenetic silencing of AXIN2 in colorectal carcinoma with microsatellite instability. Oncogene 2006, 25, 139–146. [Google Scholar] [CrossRef] [PubMed]
  56. Zhai, J.; Chen, H.; Wong, C.C.; Peng, Y.; Gou, H.; Zhang, J.; Pan, Y.; Chen, D.; Lin, Y.; Wang, S.; et al. ALKBH5 Drives Immune Suppression Via Targeting AXIN2 to Promote Colorectal Cancer and Is a Target for Boosting Immunotherapy. Gastroenterology 2023, 165, 445–462. [Google Scholar] [CrossRef]
  57. Yu, J.; Liu, D.; Sun, X.; Yang, K.; Yao, J.; Cheng, C.; Wang, C.; Zheng, J. CDX2 inhibits the proliferation and tumor formation of colon cancer cells by suppressing Wnt/β-catenin signaling via transactivation of GSK-3β and Axin2 expression. Cell Death Dis. 2019, 10, 26. [Google Scholar] [CrossRef]
  58. Jang, M.-K.; Mashima, T.; Seimiya, H. Tankyrase Inhibitors Target Colorectal Cancer Stem Cells via AXIN-Dependent Downregulation of c-KIT Tyrosine Kinase. Mol. Cancer Ther. 2020, 19, 765–776. [Google Scholar] [CrossRef]
  59. Wang, W.; Liu, P.; Lavrijsen, M.; Li, S.; Zhang, R.; Li, S.; van de Geer, W.S.; van de Werken, H.J.G.; Peppelenbosch, M.P.; Smits, R. Evaluation of AXIN1 and AXIN2 as targets of tankyrase inhibition in hepatocellular carcinoma cell lines. Sci. Rep. 2021, 11, 7470. [Google Scholar] [CrossRef]
  60. Wu, Z.-Q.; Brabletz, T.; Fearon, E.; Willis, A.L.; Hu, C.Y.; Li, X.-Y.; Weiss, S.J. Canonical Wnt suppressor, Axin2, promotes colon carcinoma oncogenic activity. Proc. Natl. Acad. Sci. USA 2012, 109, 11312–11317. [Google Scholar] [CrossRef]
  61. Schaal, U.; Grenz, S.; Merkel, S.; Rau, T.T.; Hadjihannas, M.V.; Kremmer, E.; Chudasama, P.; Croner, R.S.; Behrens, J.; Stürzl, M.; et al. Expression and localization of axin 2 in colorectal carcinoma and its clinical implication. Int. J. Color. Dis. 2013, 28, 1469–1478. [Google Scholar] [CrossRef]
  62. Rennoll, S.A.; Konsavage, W.M.; Yochum, G.S. Nuclear AXIN2 represses MYC gene expression. Biochem. Biophys. Res. Commun. 2014, 443, 217–222. [Google Scholar] [CrossRef]
  63. Stakheev, D.; Taborska, P.; Strizova, Z.; Podrazil, M.; Bartunkova, J.; Smrz, D. The WNT/β-catenin signaling inhibitor XAV939 enhances the elimination of LNCaP and PC-3 prostate cancer cells by prostate cancer patient lymphocytes in vitro. Sci. Rep. 2019, 9, 4761. [Google Scholar] [CrossRef] [PubMed]
  64. Thorvaldsen, T.E.; Pedersen, N.M.; Wenzel, E.M.; Stenmark, H. Differential roles of AXIN1 and AXIN2 in tankyrase inhibitor-induced formation of degradasomes and β-catenin degradation. PLoS ONE 2017, 12, e0170508. [Google Scholar] [CrossRef] [PubMed]
  65. Waaler, J.; Machon, O.; Tumova, L.; Dinh, H.; Korinek, V.; Wilson, S.R.; Paulsen, J.E.; Pedersen, N.M.; Eide, T.J.; Machonova, O.; et al. A novel tankyrase inhibitor decreases canonical Wnt signaling in colon carcinoma cells and reduces tumor growth in conditional APC mutant mice. Cancer Res. 2012, 72, 2822–2832. [Google Scholar] [CrossRef] [PubMed]
  66. Wu, D.; Talbot, C.C.; Liu, Q.; Jing, Z.-C.; Damico, R.L.; Tuder, R.; Barnes, K.C.; Hassoun, P.M.; Gao, L. Identifying microRNAs targeting Wnt/β-catenin pathway in end-stage idiopathic pulmonary arterial hypertension. J. Mol. Med. 2016, 94, 875–885. [Google Scholar] [CrossRef]
  67. Joanito, I.; Wirapati, P.; Zhao, N.; Nawaz, Z.; Yeo, G.; Lee, F.; Eng, C.L.P.; Macalinao, D.C.; Kahraman, M.; Srinivasan, H.; et al. Single-cell and bulk transcriptome sequencing identifies two epithelial tumor cell states and refines the consensus molecular classification of colorectal cancer. Nat. Genet. 2022, 54, 963–975. [Google Scholar] [CrossRef]
  68. Hepp, M.I.; Escobar, D.; Farkas, C.; Hermosilla, V.E.; Álvarez, C.; Amigo, R.; Gutiérrez, J.L.; Castro, A.F.; Pincheira, R. A Trichostatin A (TSA)/Sp1-mediated mechanism for the regulation of SALL2 tumor suppressor in Jurkat T cells. Biochim. Biophys. Acta Gene Regul. Mech. 2018, 1861, 623–636. [Google Scholar] [CrossRef]
  69. Cereceda, K.; Bravo, N.; Jorquera, R.; González-Stegmaier, R.; Villarroel-Espíndola, F. Simultaneous and Spatially-Resolved Analysis of T-Lymphocytes, Macrophages and PD-L1 Immune Checkpoint in Rare Cancers. Cancers 2022, 14, 2815. [Google Scholar] [CrossRef]
  70. Martinez-Morilla, S.; Villarroel-Espindola, F.; Wong, P.F.; Toki, M.I.; Aung, T.N.; Pelekanou, V.; Bourke-Martin, B.; Schalper, K.A.; Kluger, H.M.; Rimm, D.L. Biomarker discovery in patients with immunotherapy-treated melanoma with imaging mass cytometry. Clin. Cancer Res. 2021, 27, 1987–1996. [Google Scholar] [CrossRef]
  71. Galera-Ruiz, H.; Ríos, M.J.; González-Cámpora, R.; de Miguel, M.; Carmona, M.I.; Moreno, A.M.; Galera-Davidson, H. The cadherin–catenin complex in nasopharyngeal carcinoma. Eur. Arch. Oto-Rhino-Laryngol. 2011, 268, 1335–1341. [Google Scholar] [CrossRef]
  72. Palma, M.; Riffo, E.N.; Suganuma, T.; Washburn, M.P.; Workman, J.L.; Pincheira, R.; Castro, A.F. Identification of a nuclear localization signal and importin beta members mediating NUAK1 nuclear import inhibited by oxidative stress. J. Cell Biochem. 2019, 120, 16088–16107. [Google Scholar] [CrossRef]
Figure 1. SALL2 is expressed in both colon normal epithelial and stromal tissues but loses its expression in colorectal cancer (CRC). (a) Representative IHC images of SALL2 in adenomas (n = 40), CRC (n = 48), and normal adjacent mucosa (n = 42) colon tissues (left panel). The third line of figures provides a close-up view of the section located in the center of the black box region. Scale bars: 200 μm. Percentage of SALL2-positive cells from the IHC score (right panel). Yellow arrows indicate SALL2 cytosolic expression. Red arrows indicate SALL2 nuclear expression (b). The SALL2 intensity score (mean) decreases from normal to CRC progression. The SALL2 intensity was graduated as negative: 0, weak: +, moderate: ++, and strong: +++. From each group, SALL2 intensity was evaluated in the epithelium (E) and stroma (S). (c) Representative IHC image showing the distribution of SALL2 in the colon crypt. Percentage of nuclear SALL2-positive cells in the basal and apical regions (right panel). The blue arrows indicate the presence of SALL2 expression at the crypt’s base, while the red arrows highlight its expression in the gland’s apical region. (d) Percentage of nuclear SALL2-positive cells in the epithelium (E) and stroma (S) from normal to CRC tissues. (e,f) Representative images of SALL2 staining in the stroma of the normal colon tissue (left) and the tumor microenvironment in CRC tissues (right) using multiplex immunofluorescence analysis. Quantification is shown alongside each image using automated color-based threshold segmentation in the free software QuPat v0.6.0. Regions of interest (ROIs) were manually selected, distinguishing between normal and cancerous areas. The graphs show the percentage (%) of cells positive for SALL2 and the specific markers. Each plotted point represents a single ROI. The immunofluorescence SALL2 (green), fibroblasts (VIM, vimentin in red), and epithelium (CK, cytokeratin in magenta) are shown in (e). The SALL2 (green), cytotoxic lymphocytes (CD8+ in yellow), and macrophages (CD68+ in orange) are shown in (f). All data are mean ± SD. Proportional and intensity scores were quantified as described in the Material and Methods Section. Statistical significance was determined by ANOVA (**** p < 0.0001; *** p < 0.001; * p < 0.05, ns, not significant).
Ijms 26 07896 g001
Figure 2. SALL2 expression negatively correlates with the nuclear β-catenin cancer marker. (a) Immunohistochemical analysis of SALL2 and β-catenin protein expression in colorectal cancer (CRC) tissues. Left, Representative images from 3 patients with negative SALL2 and positive β-catenin (nuclear) staining at the migratory front (arrows). Right, Representative images from 3 patients with positive SALL2 and negative β-catenin (membranous) staining. β-catenin staining was analyzed considering localization and intensity. (b) Western blot analysis of SALL2 expression in CRC cell lines and HEK293 cells as a positive control. β-actin was used as a loading control. (c) Depmap analysis of SALL2 mRNA expression in CRC cell lines (https://depmap.org/portal/ accessed on 7 July 2023). (d) Immunofluorescence analysis by confocal microscopy for endogenous β-catenin expression and localization in the SALL2+/+ and SALL2−/− SW480 cells. Quantifying nuclear β-catenin staining (green) intensity was performed using Fiji software, analyzing 100 cells across three independent experiments (Bottom panel). (e) Same as (d), but for the SALL2 gain-of-function SW480 cells treated with vehicle [DOX(−)] or doxycycline [DOX(+)] to induce SALL2 expression. (f) Western blot analysis of β-catenin expression in nuclear (N) and cytosolic (C) fractions from SALL2+/+ and SALL2−/−HEK293 (Left) and SW480 (Right) cell models. Nuclear levels of β-catenin were normalized to HDAC1 and expressed as a percentage relative to the control. Endogenous SALL2 expression is shown. GAPDH was used as a control for the cytosolic fraction. The arrowheads indicate cropped unrelated columns and subsequent splicing of the blot. (g) Same as (f), but for the SALL2 gain of function HT29 CRC cell model treated with vehicle (−) or doxycycline (+) to induce SALL2 expression, detected with FLAG antibody. GAPDH and HDAC1 were used as controls for the cytosolic and the nuclear fractions, respectively. All data are mean ± SD. Statistical significance was determined by Student’s t-test (**** p < 0.0001, *** p < 0.001, * p < 0.05).
Ijms 26 07896 g002
Figure 3. Loss of SALL2 function downregulates negative regulators of the Wnt Pathway. (a) Left, Western blot analysis of the Wnt pathway negative and positive regulators expression in SALL2+/+ and SALL2−/− HEK293 cells. (Right) Densitometric analysis of the bands from 3 independent experiments is shown on the left. Protein levels were normalized to GAPDH, a loading control. The “*” on the right of the blot indicates specific bands. (b) Same as (a), but for SALL2+/+ and SALL2−/− SW480 cells. (c) (Left) Immunofluorescence analysis by confocal microscopy for FBWX11 expression in SALL2+/+ and SALL2−/− SW480 cells. Right, Quantification of FBWX11 staining intensity was performed using Fiji software, analyzing 100 cells across three independent experiments. (d) Same as (c), but for AXIN2 expression. All data are mean ± SD. Statistical significance was determined by Student’s t-test (*** p < 0.001; ** p < 0.01; * p < 0.05).
Ijms 26 07896 g003
Figure 4. Transcriptional regulation of AXIN2 depends on SALL2 expression. (a) AXIN2 mRNA levels and protein were analyzed by qPCR and Western blot, respectively, in SALL2 +/+ and SALL2−/− HEK293 cell models. (b) Left, Same as (a), but for the SALL2+/+ and SALL2−/− SW480 cell models. (Right) Same as (a), but for inducible FLAG-SALL2 E1A SW480 cells treated with 1 µg/mL doxycycline (DOX) for 48 h. (c) The same analyses were performed on inducible FLAG-SALL2 E1A HT-29, SW620, and SW48 CRC cells. qPCR and immunoblotting were conducted using PP1B and GAPDH as normalization controls, respectively. (d,e) Western blot analysis of AXIN2 and SALL2 expression in response to 4 h treatment with different concentrations of the Wnt pathway activators CHIR99021 (d) and LiCl (e) in SALL2 +/+ and SALL2−/− HEK293 cells. β-catenin was used as a positive control for the Wnt pathway activation. Graphs on the right show the quantification of AXIN2 levels relative to β-actin (loading control) by densitometry analysis of Western blots. (f) The SALL2+/+ and SALL2−/− HEK293 cells were treated with 8 µM CHIR99021 for 4 h and the AXIN2 mRNA expression relative to PPIB was analyzed by qPCR. AXIN2 mRNA expression relative to PPIB was analyzed by qPCR in the SALL2+/+ and SALL2−/− SW480 cells treated with 10 mM LiCl for 4 h (g) or 8 µM CHIR99021 for 4 h (h). All data are mean ± SD. Statistical significance was determined by ANOVA or Student’s t-test (*** p < 0.001; ** p < 0.01; * p < 0.05; ns, not significant).
Ijms 26 07896 g004
Figure 5. SALL2 binds to the AXIN2 promoter. (a) Schematic representation of the human AXIN2 promoter. Bioinformatic analysis of the promoter to identify putative SALL2 sites was performed using a previously reported binding site matrix (consensus sequence GGG(T/C)GGG) [34]. The human AXIN2 sequence analyzed (2000 bp) from the transcription start site (TSS) was obtained from the Eukaryotic Promoter Database (EPD) (https://epd.expasy.org/epd/ accessed on 12 September 2023). Circles are schematic representations of SALL2 putative binding sites. Horizontal arrows indicate the location of the primers used for qPCR (sets 1, 2, and 3) in site-specific ChIP assays. (b) AXIN2 promoter activity was measured in the absence (DOX (−)) and presence of SALL2 (DOX (+)) in HEK293 cells treated with 8 µM CHIR99021 for 4 h. Luciferase activity was measured from cell lysates and normalized to β-galactosidase activity, and promoter activity was expressed as relative luciferase activity. (c) Analysis of SALL2 enrichment in the AXIN2 promoter. Chromatin from doxycycline-induced FLAG-SALL2 E1A HEK293 cells was immunoprecipitated using FLAG antibody. Specific genomic regions of the AXIN2 promoter were analyzed by qPCR. The AXIN2 promoter was analyzed using 3 primer sets, set 1 (−08/−112), set 2 (−784), and set 3 (−1420/−1410/−1405/−1400). (d) Analysis of SALL2 enrichment in an unrelated region (URR) corresponding to the PMAIP1 gene promoter. (e) H3K27 acetylation enrichment relative to total histone H3. All data are mean ± SD. Statistical significance was determined by ANOVA test (*** p < 0.001).
Ijms 26 07896 g005
Figure 6. SALL2 expression increases XAV939-induced cellular apoptotic response and is associated with AXIN2 expression and better prognosis in colorectal cancer (CRC). (a) SALL2+/+ and SALL2−/− SW480 cells were treated with 8 µM XAV939 for 24 h. The apoptotic response was evaluated by the levels of apoptotic markers: cleaved caspase 3, and cleaved PARP. AXIN 2 was used as a positive control for the XAV939 treatment. GAPDH was used as a loading control. (b) Histogram of densitometric analysis for cleaved PARP expression from 3 independent experiments. (c) Histogram of densitometric analysis for cleaved caspase 3 expression from panel A. All data are mean ± SD. Statistical significance was determined by ANOVA test (* p < 0.05). (d) Correlation between SALL2 and AXIN2 expression in CRC. Scatter plots of SALL2 vs. AXIN2 were generated using publicly available databases and software from R2: Genomics Analysis and Visualization Platform (http://r2.amc.nl, accessed on 15 November 2023), n = 121 samples, R = 0.702, p-value = 2.7 × 10⁻¹⁹. (e) Same analysis as (d) for the Single-cell RNA-seq dataset from Qin et al. (87 782 cells) showing SALL2AXIN2 co-expression across all cell types. (f) Same analysis restricted to the macrophage/fibroblast subset of the Qin dataset confirms the positive correlation (R = 0.103, p-value = 2.46 × 10⁻¹⁰). (g) Boxplot across CRC risk groups and AXIN2 or SALL2 correlation, including the p-value testing for difference using Student’s t-test (or f-test for more than two groups) from the SurvExpress database. Green denotes high expression, while red denotes low expression.
Ijms 26 07896 g006
Disclaimer/Publisher’s Note: The statements, opinions and data contained in all publications are solely those of the individual author(s) and contributor(s) and not of MDPI and/or the editor(s). MDPI and/or the editor(s) disclaim responsibility for any injury to people or property resulting from any ideas, methods, instructions or products referred to in the content.