Article

Arsenite-Mediated Transcriptional Regulation of Glutathione Synthesis in Mammalian Primary Cortical Astrocytes

Interdisciplinary Neuroscience Program, Department of Biology, Syracuse University, Syracuse, NY 13210, USA
*
Author to whom correspondence should be addressed.
Int. J. Mol. Sci. 2025, 26(11), 5375; https://doi.org/10.3390/ijms26115375
Submission received: 3 March 2025 / Revised: 21 May 2025 / Accepted: 30 May 2025 / Published: 4 June 2025
(This article belongs to the Special Issue The Role of Glutathione Metabolism in Health and Disease)

Abstract

Arsenic, a potent metalloid contaminant of drinking water, is known for its ability to act as an initiator and modulator of disease in a variety of human tissues. Upon ingestion, arsenic is bio-transformed in the liver into a variety of metabolites, including arsenite. Arsenite permeates the blood–brain barrier (BBB), inducing oxidative stress that can be detrimental to brain neurons. As the primary glial cell at the BBB interface, astrocytes play a pivotal role in detoxifying xenobiotics such as arsenite via the production of the tripeptide antioxidant γ-glutamylcysteine, or glutathione (GSH). In this study, we assessed the mRNA levels of key components of the GSH synthetic pathway in astrocytes exposed to arsenite compared to vehicle controls. These components included xCT [substrate-specific light chain of the substrate importing transporter, system xc (Sxc)], glutamate-cysteine ligase [both catalytic (GCLC) and modifying (GCLM) subunits], and glutathione synthetase (GS). Additionally, we analyzed protein levels of some components by Western blotting and evaluated functional activity of Sxc using a fluorescence-based cystine uptake assay. Finally, we utilized a luminescence-based glutathione assay to determine the intracellular and extracellular GSH content in arsenite-treated cells. Arsenite significantly increased xCT, GCLC, GCLM, and GS mRNA levels, an effect blocked by the transcriptional inhibitor actinomycin D (ActD). A corresponding increase in Sxc activity was also observed in the arsenite treatment groups, along with significant increases in GCLC and GCLM protein expression. However, no increase in GS protein expression was detected. Finally, arsenite treatment significantly increased extracellular GSH levels, an effect which was also prevented by the inclusion of ActD. Overall, our study provides evidence that arsenite transcriptionally regulates several cellular processes necessary for GSH synthesis in primary cortical astrocyte cultures, thereby contributing to a better understanding of how this environmental toxicant influences antioxidant defenses in the brain. However, these results should be interpreted with caution regarding their applicability to vivo systems.

1. Introduction

Arsenic is a toxic metalloid found in abundance in the earth’s crust that is released into the biosphere by both natural and anthropogenic processes [1]. Arsenic contamination of ground water poses a serious public health risk to humans around the world. In some regions, groundwater arsenic concentrations can exceed 50–100 µg/L—far above the World Health Organization’s recommended limit of 10 µg/L (10 ppb) [2,3]. While high levels of arsenic in drinking water are most prominent in countries such as Bangladesh and Taiwan, concentrations of over 3000 µg/L have been discovered in wells in the United States [4]. Exposure to this metalloid has been implicated in the pathogenesis of various maladies such as cardiovascular disease, renal disease, and several neurological impairments [5,6]. When arsenic enters the body, it undergoes biotransformation into a wide range of organic and inorganic metabolites, including arsenite [7]. Arsenite is particularly dangerous to the central nervous system (CNS) because it can cross the blood–brain barrier (BBB) [8], which normally impedes harmful substances from entering the brain [9]. The BBB is composed of various elements of the neurovascular unit (NVU), highlighting the close interplay between the basal lamina, endothelial cells of the cerebrovasculature, pericytes, and glial cells, which collectively regulate the flow of substances between the bloodstream and the brain parenchyma [10].
Among glial cells, astrocytes are the predominate type in the CNS [11] and are an integral component of the BBB [12]. Astrocyte dysfunction has been implicated in multiple CNS disorders, including neurodegeneration, stroke, and neuroinflammation, emphasizing their central role in CNS homeostasis (for a review, see [13,14]). Indeed, astrocytes perform a variety of functions, including but not limited to the facilitation of neuronal migration, regulation of the extracellular environment, modulation of neurotransmitter levels in the synaptic cleft, formation and maintenance of the BBB, and detoxification of xenobiotics [15,16]. Given their role in maintaining the BBB, astrocytes are the first line of defense against toxicants that enter the brain, such as arsenite [17]. One of their more important protective functions is defending against oxidative stress, primarily through the production of glutathione (GSH; for a review, see [18]). Exposure of cultured astrocytes to millimolar levels of arsenite for just a few hours results in a loss of cellular GSH content [17,19]. In contrast, when exposed to low micromolar levels of arsenite, astrocytes exhibit an elevation in GSH levels [17].
GSH is one of the most important antioxidants in the body, owing its ability to maintain cellular redox homeostasis due to its free sulfhydryl group [20]. Astrocytes have been shown to produce high concentrations of GSH [21], exporting it at a rate of 10% per hour [22]. This export provides neurons with the necessary substrates for their own GSH synthesis [21,23,24]. The GSH synthesis process involves two reactions catalyzed by two unique ATP-consuming enzymes: glutamate-cysteine ligase (GCL) and glutathione synthetase (GS), requiring three substrates: cysteine, glutamate, and glycine [25]. Cysteine is the rate-limiting substrate for the production of GSH [26]. In astrocytes, it is supplied by the import of cystine via a heterodimeric amino acid antiporter, system xc (Sxc; for a review, see [27]). Upon import, cystine is reduced to cysteine. GCL, composed of a catalytic (GCLC) and modifier (GCLM) subunit, then carries out the synthesis of the dipeptide γ-glutamylcysteine from glutamate and cysteine. Finally, GS adds the amino acid glycine to generate the final tripeptide product (for a review, see [25]). Once synthesized, GSH can be utilized intracellularly and/or be released from astrocytes into the extracellular space through various mechanisms [19,23,24,28,29,30,31,32,33].
This study seeks to determine how arsenite exposure impacts GSH synthesis in astrocytes. Specifically, we explore whether exposure of primary cortical astrocytes to low, non-toxic concentrations of arsenite regulates the expression of key enzymes and transporters responsible for GSH biosynthesis.

2. Results

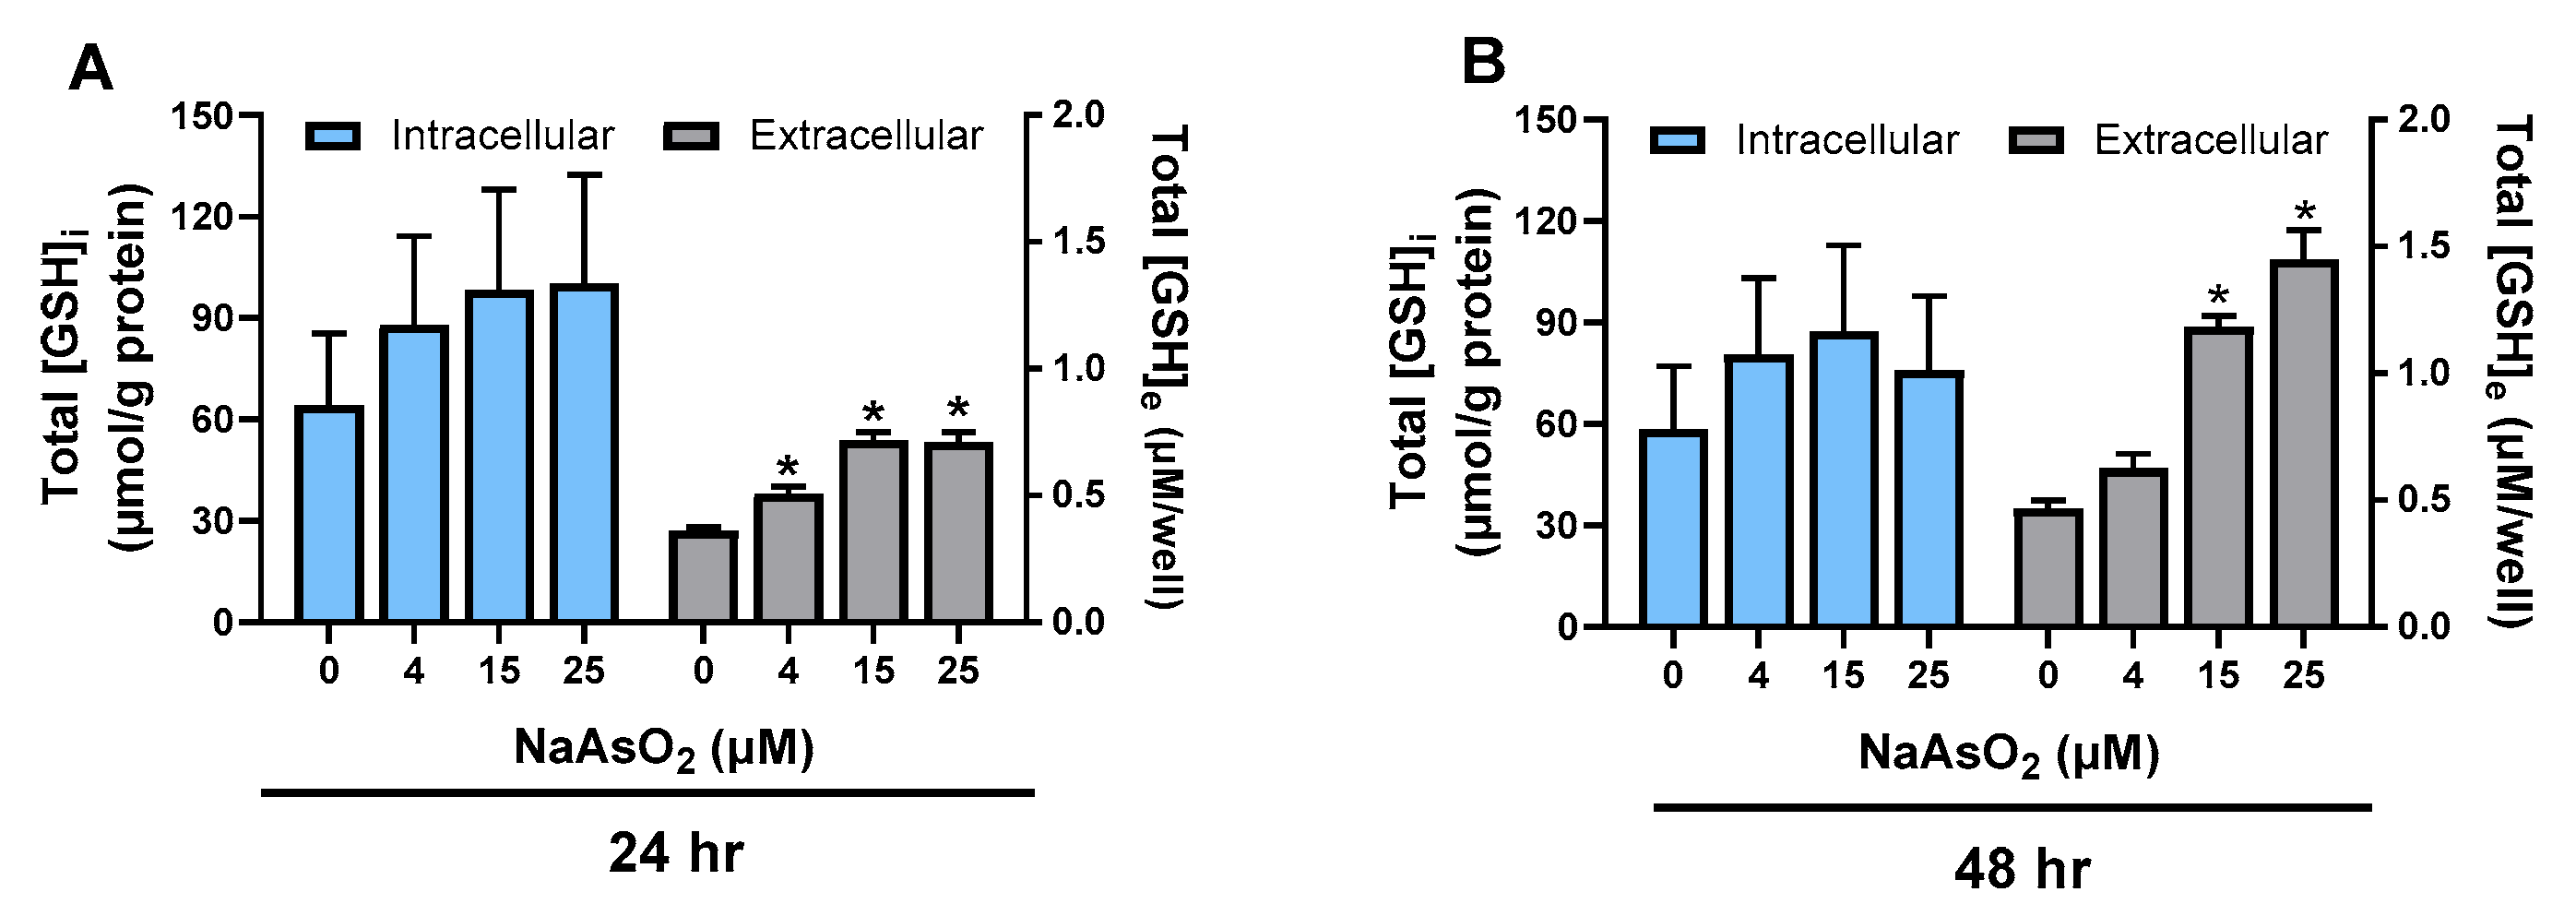
2.1. Effect of Arsenite on Astrocyte GSH Levels

Exposure of primary cortical astrocytes to non-cytotoxic concentrations of arsenite (Supplemental Figure S1) did not result in significant changes in intracellular ([GSH]i) levels. However, increases in the accumulation of GSH in the extracellular medium ([GSH]e) occurred in a concentration-dependent manner, measured 24 h and 48 h post-exposure (Figure 1A,B). Our data indicate that this effect reached a plateau at around 15 µM, with no significant differences observed between 15 µM and 25 µM at 24 (p > 0.9999) and 48 h (p = 0.0595), respectively. Based on these findings, we selected 15 µM as the optimal concentration for all subsequent experiments.

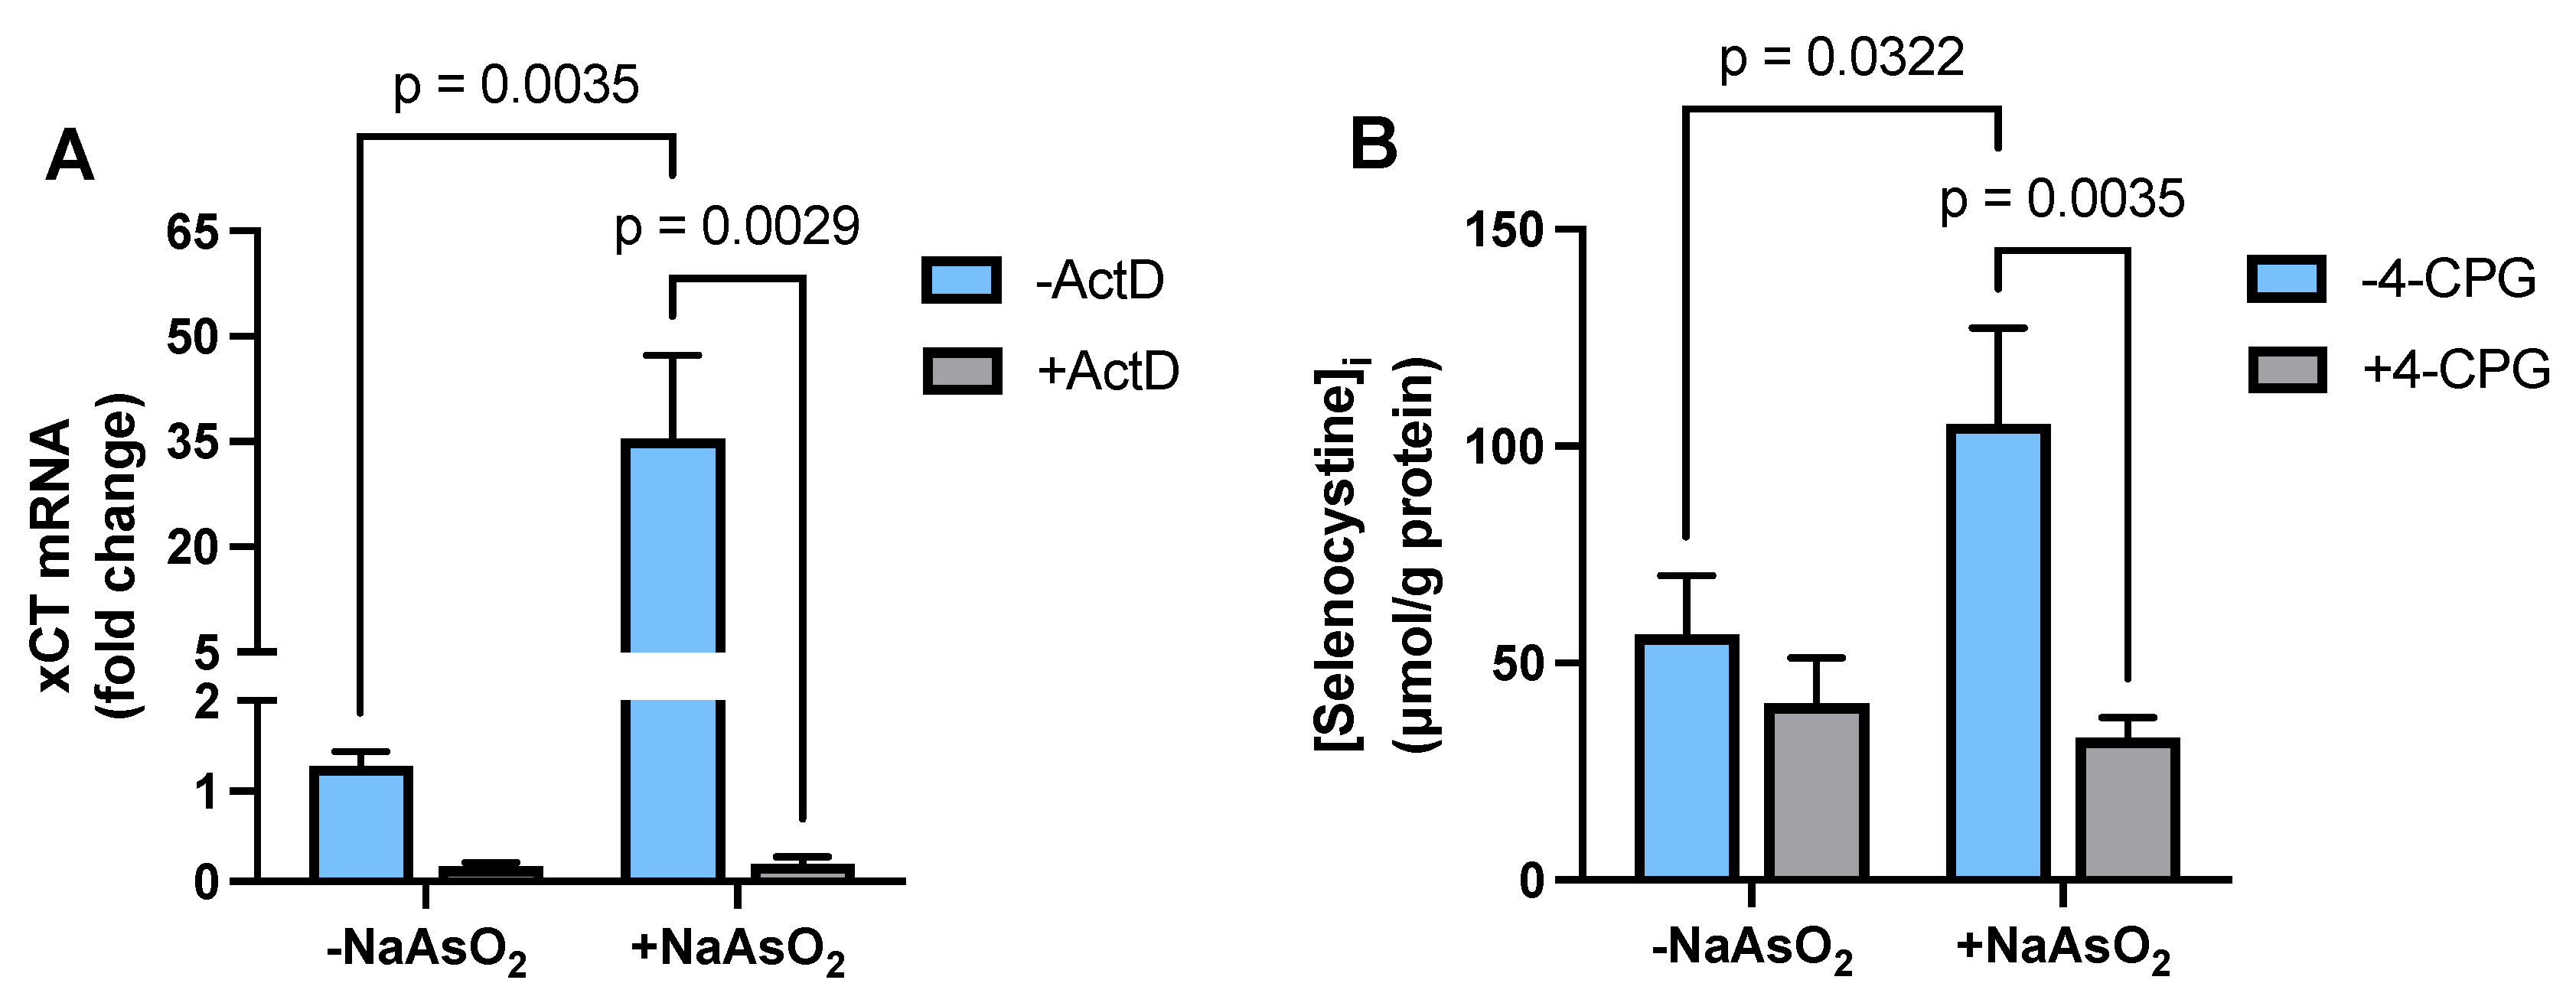
2.2. Effect of Arsenite on Astrocyte xCT mRNA Expression and Transporter Activity

To determine whether arsenite regulated cysteine availability, we measured mRNA expression levels of xCT, the substrate-specific light chain of Sxc, and Sxc functional activity. Exposure of primary cortical astrocytes to 15 µM arsenite resulted in a significant increase in steady-state xCT mRNA expression (Figure 2A). Treatment with the transcriptional inhibitor actinomycin D (ActD, 10 µg/mL) prevented this arsenite-induced increase in xCT mRNA (Figure 2A). Consistent with the qPCR data, we found that selenocystine uptake into astrocytes was significantly increased following arsenite exposure. The inclusion of the Sxc competitive inhibitor, 4-carboxyphenylglycine (4-CPG) [34], confirmed that the observed increase in selenocystine uptake was mediated by Sxc (Figure 2B).

2.3. Effect of Arsenite on Astrocyte GCL mRNA and Protein Expression

While increased substrate availability alone could potentially explain the enhanced GSH accumulation observed in astrocyte medium upon arsenite exposure [35], we next sought to explore the role of other key components of the GSH synthetic pathway. First, we assessed mRNA expression for glutamate-cysteine ligase (GCL), the enzyme that catalyzes the first committed step of GSH synthesis [20,25,36]. Astrocytes treated with 15µM arsenite experienced an increased steady-state mRNA level of both the catalytic (GCLC) and modifying (GCLM) subunit of GCL. Importantly, this upregulation was found to be transcriptionally mediated (Figure 3A,D). To determine whether the increased mRNA levels led to corresponding increases in protein expression, we performed a Western blot analysis. As shown in Figure 3B,E, we observed a significant increase in the protein levels of both GCL subunits, confirming that the elevated mRNA was indeed translated into higher protein expression.

2.4. Effect of Arsenite on Astrocyte GS mRNA and Protein Expression

Next, we explored the effect of arsenite exposure on mRNA levels of GS, the enzyme that catalyzes the second and final committed step of the GSH synthetic pathway. Astrocytes exposed to 15 μM arsenite showed a slight but significant transcriptionally dependent increase in GS mRNA expression (Figure 4A). However, no increase in protein expression was found (Figure 4B).

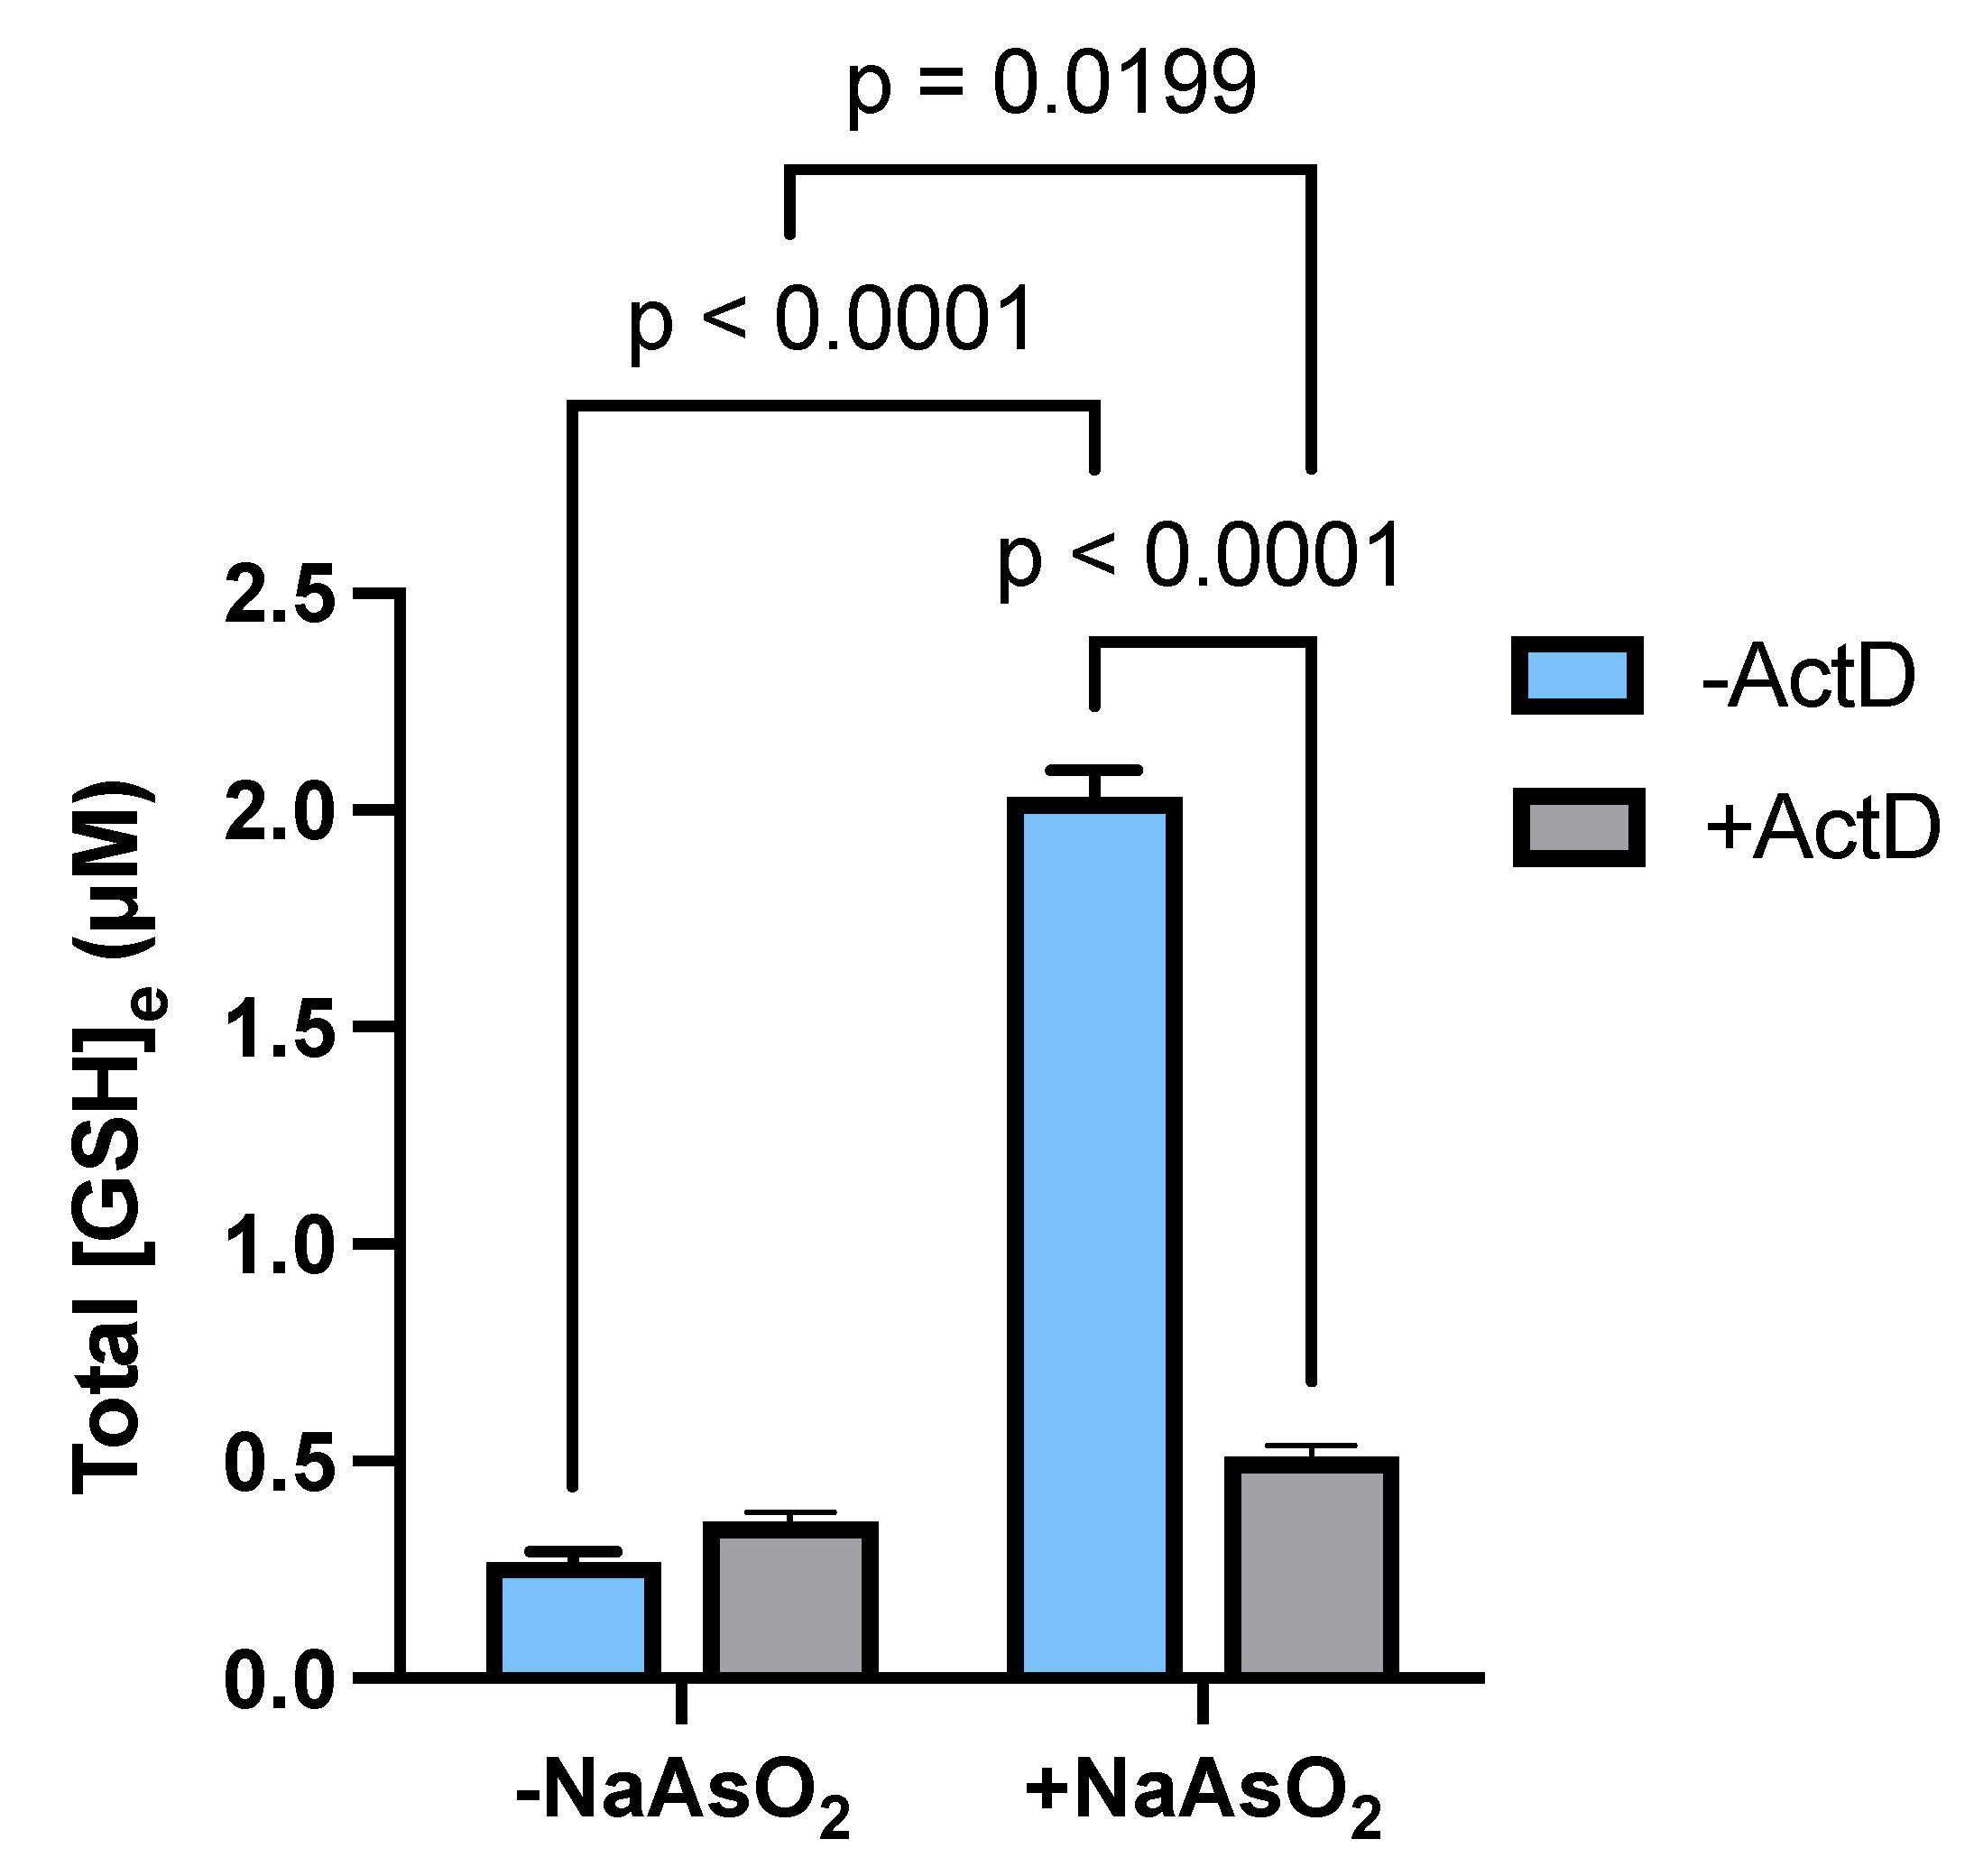
2.5. Transcriptional Regulation of Astrocytic GSH Levels by Arsenite

Taken together, our data indicates that arsenite upregulates key components of the GSH synthetic pathway primarily through transcriptionally dependent mechanisms. Therefore, we hypothesized that inhibiting transcription would prevent the observed arsenite-induced increase in extracellular GSH accumulation. Indeed, treatment of the astrocyte cultures with ActD (10 µg/mL) blocked [GSH]e accumulation in media from astrocytes exposed to 15 µM arsenite (Figure 5).

3. Discussion

Upon ingestion, inorganic arsenicals, such as arsenite, can cause neurological dysfunction, as they readily penetrate the BBB [8]. Due to their strategic positioning along the cerebrovasculature, arsenite initially interacts with astrocytes. Our investigation demonstrates that exposing primary astrocytes to arsenite leads to increased GSH accumulation in the extracellular medium, without any significant alterations in intracellular GSH levels. These results are consistent with previous findings [17], which show that low micromolar levels of arsenite increase extracellular GSH levels without depleting intracellular stores, as is observed when arsenite is given in higher (millimolar) concentrations [19,37]. The ability of the astrocytes to maintain intracellular levels despite significant release into the extracellular space suggests a finely tuned regulatory mechanism governing GSH synthesis and release. One possible explanation is that astrocytes possess robust mechanisms for replenishing intracellular GSH levels promptly after release. In support of this idea, our data demonstrate that exposure of astrocytes to arsenite upregulates mRNA production of the substrate importing transporter, Sxc, and the GSH synthetic enzymes GCL and GS. Further, our study provides evidence for the arsenite-induced increase in activity of Sxc, as well as an increase in protein expression of GCLC and GCLM but not GS.
With respect to substrate import, previous studies in our laboratory found that the half-life of xCT mRNA in arsenite exposed astrocytes was not significantly different from the control, indicating that post-transcriptional mechanisms were not the primary mode of regulation (Supplemental Figure S2). Instead, our current study reveals that arsenite induces an increase in steady-state xCT mRNA expression levels via a process requiring transcription. This increase in xCT mRNA expression appears to be functionally important, as it is accompanied by a significant increase in selenocystine uptake compared to vehicle-treated controls. This increased uptake is abolished by 4-CPG, an inhibitor of Sxc [34,38,39,40]. While 4-CPG does not fully eliminate basal uptake—likely due to the presence of additional cystine and cysteine transport systems in astrocytes [41,42]—its ability to block the arsenite-mediated increase provides strong evidence that the elevated uptake is primarily driven by increased Sxc activity.
Transcription, a process that copies DNA to RNA, relies on the recruitment of transcription factors that bind to specific DNA sequences, thereby initiating and regulating gene expression. Although we did not elucidate the exact cis and trans factors that mediate transcription of xCT in our system, insights from the literature offer potential avenues for further exploration. Arsenite has been shown to effectively permeate the BBB and induce oxidative stress via the formation of free radicals and reactive oxygen species (ROS), including hydrogen peroxide, hydroxyl radicals, and superoxide anions [43]. Among the mechanisms implicated in the cellular response to oxidative stress are electrophilic response elements (EpREs), also known as antioxidant response elements (AREs). Notably, four EpRE-like sequences [EpREs (1-4)] have been identified in the 5′ flanking region of the xCT gene [44]. Mutational analysis of EpRE-1 within the xCT gene has demonstrated its significant involvement in the transcriptional regulation of xCT in BHK21 fibroblasts when cells were exposed to diethyl maleate (DEM) and, importantly, to arsenite [44].
Binding to these ARE/EpRE sites is the transcription factor nuclear factor erythroid 2-related factor 2 (Nrf2). Nrf2 becomes activated under oxidative stress conditions, such as is known to occur in the presence of arsenite [45]. Nrf2 is known to regulate GSH metabolism [46,47], and there is ample evidence for the involvement of this transcription factor in the regulation of xCT expression in a variety of different tissues in both positive and negative directions [27,48,49,50,51,52]. Interestingly, meningeal tissue derived from Nrf2-knockout mice showed a decreased expression of xCT compared to wild-type littermates, as assessed by Western blotting [52]. Additionally, increased xCT expression has been shown to be dependent on Nrf2 in astrocytes treated with amyloid-beta fragments [53]. Finally, pyridoxine-induced activation of Nrf2 has been shown to increase GSH production in astrocytes [54] as well as in astrocytoma U373 cells [55].
Despite robust evidence for the role of Nrf2 in regulating xCT, previous studies in our lab have shown that Nrf2 is not required for arsenite-induced upregulation of xCT mRNA in astrocytes (Supplemental Figure S3). This raises questions about the ways that arsenite induces cellular stress, which signaling pathways and transcription factors those stressors activate, and the downstream genes whose expression patterns are altered as a result. Although oxidative stress is one of the primary mechanisms by which arsenite induces cellular stress [17,43], it is conceivable that arsenite might trigger xCT expression through alternate pathways. These could include genotoxicity [56,57] and/or protein misfolding/aggregation, which would engage distinct cell signaling pathways that regulate xCT expression via transcription factors other than Nrf2. For instance, genotoxic stress is known to activate activator protein-1 [AP-1 (c-Fos:c-Jun)] [58,59] and nuclear factor kappa-B [NF-kB, (p50:p65)] [60,61]. Pertinently, both sites are present on the xCT gene [62]. Additionally, knockout of activating transcription factor 4 (ATF4) [63] reduced, but did not eliminate, the expression of xCT mRNA in murine hepatocytes transformed to hepatocellular carcinoma (HCC) cells [50], implicating the involvement of the amino acid response elements (AAREs) in mediating xCT expression.
The present study also provides evidence for transcriptional regulation of both subunits of GCL. GCLC is the catalytic subunit of the enzyme, whereas GCLM modulates GCLC activity by increasing its Vmax and kcat [64], thereby allowing for optimal activity of the holoenzyme. Similar to our findings, arsenite exposure of murine hepatocytes transcriptionally regulated both GCLC and GCLM expression [65]. GCLM was also regulated via post-transcriptional stabilization [65], something not explored herein. Interestingly, in these hepatocytes, the arsenite-mediated increase in both subunits of GCL occurred via Nrf2-independent mechanisms [65]. Likewise, research in mouse embryonic fibroblasts, comparing cells derived from Nrf2-null mice to wild-type mice, found no significant difference in arsenite-induced GCLC and GCLM mRNA expression [65]. ATF4 might also be ruled out, as knockout had no significant effect on expression levels of GCLC and GCLM in hepatocellular carcinoma cells [50]. Interestingly, p38 mitogen-activated protein kinase (MAPK) and extracellular signal-related kinase (ERK) signaling pathways regulate arsenite-induced expression of GCL subunits in TGF-α-overexpressing mouse hepatocytes (TAMH) [66]. The activation of these signaling pathways is regulated by various transcription factors, including activating transcription factor-2 (ATF-2), AP-1, and NF-kB [67,68,69]. Whether these signaling pathways are involved in the arsenite-mediated increase in GCL in astrocytes remains to be determined.
Regardless of the mechanism by which this occurs, our data shows a 4–6-fold increase in GCLC and GCLM mRNA in cells treated with 15µM arsenite. Given that GCL is the rate-limiting enzyme for the GSH synthetic pathway [25], one might expect a significant increase in intracellular GSH concentrations following arsenite exposure given the significant upregulation of its subunits at both the mRNA and protein levels. Despite this, our data shows no significant changes in intracellular GSH levels induced by arsenite exposure. This may be due to the operation of a negative feedback loop, whereby GSH inhibits its own synthesis by slowing the function of GCL [70,71]. Thus, once sufficient levels of GSH are restored following arsenite-mediated export, GSH inhibits GCL function to prevent excessive synthesis. Since GCL requires ATP to synthesize the dipeptide γ-GluCys [25], it makes sense that the cell would tightly regulate the function of this enzyme once sufficient intracellular stores are replenished so as to not deplete ATP stores unnecessarily. It may also simply be that synthesis matches release.
Despite the robust arsenite-induced upregulation of GCL subunits, our data shows that GS mRNA is only slightly, though significantly, upregulated via transcriptional mechanisms. However, this does not result in an increase in GS protein expression, as determined by immunoblotting. One possible explanation is that GS mRNA is transcribed at a rate comparable to GCL but undergoes more rapid cytosolic degradation, limiting its accumulation and subsequent translation. Alternatively, the observed transcriptional upregulation may be insufficient to drive a corresponding increase in protein levels due to translational or post-translational regulatory controls. Future studies will be necessary to investigate whether GS protein expression is constrained by mRNA stability, translational efficiency, or protein turnover in this context. Finally, it should be noted that GS has a higher substrate affinity and is not as tightly regulated as GCL [25,72]. Thus, astrocytes may not need elevated levels of GS to maintain GSH levels, as the availability of γ-glutamylcysteine produced by increased GCL activity could potentially satisfy the demand for GSH synthesis. However, coordinated expression of GCL and GS is known to occur in other cell types [73,74].
In conclusion, our study provides compelling evidence that arsenite upregulates key processes essential for GSH synthesis in primary cortical astrocyte cultures in a transcription-dependent manner, including Sxc, GCLC, and GCLM. Taken together, our findings suggest that these components contribute, either individually or via coordinated mechanisms, to the observed increase in GSH accumulation in the media of astrocyte cultures exposed to arsenite. These results contribute to a better understanding of how the environmental toxicant arsenite influences antioxidant defenses in the brain. While this study is limited to in vitro experiments in isolated astrocytes, these controlled conditions enabled us to uncover specific mechanistic insights into arsenite-mediated gene regulation. Importantly, these findings establish a foundation for future in vivo studies aimed at understanding the cellular and molecular basis of arsenic neurotoxicity in the context of the intact neurovascular unit and the complex CNS microenvironment.

4. Materials and Methods

4.1. Experimental Media and Buffers

Cell culture media and experimental buffer compositions were as follows:
  • Media Stock (MS): Minimum Essential Media with Earle’s salts purchased without L-glutamine (Corning, Corning, NY, USA) supplemented with L-glutamine (L-gln; Gibco, Burlington, ON, Canada), glucose, and sodium bicarbonate to a final concentration of 2.0, 25.7, and 28.2 mM, respectively, and stored at 4 °C. This MS, which contained 100 µM cystine, as provided in the base MEM formulation, served as the foundation for all other cell culture media used in this study.
  • Astrocyte Plating Media (APM): MS was supplemented with 10% Calf Serum (CS; Hyclone Laboratories, Marlboro, MA, USA), 10% Fetal Bovine Serum (FBS; Hyclone), 50 IU penicillin, and 50 µg/mL streptomycin (Gibco) and stored at 4 °C. L-gln and epidermal growth factor (EGF; Thermo Fischer Scientific, Waltham, MA, USA) were added to a final concentration of 2 mM and 10 ng/mL, respectively. Medium was warmed to 37 °C immediately prior to use.
  • Maintenance Media-1 (MM-1): MS was supplemented with 10% CS, 50 IU penicillin, and 50 µg/mL streptomycin and stored at 4 °C. L-gln was supplemented to a final concentration 2 mM. Medium was warmed to 37 °C just prior to use.
  • Maintenance Media-2 (MM-2): MS was supplemented with 3% CS, 50 IU penicillin, and 50 µg/mL streptomycin and stored at 4 °C. L-gln was supplemented to a final concentration 2 mM. Medium was warmed to 37 °C just prior to use.
  • 1× BSS10: Cell-culture-grade water (Corning) containing 116.4 mM sodium chloride (NaCl; Thermo Fischer Scientific), 5.4 mM potassium chloride (KCl; Thermo Fischer Scientific), 0.8 mM magnesium sulfate heptahydrate (MgSO4·7H2O; Sigma-Aldrich, St. Louis, MO, USA), 1 mM sodium phosphate monobasic monohydrate (NaH2PO4·H2O; Thermo Fischer Scientific), 10 mM glucose, and 26 mM sodium bicarbonate was used. A 10× stock was generated and filter-sterilized before being stored at room temperature. A 1× BSS10 solution was then generated from the stock solution with sterile cell-culture-grade water in a sterile environment. Just prior to use, 1.8 mM CaCl2 was slowly added for a duration of five minutes while CO2 was bubbled into the solution. The 1× BSS10 was also stored at room temperature.

4.2. Astrocyte Cultures

Primary cortical astrocytes were cultured from cortices of 1–3-day postnatal CD1 mice (Charles River Laboratories, Wilmington, MA, USA). Cultures were established by seeding dissociated cells on 6- or 24-well tissue culture plates (Corning, Primaria) at a density of 3–4 hemispheres/10 mL APM/plate. Subsequently, the astrocytes were allowed to reach confluence, following which they were treated once with 8µM cytosine β-D-arabinofuranoside (Ara-C). Under these conditions, AraC selectively inhibited the proliferation of rapidly dividing contaminating cells, such as microglia, while having minimal impact on the now-quiescent astrocyte population. After 6 to 7 days of exposure to Ara-C, the astrocyte culture medium was fully replaced with MM, which was then refreshed weekly. This plating method consistently yielded confluent monolayers of cells with a protoplasmic morphology, which were previously confirmed to be astrocytes based on their immunoreactivity to an antibody against glial fibrillary acidic protein (GFAP) [75]. One day prior to experimentation, the astrocyte cultures were washed in MM containing 3% CS. This step served as a transition to the fully serum-free media used for all subsequent experimental treatments. All cultures were maintained in an incubator at 37 °C, 5.5% CO2, and 21% O2. Cultures that exceeded 35 days in vitro (DIV) were excluded from experimentation.

4.3. Drug Stocks and Exposures

  • Arsenite (Na2AsO2): Arsenite stock (25 mM) was prepared by dissolving sodium arsenite (Sigma-Aldrich) in MS and adjusting the pH to 7.0 using 1.65 N HCl. This stock solution was stored at 4 °C. Arsenite sub-stocks were generated by diluting the stock in MS to concentrations of 4, 10, 15, or 25 µM. Micromolar levels of arsenite have been commonly used in vitro to facilitate the identification of potential pathways and targets affected by arsenic, including those involved in the regulation of GSH synthesis [17,37,76]. On the day of experimentation, the astrocyte culture medium was fully aspirated, and cells were washed twice with MS (400 µL or 1.6 mL for 24- or 6-well plates, respectively). Cultures were treated with arsenite by either direct addition of the sub-stocks or by spiking the stock solution into wells to the desired final concentration. The exposure duration lasted 4 to 6 h depending on the specific requirements of the experimental protocol.
  • Actinomycin D (ActD): To inhibit transcription, ActD (Cayman, Ann Arbor, MI, USA) was utilized [77]. ActD stock (10 mg/mL) was prepared in DMSO and stored at −20 °C. A sub-stock (10 µg/mL) was made by diluting the stock solution into MS, resulting in a final DMSO concentration of =0.1%. Vehicle controls were prepared by adding DMSO to MS to the same final concentration. Astrocyte cultures were pretreated with either ActD (10 µg/mL) or vehicle (0.1% DMSO) prior to arsenite exposure (15 µM final concentration). The concentration of ActD used in these studies was consistent with prior work by our group and others demonstrating effective transcriptional inhibition while preserving astrocyte viability [78,79,80].
  • 4-carboxyphenylglycine (4-CPG): 4-CPG (Tocris, Avonmouth, Bristol, UK) was used to competitively inhibit Sxc [34,39,40]. 4-CPG stock (50 mM) was prepared in 1 N NaOH and stored at −20 °C. The stock solution was diluted to a final concentration of 500 µM in 1× BSS10 just prior to addition to cultures.
  • Selenocystine (SeCyss): SeCyss (Sigma-Aldrich) was utilized as an analog of cysteine to quantitatively measure Sxc activity in astrocytes [81]. SeCyss stock (100 mM) was prepared in 1 N NaOH. The solution was stored at −20 °C. On the day of experimentation, a 25 mM sub-stock was generated in 1N NaOH, which was further diluted in 1× BSS10 to a final concentration of 25 µM.

4.4. Glutathione Measurement

Cells were washed twice in MS (400 µL or 1.6 mL for 24- or 6-well plates, respectively) before undergoing a 30 min pre-treatment with either ActD or its vehicle, after which arsenite was spiked into appropriate wells to a final concentration of 15µM. After six hours of incubation, the cell culture medium was replaced with phenol-red-free MS supplemented with L-gln (2 mM). This approach ensured that arsenite was removed prior to the assay, eliminating potential interference with the GSH detection assay during the time of measurement. After 24 or 48 h, the medium was collected for analysis of intracellular and extracellular GSH levels. Measurements were carried out using the GSH-Glo glutathione assay (Promega, Madison, WI, USA), as per the manufacturer’s instructions. Luminescence was quantified using a Synergy2 microplate reader (Biotek, Winooski, VT, USA). GSH levels were quantified by measuring the luminescence emitted, calibrated against a standard curve generated from known concentrations of GSH standards prepared in the GSH-Glo reagent. Data are expressed as mean µmol GSH/g protein + SEM (intracellular) or µM GSH + SEM (extracellular).

4.5. Reverse Transcription–Quantitative Polymerase Chain Reaction (RT-qPCR)

To capture early transcriptional responses, total RNA was isolated from one well of a six-well plate using 1 mL of TriZol reagent, as per manufacturer’s instructions 4 h after arsenite exposure. First-strand cDNA was synthesized from 0.2–1 µg of RNA using MMLV Reverse Transcriptase (Invitrogen, Waltham, MA, USA) and oligo d(t) primers (Promega) as previously described [82]. The resulting cDNA served as a proxy for mRNA expression in subsequent quantitative polymerase chain reaction (qPCR) analyses. qPCR was performed using TaqMan Universal PCR Master Mix (Fischer, Fautenbach, Germany) and mouse-specific primer pairs (TaqMan Gene Expression Assays, Applied Biosystems, Waltham, MA, USA): xCT (Mm00442530_m1), GAPDH (Mm99999915_m1), GS (Mm00515065_m1), GCLC (Mm00602655_m1), GCLM (Mm00514996_m1), HPRT (Mm01545399_m1), and MRP1 (Mm00456156_m1). The relative quantity of cDNA was calculated via the comparative cycle threshold method (ΔΔCt), where cycle threshold values (Ct) for the gene of interest were normalized to an invariant housekeeping gene, GAPDH, which was confirmed to be stable in the presence of arsenite and/or actinomycin D. Ct values from the same samples were then compared with a calibrator sample Ct (control group) to determine the relative fold increase in mRNA. Experiments were performed to establish the amplification efficiencies of all primers used. Only primer pairs for the housekeeping gene and gene of interest that exhibited amplification efficiencies within 7% of each other were utilized to ensure accurate quantification.

4.6. (Seleno)Cystine Uptake Assay

The uptake of selenocystine into astrocytes was quantified using a fluorescence-based protocol validated to accurately represent transport mediated by Sxc [81]. In short, astrocyte cultures plated in 6-well plates were washed into MS (2×, 1.6 mL), after which cells were incubated with arsenite (15 µM) or its vehicle (each at 1.6 mL). After 24 h of incubation—consistent with the original protocol using diethyl maleate (DEM)—arsenite was removed by thorough washing (3×, 1.6 mL, 1× BSS10). A total of 5 min later, 25 µM SeCyss with or without 500 µM 4-CPG (final well volume = 1.6 mL) was washed into the cultures and placed back into the incubator at 37 °C for 30 min. The medium was aspirated, and 2 mL of ice-cold PBS was added directly to each well to arrest cell metabolism. The PBS was then aspirated, and 250 µL of ice-cold 100% methanol was added to permeabilize the cultures, thereby facilitating the release of selenocystine. The plate was promptly covered to prevent methanol evaporation and placed on a rocker for 5 min at 4 °C. Methanol supernatants were diluted 1:1 with H2O (Corning) followed by rocking (5 min). A total of 150 µL of a reaction cocktail containing 200 µM tris(2-carboxyethyl)phosphine (TCEP), 10 µM fluorescein O,O′-diacrylate (FOdA), and 100 mM MES (2-ethanesulfonic acid) buffer (pH 6.0) was added to 20 µL of diluted methanol supernatants in a 96-well black plate (Thermo Scientific™ Nunc™). Samples were run in duplicate. The plate was immediately covered in tinfoil and incubated at 37 °C for 30 min. The fluorescence intensity of fluorescein, formed by the interaction between selenocysteine and fluorescein O,O′-diacrylate (FOdA), was measured using a Synergy2 microplate reader (BioTek), employing an excitation wavelength of 485 nm and an emission wavelength of 535 nm. Selenocystine standards (10, 5, 2.5, 1.25, 0 µM) were prepared in 50% methanol. All standards and samples were run in duplicate. The concentration of selenocystine in our samples was quantified through extrapolation from this constructed curve and normalized to the protein content (Pierce™ BCA Protein Assay Kit, Thermo Fischer Scientific) of the respective wells to account for variations in cell quantity.

4.7. Immunoblotting

Protein expression was assessed via Western blot analysis. Astrocytes cultured in 6-well plates were exposed to 15 µM arsenite for 6 h, after which the arsenite-containing medium was removed and replaced with MS. After an additional 18–19 h, the cultures were washed twice with 1× HBSS (Corning Cellgro), followed by incubation with 1.6 mL of 0.05% Trypsin-EDTA (Gibco) at 37 °C for 5–10 min to aid detachment. Trypsin digestion was halted by transferring cells to an Eppendorf tube containing 1.6 mL of maintenance media-1, followed by centrifugation at 300× g for 5 min at 4 °C. The resulting pellet was resuspended in 3 mL of PBS and centrifuged again at 300× g for 5 min at 4 °C. Pellets from two wells were combined and lysed in 200 uL of RIPA lysis buffer (50 mM Tris, 1% NP-40, 1% SDS, 0.15 M NaCl, 12 mM deoxycholic acid, 5 mM iodoacetamide, 5 mM EDTA, 1× Complete Protease Inhibitor (Sigma-Aldrich) on ice for 30 min. Lysates were clarified by centrifugation (2500× g, 5 min, 4 °C), and the protein concentration in the supernatant was quantified using a BCA assay (Thermo Fischer Scientific). Ten micrograms of protein was denatured by boiling for 5 min in 4X SDS loading buffer (100 mM Tris, pH 6.8, 40% glycerol, 2% SDS, 50 mM EDTA, 6% β-mercaptoethanol, 0.08% bromophenol blue).
Proteins were separated by SDS-PAGE under reducing conditions and subsequently transferred onto a polyvinylidene difluoride (PVDF) membrane (0.45 um, Immobilon). Each membrane was stained with LI-COR Revert I700 to facilitate the precise quantification of protein loading in each lane for normalization purposes. After destaining, membranes were blocked in Odyssey blocking buffer (LI-COR Environmental, Lincoln, NE, USA) for 1 h at room temperature, followed by overnight incubation at 4 °C with primary antibodies against GCLc (0.93 ug/mL; rabbit polyclonal; ABclonal Technology, Woburn, MA, USA), GCLM (0.38 ug/mL; rabbit polyclonal; ABclonal), and GS (0.51 ug/mL; mouse monoclonal; Novus Biologicals, Centennial, CO, USA). Species-specific secondary antibodies conjugated with spectrally distinct IRDye® fluorescent dyes were used for protein detection, and images were acquired using the LI-COR ODYSSEY® Fc imaging system (LI-COR). Quantitative analysis was performed using the Image Studio 3.1 software (LI-COR). The linearity of antibody–antigen interactions was confirmed to ensure that appropriate protein and antibody concentrations were used. Protein levels were normalized relative to total protein stain values.

4.8. Bicinchoninic Acid (BCA) Assay (Thermo Fischer Scientific)

Cell lysates/extracts were collected and loaded in 40 µL duplicates in a 96-well plate. Standards were prepared by serially diluting a 1 mg/mL sample of bovine serum albumin (BSA) in phosphate-buffered saline (PBS) and used to generate a standard curve. The assay was performed according to the manufacturer’s instructions. Absorbance was measured at 562 nm using a SpectraMax M2 plate reader. The protein content of each sample was determined by extrapolation from the standard curve based on the absorbance value of each well.

4.9. Statistical Analysis

All statistical analyses were performed using GraphPad Prism Version 9.4.1 or higher. Normality was assessed by the Shapiro–Wilks test. Data determined to be normal were analyzed by parametric tests: (1) one-way ANOVA followed by either Dunnett’s test for comparison to the control or Šídák’s test for all possible comparisons; or (2) two-way ANOVA followed by Fishers uncorrected LSD test for multiple comparisons. Data determined to be non-normal or those which were naturally non-normal (e.g., percentage data) were analyzed by the Kruskal–Wallis ANOVA test followed by Dunn’s test for multiple comparisons. Geometric means were used for analysis of mRNA levels. Protein levels were compared by a paired t-test. Statistical tests used along with the exact p-values are delineated in the figure legends and in the figures, respectively.

Supplementary Materials

The following supporting information can be downloaded at: https://www.mdpi.com/article/10.3390/ijms26115375/s1, [83].

Author Contributions

Conceptualization, J.P.L., J.H. and S.J.H.; methodology, J.L, J.H. and S.J.H.; investigation, J.P.L., C.B. and J.H.; writing—original draft preparation, J.P.L.; writing—review and editing, J.P.L. and S.J.H.; supervision, S.J.H.; funding acquisition, S.J.H. All authors have read and agreed to the published version of the manuscript.

Funding

This research was funded by the National Institute of Neurological Disorders and Stroke (NINDS R01 NS051445-10).

Institutional Review Board Statement

The animal study protocol was approved by the Institutional Animal Care and Use Committee of Syracuse University (#23-006).

Informed Consent Statement

Not applicable.

Data Availability Statement

Data are contained within the article and are available on request.

Conflicts of Interest

The authors declare no conflicts of interest.

References

  1. Duker, A.A.; Carranza, E.J.M.; Hale, M. Arsenic Geochemistry and Health. Environ. Int. 2005, 31, 631–641. [Google Scholar] [CrossRef] [PubMed]
  2. Ng, J. Arsenic and Arsenic Compounds. In Environmental Health Criteria, 2nd ed.; World Health Organization: Geneva, Switzerland, 2001; ISBN 978-92-4-157224-8. [Google Scholar]
  3. Frisbie, S.H.; Mitchell, E.J. Arsenic in Drinking Water: An Analysis of Global Drinking Water Regulations and Recommendations for Updates to Protect Public Health. PLoS ONE 2022, 17, e0263505. [Google Scholar] [CrossRef]
  4. Naujokas, M.F.; Anderson, B.; Ahsan, H.; Aposhian, H.V.; Graziano, J.H.; Thompson, C.; Suk, W.A. The Broad Scope of Health Effects from Chronic Arsenic Exposure: Update on a Worldwide Public Health Problem. Environ. Health Perspect. 2013, 121, 295–302. [Google Scholar] [CrossRef] [PubMed]
  5. Ramos-Chávez, L.A.; Rendón-López, C.R.R.; Zepeda, A.; Silva-Adaya, D.; Del Razo, L.M.; Gonsebatt, M.E. Neurological Effects of Inorganic Arsenic Exposure: Altered Cysteine/Glutamate Transport, NMDA Expression and Spatial Memory Impairment. Front. Cell. Neurosci. 2015, 9, 21. [Google Scholar] [CrossRef]
  6. Martínez-Castillo, M.; García-Montalvo, E.A.; Arellano-Mendoza, M.G.; Sánchez-Peña, L.D.C.; Soria Jasso, L.E.; Izquierdo-Vega, J.A.; Valenzuela, O.L.; Hernández-Zavala, A. Arsenic Exposure and Non-Carcinogenic Health Effects. Hum. Exp. Toxicol. 2021, 40, S826–S850. [Google Scholar] [CrossRef]
  7. Sun, Y.; Liu, G.; Cai, Y. Thiolated Arsenicals in Arsenic Metabolism: Occurrence, Formation, and Biological Implications. J. Environ. Sci. 2016, 49, 59–73. [Google Scholar] [CrossRef]
  8. Jiang, X.; McDermott, J.R.; Ajees, A.A.; Rosen, B.P.; Liu, Z. Trivalent Arsenicals and Glucose Use Different Translocation Pathways in Mammalian GLUT1. Metallomics 2010, 2, 211–219. [Google Scholar] [CrossRef] [PubMed]
  9. Yoshinaga-Sakurai, K.; Shinde, R.; Rodriguez, M.; Rosen, B.P.; El-Hage, N. Comparative Cytotoxicity of Inorganic Arsenite and Methylarsenite in Human Brain Cells. ACS Chem. Neurosci. 2020, 11, 743–751. [Google Scholar] [CrossRef]
  10. Wang, L.; Xiong, X.; Zhang, L.; Shen, J. Neurovascular Unit: A Critical Role in Ischemic Stroke. CNS Neurosci. Ther. 2021, 27, 7–16. [Google Scholar] [CrossRef]
  11. Freeman, M.R. Specification and Morphogenesis of Astrocytes. Science 2010, 330, 774–778. [Google Scholar] [CrossRef]
  12. Liu, L.-R.; Liu, J.-C.; Bao, J.-S.; Bai, Q.-Q.; Wang, G.-Q. Interaction of Microglia and Astrocytes in the Neurovascular Unit. Front. Immunol. 2020, 11, 1024. [Google Scholar] [CrossRef] [PubMed]
  13. Brandebura, A.N.; Paumier, A.; Onur, T.S.; Allen, N.J. Astrocyte Contribution to Dysfunction, Risk and Progression in Neurodegenerative Disorders. Nat. Rev. Neurosci. 2023, 24, 23–39. [Google Scholar] [CrossRef] [PubMed]
  14. Lee, H.-G.; Wheeler, M.A.; Quintana, F.J. Function and Therapeutic Value of Astrocytes in Neurological Diseases. Nat. Rev. Drug Discov. 2022, 21, 339–358. [Google Scholar] [CrossRef]
  15. Ransom, B.R.; Ransom, C.B. Astrocytes: Multitalented Stars of the Central Nervous System. Methods Mol. Biol. 2012, 814, 3–7. [Google Scholar] [CrossRef]
  16. Gradisnik, L.; Velnar, T. Astrocytes in the Central Nervous System and Their Functions in Health and Disease: A Review. World J. Clin. Cases 2023, 11, 3385–3394. [Google Scholar] [CrossRef] [PubMed]
  17. Dringen, R.; Spiller, S.; Neumann, S.; Koehler, Y. Uptake, Metabolic Effects and Toxicity of Arsenate and Arsenite in Astrocytes. Neurochem. Res. 2016, 41, 465–475. [Google Scholar] [CrossRef]
  18. Dringen, R.; Brandmann, M.; Hohnholt, M.C.; Blumrich, E.-M. Glutathione-Dependent Detoxification Processes in Astrocytes. Neurochem. Res. 2015, 40, 2570–2582. [Google Scholar] [CrossRef]
  19. Tadepalle, N.; Koehler, Y.; Brandmann, M.; Meyer, N.; Dringen, R. Arsenite Stimulates Glutathione Export and Glycolytic Flux in Viable Primary Rat Brain Astrocytes. Neurochem. Int. 2014, 76, 1–11. [Google Scholar] [CrossRef]
  20. Aoyama, K. Glutathione in the Brain. Int. J. Mol. Sci. 2021, 22, 5010. [Google Scholar] [CrossRef]
  21. Dringen, R.; Gutterer, J.M.; Hirrlinger, J. Glutathione Metabolism in Brain Metabolic Interaction between Astrocytes and Neurons in the Defense against Reactive Oxygen Species. Eur. J. Biochem. 2000, 267, 4912–4916. [Google Scholar] [CrossRef]
  22. Dringen, R.; Kranich, O.; Hamprecht, B. The Gamma-Glutamyl Transpeptidase Inhibitor Acivicin Preserves Glutathione Released by Astroglial Cells in Culture. Neurochem. Res. 1997, 22, 727–733. [Google Scholar] [CrossRef] [PubMed]
  23. Dringen, R.; Pfeiffer, B.; Hamprecht, B. Synthesis of the Antioxidant Glutathione in Neurons: Supply by Astrocytes of CysGly as Precursor for Neuronal Glutathione. J. Neurosci. 1999, 19, 562–569. [Google Scholar] [CrossRef] [PubMed]
  24. Schulz, J.B.; Lindenau, J.; Seyfried, J.; Dichgans, J. Glutathione, Oxidative Stress and Neurodegeneration. Eur. J. Biochem. 2000, 267, 4904–4911. [Google Scholar] [CrossRef]
  25. Lu, S.C. Glutathione Synthesis. Biochim. Biophys. Acta 2013, 1830, 3143–3153. [Google Scholar] [CrossRef]
  26. Lapenna, D. Glutathione and Glutathione-Dependent Enzymes: From Biochemistry to Gerontology and Successful Aging. Ageing Res. Rev. 2023, 92, 102066. [Google Scholar] [CrossRef]
  27. Lewerenz, J.; Hewett, S.J.; Huang, Y.; Lambros, M.; Gout, P.W.; Kalivas, P.W.; Massie, A.; Smolders, I.; Methner, A.; Pergande, M.; et al. The Cystine/Glutamate Antiporter System Xc in Health and Disease: From Molecular Mechanisms to Novel Therapeutic Opportunities. Antioxid. Redox Signal. 2013, 18, 522–555. [Google Scholar] [CrossRef]
  28. Minich, T.; Riemer, J.; Schulz, J.B.; Wielinga, P.; Wijnholds, J.; Dringen, R. The Multidrug Resistance Protein 1 (Mrp1), but Not Mrp5, Mediates Export of Glutathione and Glutathione Disulfide from Brain Astrocytes. J. Neurochem. 2006, 97, 373–384. [Google Scholar] [CrossRef] [PubMed]
  29. Hirrlinger, J.; Schulz, J.B.; Dringen, R. Glutathione Release from Cultured Brain Cells: Multidrug Resistance Protein 1 Mediates the Release of GSH from Rat Astroglial Cells. J. Neurosci. Res. 2002, 69, 318–326. [Google Scholar] [CrossRef]
  30. Stridh, M.H.; Tranberg, M.; Weber, S.G.; Blomstrand, F.; Sandberg, M. Stimulated Efflux of Amino Acids and Glutathione from Cultured Hippocampal Slices by Omission of Extracellular Calcium: Likely Involvement of Connexin Hemichannels. J. Biol. Chem. 2008, 283, 10347–10356. [Google Scholar] [CrossRef]
  31. Rana, S.; Dringen, R. Gap Junction Hemichannel-Mediated Release of Glutathione from Cultured Rat Astrocytes. Neurosci. Lett. 2007, 415, 45–48. [Google Scholar] [CrossRef]
  32. Ballatori, N.; Hammond, C.L.; Cunningham, J.B.; Krance, S.M.; Marchan, R. Molecular Mechanisms of Reduced Glutathione Transport: Role of the MRP/CFTR/ABCC and OATP/SLC21A Families of Membrane Proteins. Toxicol. Appl. Pharmacol. 2005, 204, 238–255. [Google Scholar] [CrossRef] [PubMed]
  33. Li, L.; Lee, T.K.; Meier, P.J.; Ballatori, N. Identification of Glutathione as a Driving Force and Leukotriene C4 as a Substrate for Oatp1, the Hepatic Sinusoidal Organic Solute Transporter. J. Biol. Chem. 1998, 273, 16184–16191. [Google Scholar] [CrossRef] [PubMed]
  34. Fogal, B.; Li, J.; Lobner, D.; McCullough, L.D.; Hewett, S.J. System Xc Activity and Astrocytes Are Necessary for Interleukin-1 Beta-Mediated Hypoxic Neuronal Injury. J. Neurosci. 2007, 27, 10094–10105. [Google Scholar] [CrossRef] [PubMed]
  35. He, Y.; Jackman, N.A.; Thorn, T.L.; Vought, V.E.; Hewett, S.J. Interleukin-1β Protects Astrocytes against Oxidant-Induced Injury via an NF-κB-Dependent Upregulation of Glutathione Synthesis. Glia 2015, 63, 1568–1580. [Google Scholar] [CrossRef]
  36. Lee, T.D.; Yang, H.; Whang, J.; Lu, S.C. Cloning and Characterization of the Human Glutathione Synthetase 5′-Flanking Region. Biochem. J. 2005, 390, 521–528. [Google Scholar] [CrossRef]
  37. Meyer, N.; Koehler, Y.; Tulpule, K.; Dringen, R. Arsenate Accumulation and Arsenate-Induced Glutathione Export in Astrocyte-Rich Primary Cultures. Neurochem. Int. 2013, 62, 1012–1019. [Google Scholar] [CrossRef]
  38. Lutgen, V.; Qualmann, K.; Resch, J.; Kong, L.; Choi, S.; Baker, D.A. Reduction in Phencyclidine Induced Sensorimotor Gating Deficits in the Rat Following Increased System Xc Activity in the Medial Prefrontal Cortex. Psychopharmacology 2013, 226, 531–540. [Google Scholar] [CrossRef]
  39. Gochenauer, G.E.; Robinson, M.B. Dibutyryl-cAMP (dbcAMP) up-Regulates Astrocytic Chloride-Dependent L-[3H]Glutamate Transport and Expression of Both System Xc Subunits. J. Neurochem. 2001, 78, 276–286. [Google Scholar] [CrossRef]
  40. Patel, S.A.; Warren, B.A.; Rhoderick, J.F.; Bridges, R.J. Differentiation of Substrate and Non-Substrate Inhibitors of Transport System Xc: An Obligate Exchanger of L-Glutamate and L-Cystine. Neuropharmacology 2004, 46, 273–284. [Google Scholar] [CrossRef]
  41. Sosnoski, H.M.; Sears, S.M.S.; He, Y.; Frare, C.; Hewett, S.J. Sexually Dimorphic and Brain Region-Specific Transporter Adaptations in System Xc Null Mice. Neurochem. Int. 2020, 141, 104888. [Google Scholar] [CrossRef]
  42. Shanker, G.; Allen, J.W.; Mutkus, L.A.; Aschner, M. The Uptake of Cysteine in Cultured Primary Astrocytes and Neurons. Brain Res. 2001, 902, 156–163. [Google Scholar] [CrossRef] [PubMed]
  43. Flora, S.J.S.; Bhadauria, S.; Pant, S.C.; Dhaked, R.K. Arsenic Induced Blood and Brain Oxidative Stress and Its Response to Some Thiol Chelators in Rats. Life Sci. 2005, 77, 2324–2337. [Google Scholar] [CrossRef] [PubMed]
  44. Sasaki, H.; Sato, H.; Kuriyama-Matsumura, K.; Sato, K.; Maebara, K.; Wang, H.; Tamba, M.; Itoh, K.; Yamamoto, M.; Bannai, S. Electrophile Response Element-Mediated Induction of the Cystine/Glutamate Exchange Transporter Gene Expression. J. Biol. Chem. 2002, 277, 44765–44771. [Google Scholar] [CrossRef] [PubMed]
  45. Palma-Lara, I.; Martínez-Castillo, M.; Quintana-Pérez, J.C.; Arellano-Mendoza, M.G.; Tamay-Cach, F.; Valenzuela-Limón, O.L.; García-Montalvo, E.A.; Hernández-Zavala, A. Arsenic Exposure: A Public Health Problem Leading to Several Cancers. Regul. Toxicol. Pharmacol. 2020, 110, 104539. [Google Scholar] [CrossRef]
  46. Ma, Q. Role of Nrf2 in Oxidative Stress and Toxicity. Annu. Rev. Pharmacol. Toxicol. 2013, 53, 401–426. [Google Scholar] [CrossRef]
  47. Kerins, M.J.; Ooi, A. The Roles of NRF2 in Modulating Cellular Iron Homeostasis. Antioxid. Redox Signal. 2018, 29, 1756–1773. [Google Scholar] [CrossRef]
  48. He, Q.; Yang, J.; Pan, Z.; Zhang, G.; Chen, B.; Li, S.; Xiao, J.; Tan, F.; Wang, Z.; Chen, P.; et al. Biochanin A Protects against Iron Overload Associated Knee Osteoarthritis via Regulating Iron Levels and NRF2/System Xc/GPX4 Axis. Biomed. Pharmacother. 2023, 157, 113915. [Google Scholar] [CrossRef]
  49. Hu, K.; Li, K.; Lv, J.; Feng, J.; Chen, J.; Wu, H.; Cheng, F.; Jiang, W.; Wang, J.; Pei, H.; et al. Suppression of the SLC7A11/Glutathione Axis Causes Synthetic Lethality in KRAS-Mutant Lung Adenocarcinoma. J. Clin. Investig. 2020, 130, 1752–1766. [Google Scholar] [CrossRef]
  50. He, F.; Zhang, P.; Liu, J.; Wang, R.; Kaufman, R.J.; Yaden, B.C.; Karin, M. ATF4 Suppresses Hepatocarcinogenesis by Inducing SLC7A11 (xCT) to Block Stress-Related Ferroptosis. J. Hepatol. 2023, 79, 362–377. [Google Scholar] [CrossRef]
  51. Xu, Y.; Li, Y.; Li, J.; Chen, W. Ethyl Carbamate Triggers Ferroptosis in Liver through Inhibiting GSH Synthesis and Suppressing Nrf2 Activation. Redox Biol. 2022, 53, 102349. [Google Scholar] [CrossRef]
  52. Shih, A.Y.; Erb, H.; Sun, X.; Toda, S.; Kalivas, P.W.; Murphy, T.H. Cystine/Glutamate Exchange Modulates Glutathione Supply for Neuroprotection from Oxidative Stress and Cell Proliferation. J. Neurosci. 2006, 26, 10514–10523. [Google Scholar] [CrossRef] [PubMed]
  53. D’Ezio, V.; Colasanti, M.; Persichini, T. Amyloid-β 25-35 Induces Neurotoxicity through the Up-Regulation of Astrocytic System Xc. Antioxidants 2021, 10, 1685. [Google Scholar] [CrossRef] [PubMed]
  54. Wei, Y.; Lu, M.; Mei, M.; Wang, H.; Han, Z.; Chen, M.; Yao, H.; Song, N.; Ding, X.; Ding, J.; et al. Pyridoxine Induces Glutathione Synthesis via PKM2-Mediated Nrf2 Transactivation and Confers Neuroprotection. Nat. Commun. 2020, 11, 941. [Google Scholar] [CrossRef] [PubMed]
  55. Xu, X.-Q.; Xu, T.; Ji, W.; Wang, C.; Ren, Y.; Xiong, X.; Zhou, X.; Lin, S.-H.; Xu, Y.; Qiu, Y. Herpes Simplex Virus 1-Induced Ferroptosis Contributes to Viral Encephalitis. mBio 2023, 14, e0237022. [Google Scholar] [CrossRef]
  56. Ozturk, M.; Metin, M.; Altay, V.; Bhat, R.A.; Ejaz, M.; Gul, A.; Unal, B.T.; Hasanuzzaman, M.; Nibir, L.; Nahar, K.; et al. Arsenic and Human Health: Genotoxicity, Epigenomic Effects, and Cancer Signaling. Biol. Trace Elem. Res. 2022, 200, 988–1001. [Google Scholar] [CrossRef]
  57. Litwin, I.; Bocer, T.; Dziadkowiec, D.; Wysocki, R. Oxidative Stress and Replication-Independent DNA Breakage Induced by Arsenic in Saccharomyces Cerevisiae. PLoS Genet. 2013, 9, e1003640. [Google Scholar] [CrossRef]
  58. Büscher, M.; Rahmsdorf, H.J.; Litfin, M.; Karin, M.; Herrlich, P. Activation of the C-Fos Gene by UV and Phorbol Ester: Different Signal Transduction Pathways Converge to the Same Enhancer Element. Oncogene 1988, 3, 301–311. [Google Scholar]
  59. Dosch, J.; Kaina, B. Induction of C-Fos, c-Jun, junB and junD mRNA and AP-1 by Alkylating Mutagens in Cells Deficient and Proficient for the DNA Repair Protein O6-Methylguanine-DNA Methyltransferase (MGMT) and Its Relationship to Cell Death, Mutation Induction and Chromosomal Instability. Oncogene 1996, 13, 1927–1935. [Google Scholar]
  60. Brach, M.A.; Hass, R.; Sherman, M.L.; Gunji, H.; Weichselbaum, R.; Kufe, D. Ionizing Radiation Induces Expression and Binding Activity of the Nuclear Factor Kappa B. J. Clin. Investig. 1991, 88, 691–695. [Google Scholar] [CrossRef]
  61. Mohan, N.; Meltz, M.L. Induction of Nuclear Factor Kappa B after Low-Dose Ionizing Radiation Involves a Reactive Oxygen Intermediate Signaling Pathway. Radiat. Res. 1994, 140, 97–104. [Google Scholar] [CrossRef]
  62. Lastro, M.; Kourtidis, A.; Farley, K.; Conklin, D.S. xCT Expression Reduces the Early Cell Cycle Requirement for Calcium Signaling. Cell. Signal. 2008, 20, 390–399. [Google Scholar] [CrossRef] [PubMed]
  63. Ye, J.; Kumanova, M.; Hart, L.S.; Sloane, K.; Zhang, H.; De Panis, D.N.; Bobrovnikova-Marjon, E.; Diehl, J.A.; Ron, D.; Koumenis, C. The GCN2-ATF4 Pathway Is Critical for Tumour Cell Survival and Proliferation in Response to Nutrient Deprivation. EMBO J. 2010, 29, 2082–2096. [Google Scholar] [CrossRef] [PubMed]
  64. Griffith, O.W.; Mulcahy, R.T. The Enzymes of Glutathione Synthesis: Gamma-Glutamylcysteine Synthetase. Adv. Enzymol. Relat. Areas Mol. Biol. 1999, 73, 209–212. [Google Scholar] [CrossRef] [PubMed]
  65. Thompson, J.A.; White, C.C.; Cox, D.P.; Chan, J.Y.; Kavanagh, T.J.; Fausto, N.; Franklin, C.C. Distinct Nrf1/2-Independent Mechanisms Mediate As3+-Induced Glutamate-Cysteine Ligase Subunit Gene Expression in Murine Hepatocytes. Free Radic. Biol. Med. 2009, 46, 1614–1625. [Google Scholar] [CrossRef]
  66. Zipper, L.M.; Mulcahy, R.T. Inhibition of ERK and P38 MAP Kinases Inhibits Binding of Nrf2 and Induction of GCS Genes. Biochem. Biophys. Res. Commun. 2000, 278, 484–492. [Google Scholar] [CrossRef]
  67. Liu, X.; Shah, A.; Gangwani, M.R.; Silverstein, P.S.; Fu, M.; Kumar, A. HIV-1 Nef Induces CCL5 Production in Astrocytes through P38-MAPK and PI3K/Akt Pathway and Utilizes NF-kB, CEBP and AP-1 Transcription Factors. Sci. Rep. 2014, 4, 4450. [Google Scholar] [CrossRef]
  68. Nookala, A.R.; Shah, A.; Noel, R.J.; Kumar, A. HIV-1 Tat-Mediated Induction of CCL5 in Astrocytes Involves NF-κB, AP-1, C/EBPα and C/EBPγ Transcription Factors and JAK, PI3K/Akt and P38 MAPK Signaling Pathways. PLoS ONE 2013, 8, e78855. [Google Scholar] [CrossRef]
  69. Kirsch, K.; Zeke, A.; Tőke, O.; Sok, P.; Sethi, A.; Sebő, A.; Kumar, G.S.; Egri, P.; Póti, Á.L.; Gooley, P.; et al. Co-Regulation of the Transcription Controlling ATF2 Phosphoswitch by JNK and P38. Nat. Commun. 2020, 11, 5769. [Google Scholar] [CrossRef]
  70. Richman, P.G.; Meister, A. Regulation of Gamma-Glutamyl-Cysteine Synthetase by Nonallosteric Feedback Inhibition by Glutathione. J. Biol. Chem. 1975, 250, 1422–1426. [Google Scholar] [CrossRef]
  71. Liu, Y.; Hyde, A.S.; Simpson, M.A.; Barycki, J.J. Emerging Regulatory Paradigms in Glutathione Metabolism. Adv. Cancer Res. 2014, 122, 69–101. [Google Scholar] [CrossRef]
  72. Backos, D.S.; Fritz, K.S.; Roede, J.R.; Petersen, D.R.; Franklin, C.C. Posttranslational Modification and Regulation of Glutamate-Cysteine Ligase by the α,β-Unsaturated Aldehyde 4-Hydroxy-2-Nonenal. Free Radic. Biol. Med. 2011, 50, 14–26. [Google Scholar] [CrossRef]
  73. Yang, H.; Magilnick, N.; Xia, M.; Lu, S.C. Effects of Hepatocyte Growth Factor on Glutathione Synthesis, Growth, and Apoptosis Is Cell Density-Dependent. Exp. Cell Res. 2008, 314, 398–412. [Google Scholar] [CrossRef] [PubMed]
  74. Huang, Z.Z.; Chen, C.; Zeng, Z.; Yang, H.; Oh, J.; Chen, L.; Lu, S.C. Mechanism and Significance of Increased Glutathione Level in Human Hepatocellular Carcinoma and Liver Regeneration. FASEB J. 2001, 15, 19–21. [Google Scholar] [CrossRef] [PubMed]
  75. Trackey, J.L.; Uliasz, T.F.; Hewett, S.J. SIN-1-Induced Cytotoxicity in Mixed Cortical Cell Culture: Peroxynitrite-Dependent and -Independent Induction of Excitotoxic Cell Death. J. Neurochem. 2001, 79, 445–455. [Google Scholar] [CrossRef]
  76. Wang, Y.; Zhao, F.; Liao, Y.; Jin, Y.; Sun, G. Effects of Arsenite in Astrocytes on Neuronal Signaling Transduction. Toxicology 2013, 303, 43–53. [Google Scholar] [CrossRef]
  77. Lai, W.S.; Arvola, R.M.; Goldstrohm, A.C.; Blackshear, P.J. Inhibiting Transcription in Cultured Metazoan Cells with Actinomycin D to Monitor mRNA Turnover. Methods 2019, 155, 77–87. [Google Scholar] [CrossRef] [PubMed]
  78. Pshenichkin, S.P.; Szekely, A.M.; Wise, B.C. Transcriptional and Posttranscriptional Mechanisms Involved in the Interleukin-1, Steroid, and Protein Kinase C Regulation of Nerve Growth Factor in Cortical Astrocytes. J. Neurochem. 1994, 63, 419–428. [Google Scholar] [CrossRef]
  79. Jackman, N.A.; Uliasz, T.F.; Hewett, J.A.; Hewett, S.J. Regulation of System Xc Activity and Expression in Astrocytes by Interleukin-1β: Implications for Hypoxic Neuronal Injury. Glia 2010, 58, 1806–1815. [Google Scholar] [CrossRef]
  80. Yu, A.C.H.; Yung, H.W.; Hui, M.H.K.; Lau, L.T.; Chen, X.Q.; Collins, R.A. Cycloheximide and Actinomycin D Delay Death and Affect Bcl-2, Bax, and Ice Gene Expression in Astrocytes under in Vitro Ischemia. J. Neurosci. Res. 2003, 74, 318–325. [Google Scholar] [CrossRef]
  81. Shimomura, T.; Hirakawa, N.; Ohuchi, Y.; Ishiyama, M.; Shiga, M.; Ueno, Y. Simple Fluorescence Assay for Cystine Uptake via the xCT in Cells Using Selenocystine and a Fluorescent Probe. ACS Sens. 2021, 6, 2125–2128. [Google Scholar] [CrossRef]
  82. Hewett, J.A.; Hewett, S.J.; Winkler, S.; Pfeiffer, S.E. Inducible Nitric Oxide Synthase Expression in Cultures Enriched for Mature Oligodendrocytes Is Due to Microglia. J. Neurosci. Res. 1999, 56, 189–198. [Google Scholar] [CrossRef]
  83. Uliasz, T.F.; Hewett, S.J. A Microtiter Trypan Blue Absorbance Assay for the Quantitative Determination of Excitotoxic Neuronal Injury in Cell Culture. J. Neurosci. Methods 2000, 100, 157–163. [Google Scholar] [CrossRef] [PubMed]
Figure 1. Effect of arsenite on astrocyte GSH levels. Primary cortical astrocytes (n = 6–9 from 2–3 separate dissections) were treated with increasing concentrations of NaAsO2 for 6 h. The NaAsO2 was removed by washing, and the cultures were incubated for either 24 h (A) or 48 h (B). Data are expressed as mean µmol/g protein + SEM normalized to protein content in each individual well (intracellular) or mean µM/well + SEM (extracellular). Intracellular GSH levels were analyzed by the Kruskal–Wallis test followed by Dunn’s test for multiple comparisons. Extracellular GSH concentrations were analyzed by ordinary one-way ANOVA followed by Šídák’s test for multiple comparisons. No significant changes in intracellular levels were observed between any groups at either time point. An asterisk (*) denotes extracellular concentration values significantly different from untreated cells (0µM) only [(A) 0 vs. 4 µM, p = 0.0049; 0 vs. 15 µM, p < 0.0001; 0 vs. 25 µM p < 0.0001; (B) 0 vs. 15, p < 0.0001; 0 vs. 25 p < 0.0001].
Ijms 26 05375 g001
Figure 2. Effect of arsenite on astrocyte xCT mRNA expression and transporter activity. (A) Primary cortical astrocytes (n = 3 from 3 separate dissections) were treated with 10 µg/mL ActD (+ActD; gray bars) or its vehicle (−ActD; blue bars). Thirty minutes later, NaAsO2 was spiked into experimental wells to a final concentration of 15µM. After 4 h, RNA was isolated, and xCT mRNA expression was determined by RT-qPCR. Data are expressed as mean + SEM fold change in xCT mRNA over untreated cells (−NaAsO2, −ActD; =1). (B) Primary cortical astrocytes (n = 4 from separate dissections) were treated with NaAsO2 (15µM) for 24 h. Selenocystine (25 µM) was added to the cultures in the absence (−4-CPG, blue bars) or presence (+4-CPG, gray bars) of 4-CPG (500 µM) for 30 min. Cells were washed in methanol to permeabilize their plasma membranes, after which cellular extracts were collected and selenocystine concentration quantified, as described in the Section 4. Exact p-values are shown for each pairwise comparison that was determined to be significant by two-way ANOVA followed by Fisher’s uncorrected LSD test for multiple comparisons.
Ijms 26 05375 g002
Figure 3. Effect of arsenite on astrocyte GCL mRNA and protein expression. Primary cortical astrocytes (n = 3 from 3 separate dissections) were treated with 10 µg/mL ActD (+ActD; gray bars) or its vehicle (−ActD; blue bars) for 30 min, after which NaAsO2 was spiked into experimental wells to a final concentration of 15µM. Four hours later, RNA was isolated, and (A) GCLC and (D) GCLM mRNA expression was determined by RT-qPCR. Data are expressed as mean + SEM fold change over untreated cells (−NaAsO2, −ActD; =1). Exact p-values are shown for each pairwise comparison determined by two-way ANOVA followed by Fisher’s uncorrected LSD test for multiple comparisons. Protein expression of (B) GCLC and (E) GCLM was assessed by Western blotting, as described in the Section 4. Exact p-values are shown for each pairwise comparison determined to be significant by a paired t-test. Representative blots for (C) GCLC and (F) GCLM are shown.
Ijms 26 05375 g003
Figure 4. Effect of arsenite on astrocyte GS mRNA and protein expression. (A) Primary cortical astrocytes (n = 3 from 3 separate dissections) were treated with 10 µg/mL ActD (+ActD; gray bars) or its vehicle (−ActD; blue bars) for 30 min, after which NaAsO2 was spiked into experimental wells to a final concentration of 15µM. Four hours later, RNA was isolated, and GS mRNA expression was determined by RT-qPCR. Data are expressed as mean + SEM fold change in GS mRNA over untreated cells (−NaAsO2, −ActD). Exact p-values are shown for each pairwise comparison that was determined to be significant, as assessed by two-way ANOVA followed by Fisher’s uncorrected LSD test for multiple comparisons. (B) Protein expression of GS was assessed by Western blotting, as described in the Section 4. No significant changes in GS protein were determined by a paired t-test. (C) Representative blot for GSS.
Ijms 26 05375 g004
Figure 5. Transcriptional regulation of astrocytic GSH levels by arsenite. Primary cortical astrocytes (n = 5–6 from one dissection) were treated with ActD (10 µg/mL) or its vehicle for 30 min. NaAsO2 was then spiked into experimental wells (final concentration = 15 µM). A total of 6 h later, arsenite and/or ActD were removed by thorough washing, and cells were incubated for 48 h in phenol-red-free MS supplemented with L-glutamine. Aliquots of experimental medium were pulled for measurement of extracellular levels of GSH. Data are expressed as mean µM total GSH + SEM. Exact p-values are shown for each pairwise comparison that was determined to be significant, as assessed by two-way ANOVA followed by Fisher’s uncorrected LSD test for multiple comparisons.
Ijms 26 05375 g005
Disclaimer/Publisher’s Note: The statements, opinions and data contained in all publications are solely those of the individual author(s) and contributor(s) and not of MDPI and/or the editor(s). MDPI and/or the editor(s) disclaim responsibility for any injury to people or property resulting from any ideas, methods, instructions or products referred to in the content.

