
Identification of Quantitative Trait Loci Controlling Root Morphological Traits in an Interspecific Soybean Population Using 2D Imagery Data


 ,
, 
 ,
,  and
and
Abstract
1. Introduction
2. Results
2.1. Phenotypic Analysis of Root Traits
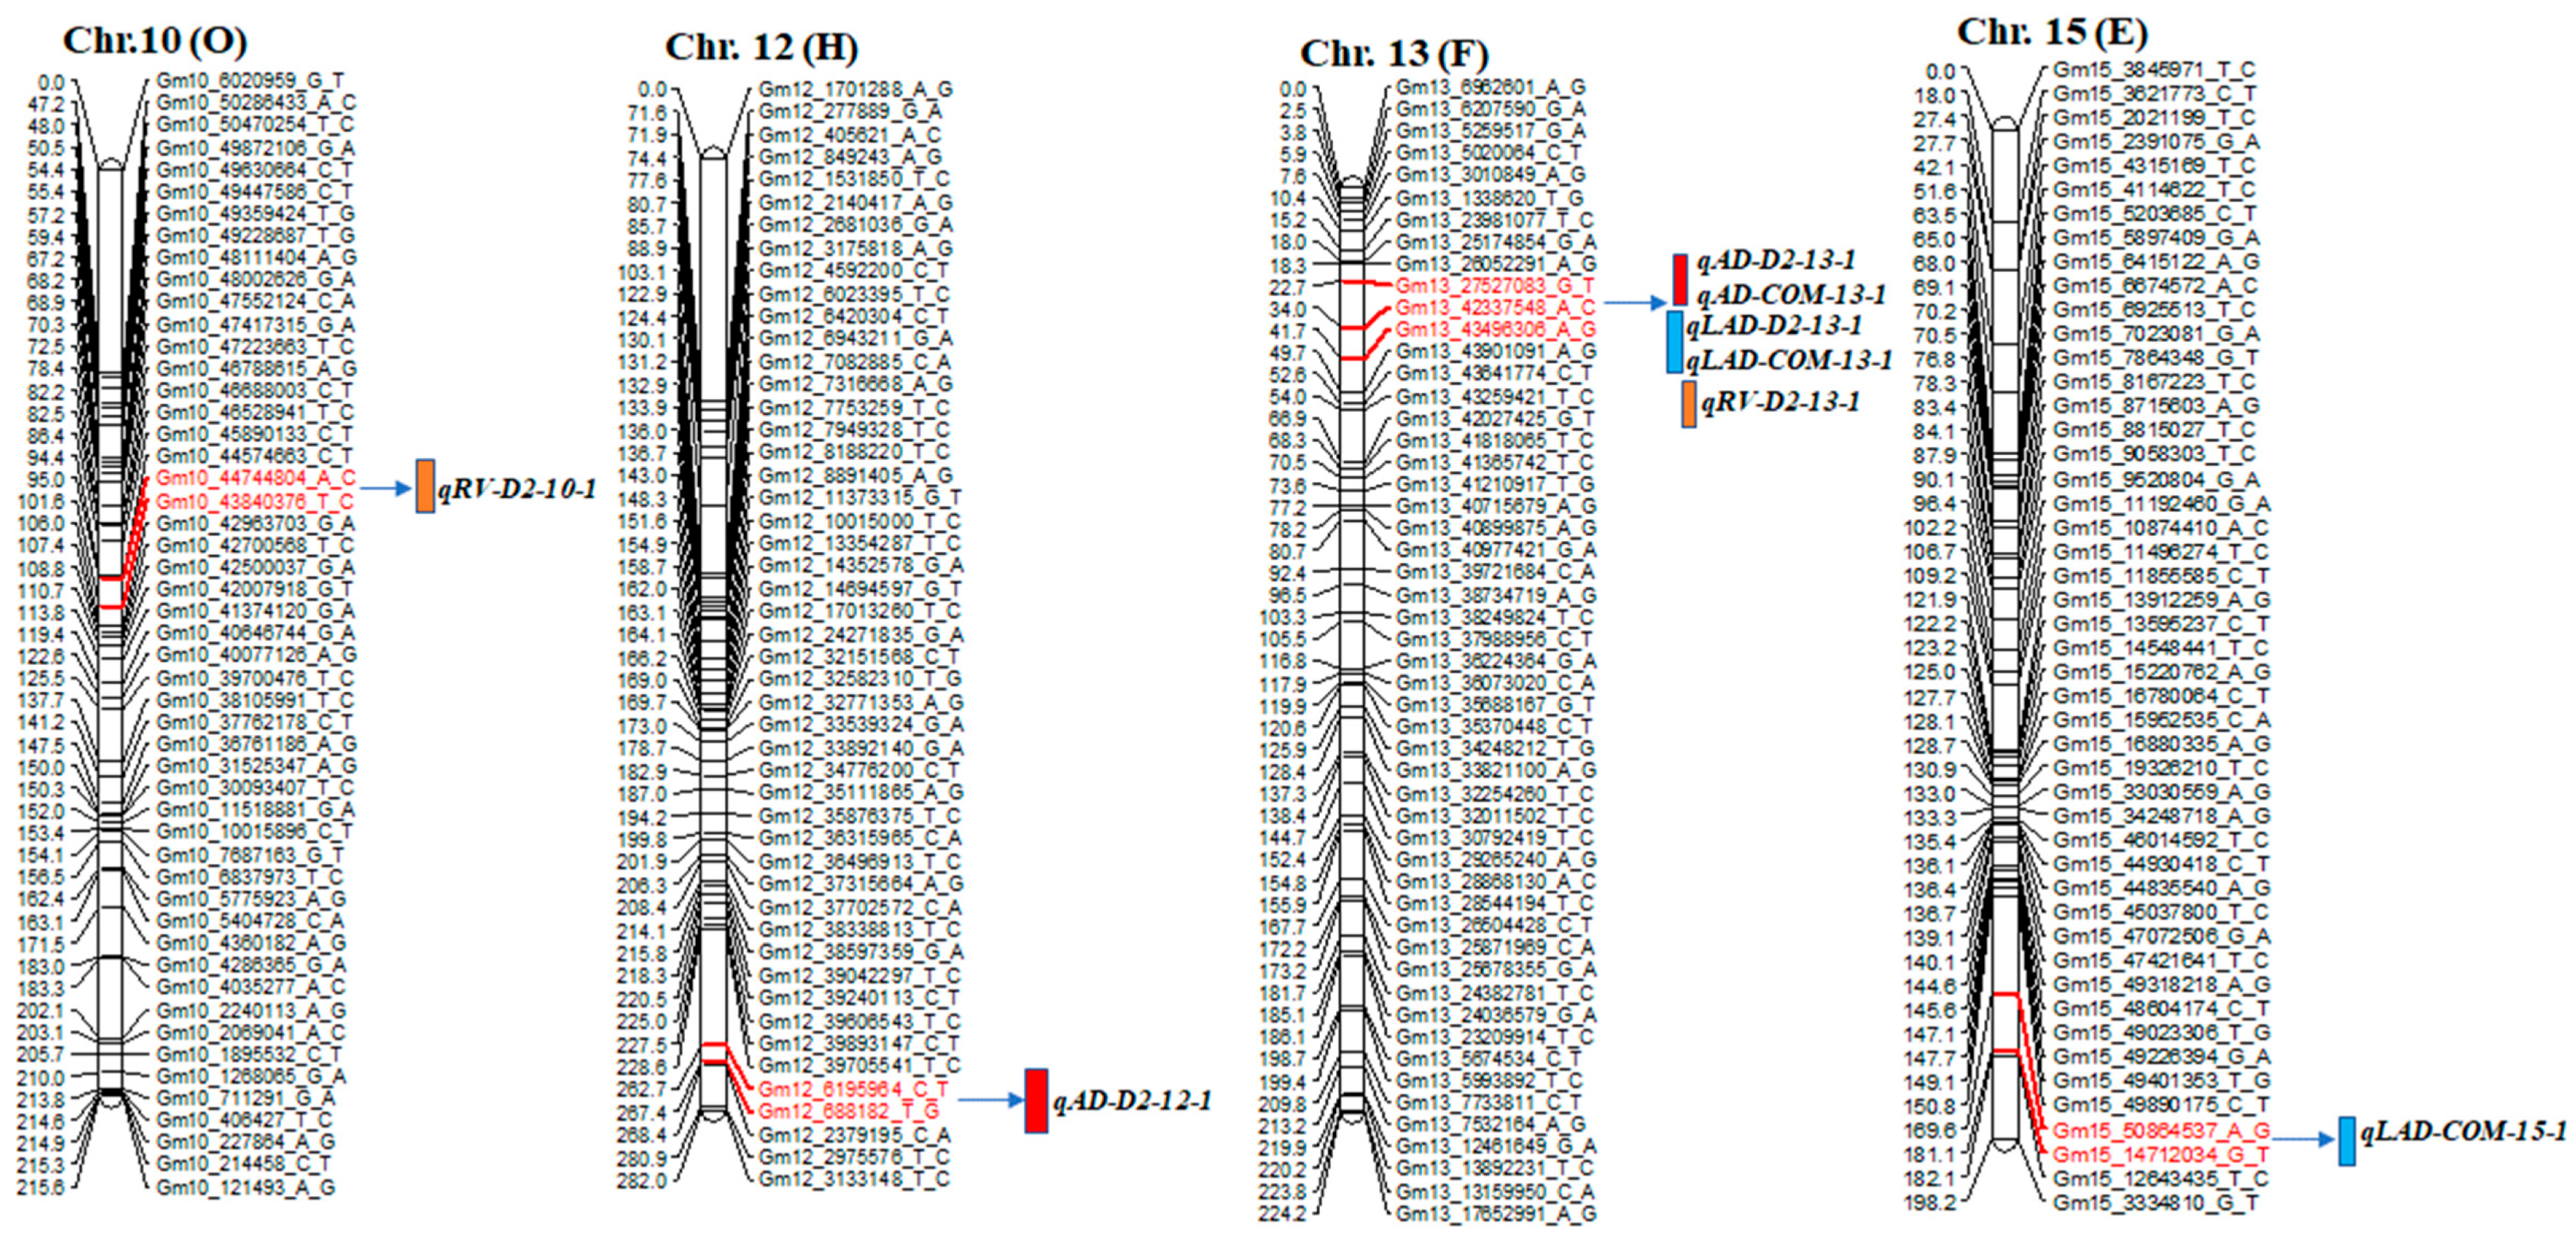
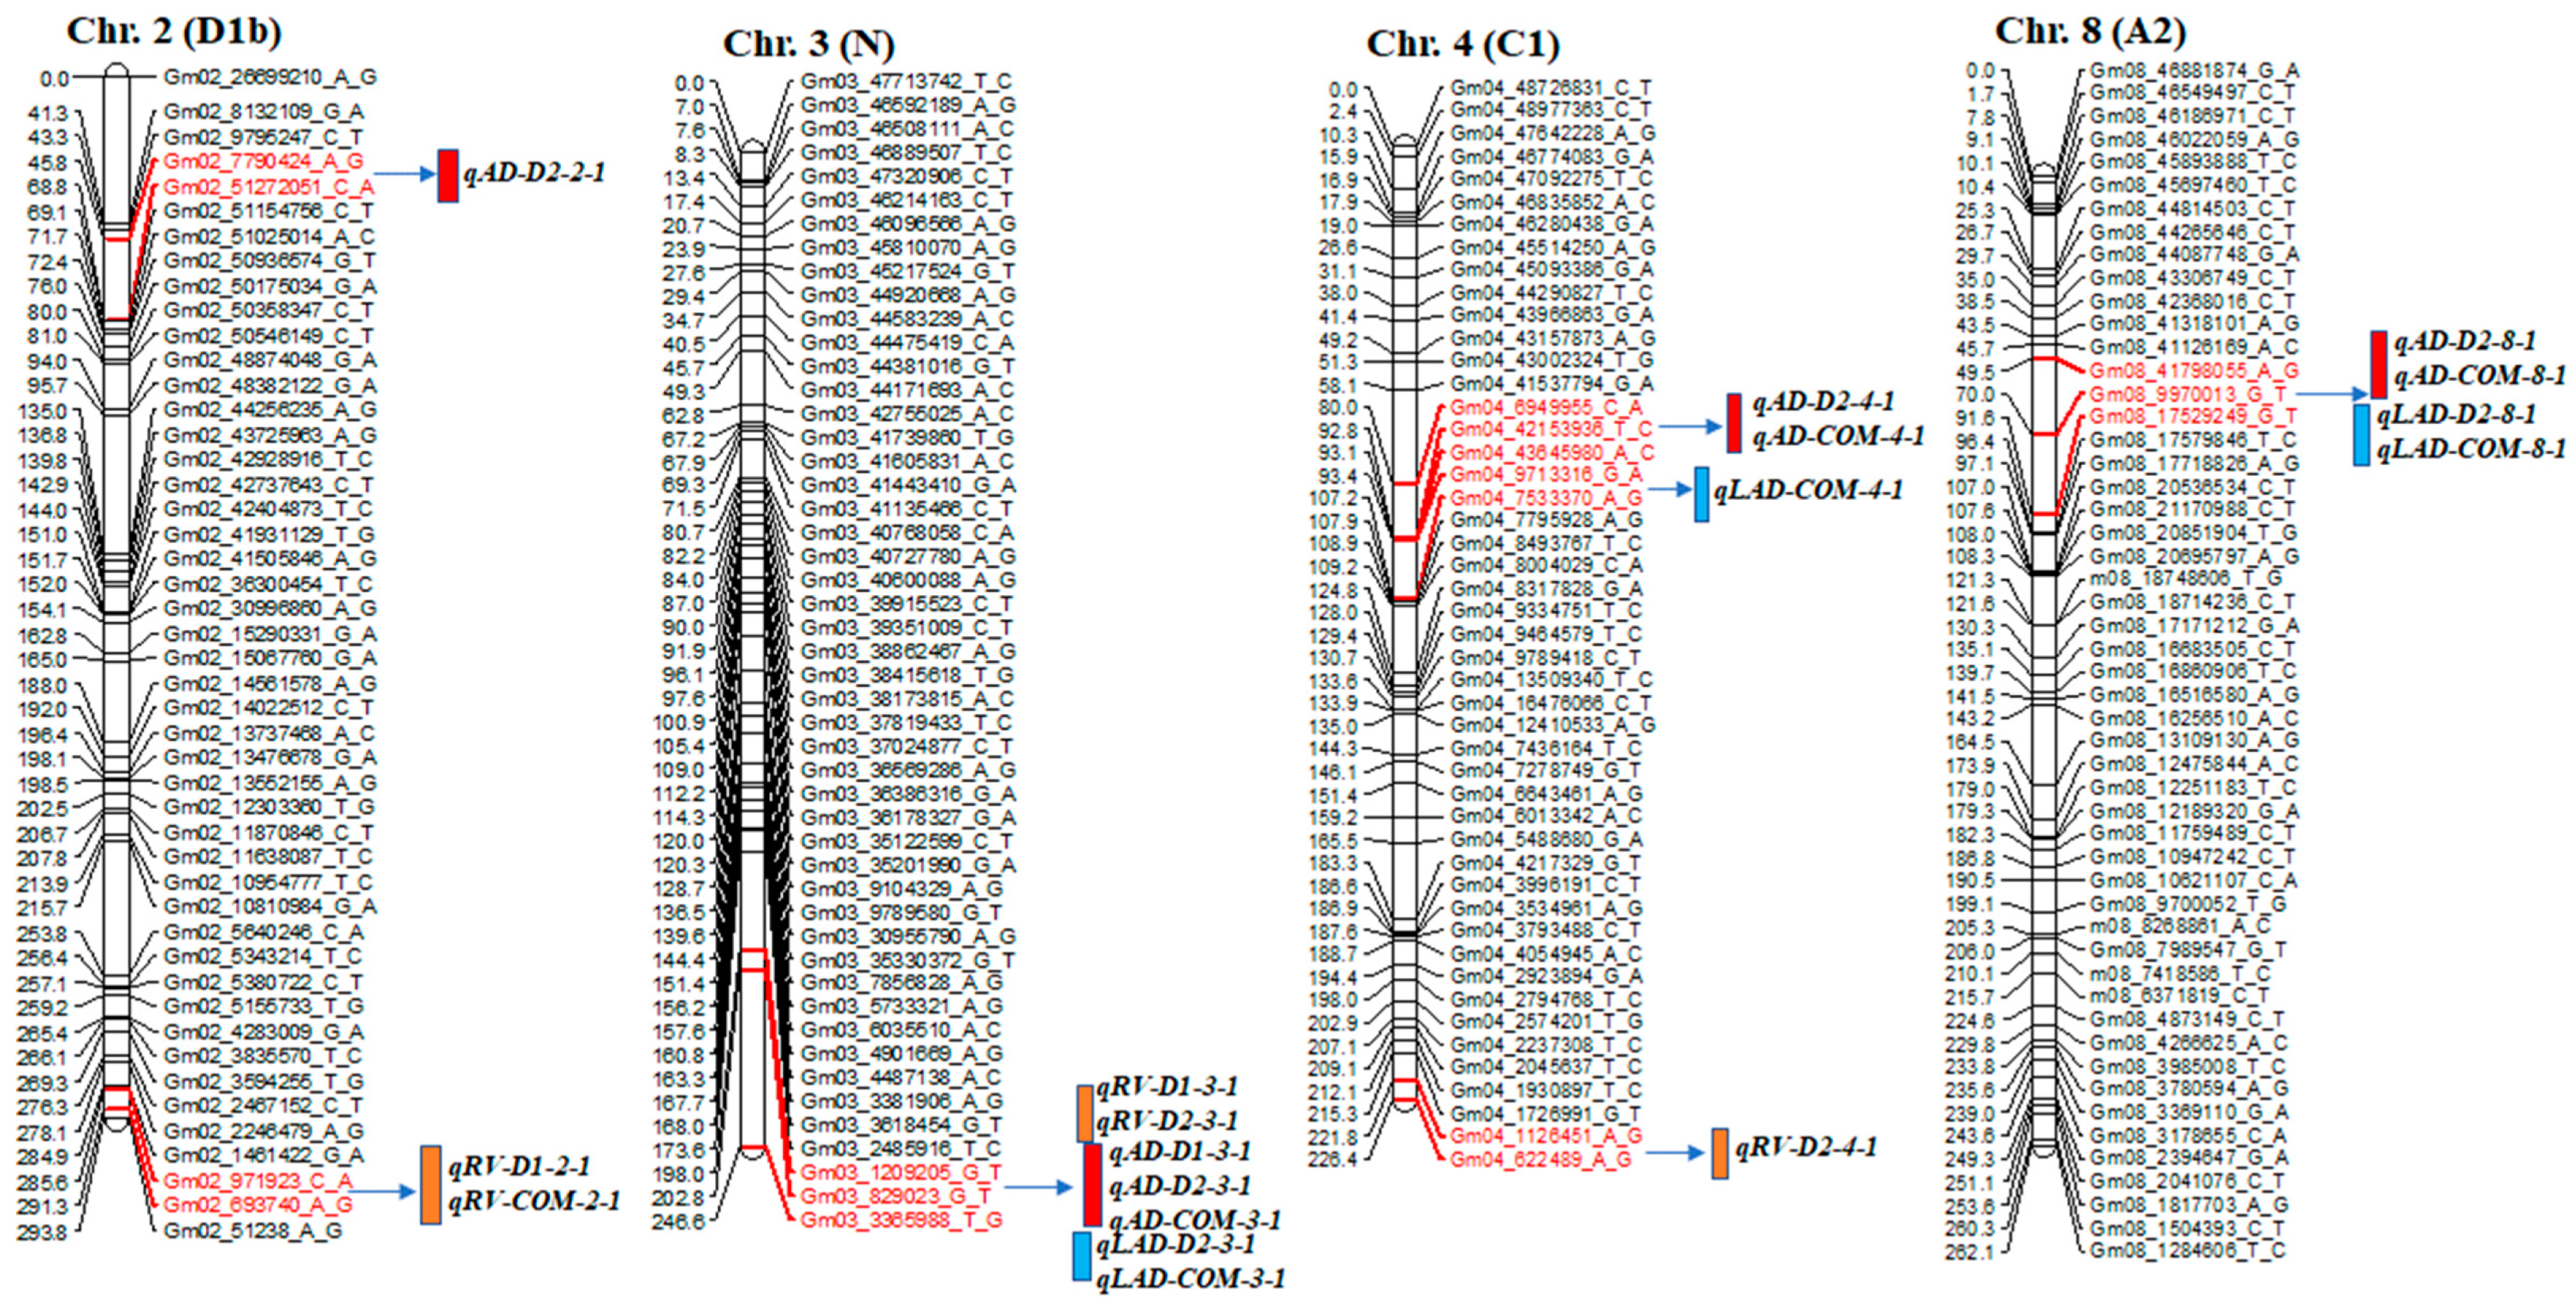
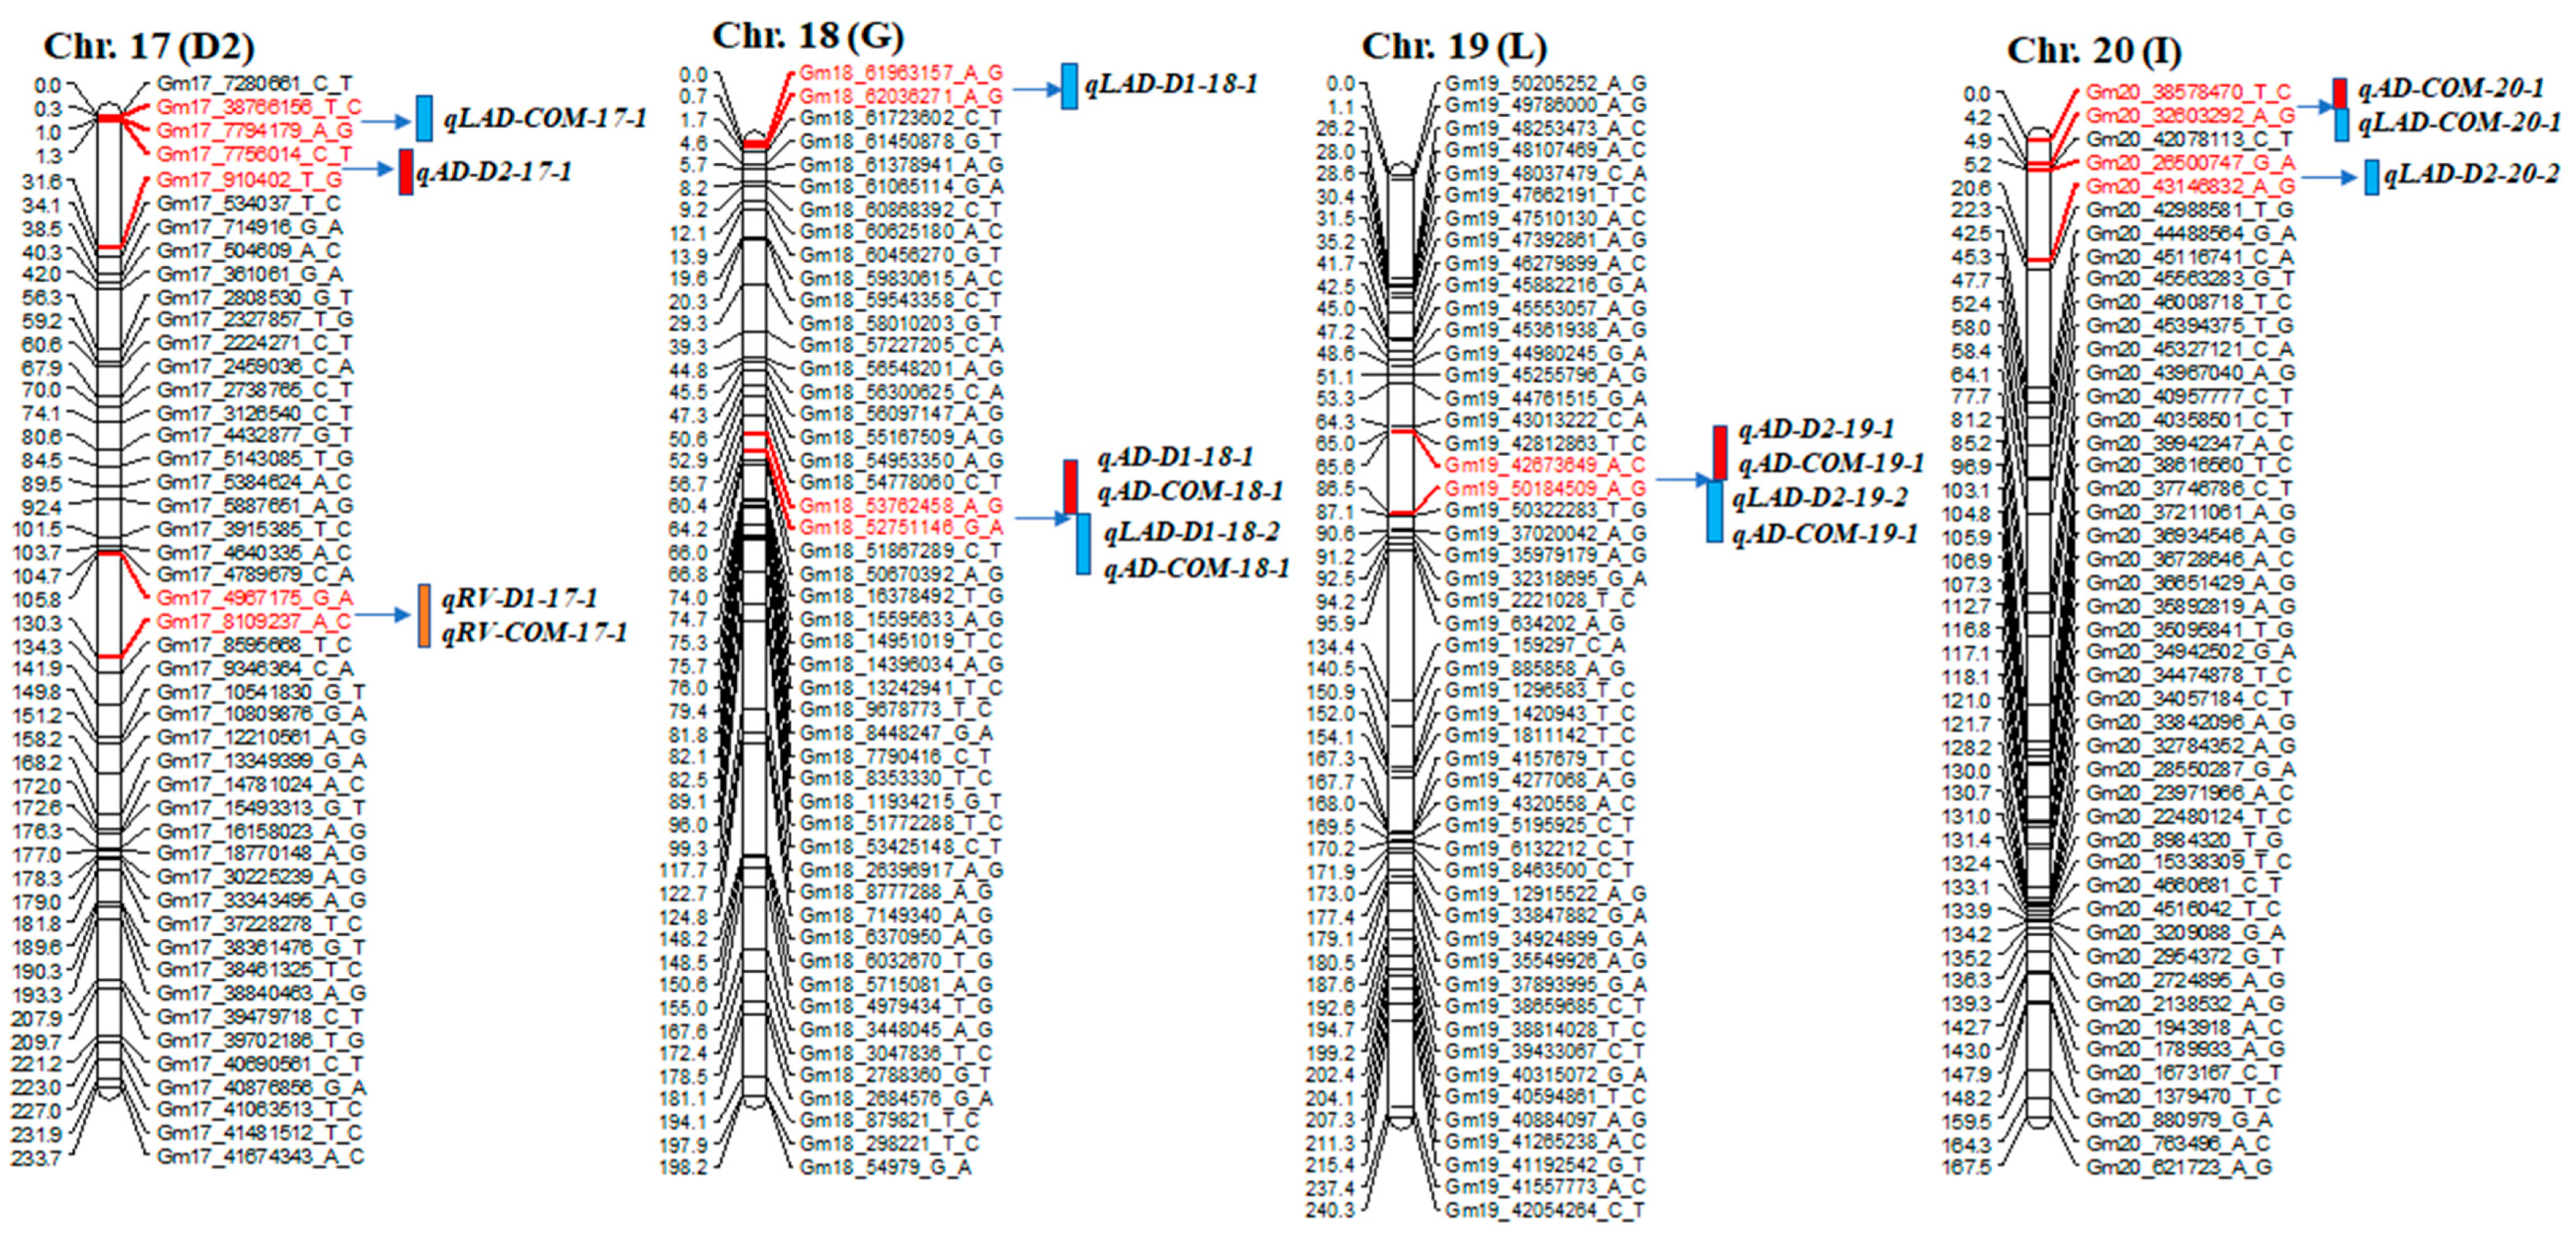
2.2. QTL Detection of Root Traits
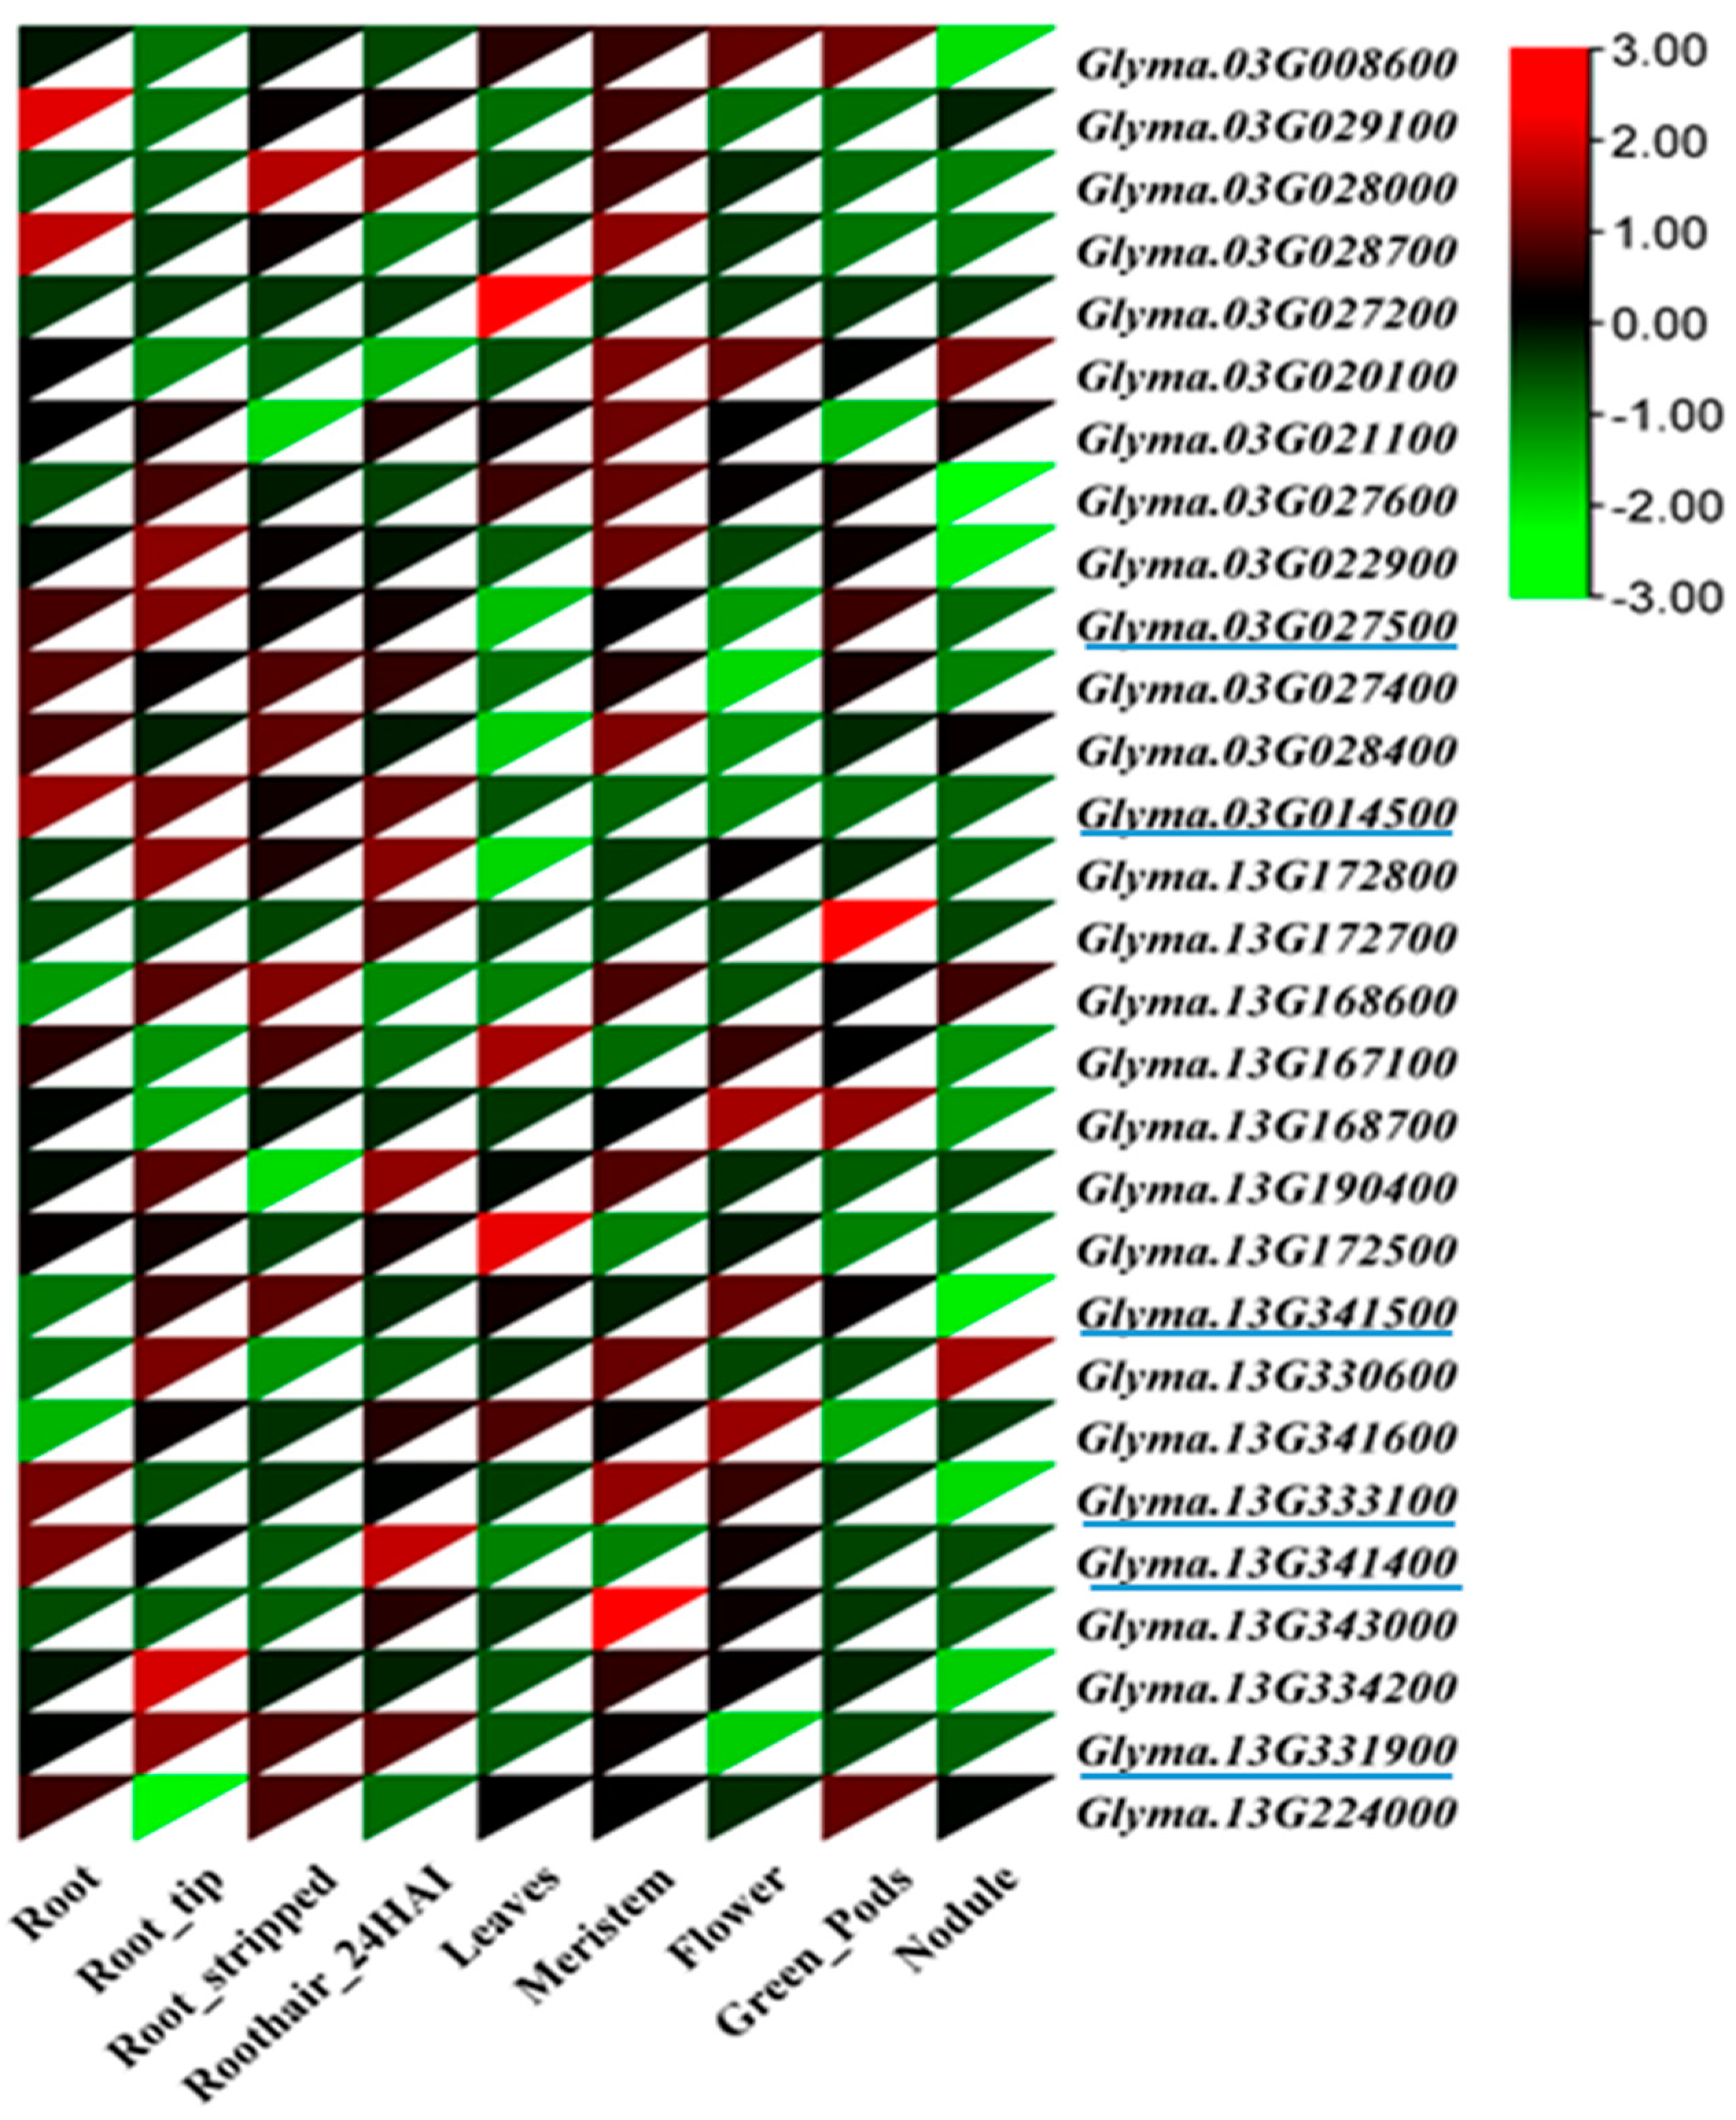
2.3. Putative Candidate Genes and Gene Expression in QTL Regions
3. Discussion
4. Materials and Methods
4.1. Plant Materials and Growth Conditions
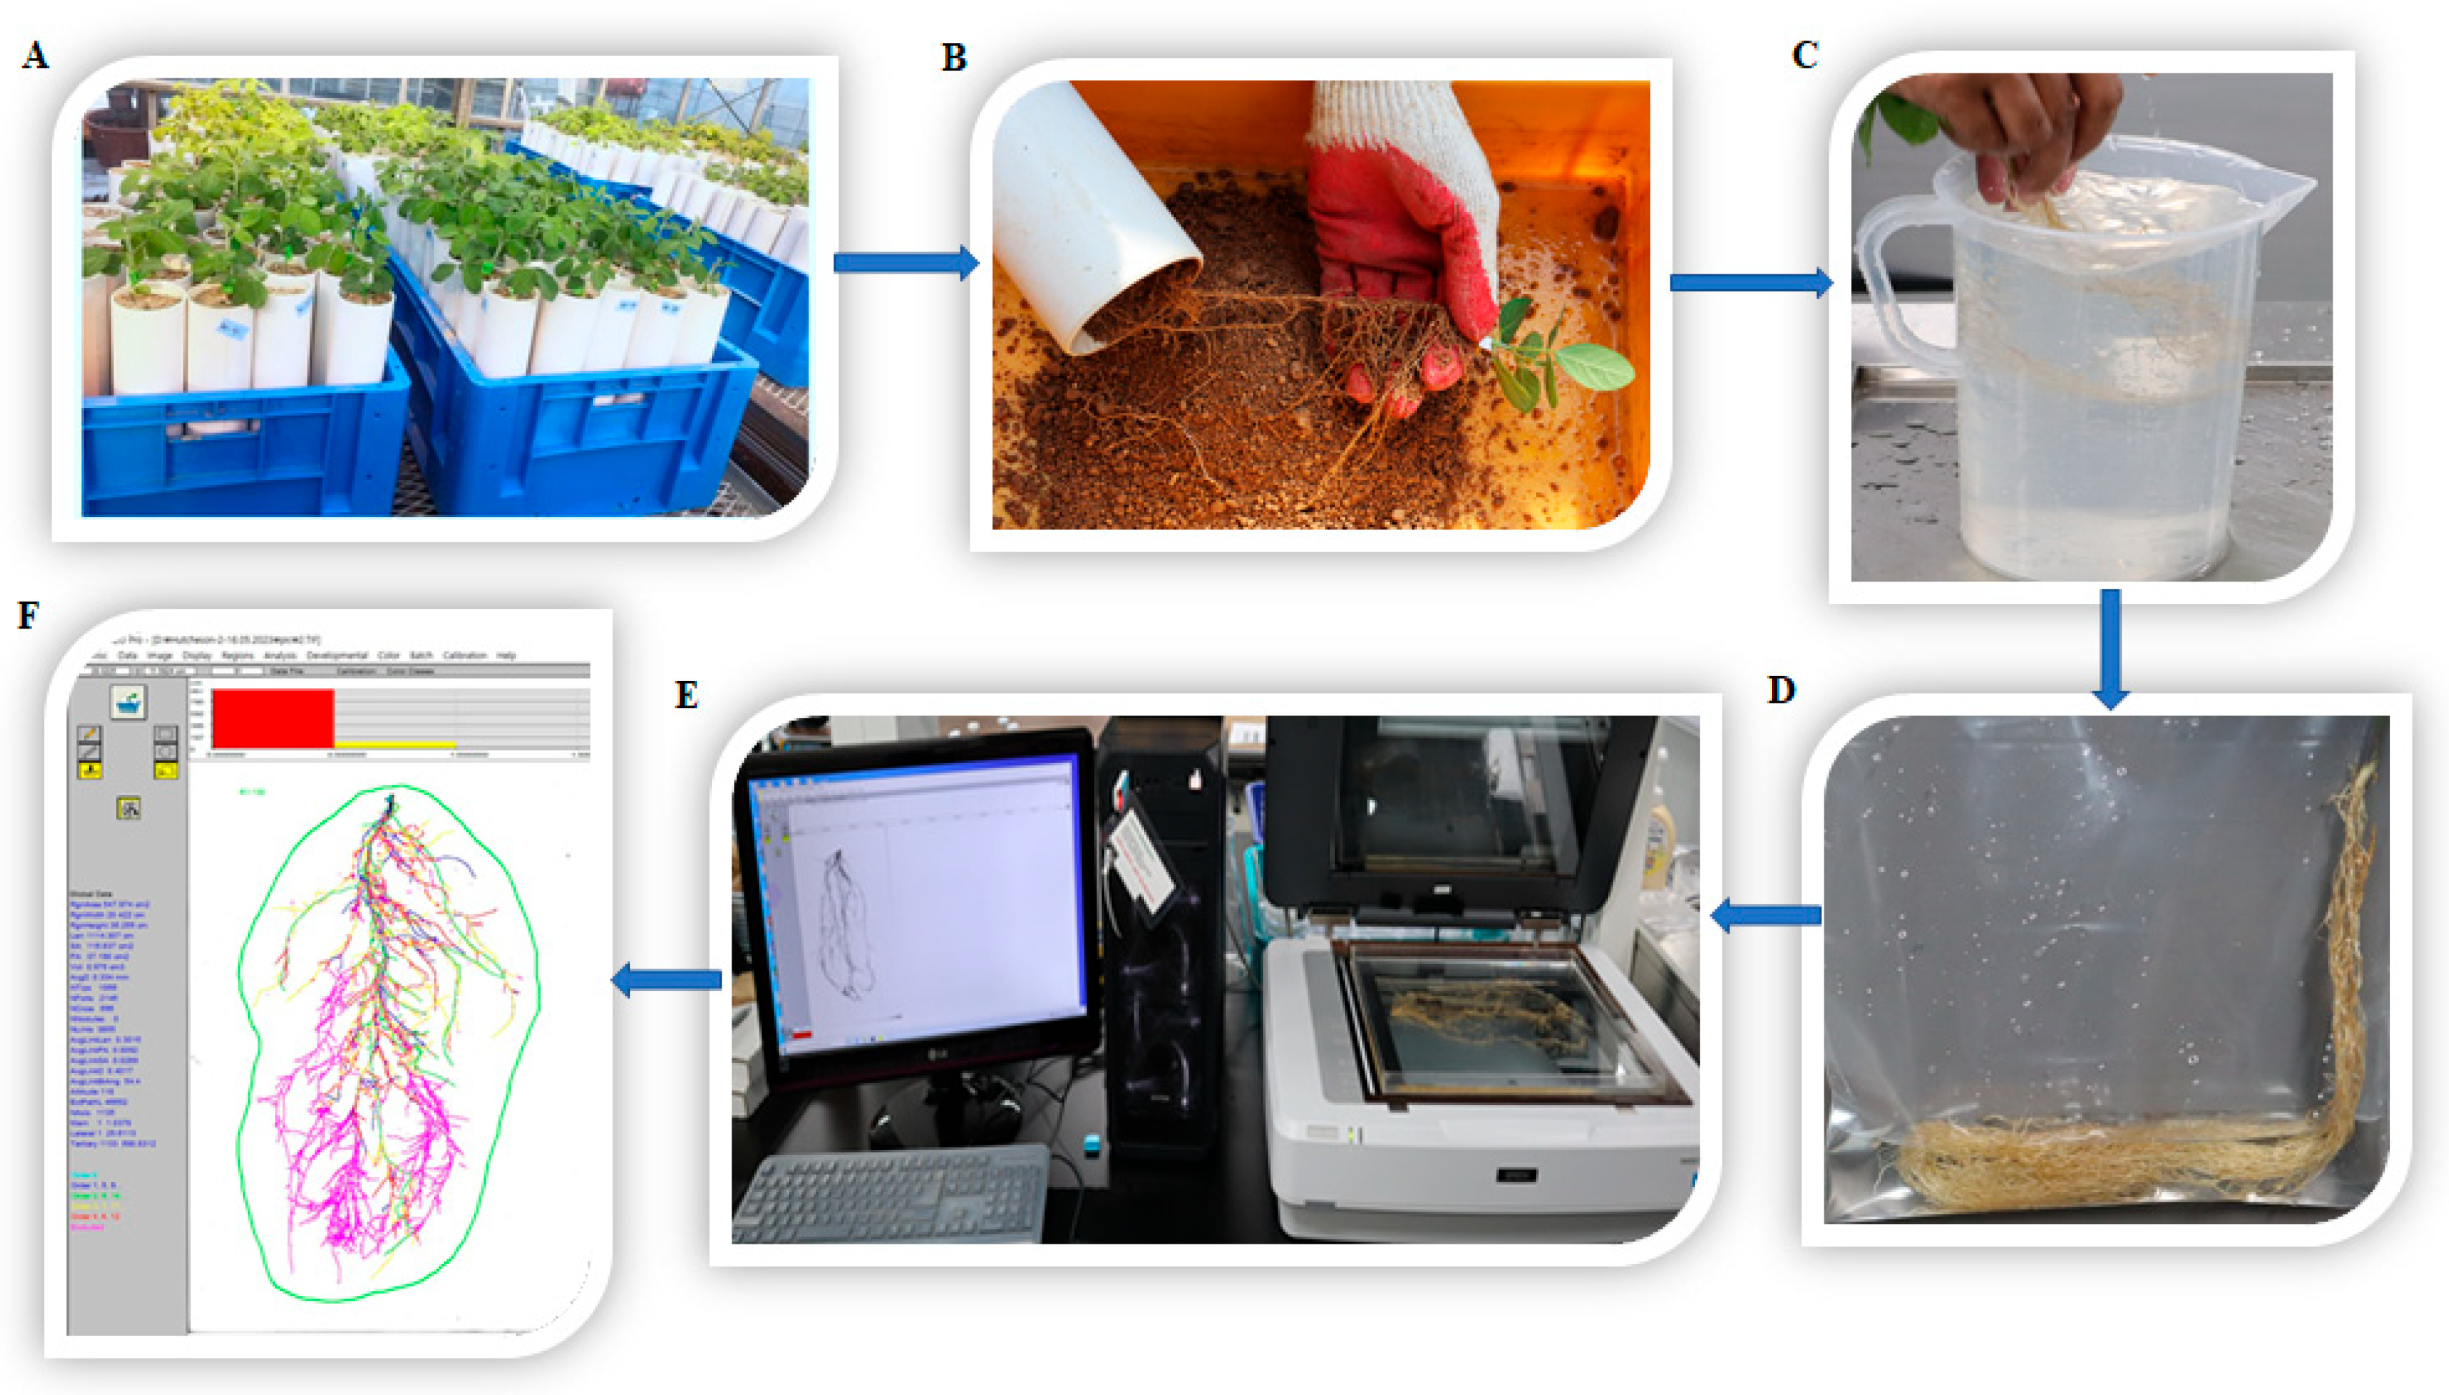
4.2. Root Phenotypic Evaluation

| Trait Abbreviation | Description (Units) |
| AD | Average diameter (mm) |
| RV | Root volume (cm3) |
| LAD | Link average diameter (mm) |
4.3. Genotyping and Linkage Map Construction
4.4. QTL Mapping Analysis
4.5. Candidate Gene Identification and Expression Analysis
4.6. Statistical Analysis
5. Conclusions
Supplementary Materials
Author Contributions
Funding
Institutional Review Board Statement
Informed Consent Statement
Data Availability Statement
Conflicts of Interest
References
- Medic, J.; Atkinson, C.; Hurburgh, C.R. Current knowledge in soybean composition. J. Am. Oil Chem. Soc. 2014, 91, 363–384. [Google Scholar] [CrossRef]
- Khojely, D.M.; Ibrahim, S.E.; Sapey, E.; Han, T. History, current status, and prospects of soybean production and research in sub-Saharan Africa. Crop J. 2018, 6, 226–235. [Google Scholar] [CrossRef]
- Rahman, S.U.; McCoy, E.; Raza, G.; Ali, Z.; Mansoor, S.; Amin, I. Improvement of soybean; A way forward transition from genetic engineering to new plant breeding technologies. Mol. Biotechnol. 2023, 65, 162–180. [Google Scholar] [CrossRef] [PubMed]
- Carter, T.E., Jr.; Nelson, R.L.; Clay, S.H.; Cui, Z. Genetic diversity in soybean. In Soybeans: Improvement, Production, and Uses; Shibles, R.M., Harper, J.E., Wilson, R.F., Shoemaker, R.C., Eds.; Wiley Online Library: Hoboken, NJ, USA, 2004; Volume 16, pp. 303–416. [Google Scholar]
- Lee, G.-A.; Crawford, G.W.; Liu, L.; Sasaki, Y.; Chen, X. Archaeological soybean (Glycine max) in East Asia: Does size matter? PLoS ONE 2011, 6, e26720. [Google Scholar] [CrossRef] [PubMed]
- Jeong, S.-C.; Moon, J.-K.; Park, S.-K.; Kim, M.-S.; Lee, K.; Lee, S.R.; Jeong, N.; Choi, M.S.; Kim, N.; Kang, S.-T. Genetic diversity patterns and domestication origin of soybean. Theor. Appl. Genet. 2019, 132, 1179–1193. [Google Scholar] [CrossRef] [PubMed]
- Gregory, P.J. RUSSELL REVIEW Are plant roots only “in” soil or are they “of” it? Roots, soil formation and function. Eur. J. Soil Sci. 2022, 73, e13219. [Google Scholar] [CrossRef]
- Lynch, J.P. Harnessing root architecture to address global challenges. Plant J. 2022, 109, 415–431. [Google Scholar] [CrossRef] [PubMed]
- Hodge, A.; Berta, G.; Doussan, C.; Merchan, F.; Crespi, M. Plant root growth, architecture and function. Plant Soil 2009, 321, 153–187. [Google Scholar] [CrossRef]
- Tripathi, P.; Abdullah, J.S.; Kim, J.; Chung, Y.-S.; Kim, S.-H.; Hamayun, M.; Kim, Y. Investigation of root morphological traits using 2D-imaging among diverse soybeans (Glycine max L.). Plants 2021, 10, 2535. [Google Scholar] [CrossRef] [PubMed]
- Manschadi, A.M.; Christopher, J.; deVoil, P.; Hammer, G.L. The role of root architectural traits in adaptation of wheat to water-limited environments. Funct. Plant Biol. 2006, 33, 823–837. [Google Scholar] [CrossRef] [PubMed]
- Manavalan, L.P.; Guttikonda, S.K.; Nguyen, V.T.; Shannon, J.G.; Nguyen, H.T. Evaluation of diverse soybean germplasm for root growth and architecture. Plant Soil 2010, 330, 503–514. [Google Scholar] [CrossRef]
- Valliyodan, B.; Van Toai, T.T.; Alves, J.D.; de Fátima P. Goulart, P.; Lee, J.D.; Fritschi, F.B.; Rahman, M.A.; Islam, R.; Shannon, J.G.; Nguyen, H.T. Expression of root-related transcription factors associated with flooding tolerance of soybean (Glycine max). Int. J. Mol. Sci. 2014, 15, 17622–17643. [Google Scholar] [CrossRef]
- Varshney, R.K.; Pazhamala, L.; Kashiwagi, J.; Gaur, P.M.; Krishnamurthy, L.; Hoisington, D. Genomics and physiological approaches for root trait breeding to improve drought tolerance in chickpea (Cicer arietinum L.). In Root Genomics; Springer: Berlin/Heidelberg, Germany, 2011; pp. 233–250. [Google Scholar]
- Sponchiado, B.N.; White, J.W.; Castillo, J.A.; Jones, P.G. Root growth of four common bean cultivars in relation to drought tolerance in environments with contrasting soil types. Exp. Agric. 1989, 25, 249–257. [Google Scholar] [CrossRef]
- Prince, S.J.; Valliyodan, B.; Ye, H.; Yang, M.; Tai, S.; Hu, W.; Murphy, M.; Durnell, L.A.; Song, L.; Joshi, T. Understanding genetic control of root system architecture in soybean: Insights into the genetic basis of lateral root number. Plant Cell Environ. 2019, 42, 212–229. [Google Scholar] [CrossRef] [PubMed]
- Suji, K.K.; Prince, K.S.J.; Mankhar, P.S.; Kanagaraj, P.; Poornima, R.; Amutha, K.; Kavitha, S.; Biji, K.R.; Gomez, S.M.; Babu, R.C. Evaluation of rice (Oryza sativa L.) near iso-genic lines with root QTLs for plant production and root traits in rainfed target populations of environment. Field Crops Res. 2012, 137, 89–96. [Google Scholar] [CrossRef]
- Wasson, A.P.; Richards, R.A.; Chatrath, R.; Misra, S.C.; Prasad, S.V.S.; Rebetzke, G.J.; Kirkegaard, J.A.; Christopher, J.; Watt, M. Traits and selection strategies to improve root systems and water uptake in water-limited wheat crops. J. Exp. Bot. 2012, 63, 3485–3498. [Google Scholar] [CrossRef] [PubMed]
- Tuberosa, R.; Salvi, S.; Giuliani, S.; Sanguineti, M.C.; Frascaroli, E.; Conti, S.; Landi, P. Genomics of root architecture and functions in maize. In Root Genomics; Springer: Berlin/Heidelberg, Germany, 2010; pp. 179–204. [Google Scholar]
- Beeckman, T.; De Smet, I.; Den Herder, G.; Van Isterdael, G. The roots of a new green revolution. Trends Plant Sci. 2010, 15, 600–607. [Google Scholar]
- Wang, X.; Xu, Y.; Hu, Z.; Xu, C. Genomic selection methods for crop improvement: Current status and prospects. Crop J. 2018, 6, 330–340. [Google Scholar] [CrossRef]
- Lidder, P.; Sonnino, A. Biotechnologies for the management of genetic resources for food and agriculture. Adv. Genet. 2012, 78, 1–167. [Google Scholar] [PubMed]
- Lee, J.D.; Yu, J.K.; Hwang, Y.H.; Blake, S.; So, Y.S.; Lee, G.J.; Nguyen, H.T.; Shannon, J.G. Genetic diversity of wild soybean (Glycine soja Sieb. and Zucc.) accessions from South Korea and other countries. Crop Sci. 2008, 48, 606–616. [Google Scholar] [CrossRef]
- Mammadov, J.; Buyyarapu, R.; Guttikonda, S.K.; Parliament, K.; Abdurakhmonov, I.Y.; Kumpatla, S.P. Wild relatives of maize, rice, cotton, and soybean: Treasure troves for tolerance to biotic and abiotic stresses. Front. Plant Sci. 2018, 9, 886. [Google Scholar] [CrossRef] [PubMed]
- Kim, K.S.; Diers, B.W.; Hyten, D.L.; Rouf Mian, M.A.; Shannon, J.G.; Nelson, R.L. Identification of positive yield QTL alleles from exotic soybean germplasm in two backcross populations. Theor. Appl. Genet. 2012, 125, 1353–1369. [Google Scholar] [CrossRef] [PubMed]
- Joshi, T.; Valliyodan, B.; Wu, J.-H.; Lee, S.-H.; Xu, D.; Nguyen, H.T. Genomic differences between cultivated soybean, G. max and its wild relative G. soja. BMC Genom. 2013, 14, S5. [Google Scholar] [CrossRef] [PubMed]
- Manavalan, L.P.; Prince, S.J.; Musket, T.A.; Chaky, J.; Deshmukh, R.; Vuong, T.D.; Song, L.; Cregan, P.B.; Nelson, J.C.; Shannon, J.G. Identification of novel QTL governing root architectural traits in an interspecific soybean population. PLoS ONE 2015, 10, e0120490. [Google Scholar] [CrossRef] [PubMed]
- Prince, S.J.; Vuong, T.D.; Wu, X.; Bai, Y.; Lu, F.; Kumpatla, S.P.; Valliyodan, B.; Shannon, J.G.; Nguyen, H.T. Mapping quantitative trait loci for soybean seedling shoot and root architecture traits in an inter-specific genetic population. Front. Plant Sci. 2020, 11, 1284. [Google Scholar] [CrossRef] [PubMed]
- Liang, H.; Yu, Y.; Yang, H.; Xu, L.; Dong, W.; Du, H.; Cui, W.; Zhang, H. Inheritance and QTL mapping of related root traits in soybean at the seedling stage. Theor. Appl. Genet. 2014, 127, 2127–2137. [Google Scholar] [CrossRef] [PubMed]
- Pantalone, V.R.; Rebetzke, G.J.; Burton, J.W.; Carter, T.E., Jr. Phenotypic evaluation of root traits in soybean and applicability to plant breeding. Crop Sci. 1996, 36, 456–459. [Google Scholar] [CrossRef]
- Slovak, R.; Ogura, T.; Satbhai, S.B.; Ristova, D.; Busch, W. Genetic control of root growth: From genes to networks. Ann. Bot. 2016, 117, 9–24. [Google Scholar] [CrossRef] [PubMed]
- Waidmann, S.; Sarkel, E.; Kleine-Vehn, J. Same same, but different: Growth responses of primary and lateral roots. J. Exp. Bot. 2020, 71, 2397–2411. [Google Scholar] [CrossRef] [PubMed]
- Zhou, R.; Chen, H.; Wang, X.; Wu, B.; Chen, S.; Zhang, X.; Wu, X.; Yang, Z.; Qiu, D.; Jiang, M. QTL analysis of root traits of soybean at seedling stage. Acta Agron. Sin. 2011, 37, 1151–1158. [Google Scholar] [CrossRef]
- Abdel-Haleem, H.; Lee, G.-J.; Boerma, R.H. Identification of QTL for increased fibrous roots in soybean. Theor. Appl. Genet. 2011, 122, 935–946. [Google Scholar] [CrossRef]
- Chen, H.; Kumawat, G.; Yan, Y.; Fan, B.; Xu, D. Mapping and validation of a major QTL for primary root length of soybean seedlings grown in hydroponic conditions. BMC Genom. 2021, 22, 132. [Google Scholar] [CrossRef] [PubMed]
- Poorter, H.; Nagel, O. The role of biomass allocation in the growth response of plants to different levels of light, CO2, nutrients and water: A quantitative review. Funct. Plant Biol. 2000, 27, 1191. [Google Scholar] [CrossRef]
- Manschadi, A.M.; Hammer, G.L.; Christopher, J.T.; Devoil, P. Genotypic variation in seedling root architectural traits and implications for drought adaptation in wheat (Triticum aestivum L.). Plant Soil 2008, 303, 115–129. [Google Scholar] [CrossRef]
- Lobet, G.; Pagès, L.; Draye, X. A novel image-analysis toolbox enabling quantitative analysis of root system architecture. Plant Physiol. 2011, 157, 29–39. [Google Scholar] [CrossRef] [PubMed]
- Bradshaw, H.D., Jr.; Otto, K.G.; Frewen, B.E.; McKay, J.K.; Schemske, D.W. Quantitative trait loci affecting differences in floral morphology between two species of monkeyflower (Mimulus). Genetics 1998, 149, 367–382. [Google Scholar] [CrossRef] [PubMed]
- Dhungana, S.K.; Kulkarni, K.P.; Park, C.W.; Jo, H.; Song, J.T.; Shin, D.H.; Lee, J.D. Mapping quantitative trait loci controlling soybean seed starch content in an interspecific cross of ‘Williams 82’ (Glycine max) and ‘PI 366121’ (Glycine soja). Plant Breed. 2017, 136, 379–385. [Google Scholar] [CrossRef]
- Lenis, J.M. Genetics of Soybean Seed Lipoxygenases and Linolenic Acid Content in Seeds of the Soybean Wild Ancestor; University of Missouri-Columbia: Columbia, MO, USA, 2011. [Google Scholar]
- Lee, J.S.; Yoo, M.-h.; Jung, J.K.; Bilyeu, K.D.; Lee, J.-D.; Kang, S. Detection of novel QTLs for foxglove aphid resistance in soybean. Theor. Appl. Genet. 2015, 128, 1481–1488. [Google Scholar] [CrossRef] [PubMed]
- Kim, K.-S.; Kim, J.-M.; Jung, J.; Shin, I.; Park, S.; Lee, J.S.; Jeong, S.-C.; Lee, J.-D.; Jung, J.K.; Ha, B.-K. Fine-mapping and candidate gene analysis for the foxglove aphid resistance gene Raso2 from wild soybean PI 366121. Theor. Appl. Genet. 2021, 134, 2687–2698. [Google Scholar] [CrossRef] [PubMed]
- Kulkarni, K.P.; Asekova, S.; Lee, D.-H.; Bilyeu, K.; Song, J.T.; Lee, J.-D. Mapping QTLs for 100-seed weight in an interspecific soybean cross of Williams 82 (Glycine max) and PI 366121 (Glycine soja). Crop Pasture Sci. 2017, 68, 148–155. [Google Scholar] [CrossRef]
- Song, Q.; Yan, L.; Quigley, C.; Fickus, E.; Wei, H.; Chen, L.; Dong, F.; Araya, S.; Liu, J.; Hyten, D. Soybean BARCSoySNP6K: An assay for soybean genetics and breeding research. Plant J. 2020, 104, 800–811. [Google Scholar] [CrossRef] [PubMed]
- Uga, Y.; Sugimoto, K.; Ogawa, S.; Rane, J.; Ishitani, M.; Hara, N.; Kitomi, Y.; Inukai, Y.; Ono, K.; Kanno, N. Control of root system architecture by DEEPER ROOTING 1 increases rice yield under drought conditions. Nat. Genet. 2013, 45, 1097–1102. [Google Scholar] [CrossRef] [PubMed]
- Wang, Z.; Huang, C.; Niu, Y.; Yung, W.-S.; Xiao, Z.; Wong, F.-L.; Huang, M.; Wang, X.; Man, C.-K.; Sze, C.-C. QTL analyses of soybean root system architecture revealed genetic relationships with shoot-related traits. Theor. Appl. Genet. 2022, 135, 4507–4522. [Google Scholar] [CrossRef] [PubMed]
- Seck, W.; Torkamaneh, D.; Belzile, F. Comprehensive genome-wide association analysis reveals the genetic basis of root system architecture in soybean. Front. Plant Sci. 2020, 11, 590740. [Google Scholar] [CrossRef]
- Prince, S.J.; Song, L.; Qiu, D.; Maldonado dos Santos, J.V.; Chai, C.; Joshi, T.; Patil, G.; Valliyodan, B.; Vuong, T.D.; Murphy, M. Genetic variants in root architecture-related genes in a Glycine soja accession, a potential resource to improve cultivated soybean. BMC Genom. 2015, 16, 132. [Google Scholar] [CrossRef] [PubMed]
- Van Nguyen, L.; Takahashi, R.; Githiri, S.M.; Rodriguez, T.O.; Tsutsumi, N.; Kajihara, S.; Sayama, T.; Ishimoto, M.; Harada, K.; Suematsu, K. Mapping quantitative trait loci for root development under hypoxia conditions in soybean (Glycine max L. Merr.). Theor. Appl. Genet. 2017, 130, 743–755. [Google Scholar] [CrossRef] [PubMed]
- Guzman, P.S.; Diers, B.W.; Neece, D.J.; St. Martin, S.K.; LeRoy, A.R.; Grau, C.R.; Hughes, T.J.; Nelson, R.L. QTL associated with yield in three backcross-derived populations of soybean. Crop Sci. 2007, 47, 111–122. [Google Scholar] [CrossRef]
- Du, W.; Wang, M.; Fu, S.; Yu, D. Mapping QTLs for seed yield and drought susceptibility index in soybean (Glycine max L.) across different environments. J. Genet. Genom. 2009, 36, 721–731. [Google Scholar] [CrossRef]
- Orf, J.H.; Chase, K.; Adler, F.R.; Mansur, L.M.; Lark, K.G. Genetics of soybean agronomic traits: II. Interactions between yield quantitative trait loci in soybean. Crop Sci. 1999, 39, 1652–1657. [Google Scholar] [CrossRef]
- Prince, S.J.; Murphy, M.; Mutava, R.N.; Zhang, Z.; Nguyen, N.; Kim, Y.H.; Pathan, S.M.; Shannon, G.J.; Valliyodan, B.; Nguyen, H.T. Evaluation of high yielding soybean germplasm under water limitation. J. Integr. Plant Biol. 2016, 58, 475–491. [Google Scholar] [CrossRef] [PubMed]
- Liu, B.; Fujita, T.; Yan, Z.-H.; Sakamoto, S.; Xu, D.; Abe, J. QTL mapping of domestication-related traits in soybean (Glycine max). Ann. Bot. 2007, 100, 1027–1038. [Google Scholar] [CrossRef] [PubMed]
- Ying, L.; Junyi, G.; Huineng, L. Identification of rhizosphere abiotic stress tolerance and related root traits in soybean (Glycine max L. Merr.). Acta Agron. Sin. 2005, 31, 1132–1137. [Google Scholar]
- Shouping, Y.; Jiamin, C.; Xiaohong, H.; Deyue, Y.; Junyi, G. Inheritance of drought tolerance and root traits of seedling in soybeans. Soybean Sci. 2005, 24, 275–280. [Google Scholar]
- Ju, C.; Zhang, W.; Liu, Y.; Gao, Y.; Wang, X.; Yan, J.; Yang, X.; Li, J. Genetic analysis of seedling root traits reveals the association of root trait with other agronomic traits in maize. BMC Plant Biol. 2018, 18, 171. [Google Scholar] [CrossRef] [PubMed]
- Meijón, M.; Satbhai, S.B.; Tsuchimatsu, T.; Busch, W. Genome-wide association study using cellular traits identifies a new regulator of root development in Arabidopsis. Nat. Genet. 2014, 46, 77–81. [Google Scholar] [CrossRef]
- Lyu, J.; Zhang, S.; Dong, Y.; He, W.; Zhang, J.; Deng, X.; Zhang, Y.; Li, X.; Li, B.; Huang, W. Analysis of elite variety tag SNPs reveals an important allele in upland rice. Nat. Commun. 2013, 4, 2138. [Google Scholar] [CrossRef] [PubMed]
- De Lorenzo, L.; Merchan, F.; Laporte, P.; Thompson, R.; Clarke, J.; Sousa, C.; Crespi, M. A novel plant leucine-rich repeat receptor kinase regulates the response of Medicago truncatula roots to salt stress. Plant Cell 2009, 21, 668–680. [Google Scholar] [CrossRef] [PubMed]
- Robert, H.S.; Offringa, R. Regulation of auxin transport polarity by AGC kinases. Curr. Opin. Plant Biol. 2008, 11, 495–502. [Google Scholar] [CrossRef] [PubMed]
- Benjamins, R.; Quint, A.B.; Weijers, D.; Hooykaas, P.; Offringa, R. The PINOID protein kinase regulates organ development in Arabidopsis by enhancing polar auxin transport. Development 2001, 128, 4057–4067. [Google Scholar] [CrossRef] [PubMed]
- Shiraku, M.L.; Magwanga, R.O.; Cai, X.; Kirungu, J.N.; Xu, Y.; Mehari, T.G.; Hou, Y.; Wang, Y.; Wang, K.; Peng, R. Knockdown of 60S ribosomal protein L14-2 reveals their potential regulatory roles to enhance drought and salt tolerance in cotton. J. Cotton Res. 2021, 4, 27. [Google Scholar] [CrossRef]
- Feng, Z.-J.; Liu, N.; Zhang, G.-W.; Niu, F.-G.; Xu, S.-C.; Gong, Y.-M. Investigation of the AQP family in soybean and the promoter activity of TIP2; 6 in heat stress and hormone responses. Int. J. Mol. Sci. 2019, 20, 262. [Google Scholar] [CrossRef] [PubMed]
- Alexandersson, E.; Fraysse, L.; Sjövall-Larsen, S.; Gustavsson, S.; Fellert, M.; Karlsson, M.; Johanson, U.; Kjellbom, P. Whole gene family expression and drought stress regulation of aquaporins. Plant Mol. Biol. 2005, 59, 469–484. [Google Scholar] [CrossRef] [PubMed]
- Kim, S.-H.; Tayade, R.; Kang, B.-H.; Hahn, B.-S.; Ha, B.-K.; Kim, Y.-H. Genome-Wide Association Studies of Seven Root Traits in Soybean (Glycine max L.) Landraces. Int. J. Mol. Sci. 2023, 24, 873. [Google Scholar] [CrossRef] [PubMed]
- Meng, L.; Li, H.; Zhang, L.; Wang, J. QTL IciMapping: Integrated software for genetic linkage map construction and quantitative trait locus mapping in biparental populations. Crop J. 2015, 3, 269–283. [Google Scholar] [CrossRef]
- Kosambi, D.D. The estimation of map distances from recombination values. In DD Kosambi: Selected Works in Mathematics and Statistics; Ramaswamy, R., Ed.; Springer: New Delhi, India, 2016; pp. 125–130. [Google Scholar]
- Voorrips, R.E. MapChart: Software for the graphical presentation of linkage maps and QTLs. J. Hered. 2002, 93, 77–78. [Google Scholar] [CrossRef] [PubMed]
- Lodhi, M.A.; Ye, G.-N.; Weeden, N.F.; Reisch, B.I. A simple and efficient method for DNA extraction from grapevine cultivars and Vitis species. Plant Mol. Biol. Rep. 1994, 12, 6–13. [Google Scholar] [CrossRef]
- Wang, S. Windows QTL Cartographer 2.5. 2006. Available online: https://brcwebportal.cos.ncsu.edu/qtlcart/WQTLCart.htm (accessed on 22 April 2024).
- Goodstein, D.M.; Shu, S.; Howson, R.; Neupane, R.; Hayes, R.D.; Fazo, J.; Mitros, T.; Dirks, W.; Hellsten, U.; Putnam, N. Phytozome: A comparative platform for green plant genomics. Nucleic Acids Res. 2012, 40, D1178–D1186. [Google Scholar] [CrossRef] [PubMed]
- Zeng, S.; Škrabišová, M.; Lyu, Z.; Chan, Y.O.; Dietz, N.; Bilyeu, K.; Joshi, T. Application of SNPViz v2.0 using next-generation sequencing data sets in the discovery of potential causative mutations in candidate genes associated with phenotypes. Int. J. Data Min. Bioinform. 2021, 25, 65–85. [Google Scholar] [CrossRef]
- Yu, Y.; Zhang, H.; Long, Y.; Shu, Y.; Zhai, J. Plant public RNA-seq database: A comprehensive online database for expression analysis of ~45000 plant public RNA-seq libraries. Plant Biotechnol. J. 2022, 20, 806. [Google Scholar] [CrossRef] [PubMed]
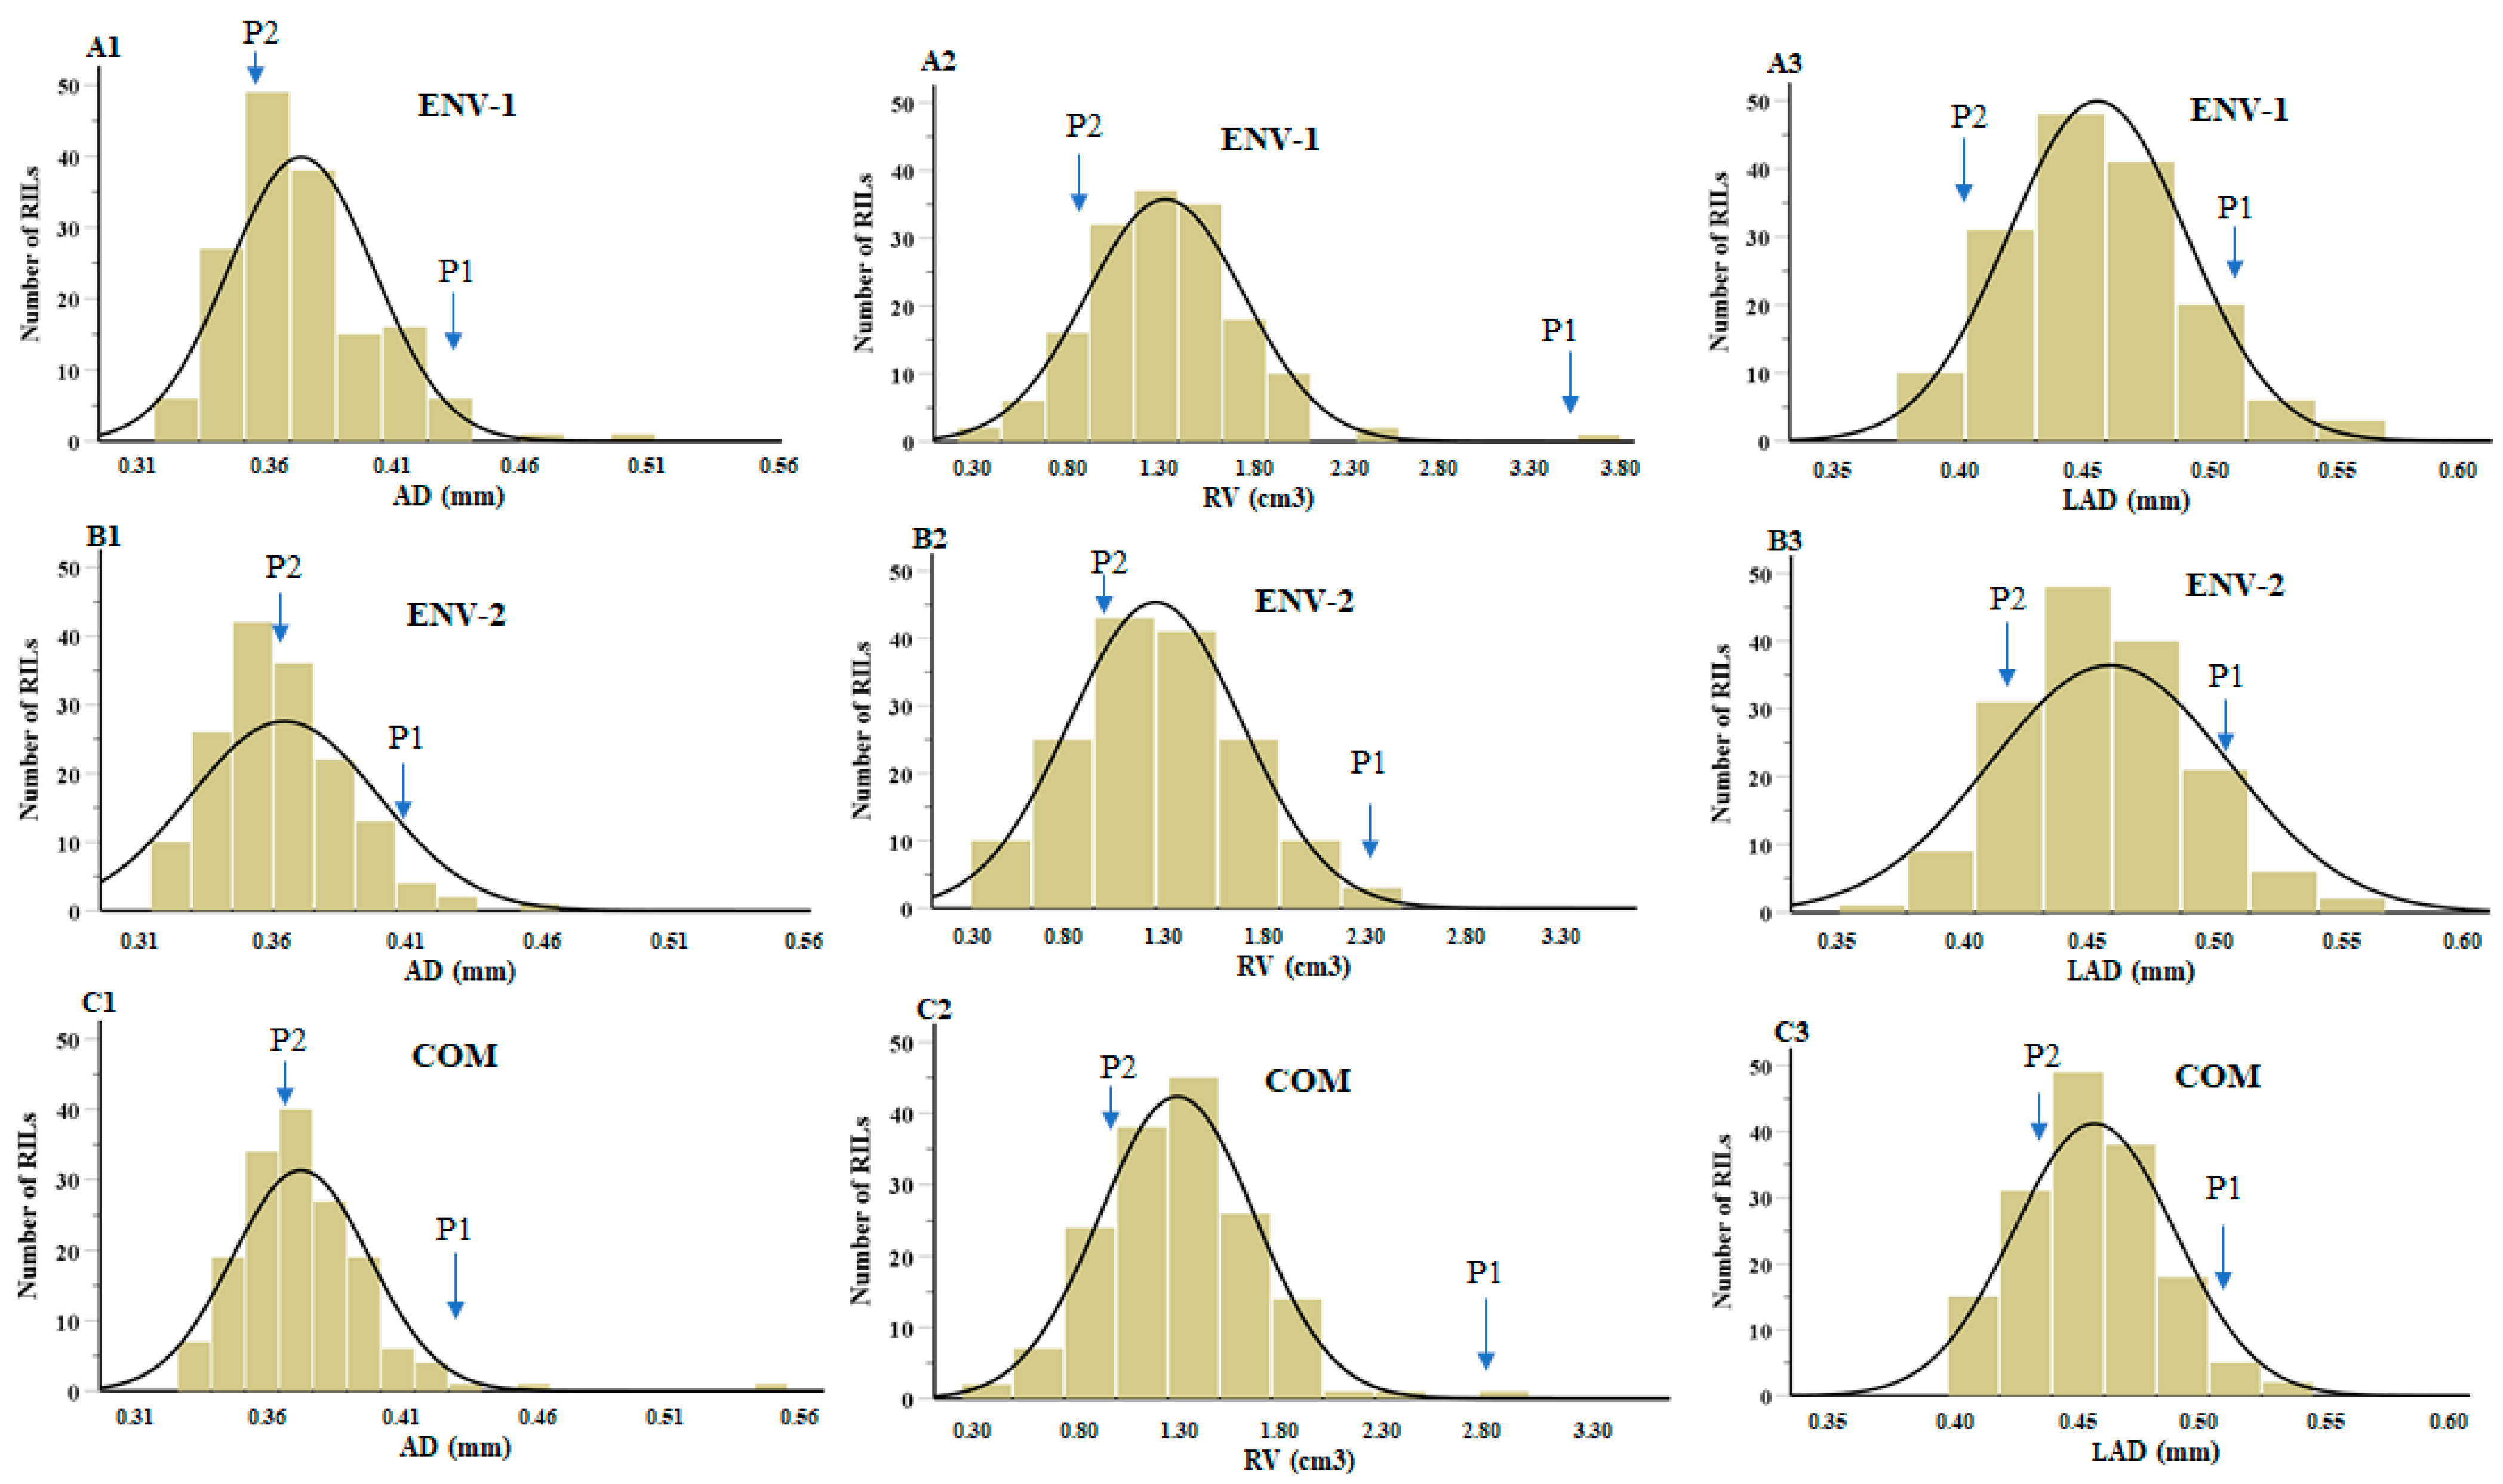


| Traits | Parents | RIL Population | Range | CV | SD | Skewness | Kurtosis | |||
|---|---|---|---|---|---|---|---|---|---|---|
| William 82 | PI 366121 | Mean | Min | Max | ||||||
| ENV-1 | ||||||||||
| AD | 0.43 | 0.36 | 0.37 | 0.33 | 0.50 | 0.18 | 13.57 | 0.03 | 1.08 | 2.30 |
| RV | 3.54 | 1.10 | 1.34 | 0.28 | 3.54 | 3.27 | 31.10 | 0.42 | 0.88 | 4.32 |
| LAD | 0.53 | 0.44 | 0.45 | 0.38 | 0.57 | 0.19 | 13.78 | 0.03 | 0.52 | 0.20 |
| ENV-2 | ||||||||||
| AD | 0.41 | 0.37 | 0.36 | 0.31 | 0.68 | 0.37 | 11.56 | 0.03 | 4.64 | 3.18 |
| RV | 2.31 | 1.13 | 1.24 | 0.30 | 2.40 | 2.11 | 34.99 | 0.43 | 0.18 | −0.22 |
| LAD | 0.53 | 0.48 | 0.46 | 0.37 | 0.87 | 0.49 | 11.76 | 0.04 | 4.11 | 8.02 |
| COM | ||||||||||
| AD | 0.42 | 0.37 | 0.37 | 0.32 | 0.54 | 0.22 | 9.36 | 0.02 | 2.48 | 4.38 |
| RV | 2.93 | 1.11 | 1.30 | 0.29 | 2.93 | 2.63 | 28.89 | 0.37 | 0.53 | 1.81 |
| LAD | 0.53 | 0.46 | 0.46 | 0.40 | 0.69 | 0.34 | 12.28 | 0.03 | 2.36 | 4.40 |
| Source | AD | LAD | RV |
|---|---|---|---|
| GEN | 4.77 | 3.71 | 16.04 |
| p < 0.0001 | p < 0.0001 | p < 0.0001 | |
| ENV | 27.16 | 3.43 | 39.42 |
| <0.0001 | 0.065 | p < 0.0001 | |
| REP | 2.51 | 3.79 | 0.46 |
| 0.114 | 0.052 | 0.499 | |
| GEN*ENV | 2.97 | 2.26 | 4.84 |
| p < 0.0001 | p < 0.0001 | p < 0.0001 |
| Traits | AD | LAD | RV |
|---|---|---|---|
| AD | 0.97 | 0.55 | |
| p < 0.0001 | p < 0.0001 | ||
| LAD | 0.98 | 0.56 | |
| p < 0.0001 | p < 0.0001 | ||
| RV | 0.39 | 0.43 | |
| p < 0.0001 | p < 0.0001 |
| Trait | QTL Name | Chr. | Left and Right Markers | Position | LOD | R2 (%) | Add |
|---|---|---|---|---|---|---|---|
| AD_D2 | qAD-D2-2-1 | 2 | 02_7790424_A_G~51272051_C_A | 47.7 | 13.8 | 39.0 | −0.15 |
| RV_COM | qRV-COM-2-1 | 2 | 02_693740_A_G~971923_C_A | 289.6 | 2.9 | 6.9 | 0.10 |
| RV_D1 | qRV-D1-2-1 | 2 | 02_693740_A_G~971923_C_A | 289.6 | 2.8 | 6.5 | 0.11 |
| AD_D2 | qAD-D2-3-1 | 3 | 03_829023_G_T~3365988_T_G | 244.8 | 17.2 | 39.1 | 0.15 |
| LAD_D2 | qLAD-D2-3-1 | 3 | 03_829023_G_T~3365988_T_G | 244.8 | 14.9 | 36.2 | 0.19 |
| LAD_COM | qLAD-COM-3-1 | 3 | 03_829023_G_T~3365988_T_G | 244.8 | 6.4 | 20.9 | 0.07 |
| AD_COM | qAD-COM-3-1 | 3 | 03_829023_G_T~3365988_T_G | 244.8 | 5.9 | 21.2 | 0.04 |
| RV_D1 | qRV-D1-3-1 | 3 | 03_829023_G_T~3365988_T_G | 244.8 | 4.4 | 16.5 | 0.78 |
| AD_D1 | qAD-D1-3-1 | 3 | 03_829023_G_T~3365988_T_G | 240.8 | 2.7 | 27.2 | 0.02 |
| RV_D2 | qRV-D2-3-1 | 3 | 03_829023_G_T~1209205_G_T | 200.0 | 2.6 | 6.9 | −0.12 |
| AD_D2 | qAD-D2-4-1 | 4 | 04_6949955_C_A~42153936_T_C | 92.0 | 12.4 | 39.0 | −0.15 |
| LAD_COM | qLAD-COM-4-1 | 4 | 04_7533370_A_G~9713316_G_A | 95.4 | 5.9 | 24.4 | −0.10 |
| AD_COM | qAD-COM-4-1 | 4 | 04_43645980_A_C~9713316_G_A | 93.4 | 3.1 | 14.5 | −0.04 |
| RV_D2 | qRV-D2-4-1 | 4 | 04_622489_A_G~1126451_A_G | 223.8 | 2.8 | 7.3 | 0.12 |
| AD_D2 | qAD-D2-8-1 | 8 | 08_9970013_G_T~17529249_G_T | 72.0 | 17.4 | 39.0 | −0.15 |
| LAD_D2 | qLAD-D2-8-1 | 8 | 08_9970013_G_T~17529249_G_T | 72.0 | 15.0 | 36.1 | −0.19 |
| LAD_COM | qLAD-COM-8-1 | 8 | 08_9970013_G_T~17529249_G_T | 72.0 | 7.0 | 24.4 | −0.10 |
| AD_COM | qAD-COM-8-1 | 8 | 08_41798055_A_G~10330658_A_C | 69.5 | 6.4 | 22.6 | −0.08 |
| RV_D2 | qRV-D2-10-1 | 10 | 10_43840376_T_C~44574663_C_T | 95.1 | 2.7 | 6.3 | 0.11 |
| AD_D2 | qAD-D2-12-1 | 12 | 12_6195964_C_T~688182_T_G | 264.7 | 3.6 | 19.6 | −0.04 |
| AD_D2 | qAD-D2-13-1 | 13 | 13_27527083_G_T~42337548_A_C | 24.7 | 16.2 | 39.0 | −0.15 |
| LAD_D2 | qLAD-D2-13-1 | 13 | 13_27527083_G_T~42337548_A_C | 24.7 | 13.9 | 36.1 | −0.19 |
| LAD_COM | qLAD-COM-13-1 | 13 | 13_27527083_G_T~42337548_A_C | 22.7 | 4.5 | 17.5 | −0.06 |
| AD_COM | qAD-COM-13-1 | 13 | 13_27527083_G_T~42337548_A_C | 22.7 | 3.0 | 14.5 | −0.04 |
| RV_D2 | qRV-D2-13-1 | 13 | 13_42337548_A_C~43496306_A_G | 40.0 | 2.9 | 8.3 | 0.15 |
| LAD_COM | qLAD-COM-15-1 | 15 | 15_50864537_A_G~14712034_G_T | 179.6 | 6.4 | 24.4 | −0.10 |
| AD_D2 | qAD-D2-17-1 | 17 | 17_910402_T_G~7756014_C_T | 3.3 | 13.2 | 39.0 | −0.15 |
| LAD_COM | qLAD-COM-17-1 | 17 | 17_8449684_G_A~7794179_A_G | 0.3 | 3.3 | 17.5 | −0.06 |
| RV_COM | qRV-COM-17-1 | 17 | 17_4967175_G_A~8109237_A_C | 130.3 | 2.6 | 5.7 | 0.09 |
| RV_D1 | qRV-D1-17-1 | 17 | 17_4967175_G_A~8109237_A_C | 130.3 | 2.6 | 5.5 | 0.11 |
| LAD_D1 | qLAD-D1-18-1 | 18 | 18_61963157_A_G~62036271_A_G | 0.0 | 4.6 | 11.0 | −0.02 |
| LAD_D1 | qLAD-D1-18-2 | 18 | 18_52751146_G_A~53762458_A_G | 64.2 | 4.5 | 10.8 | 0.01 |
| AD_D1 | qAD-D1-18-1 | 18 | 18_52751146_G_A~53762458_A_G | 64.2 | 3.7 | 9.1 | 0.01 |
| LAD_COM | qLAD-COM-18-1 | 18 | 18_52751146_G_A~53762458_A_G | 64.2 | 3.4 | 8.4 | 0.01 |
| AD_COM | qAD-COM-18-1 | 18 | 18_52751146_G_A~53762458_A_G | 64.2 | 3.3 | 7.8 | 0.01 |
| AD_D2 | qAD-D2-19-1 | 19 | 19_42673649_A_C~50184509_A_G | 85.7 | 18.7 | 39.0 | −0.15 |
| LAD_D2 | qLAD-D2-19-1 | 19 | 19_42673649_A_C~50184509_A_G | 85.7 | 16.4 | 36.1 | −0.19 |
| LAD_COM | qLAD-COM-19-1 | 19 | 19_42673649_A_C~50184509_A_G | 85.7 | 8.4 | 24.4 | −0.10 |
| AD_COM | qAD-COM-19-1 | 19 | 19_42673649_A_C~50184509_A_G | 85.7 | 7.6 | 22.6 | −0.08 |
| LAD_D2 | qLAD-D2-20-1 | 20 | 20_26500747_G_A~43146832_A_G | 7.2 | 12.0 | 36.1 | −0.19 |
| LAD_COM | qLAD-COM-20-1 | 20 | 20_32603292_A_G~38578470_T_C | 4.0 | 5.1 | 17.5 | −0.06 |
| AD_COM | qAD-COM-20-1 | 20 | 20_32603292_A_G~38578470_T_C | 4.0 | 3.7 | 14.6 | −0.04 |
| SNP Position | Gene Name | Ref. | Alt. | Mutation | Start | End | Strand |
|---|---|---|---|---|---|---|---|
| Chr03:832559 | Glyma.03G008600 | G | A | Splice region variant | 830,451 | 838,408 | − |
| Chr03:1393538 | Glyma.03G013700 | G | T | Missense variant | 1,393,484 | 1,393,734 | + |
| Chr03:1452530 | Glyma.03G014500 | C | T | Missense variant | 1,452,354 | 1,452,677 | − |
| Chr03:2061229 | Glyma.03G020100 | A | C | Missense variant | 2,057,797 | 2,063,029 | − |
| Chr03:2164039 | Glyma.03G021100 | C | T | Splice region variant | 2,162,406 | 2,167,712 | + |
| Chr03:2413616 | Glyma.03G022900 | C | T | Missense variant | 2,413,172 | 2,413,671 | − |
| Chr03:2998840 | Glyma.03G027200 | A | G | Missense variant | 2,997,332 | 2,999,026 | + |
| Chr03:3010747 | Glyma.03G027400 | C | T | Missense variant | 3,010,213 | 3,018,498 | − |
| Chr03:3024508 | Glyma.03G027500 | G | A | Missense variant | 3,024,204 | 3,024,656 | − |
| Chr03:3029835 | Glyma.03G027600 | A | G | Splice region variant | 3,029,154 | 3,033,239 | − |
| Chr03:3038816 | Glyma.03G027800 | T | C | Missense variant | 3,038,542 | 3,039,018 | − |
| Chr03:3072041 | Glyma.03G028000 | G | C | Missense variant | 3,071,857 | 3,072,066 | − |
| Chr03:3109886 | Glyma.03G028400 | T | C | Missense variant | 3,107,378 | 3,110,786 | + |
| Chr03:3128983 | Glyma.03G028700 | A | G | Missense variant | 3,128,776 | 3,130,648 | + |
| Chr03:3178665 | Glyma.03G029100 | G | C | Missense variant | 3,178,307 | 3,182,074 | + |
| Chr13:28182349 | Glyma.13G167100 | T | A | Missense variant | 28,182,121 | 28,182,399 | + |
| Chr13:28303515 | Glyma.13G168600 | G | A | Missense variant | 28,298,272 | 28,304,199 | − |
| Chr13:28305241 | Glyma.13G168700 | C | T | Splice donor variant | 28,305,098 | 28,310,222 | + |
| Chr13:28645128 | Glyma.13G172500 | C | T | Missense variant | 28,644,819 | 28,649,188 | − |
| Chr13:28672639 | Glyma.13G172700 | T | A | Missense variant | 28,671,831 | 28,675,231 | + |
| Chr13:28686299 | Glyma.13G172800 | G | C | Missense variant | 28,683,493 | 28,686,774 | + |
| Chr13:30403159 | Glyma.13G190400 | G | T | Missense variant | 30,402,029 | 30,409,606 | + |
| Chr13:33685460 | Glyma.13G224000 | T | A | Missense variant | 33,684,833 | 33,686,902 | + |
| Chr13:42523190 | Glyma.13G330600 | A | T | Missense variant | 42,523,075 | 42,523,280 | − |
| Chr13:42650050 | Glyma.13G331900 | A | G | Splice region variant | 42,648,871 | 42,650,712 | − |
| Chr13:42711332 | Glyma.13G333100 | G | A | Missense variant | 42,711,023 | 42,711,397 | + |
| Chr13:42797618 | Glyma.13G334200 | T | C | Missense variant | 42,794,878 | 42,801,645 | + |
| Chr13:43246090 | Glyma.13G340400 | G | A | Splice region variant | 43,244,791 | 43,246,867 | − |
| Chr13:43311794 | Glyma.13G341400 | C | A | Missense variant | 43,311,148 | 43,312,308 | + |
| Chr13:43326463 | Glyma.13G341500 | C | A | Missense variant | 43,325,404 | 43,326,510 | − |
| Chr13:43333456 | Glyma.13G341600 | T | C | Missense variant | 43,331,375 | 43,335,735 | − |
| Chr13:43447450 | Glyma.13G343000 | G | C | Missense variant | 43,447,390 | 43,451,125 | − |
| Final Candidate Gene | Gene Description | Start Position (Wm82.a2.v1) | End Position (Wm82.a2.v1) |
|---|---|---|---|
| Glyma.03G027500 | TRANSKETOLASE/GLYCO-ALDEHYDE TRANSFERASE | 3,024,204 | 3,024,656 |
| Glyma.03G014500 | DEHYDROGENASES WITH DIFFERENT SPECIFICATIONS | 1,452,354 | 1,452,677 |
| Glyma.13G331900 | 60S RIBOSOMAL PROTEIN L35 | 42,648,871 | 42,650,712 |
| Glyma.13G341400 | AGC KINASE FAMILY PROTEIN | 43,311,148 | 43,312,308 |
| Glyma.13G341500 | LEUCINE-RICH REPEAT RECEPTOR-LIKE PROTEIN KINASE | 43,325,404 | 43,326,510 |
| Glyma.13G333100 | AQUAPORIN TRANSPORTER | 42,711,023 | 42,711,397 |
Disclaimer/Publisher’s Note: The statements, opinions and data contained in all publications are solely those of the individual author(s) and contributor(s) and not of MDPI and/or the editor(s). MDPI and/or the editor(s) disclaim responsibility for any injury to people or property resulting from any ideas, methods, instructions or products referred to in the content. |
© 2024 by the authors. Licensee MDPI, Basel, Switzerland. This article is an open access article distributed under the terms and conditions of the Creative Commons Attribution (CC BY) license (https://creativecommons.org/licenses/by/4.0/).
Share and Cite
Islam, M.S.; Ghimire, A.; Lay, L.; Khan, W.; Lee, J.-D.; Song, Q.; Jo, H.; Kim, Y. Identification of Quantitative Trait Loci Controlling Root Morphological Traits in an Interspecific Soybean Population Using 2D Imagery Data. Int. J. Mol. Sci. 2024, 25, 4687. https://doi.org/10.3390/ijms25094687
Islam MS, Ghimire A, Lay L, Khan W, Lee J-D, Song Q, Jo H, Kim Y. Identification of Quantitative Trait Loci Controlling Root Morphological Traits in an Interspecific Soybean Population Using 2D Imagery Data. International Journal of Molecular Sciences. 2024; 25(9):4687. https://doi.org/10.3390/ijms25094687
Chicago/Turabian StyleIslam, Mohammad Shafiqul, Amit Ghimire, Liny Lay, Waleed Khan, Jeong-Dong Lee, Qijian Song, Hyun Jo, and Yoonha Kim. 2024. "Identification of Quantitative Trait Loci Controlling Root Morphological Traits in an Interspecific Soybean Population Using 2D Imagery Data" International Journal of Molecular Sciences 25, no. 9: 4687. https://doi.org/10.3390/ijms25094687
APA StyleIslam, M. S., Ghimire, A., Lay, L., Khan, W., Lee, J.-D., Song, Q., Jo, H., & Kim, Y. (2024). Identification of Quantitative Trait Loci Controlling Root Morphological Traits in an Interspecific Soybean Population Using 2D Imagery Data. International Journal of Molecular Sciences, 25(9), 4687. https://doi.org/10.3390/ijms25094687