Abstract
This study conducted phenotypic evaluations on a wheat F3 population derived from 155 F2 plants. Traits related to seed color, including chlorophyll a, chlorophyll b, carotenoid, anthocyanin, L*, a*, and b*, were assessed, revealing highly significant correlations among various traits. Genotyping using 81,587 SNP markers resulted in 3969 high-quality markers, revealing a genome-wide distribution with varying densities across chromosomes. A genome-wide association study using fixed and random model circulating probability unification (FarmCPU) and Bayesian-information and linkage-disequilibrium iteratively nested keyway (BLINK) identified 11 significant marker–trait associations (MTAs) associated with L*, a*, and b*, and chromosomal distribution patterns revealed predominant locations on chromosomes 2A, 2B, and 4B. A comprehensive annotation uncovered 69 genes within the genomic vicinity of each MTA, providing potential functional insights. Gene expression analysis during seed development identified greater than 2-fold increases or decreases in expression in colored wheat for 16 of 69 genes. Among these, eight genes, including transcription factors and genes related to flavonoid and ubiquitination pathways, exhibited distinct expression patterns during seed development, providing further approaches for exploring seed coloration. This comprehensive exploration expands our understanding of the genetic basis of seed color and paves the way for informed discussions on the molecular intricacies contributing to this phenotypic trait.
1. Introduction
Since its domestication approximately 10,000 years ago, wheat (Triticum aestivum L.) has become a cornerstone of global food security, contributing significantly to meeting the dietary needs of the global population. Its widespread cultivation and consumption have established wheat as a primary source of calories and protein, providing sustenance for a substantial portion of the global population [1]. This unique variation in wheat both adds to its nutritional profile and holds promise for enhancing the overall dietary diversity and health benefits available to consumers [2]. Wheat provides important nutrients and compounds such as anthocyanins, carotenes, and phenolic acids, which have strong antioxidant effects [3]. Colored wheat, with its anthocyanin content, has a powerful ability to combat chronic diseases such as obesity, cancer, and cardiovascular issues, and it can even slow aging [4]. In contrast to common wheat, the red color of which arises from carotenoids and catechol in the outer layer, the color of colored wheat is mainly attributable to anthocyanins. Colored wheat also contains many tocopherols, phenolic acids, and essential trace elements needed for the human body [5,6].
The transformative impact of single nucleotide polymorphism genotyping arrays (SNP arrays) extends beyond their pivotal role in exploring genetic variations in both animal and plant populations [7,8]. By facilitating the identification and analysis of hundreds of thousands of SNPs in a single assay, these arrays serve as a robust platform for unveiling genome-wide sequence variability among individuals and populations [9]. SNP arrays provide a high-throughput and cost-effective method for analyzing genetic diversity, and they have been extensively employed in constructing genetic linkage maps, exploring evolutionary relationships, unraveling functional genomics, and supporting conservation efforts. Genotyping arrays have played, and continue to play, a critical role in the genotyping of various crop species. Consequently, the common study of SNPs often identifies loci that are blocks of correlated SNPs associated with the trait of interest [10].
In recent decades, high-density SNP genotyping arrays such as Illumina Wheat 9K, 90K, 15K, Axiom® Wheat 660K, Wheat 55K, Axiom® HD Wheat (820K), Wheat Breeders’ 35K Axiom, and Wheat 50K Triticum TraitBreed arrays have been developed for marker-assisted breeding in common wheat [11,12,13,14,15,16]. This technology facilitates the rapid genotyping of wheat varieties, precise identification of genetic variants linked to crucial traits, and marker development for easy integration into breeding programs. High-density genotyping arrays significantly increase researchers’ ability to study many wheat samples, making it easier to identify genetic variations and advanced wheat breeding techniques.
In this study, we used the F3 population of both colored and noncolored wheat lines to identify loci associated with seed color using the comprehensive Illumina Wheat 90 K SNP array. In addition, we explored the mechanisms governing changes in seed color through a comparative analysis of RNA sequences during the seed developmental stages of colored and noncolored wheat. By integrating the results of genome-wide association studies (GWASs) and RNA sequencing (RNA-Seq), we unraveled the changes in expression in differentially expressed genes (DEGs) located near quantitative trait loci that regulate seed color. This collaborative approach sought to enhance our understanding of the complex mechanisms governing seed coloration in wheat, with GWASs providing valuable insights into genetic associations, complemented by a detailed exploration of gene expression patterns through RNA-Seq. In addition, the findings from this study offer novel insights into potential candidate genes influencing wheat seed coloration, particularly during the critical seed filling and maturity stages.
2. Results
2.1. Phenotypic Evaluations
Images of the F3 seeds are presented in Figure 1. Of the initial 214 individuals in the F3 segregated population, some seeds, including damaged or broken ones, were excluded, resulting in 155 F3 plants available for this study. This subset of 155 F3 plants was evaluated for traits related to seed color, encompassing chlorophyll a, chlorophyll b, carotenoid, anthocyanin, L*, a*, and b*. The distribution of the results from the phenotype evaluation is depicted in Figure 2A–G, and essential summary statistics, including range, mean, and coefficient of variation, are presented in Table S2.
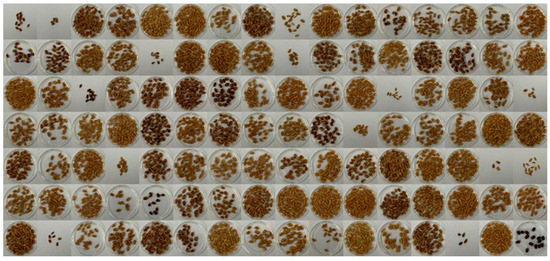
Figure 1.
F3 population seed images. The figure displays seed images representative of the F3 population used in this experiment showing the observed variation in seed color. The F3 population originated from a crossbreeding of recombinant inbred lines (RILs) with distinct seed coat phenotypes, namely, yellow (accession no. 10DS1673, sourced from the Korea University Wheat Subgene bank) and deep purple (accession no. 10DS1674). The intentional inclusion of RILs with diverse seed coat phenotypes contributed to the generation of a genetically heterogeneous population, facilitating the exploration of seed color-related traits in subsequent analyses.
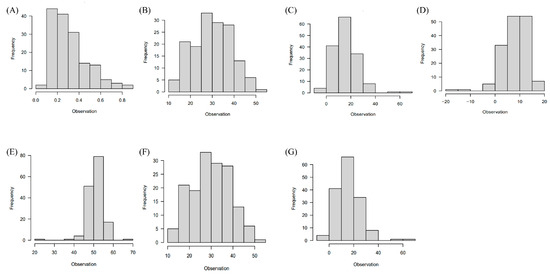
Figure 2.
Phenotypic trait distribution. (A–G) Histograms illustrating the distribution of phenotypic traits in the F3 population, including (A) anthocyanin, (B) chlorophyll a, (C) chlorophyll b, (D) carotenoid, (E) L*, (F) a*, and (G) b*.
Pearson’s correlation coefficient (r) estimated between the traits in the F3 population is presented in Figure S1. The associations were positive and highly significant (all p < 0.01) among carotenoid, chlorophyll a, and anthocyanin; L* and carotenoid; a* and L*; b* and carotenoid; and L* and a*. By contrast, strong negative correlations were detected between carotenoid and chlorophyll b, L* and anthocyanin, and b* and anthocyanin (all p < 0.01) in the F3 population (Figure S1).
2.2. Phenotypic Evaluation of Marker Distribution, Population Structure, and Linkage-Disequilibrium (LD) Decay
Of the 81,587 SNP markers initially present on the wheat 90K iSelect array for genotyping, 3969 high-quality SNP markers remained after eliminating those with minor allele frequencies <0.05 and missing data >10%. The selected SNP markers exhibited a genome-wide distribution, with the highest number on the A subgenome (2500), followed by the B (1249) and D (218) subgenomes. An analysis of their chromosome-wide distributions revealed the highest marker density on chromosome 2A (653), followed by chromosomes 1A (591) and 2B (315). Conversely, chromosomes 5D (11) and 7D (20) contained the fewest markers (Table S3).
The population structure of the 155 wheat genotypes was examined using the ΔK method and validated using principal component analysis (PCA). The ΔK method and PCA-based population structure analysis identified three distinct groups in the GWAS results (Figure 3A,B). LD decay was estimated by calculating r2 for all 3969 markers. Genome-wide LD decayed with genetic distance, and LD decayed by 50% at 134 Mb for the entire genome (Figure 3C).
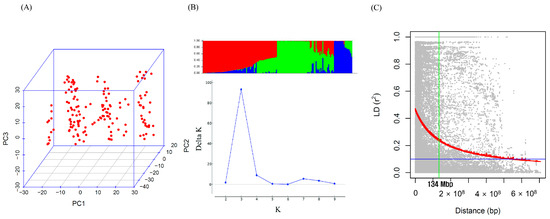
Figure 3.
Genotype analysis and linkage-disequilibrium (LD) decay. (A) Principal component analysis of 155 genotypes using 3969 single nucleotide polymorphisms provides insights into the genetic relationships among individuals. (B) Population structure analysis with three clusters reveals distinct subgroups within the 155 genotypes, enhancing our understanding of the genetic diversity of the population. (C) The LD decay plot depicts the genome-wide decay of LD with genetic distance. The region in which LD decays to half is highlighted in green, and 50% decay occurred at 134 Mb across the genome.
2.3. GWASs
The significant MTAs for the seven phenotypic traits were identified by scrutinizing Q–Q and Manhattan plots in GWAS using FarmCPU and BLINK (Figure 4A–E). The application of a stringent threshold (−log10P > 5) served as a robust criterion for designating MTAs as significant in the GWAS. The analysis revealed eleven MTAs, including three from FarmCPU and eight from BLINK (Table 1). All 11 MTAs originated from BLINK (L*, a*, and b*) and FarmCPU (L* and a*). Notably, some MTAs were detected by multiple methods, such as BS00067992_51 (detected in FarmCPU L* and BLINK), Ra_c13247_528 (detected in BLINK L* and a*), and RAC875_rep_c105150_1024 (duplicated in FarmCPU a* and BLINK a*). The phenotypic variation explained (PVE) by these SNPs ranged between 0.17% and 86.08%. In BLINK (a*), the SNP with the lowest PVE was Ra_c13247_528 (0.17%). Interestingly, these specific SNPs were also detected by BLINK (L*), albeit with a significantly higher PVE of 19.64%. In addition, the analysis of the chromosomal distribution of MTAs revealed distinct patterns, with the majority being located on chromosomes 2A, 2B, and 4B. Specifically, six MTAs were identified on chromosome 2A, whereas chromosomes 2B and 4B each harbored one MTA (Table 1).
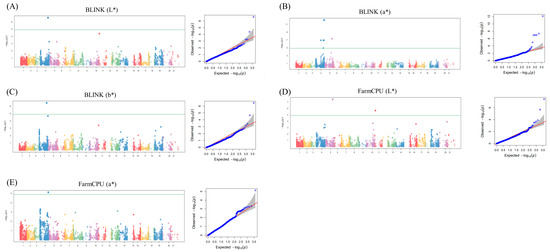
Figure 4.
Manhattan and Q–Q plots for significant MTAs. (A) Manhattan and Q–Q plots for BLINK (L*) analysis, illustrating genomic regions with significant associations with the L* trait in wheat. (B) Manhattan and Q–Q plots for BLINK (a*), highlighting significant MTAs related to a* in the wheat genome. (C) Manhattan and Q–Q plots for BLINK (b*), revealing genomic loci significantly associated with b* in wheat. (D) Manhattan and Q–Q plots for FarmCPU (L*), displaying genomic regions with noteworthy associations with the L* trait using FarmCPU. (E) Manhattan and Q–Q plots for FarmCPU (a*), presenting significant MTAs related to a* in wheat through FarmCPU.

Table 1.
Marker–trait associations detected for L*, a*, and b*.
Three SNPs, namely, RAC875_c37638_233, Ra_c13247_528, and Tdurum_contig5114_319, are illustrated in Figure 5, and these SNPs originated from FarmCPU (L*), BLINK (L*), BLINK (a*), and BLINK (b*) (note: BLINK (L*) and BLINK (a*) denote duplicated MTAs). RAC875_c37638_233, positioned on chromosome 4B with a PVE of 6.00% from FarmCPU (L*), exhibited A and G alleles and significantly different mean phenotypic values of L* across genotypes (AA, AG, GG; Figure 4A,D). Meanwhile, Ra_c13247_528 b, located on chromosome 2A with PVEs of 0.18% and 19.94% from BLINK (a*) and BLINK (L*), respectively, displayed C and T alleles with significantly different mean phenotypic values of L* across genotypes (CC, CT, TT). In addition, Tdurum_contig5114_319, situated on chromosome 2A with a PVE of 18.96% from BLINK (b*), displayed significant differences among genotypes (CC, CT, TT).
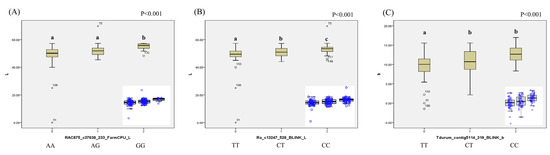
Figure 5.
Box plots of allelic differences of significant MTAs. (A) Allelic differences for the significant MTAs identified via FarmCPU analysis for L* in wheat. (B) Allelic differences for significant MTAs identified via BLINK analysis for L* in wheat. (C) Allelic differences for significant MTAs identified via BLINK analysis for b* in wheat. Statistical analysis was performed using ANOVA followed by Duncan’s post hoc analysis (p < 0.001) to assess significant differences in mean phenotypic values among genotypes with different allelic variants. Different letters indicate statistically significant differences and the blue circles represent the distribution of lines based on alleic differencesMTA, marker–trait association; BLINK, Bayesian-information and linkage-disequilibrium iteratively nested keyway; FarmCPU, fixed and random model circulating probability unification.
2.4. Gene Expression Analysis during Seed Development in the Vicinity of MTAs
To gain deeper insights into the genomic context of these MTAs, a comprehensive annotation was conducted using IWGSC Wheat RefSeq v1.1. This annotation effort uncovered a noteworthy discovery. Specifically, 69 genes were identified within the genomic vicinity of each significant MTA locus (Table S4). These genes, positioned within a 250 kb radius of the MTAs, present a rich source for further exploration and potential functional implications related to the observed phenotypic traits. Based on the RNA-Seq data, 16 of 69 genes displayed a greater than 2-fold difference in gene expression between colored and noncolored wheat during seed developmental stages (10 DAF, 20 DAF, and 30 DAF; Figure 6A,B). Two genes (TraesCS2A02G424200, and TraesCS2A02G424600) were found in close proximity to the MTA associated with L*, whereas five genes (TraesCS2A02G532800, TraesCS2A02G436300, TraesCS2A02G436800, TraesCS2A02G436200, and TraesCS2A02G435800) were located near the MTA linked to a*. In addition, two genes (TraesCS2A02G409400 and TraesCS2A02G409600) on chromosome 2A were near the MTA related to b*. All these genes were identified via BLINK analysis (Table 2). Two genes on chromosome 4A (TraesCS4B02G070800 and TraesCS4B02G071000) and four genes on chromosome 2A (TraesCS2A02G551200, TraesCS2A02G551900, TraesCS2A02G551700, and TraesCS2A02G552400) were found to be closely associated with L* and a*, as identified via FarmCPU analysis. The expression patterns of all 16 genes during the seed developmental stages are illustrated in Figure 6B. Among them, eight genes, categorized as transcription factors, flavonoid pathway-related genes, and ubiquitination pathway genes, were selected, and their expression patterns are depicted in Figure 6C. To assess the reliability of the RNA-Seq results, RT-qPCR was employed to validate the expression profiles of selected genes, including anthocyanin regulatory R-S protein (MYC protein, TaesCS2A02G409600), MYB transcription factor (TraesCS2A02G552400), bHLH transcription factor (TraesCS2A02G409400), cinnamoyl-CoA reductase (CCR, TraesCS4B02G071000), cinnamyl alcohol dehydrogenase (CAD, TraesCS4B02G071000), and F-box protein (TraesCS2A02G551700). The RT-qPCR results were consistent with the RNA-Seq findings, confirming the concordance between the two independent methods. These genes were specifically chosen from the MYB–bHLH–WD40 (MBW) complex, lignin pathway, and E3 ubiquitin ligase categories (Figure 6C) for comprehensive validation, and the congruence of the results further strengthens the robustness of our findings (Figure 7).
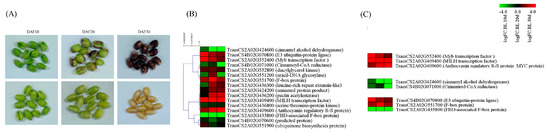
Figure 6.
RNA sequencing results and DEGs positioned within a 250 kb radius of the MTAs. (A) Images of seed samples during seed developmental stages at 10 DAF, 20 DAF, and 30 DAF used for RNA sequencing. Heatmaps illustrating (B) sixteen genes displaying a greater than 2-fold difference in gene expression between colored and non-colored wheat during the seed developmental stage, and (C) DEGs involved in transcription factors, phenylpropanoid compounds, and E3 ubiquitin ligase.
Table 2.
Identification of genetic loci associated with phenotypic traits of wheat (Triticum aestivum L.) based on genome-wide association studies. BLINK, Bayesian-information and linkage-disequilibrium iteratively nested keyway; FarmCPU, fixed and random model circulating probability unification.
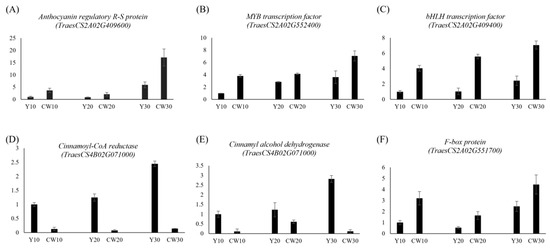
Figure 7.
Validation of RNA sequencing data using RT-qPCR analysis. (A) Expression patterns of anthocyanin regulatory R-S protein (MYC protein, TaesCS2A02G409600), (B) MYB transcription factor (TraesCS2A02G552400), (C) bHLH transcription factor (TraesCS2A02G409400), (D) cinnamoyl-CoA reductase (TraesCS4B02G071000), (E) cinnamyl alcohol dehydrogenase (TraesCS4B02G071000), and (F) F-box protein (TraesCS2A02G551700). Biological replicates were used in triplicate, and error bars indicate standard errors.
3. Discussion
In this study, we conducted a comprehensive examination of seven phenotypic traits within an F3 population derived from both colored and noncolored wheat using GWASs. The variability in the range of each phenotypic dataset was notable, including coefficients of variation surpassing 50% for chlorophyll b, carotenoid, and anthocyanin contents (59.22%, 51.77%, and 54.84%, respectively). This substantial variation likely influenced the outcomes, as evidenced by all 11 significant MTAs being associated with the phenotypic traits L*, a*, and b*. Considering these results, the observed high interrelation among L*, a*, and b* represents a noteworthy observation. This robust correlation indicates potential associations among these phenotypic traits, suggesting the possibility of shared genetic or biochemical pathways influencing seed color. The CIELAB color space, comprising the L*, a*, and b* channels, captures distinct aspects of color perception, such as lightness, the green–magenta spectrum, and the blue–yellow spectrum. These channels, reflecting specific color attributes, might hold associations with underlying biological factors [17]. In particular, an increase in anthocyanin content was negatively correlated with L* and b*, suggesting that as anthocyanin levels rise, seed brightness decreases, manifesting in a blue–yellow spectrum shifting toward the blue end.
The relationships among the genotypes were analyzed using two distinct methods as follows: subgrouping analysis based on population structure and PCA. Both analyses identified three consistent subgroups, affirming the reliability of the genotype analysis. LD decay over genetic or physical distance in a population influences the marker coverage density required for effective GWASs. More rapid LD decay implies the necessity of higher marker density to capture markers in close proximity to causal loci [17]. In this study, LD decayed to half of its maximum value at 134 Mb across the entire genome. Wheat, being a self-pollinating species with an extremely large genome, exhibits a larger LD decay distance than other plants, including maize [18,19]. Moreover, LD decay can vary among mapping populations of the same species, as observed in Chinese wheat landrace (5.98 Mb) and Mexican bread wheat (22.85 Mb) [20,21]. These variations are likely attributable to differences in cultivation practices, breeding methods, breeding history, and evolutionary history [22]. Additionally, the use of recombinant inbred lines (RILs) with distinct seed coat phenotypes, namely, noncolored wheat (yellow) and colored wheat (deep purple), in the development of the F3 population could be one reason for the observed higher LD decay distance.
In this study, BLINK and FarmCPU analyses identified eight MTAs associated with L*, a*, and b* traits. Furthermore, among the 69 genes near these eight MTAs, 16 exhibited significant expression patterns during seed developmental stages, and the corresponding expression patterns of these genes were also determined. Interestingly, the anthocyanin regulatory R-S protein (TraesCS2A02G409600), a MYC transcription factor with a basic helix–loop–helix motif, demonstrated continuous upregulation during seed development in colored wheat both in the results of RNA-Seq and RT-qPCR, underpinning its role as a key regulator of anthocyanin structural genes [23]. Moreover, the MYB transcription factor (TraesCS2A02G552400) and bHLH transcription factor (TraesCS2A02G409400) were also highly expressed during seed developmental stages in colored wheat. MBW protein complexes, which comprise MYB, bHLH, and WD40 repeat factors, are recognized as transcriptional regulators governing the production of secondary metabolites, including proanthocyanidins and anthocyanins [24]. These regulatory elements assemble into the ternary complex MBW, and this complex might utilize alternative MYB and bHLH components to regulate specific steps in the biosynthetic pathways of proanthocyanidins and anthocyanins [25,26].
Phenylpropanoid compounds, including flavonoids and lignin, consist of numerous secondary metabolites that are widely distributed in various tissues and organs of plants. The biosynthesis of lignin and flavonoids shares the early enzymatic steps of the phenylpropanoid pathway before diverging into the flavonoid and lignin pathways [27]. Shi et al. (2022) reported the mechanism underlying the homeostatic regulation of flavonoid and lignin biosynthesis in the phenylpropanoid pathway of plants [28]. In this study, CCR (TraesCS4B02G071000) and CAD (TraesCS2A02G424600), which are involved in specific steps of the monolignol pathway, were downregulated during seed developmental stages in colored wheat, as demonstrated by both RNA-Seq and RT-qPCR. Moreover, similar trends have been reported in Arabidopsis in which mutant lines deficient in CCR and CAD genes accumulate higher amounts of flavonol glycosides in the stem, indicating a redirection of the phenolic pathway [29].
The ubiquitin–proteasome system, which regulates selective protein degradation via the 26S proteasome, is a key mechanism for the post-translational regulation of gene expression and protein quality control in eukaryotes [30]. This system plays a pivotal role in governing signal transduction, metabolic processes, differentiation, cell cycle transitions, and stress responses by orchestrating the degradation of specific proteins [31,32]. Ubiquitin E3 ligases, which are conserved throughout eukaryotes, perform diverse regulatory functions by catalyzing the covalent attachment of ubiquitin to target proteins [33]. The Arabidopsis genome encodes more than 1500 E3 ubiquitin ligase proteins, which are categorized into various families such as the HECT, RING1, Kelch-type, U-box, and Cullin–RING ligase (CRL) families. Among these, the F-box protein operates as a component of the SKP1–Cullin–F-box complex within the CRL family of E3 ubiquitin ligases [34,35,36,37,38,39]. Three E3 ubiquitin-protein ligases (TraesCS4B02G070800, TraesCS2A02G551700, and TraesCS2A02G435800), including one RING E3 ubiquitin ligase and two F-box proteins, exhibited significant expression during seed developmental stages. In addition, validation via RT-qPCR analysis revealed that TraesCS2A02G551700 displayed increased expression in colored wheat during seed developmental stages. Although the specific roles of these E3 ligases in seed coloration remain elusive, further molecular investigations could reveal their functional associations with seed pigmentation. Subsequent research endeavors employing molecular biology approaches could help elucidate the intricate functions linking these E3 ligases to seed coloration.
4. Materials and Methods
4.1. Plant Materials
RILs with distinct seed coat phenotypes, namely, yellow (accession no. 10DS1673) and deep purple (accession no. 10DS1674) were obtained from Korea University Wheat Subgene Bank [40]. Crossbreeding between yellow and deep purple wheat lines resulted in the generation of F2 plants. F3 seeds from each of the 155 F2 plants were selected for use in this study, with three seeds selected from each plant. Seeds were germinated on moistened filter paper at room temperature for 24 h, followed by vernalization at 4 °C in a dark chamber for 4 weeks. Each seedling was then transferred to a Magenta box (6.5 × 6.5 × 20 cm3, Greenpia Technology Inc., Seoul, Republic of Korea) containing polypro mesh. Seedlings were grown in Magenta boxes filled with 180 mL of water for 14 days in the growth facility at 23 °C and a day/night photoperiod of 16 h/8 h.
4.2. Anthocyanin and Chlorophyll Content Analysis
For anthocyanin content, homogenized F3 wheat seeds were mixed with 1 mL of methanol–hydrochloric acid (1% HCl, w/v) and incubated at 4 °C for 24 h. The absorbance was measured at 530 and 657 nm using a UV/VIS spectrophotometer (Jenway, Keison Products, Chelmsford, UK) as described previously [41]. The anthocyanin content was determined using the formula Q = (A530 − 0.25A657) × M−1 (Q: anthocyanin yield; A530 and A657: absorption at the indicated wavelengths; M: mass of the plant). The leaves of each F3 plant were ground using liquid nitrogen, and 100 mg of the resulting powder was used for chlorophyll measurements. Chlorophyll content was determined following the method outlined by Hong et al. (2018) [41]. To determine the chlorophyll and carotenoid levels, samples of homogenized 14-day-old wheat seedlings were suspended in 100% acetone at 4 °C in the dark [42]. The homogenized samples were centrifuged at 12,000× g for 10 min, and the supernatant was used for pigment determination. The absorbance of the supernatant was recorded at 470, 644.8, and 661.6 nm using a UV/VIS spectrophotometer. The chlorophyll content was estimated using the extinction coefficients provided by Lichtenthaler (1987) [42].
4.3. Grain Color Determination
The color of wheat grains was determined using the L*, a*, and b* color scale with a ColorMate spectrophotometer (SCINCO, Seoul, Republic of Korea). Before the color measurement, the instrument was calibrated with standard black and white tiles. Each seed sample was placed in a Petri dish prior to reading the color parameters. The color L*, a*, and b* values were monitored and measured using embedded software (ColorMaster software 2017) in the device with three technical replicates.
4.4. Genotyping and SNP Calling
For the genotyping assay, leaves were sampled from each F3 population and stored at −80 °C until use. DNA was extracted from a single plant from each germplasm following the CTAB method outlined in the USDA instructor’s manual [43]. The extracted DNA was sent to the USDA-ARS Small Grain Genotyping Center in Fargo, ND (https://wheat.pw.usda.gov/GenotypingLabs/fargo; accessed on 7 March 2022) for processing using the Illumina iSelect 90K SNP Assay (Illumina, San Diego, CA, USA). SNP allele clustering and genotype calling were performed using GenomeStudio Module Polyploid Genotyping 2.0 software (https://support.illumina.com/downloads/genomestudio-2-0.html, accessed on 12 June 2023). Markers with minor allele frequencies <0.05 and missing data >10% were removed, resulting in 3969 high-quality SNPs for population structure and genome-wide association analyses. Following filtering, missing genotypes were imputed using BEAGLE v4.1 with the default settings [44].
4.5. Population Structure and LD
The program STRUCTURE v2.3.4, a model-based Bayesian cluster analysis tool was employed to infer the population structure [45]. The analysis involved 5000 burn-in periods followed by 50,000 Markov chain Monte Carlo iterations, ranging from 1 to 10 clusters (K), to identify the optimal K. Three independent runs were conducted for each K, and the most likely subgroups were determined by assessing the estimated likelihood values (ΔK) using Structure Harvester [46]. LD between marker loci on each chromosome was assessed with the squared allele frequency correlation (r2) using standalone TASSEL v.5.0 [47] and visualized using R. The LD decay distance was determined by fitting a non-linear model following the procedure described by Remington et al. [48], with an r2 threshold set at 0.1 and r2 equal to half of the maximum LD value.
4.6. GWASs
For GWASs of SNPs related to seed color, the GAPIT R package (version 3.0) was used [49]. Two GWAS methods were applied, namely, fixed and random model circulating probability unification (FarmCPU) and Bayesian-information and linkage-disequilibrium iteratively nested keyway (BLINK) [50,51]. In total, 3969 SNPs obtained after filtering were used for GWASs. To visualize the false positives of the implemented methods, Q–Q and Manhattan plots were generated using the internal program within GAPIT. The Manhattan plots depict the genomic distribution of marker associations, whereas the Q–Q plots assess the observed versus expected p-values. A stringent threshold of −log10P of 5.0 was applied to ensure robust identification of significant MTAs across the implemented genome-wide association study methods.
4.7. Transcriptome Data Analysis
Deep purple wheat and yellow wheat were cultivated in a radiation breeding research farm located at 35.5699° N and 126.9722° E (Jeongeup, Republic of Korea). The spikes were tagged at flowering time, and the grains were harvested at 10, 20, and 30 days after flowering. The samples were stored at −80 °C until further use. Total RNA was isolated from developing wheat seeds collected 10 days after flowering (DAF), 20 DAF, and 30 DAF using Meng and Feldman’s method [52]. An RNeasy plus micro kit (Qiagen, Hilden, Germany) was used to purify total RNA. Total RNA was isolated from developing wheat seeds collected 10 DAF, 20 DAF, and 30 DAF to construct RNA-Seq paired-end libraries using the TruSeq RNA sample preparation kit (Illumina). Each library was sequenced using the Illumina HiSeq2000 platform. The raw reads were preprocessed using Trimmomatic v0.36 to remove adapter sequences and low-quality bases [53]. The preprocessed reads were mapped to a high-quality wheat (T. aestivum L.) reference genome (International Wheat Genome Sequencing Consortium) from IWGSC using HISAT2 v2.1 [54,55]. The alignment was capable of determining alternative spliced transcripts for gene models based on IWGSC RefSeq v1.1. The HTSeq v0.6.1 high-throughput sequencing framework was employed to count the number of reads mapped to the exons of each gene [56]. DEGs were determined by p < 0.05, false discovery rate < 0.05, and absolute fold change >4 using edgeR [57] in the Bioconductor package. DEGs were identified by pairwise comparison at each time point between yellow and purple seeds. The log2-transformed transcript per million values was calculated using TPMCalculator and used to construct heatmaps of DEGs under yellow and purple wheat [58]. To identify genes associated with each agronomic trait, high-confidence annotated genes located within ±250 kb of each identified marker–trait association (MTA) were selected from the transcriptome data. The heatmap of gene expression was generated using MeV software, version 4.9.0 [59].
4.8. Gene Expression Analysis
RT-qPCR was performed using Bio-Rad CFX Opus 96 (Bio-Rad, Hercules, CA, USA) and TB Green premix EX Taq II (Takara, Tokyo, Japan). RT-qPCR primers for the indicated genes were designed using an oligonucleotide properties calculator. Each PCR reaction mixture (20 µL) contained 10 µL of 2 × TB Green premix, 1 µL of the first-strand cDNA, and gene-specific primers. The reactions were performed in the Bio-Rad CFX Opus 96 system under the following conditions: 30 s of denaturation at 95 °C, followed by 40 cycles of PCR amplification at 95 °C for 10 s and 65 °C for 30 s. The primers are presented in Table S1.
5. Conclusions
Overall, our comprehensive investigation into the genetic basis of seed color in wheat uncovered eight significant MTAs related to colorimetric traits (L*, a*, and b*) and candidate genes associated with seed coloration. The identified MTAs and candidate genes, including those encoding putative components of the MBW complex and E3 ubiquitin ligases, provide valuable insights into the molecular mechanisms governing seed color in wheat. Further investigations are essential to validate these correlations and unveil the precise roles of the identified genes in determining wheat seed color. This research provides a foundation for future studies to unravel the intricate molecular mechanisms governing the diverse colors of wheat seeds.
Supplementary Materials
The supporting information can be downloaded at: https://www.mdpi.com/article/10.3390/ijms25073600/s1.
Author Contributions
Conceptualization, M.J.H. and D.Y.K.; methodology, M.J.H. and D.Y.K.; formal analysis, M.J.H., C.S.K. and D.Y.K.; investigation, M.J.H. and C.S.K.; writing—original draft preparation, M.J.H. and D.Y.K.; writing—review and editing, M.J.H. and D.Y.K.; supervision, D.Y.K. All authors have read and agreed to the published version of the manuscript.
Funding
This work was supported by the research program of Korea Atomic Energy Research Institute (Project No. 523420-24) and the Basic Science Research Program through the National Research Foundation of Korea (NRF) funded by the Ministry of Education (2022R1I1A1A01065420).
Institutional Review Board Statement
Not applicable.
Informed Consent Statement
Not applicable.
Data Availability Statement
The dataset is available upon request from the authors.
Conflicts of Interest
The authors declare no conflicts of interest.
References
- Erenstein, O.; Jaleta, M.; Mottaleb, K.A.; Sonder, K.; Donovan, J.; Braun, H. Global trends in wheat production, consumption and trade. In Wheat Improvement; Reynolds, M.P., Braun, H.J., Eds.; Springer International Publishing: Cham, Switzerland, 2022; pp. 47–66. [Google Scholar]
- Loskutov, I.G.; Khlestkina, E.K. Wheat, Barley, and Oat Breeding for Health Benefit Components in Grain. Plants 2021, 10, 86. [Google Scholar] [CrossRef]
- Luthria, D.L.; Lu, Y.; John, K.M. Bioactive Phytochemicals in Wheat: Extraction, Analysis, Processing, and Functional Properties. J. Funct. Foods 2015, 18, 910–925. [Google Scholar] [CrossRef]
- Maleki, S.J.; Crespo, J.F.; Cabanillas, B. Anti-Inflammatory Effects of Flavonoids. Food Chem. 2019, 299, 125124. [Google Scholar] [CrossRef]
- Lachman, J.; Martinek, P.; Kotíková, Z.; Orsák, M.; Šulc, M. Genetics and Chemistry of Pigments in Wheat grain—A Review. J. Cereal Sci. 2017, 74, 145–154. [Google Scholar] [CrossRef]
- Onipe, O.O.; Jideani, A.I.; Beswa, D. Composition and Functionality of Wheat Bran and its Application in some Cereal Food Products. Int. J. Food Sci. Technol. 2015, 50, 2509–2518. [Google Scholar] [CrossRef]
- Chen, G.; Lee, S.H.; Brion, M.A.; Montgomery, G.W.; Wray, N.R.; Radford-Smith, G.L.; Visscher, P.M.; International IBD Genetics Consortium. Estimation and Partitioning of (Co) Heritability of Inflammatory Bowel Disease from GWAS and Immunochip Data. Hum. Mol. Genet. 2014, 23, 4710–4720. [Google Scholar] [CrossRef]
- Rasheed, A.; Hao, Y.; Xia, X.; Khan, A.; Xu, Y.; Varshney, R.K.; He, Z. Crop Breeding Chips and Genotyping Platforms: Progress, Challenges, and Perspectives. Mol. Plant 2017, 10, 1047–1064. [Google Scholar] [CrossRef] [PubMed]
- You, Q.; Yang, X.; Peng, Z.; Xu, L.; Wang, J. Development and Applications of a High Throughput Genotyping Tool for Polyploid Crops: Single Nucleotide Polymorphism (SNP) Array. Front. Plant Sci. 2018, 9, 104. [Google Scholar] [CrossRef]
- Uffelmann, E.; Huang, Q.Q.; Munung, N.S.; De Vries, J.; Okada, Y.; Martin, A.R.; Martin, H.C.; Lappalainen, T.; Posthuma, D. Genome-Wide Association Studies. Nat. Rev. Methods Primers 2021, 1, 59. [Google Scholar] [CrossRef]
- Allen, A.M.; Humphries, M.O.; Burridge, A.J.; Downie, R.C.; Benbow, H.R.; Barker, G.L.; Wilkinson, P.A.; Coghill, J.; Waterfall, C.; Davassi, A. Characterization of a Wheat Breeders’ Array Suitable for High-throughput SNP Genotyping of Global Accessions of Hexaploid Bread Wheat (Triticum aestivum). Plant Biotechol. J. 2017, 15, 390–401. [Google Scholar] [CrossRef]
- Boeven, P.H.; Longin, C.F.H.; Leiser, W.L.; Kollers, S.; Ebmeyer, E.; Würschum, T. Genetic Architecture of Male Floral Traits Required for Hybrid Wheat Breeding. Theor. Appl. Genet. 2016, 129, 2343–2357. [Google Scholar] [CrossRef]
- Cavanagh, C.R.; Chao, S.; Wang, S.; Huang, B.E.; Stephen, S.; Kiani, S.; Forrest, K.; Saintenac, C.; Brown-Guedira, G.L.; Akhunova, A. Genome-Wide Comparative Diversity Uncovers Multiple Targets of Selection for Improvement in Hexaploid Wheat Landraces and Cultivars. Proc. Natl. Acad. Sci. USA 2013, 110, 8057–8062. [Google Scholar] [CrossRef] [PubMed]
- Rasheed, A.; Xia, X. From Markers to Genome-Based Breeding in Wheat. Theor. Appl. Genet. 2019, 132, 767–784. [Google Scholar] [CrossRef] [PubMed]
- Wang, S.; Wong, D.; Forrest, K.; Allen, A.; Chao, S.; Huang, B.E.; Maccaferri, M.; Salvi, S.; Milner, S.G.; Cattivelli, L. Characterization of Polyploid Wheat Genomic Diversity using a High-density 90 000 Single Nucleotide Polymorphism Array. Plant Biotechol. J. 2014, 12, 787–796. [Google Scholar] [CrossRef] [PubMed]
- Winfield, M.O.; Allen, A.M.; Burridge, A.J.; Barker, G.L.; Benbow, H.R.; Wilkinson, P.A.; Coghill, J.; Waterfall, C.; Davassi, A.; Scopes, G. High-density SNP Genotyping Array for Hexaploid Wheat and its Secondary and Tertiary Gene Pool. Plant Biotechol. J. 2016, 14, 1195–1206. [Google Scholar] [CrossRef] [PubMed]
- Humphries, J.M.; Graham, R.D.; Mares, D.J. Application of Reflectance Colour Measurement to the Estimation of Carotene and Lutein Content in Wheat and Triticale. J. Cereal Sci. 2004, 40, 151–159. [Google Scholar] [CrossRef]
- Andersen, J.R.; Zein, I.; Wenzel, G.; Krützfeldt, B.; Eder, J.; Ouzunova, M.; Lübberstedt, T. High Levels of Linkage Disequilibrium and Associations with Forage Quality at a Phenylalanine Ammonia-Lyase Locus in European Maize (Zea mays L.) Inbreds. Theor. Appl. Genet. 2007, 114, 307–319. [Google Scholar] [CrossRef]
- Mather, K.A.; Caicedo, A.L.; Polato, N.R.; Olsen, K.M.; McCouch, S.; Purugganan, M.D. The Extent of Linkage Disequilibrium in Rice (Oryza sativa L.). Genetics 2007, 177, 2223–2232. [Google Scholar] [CrossRef]
- Lin, Y.; Yi, X.; Tang, S.; Chen, W.; Wu, F.; Yang, X.; Jiang, X.; Shi, H.; Ma, J.; Chen, G. Dissection of Phenotypic and Genetic Variation of Drought-related Traits in Diverse Chinese Wheat Landraces. Plant Genome 2019, 12, 190025. [Google Scholar] [CrossRef]
- Vikram, P.; Sehgal, D.; Sharma, A.; Bhavani, S.; Gupta, P.; Randhawa, M.; Pardo, N.; Basandra, D.; Srivastava, P.; Singh, S. Genome-Wide Association Analysis of Mexican Bread Wheat Landraces for Resistance to Yellow and Stem Rust. PLoS ONE 2021, 16, e0246015. [Google Scholar] [CrossRef]
- Pang, Y.; Liu, C.; Wang, D.; Amand, P.S.; Bernardo, A.; Li, W.; He, F.; Li, L.; Wang, L.; Yuan, X. High-Resolution Genome-Wide Association Study Identifies Genomic Regions and Candidate Genes for Important Agronomic Traits in Wheat. Mol. Plant 2020, 13, 1311–1327. [Google Scholar] [CrossRef] [PubMed]
- Spelt, C.; Quattrocchio, F.; Mol, J.N.; Koes, R. Anthocyanin1 of Petunia Encodes a Basic Helix-Loop-Helix Protein that Directly Activates Transcription of Structural Anthocyanin Genes. Plant Cell 2000, 12, 1619–1631. [Google Scholar] [CrossRef] [PubMed]
- Gil-Muñoz, F.; Sánchez-Navarro, J.A.; Besada, C.; Salvador, A.; Badenes, M.L.; Naval, M.d.M.; Ríos, G. MBW Complexes Impinge on Anthocyanidin Reductase Gene Regulation for Proanthocyanidin Biosynthesis in Persimmon Fruit. Sci. Rep. 2020, 10, 3543. [Google Scholar] [CrossRef]
- Xu, W.; Grain, D.; Bobet, S.; Le Gourrierec, J.; Thévenin, J.; Kelemen, Z.; Lepiniec, L.; Dubos, C. Complexity and Robustness of the Flavonoid Transcriptional Regulatory Network Revealed by Comprehensive Analyses of MYB–bHLH–WDR Complexes and their Targets in Arabidopsis Seed. New Phytol. 2014, 202, 132–144. [Google Scholar] [CrossRef]
- Xu, W.; Dubos, C.; Lepiniec, L. Transcriptional Control of Flavonoid Biosynthesis by MYB–bHLH–WDR Complexes. Trends Plant Sci. 2015, 20, 176–185. [Google Scholar] [CrossRef] [PubMed]
- Li, Y.; Kim, J.I.; Pysh, L.; Chapple, C. Four Isoforms of Arabidopsis 4-Coumarate: CoA Ligase have Overlapping Yet Distinct Roles in Phenylpropanoid Metabolism. Plant Physiol. 2015, 169, 2409–2421. [Google Scholar] [CrossRef]
- Shi, J.; Yan, X.; Sun, T.; Shen, Y.; Shi, Q.; Wang, W.; Bao, M.; Luo, H.; Nian, F.; Ning, G. Homeostatic Regulation of Flavonoid and Lignin Biosynthesis in Phenylpropanoid Pathway of Transgenic Tobacco. Gene 2022, 809, 146017. [Google Scholar] [CrossRef]
- Thévenin, J.; Pollet, B.; Letarnec, B.; Saulnier, L.; Gissot, L.; Maia-Grondard, A.; Lapierre, C.; Jouanin, L. The Simultaneous Repression of CCR and CAD, Two Enzymes of the Lignin Biosynthetic Pathway, Results in Sterility and Dwarfism in Arabidopsis thaliana. Mol. Plant 2011, 4, 70–82. [Google Scholar] [CrossRef]
- Kim, D.Y.; Lee, Y.J.; Hong, M.J.; Kim, J.H.; Seo, Y.W. Genome Wide Analysis of U-Box E3 Ubiquitin Ligases in Wheat (Triticum aestivum L.). Int. J. Mol. Sci. 2021, 22, 2699. [Google Scholar] [CrossRef]
- Hershko, A.; Ciechanover, A. The Ubiquitin System. Annu. Rev. Biochem. 1998, 67, 425–479. [Google Scholar] [CrossRef]
- Stone, S.L.; Callis, J. Ubiquitin Ligases Mediate Growth and Development by Promoting Protein Death. Curr. Opin. Plant Biol. 2007, 10, 624–632. [Google Scholar] [CrossRef]
- Kelley, D.R. E3 Ubiquitin Ligases: Key Regulators of Hormone Signaling in Plants. Mol. Cell. Proteom. 2018, 17, 1047–1054. [Google Scholar] [CrossRef]
- Flint-Garcia, S.A.; Thornsberry, J.M.; Buckler, E.S., IV. Structure of Linkage Disequilibrium in Plants. Annu. Rev. Plant Biol. 2003, 54, 357–374. [Google Scholar] [CrossRef] [PubMed]
- Guerra, D.D.; Callis, J. Ubiquitin on the Move: The Ubiquitin Modification System Plays Diverse Roles in the Regulation of Endoplasmic Reticulum-and Plasma Membrane-Localized Proteins. Plant Physiol. 2012, 160, 56–64. [Google Scholar] [CrossRef] [PubMed][Green Version]
- Kelley, D.R.; Estelle, M. Ubiquitin-Mediated Control of Plant Hormone Signaling. Plant Physiol. 2012, 160, 47–55. [Google Scholar] [CrossRef]
- Shabek, N.; Zheng, N. Plant Ubiquitin Ligases as Signaling Hubs. Nat. Struct. Mol. Biol. 2014, 21, 293–296. [Google Scholar] [CrossRef] [PubMed]
- Vierstra, R.D. The Expanding Universe of Ubiquitin and Ubiquitin-Like Modifiers. Plant Physiol. 2012, 160, 2–14. [Google Scholar] [CrossRef] [PubMed]
- Yan, S.; Dong, X. Perception of the Plant Immune Signal Salicylic Acid. Curr. Opin. Plant Biol. 2014, 20, 64–68. [Google Scholar] [CrossRef] [PubMed]
- Shin, O.H.; Kim, D.Y.; Seo, Y.W. Effects of Different Depth of Grain Colour on Antioxidant Capacity during Water Imbibition in Wheat (Triticum aestivum L.). J. Sci. Food Agric. 2017, 97, 2750–2758. [Google Scholar] [CrossRef] [PubMed]
- Hong, M.J.; Kim, D.Y.; Ahn, J.; Kang, S.; Seo, Y.W.; Kim, J. Comparison of Radiosensitivity Response to Acute and Chronic Gamma Irradiation in Colored Wheat. Genet. Mol. Biol. 2018, 41, 611–623. [Google Scholar] [CrossRef]
- Lichtenthaler, H.K. Chlorophylls and carotenoids: Pigments of photosynthetic biomembranes. Methods Enzymol. 1987, 148, 350–382. [Google Scholar]
- Doyle, J. DNA protocols for plants. In Molecular Techniques in Taxonomy; Springer: Berlin/Heidelberg, Germany, 1991; pp. 283–293. [Google Scholar]
- Browning, B.L.; Tian, X.; Zhou, Y.; Browning, S.R. Fast Two-Stage Phasing of Large-Scale Sequence Data. Am. J. Hum. Genet. 2021, 108, 1880–1890. [Google Scholar] [CrossRef]
- Evanno, G.; Regnaut, S.; Goudet, J. Detecting the Number of Clusters of Individuals using the Software STRUCTURE: A Simulation Study. Mol. Ecol. 2005, 14, 2611–2620. [Google Scholar] [CrossRef]
- Earl, D.A.; VonHoldt, B.M. Structure harvester: A website and program for visualizing structure output and implementing the evanno method. Conserv. Genet. Resour. 2012, 4, 359–361. [Google Scholar] [CrossRef]
- Bradbury, P.J.; Zhang, Z.; Kroon, D.E.; Casstevens, T.M.; Ramdoss, Y.; Buckler, E.S. TASSEL: Software for Association Mapping of Complex Traits in Diverse Samples. Bioinformatics 2007, 23, 2633–2635. [Google Scholar] [CrossRef]
- Remington, D.L.; Thornsberry, J.M.; Matsuoka, Y.; Wilson, L.M.; Whitt, S.R.; Doebley, J.; Kresovich, S.; Goodman, M.M.; Buckler, E.S., IV. Structure of Linkage Disequilibrium and Phenotypic Associations in the Maize Genome. Proc. Natl. Acad. Sci. USA 2001, 98, 11479–11484. [Google Scholar] [CrossRef]
- Wang, J.; Zhang, Z. GAPIT Version 3: Boosting power and accuracy for genomic association and prediction. bioRxiv 2020. [CrossRef]
- Liu, X.; Huang, M.; Fan, B.; Buckler, E.S.; Zhang, Z. Iterative Usage of Fixed and Random Effect Models for Powerful and Efficient Genome-Wide Association Studies. PLoS Genet. 2016, 12, e1005767. [Google Scholar] [CrossRef] [PubMed]
- Zhang, Z.; Liu, X.; Zhou, Y.; Summers, R.M. BLINK: A Package for the Next Level of Genome-Wide Association Studies with both Individuals and Markers Meng Huang. Gigascience 2018, 8, giy154. [Google Scholar]
- Meng, L.; Feldman, L. A rapid TRIzol-based two-step method for DNA-free RNA extraction from Arabidopsis siliques and dry seeds. Biotechnol. J. 2010, 5, 183–186. [Google Scholar] [CrossRef] [PubMed]
- Bolger, A.M.; Lohse, M.; Usadel, B. Trimmomatic: A Flexible Trimmer for Illumina Sequence Data. Bioinformatics 2014, 30, 2114–2120. [Google Scholar] [CrossRef]
- Kim, D.; Langmead, B.; Salzberg, S.L. HISAT: A Fast Spliced Aligner with Low Memory Requirements. Nat. Methods 2015, 12, 357–360. [Google Scholar] [CrossRef]
- Appels, R.; Eversole, K.; Stein, N.; Feuillet, C.; Keller, B.; Rogers, J.; Pozniak, C.J.; Choulet, F.; Distelfeld, A.; International Wheat Genome Sequencing Consortium. Shifting the Limits in Wheat Research and Breeding using a Fully Annotated Reference Genome. Science 2018, 361, eaar7191. [Google Scholar]
- Anders, S.; Pyl, P.T.; Huber, W. HTSeq—A Python Framework to Work with High-Throughput Sequencing Data. Bioinformatics 2015, 31, 166–169. [Google Scholar] [CrossRef] [PubMed]
- Robinson, M.D.; McCarthy, D.J.; Smyth, G.K. edgeR: A Bioconductor Package for Differential Expression Analysis of Digital Gene Expression Data. Bioinformatics 2010, 26, 139–140. [Google Scholar] [CrossRef] [PubMed]
- Vera Alvarez, R.; Pongor, L.S.; Mariño-Ramírez, L.; Landsman, D. TPMCalculator: One-Step Software to Quantify mRNA Abundance of Genomic Features. Bioinformatics 2019, 35, 1960–1962. [Google Scholar] [CrossRef]
- Howe, E.A.; Sinha, R.; Schlauch, D.; Quackenbush, J. RNA-Seq Analysis in MeV. Bioinformatics 2011, 27, 3209–3210. [Google Scholar] [CrossRef]
Disclaimer/Publisher’s Note: The statements, opinions and data contained in all publications are solely those of the individual author(s) and contributor(s) and not of MDPI and/or the editor(s). MDPI and/or the editor(s) disclaim responsibility for any injury to people or property resulting from any ideas, methods, instructions or products referred to in the content. |
© 2024 by the authors. Licensee MDPI, Basel, Switzerland. This article is an open access article distributed under the terms and conditions of the Creative Commons Attribution (CC BY) license (https://creativecommons.org/licenses/by/4.0/).