

Drugs That Induce Gingival Overgrowth Drive the Pro-Inflammatory Polarization of Macrophages In Vitro


 , , , and
Abstract
1. Introduction
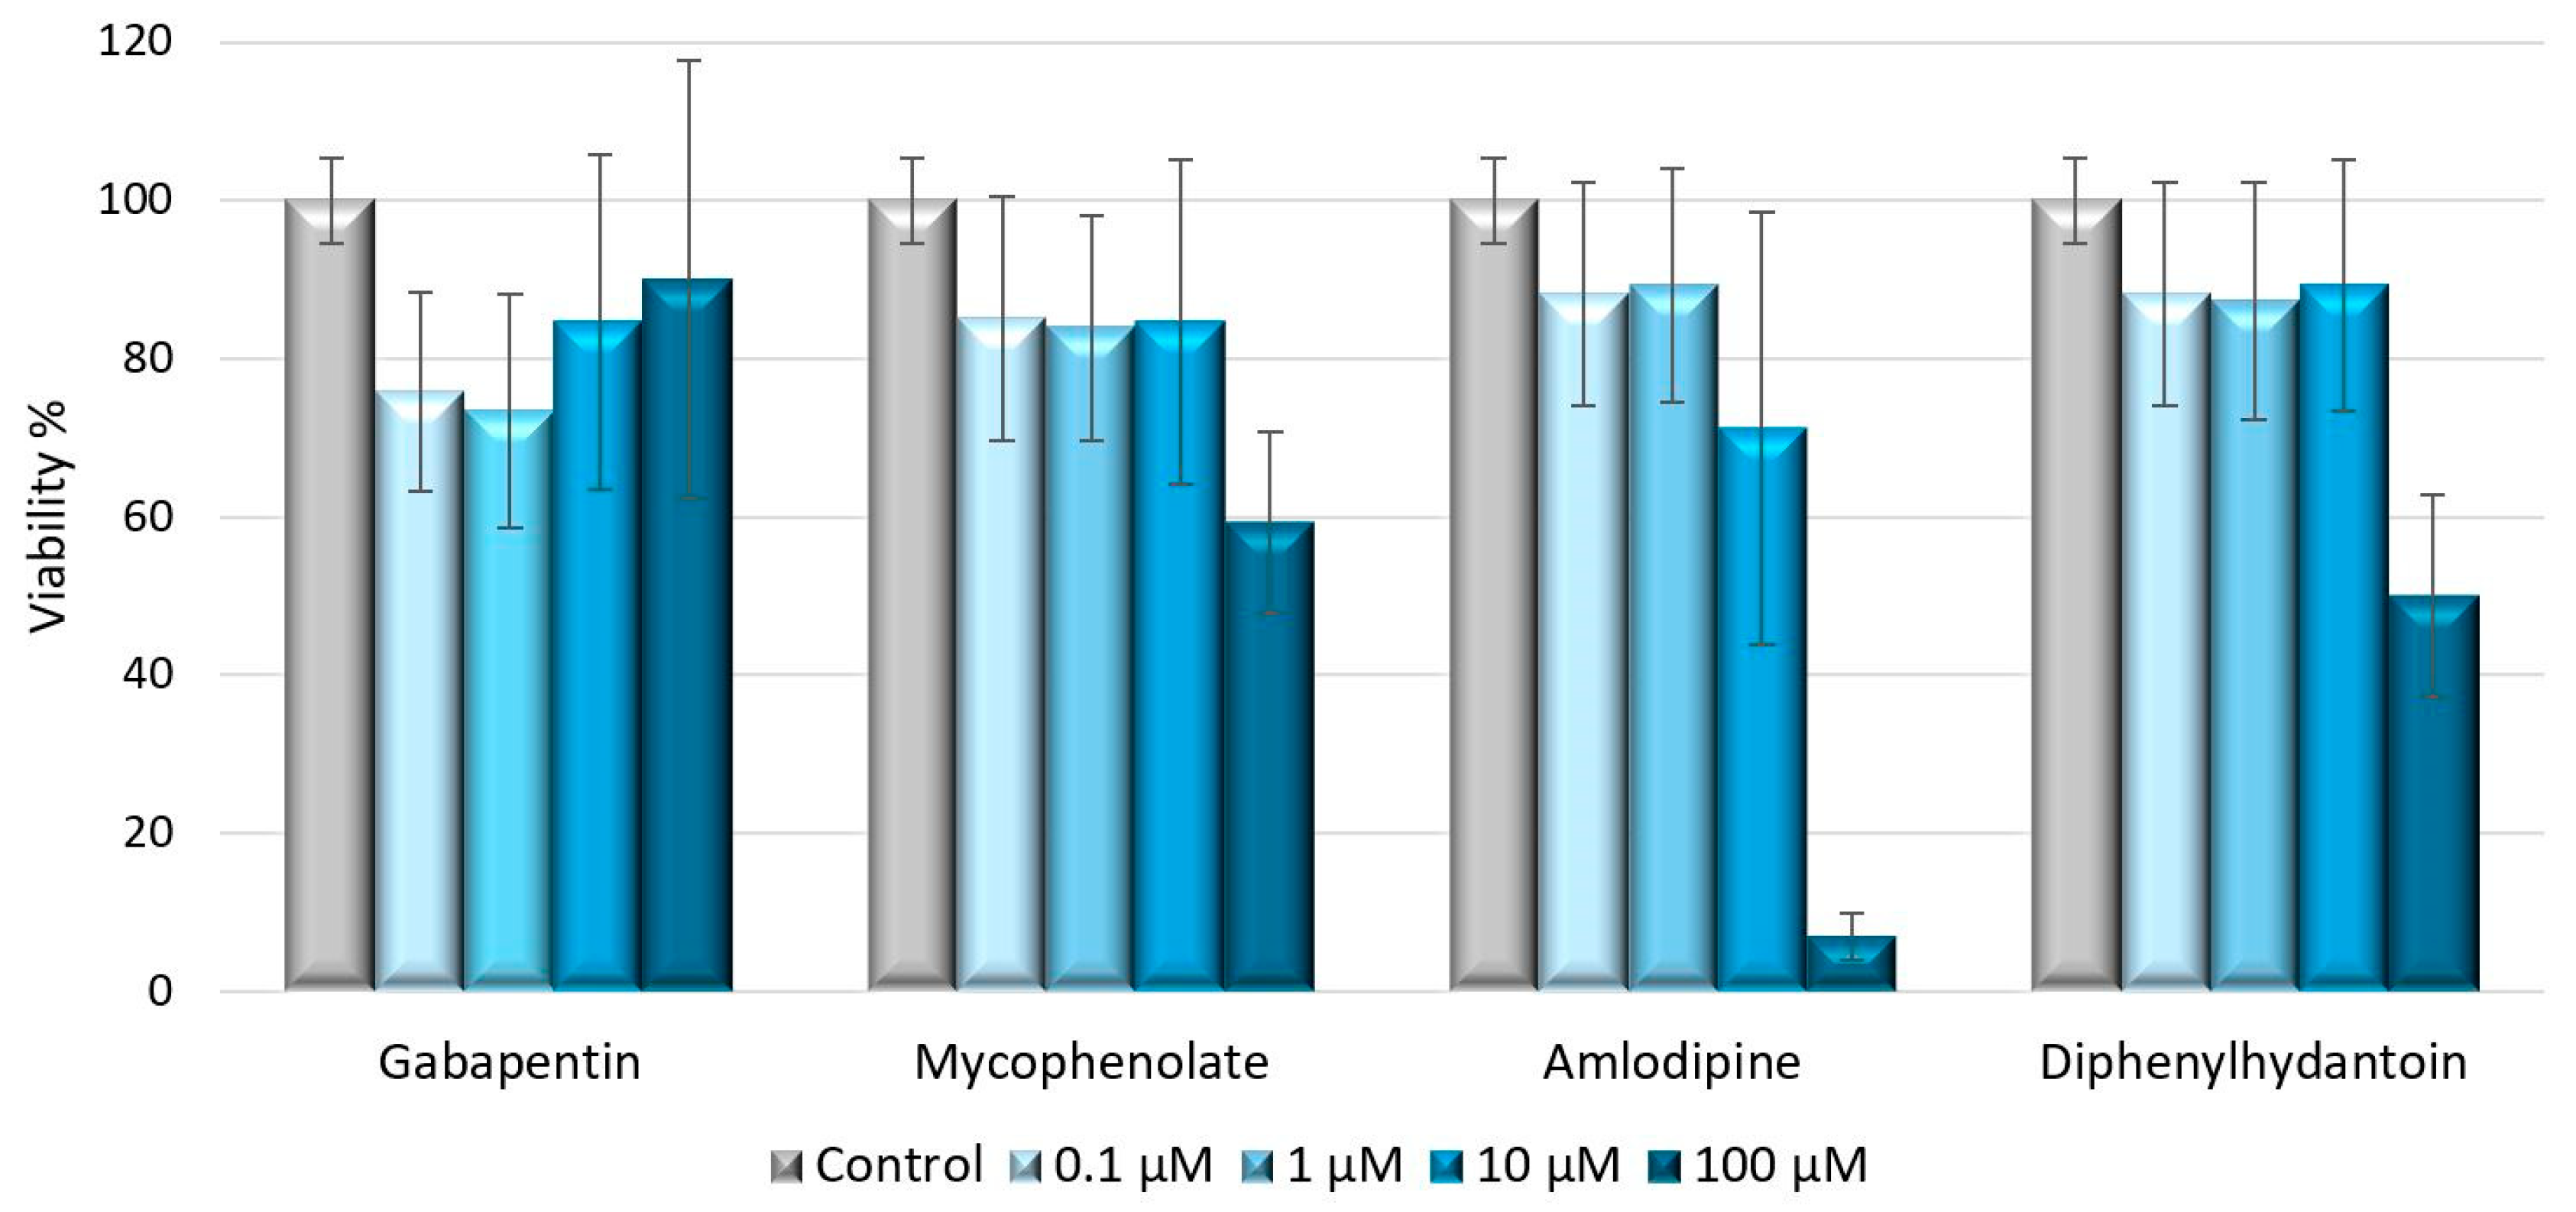
2. Results
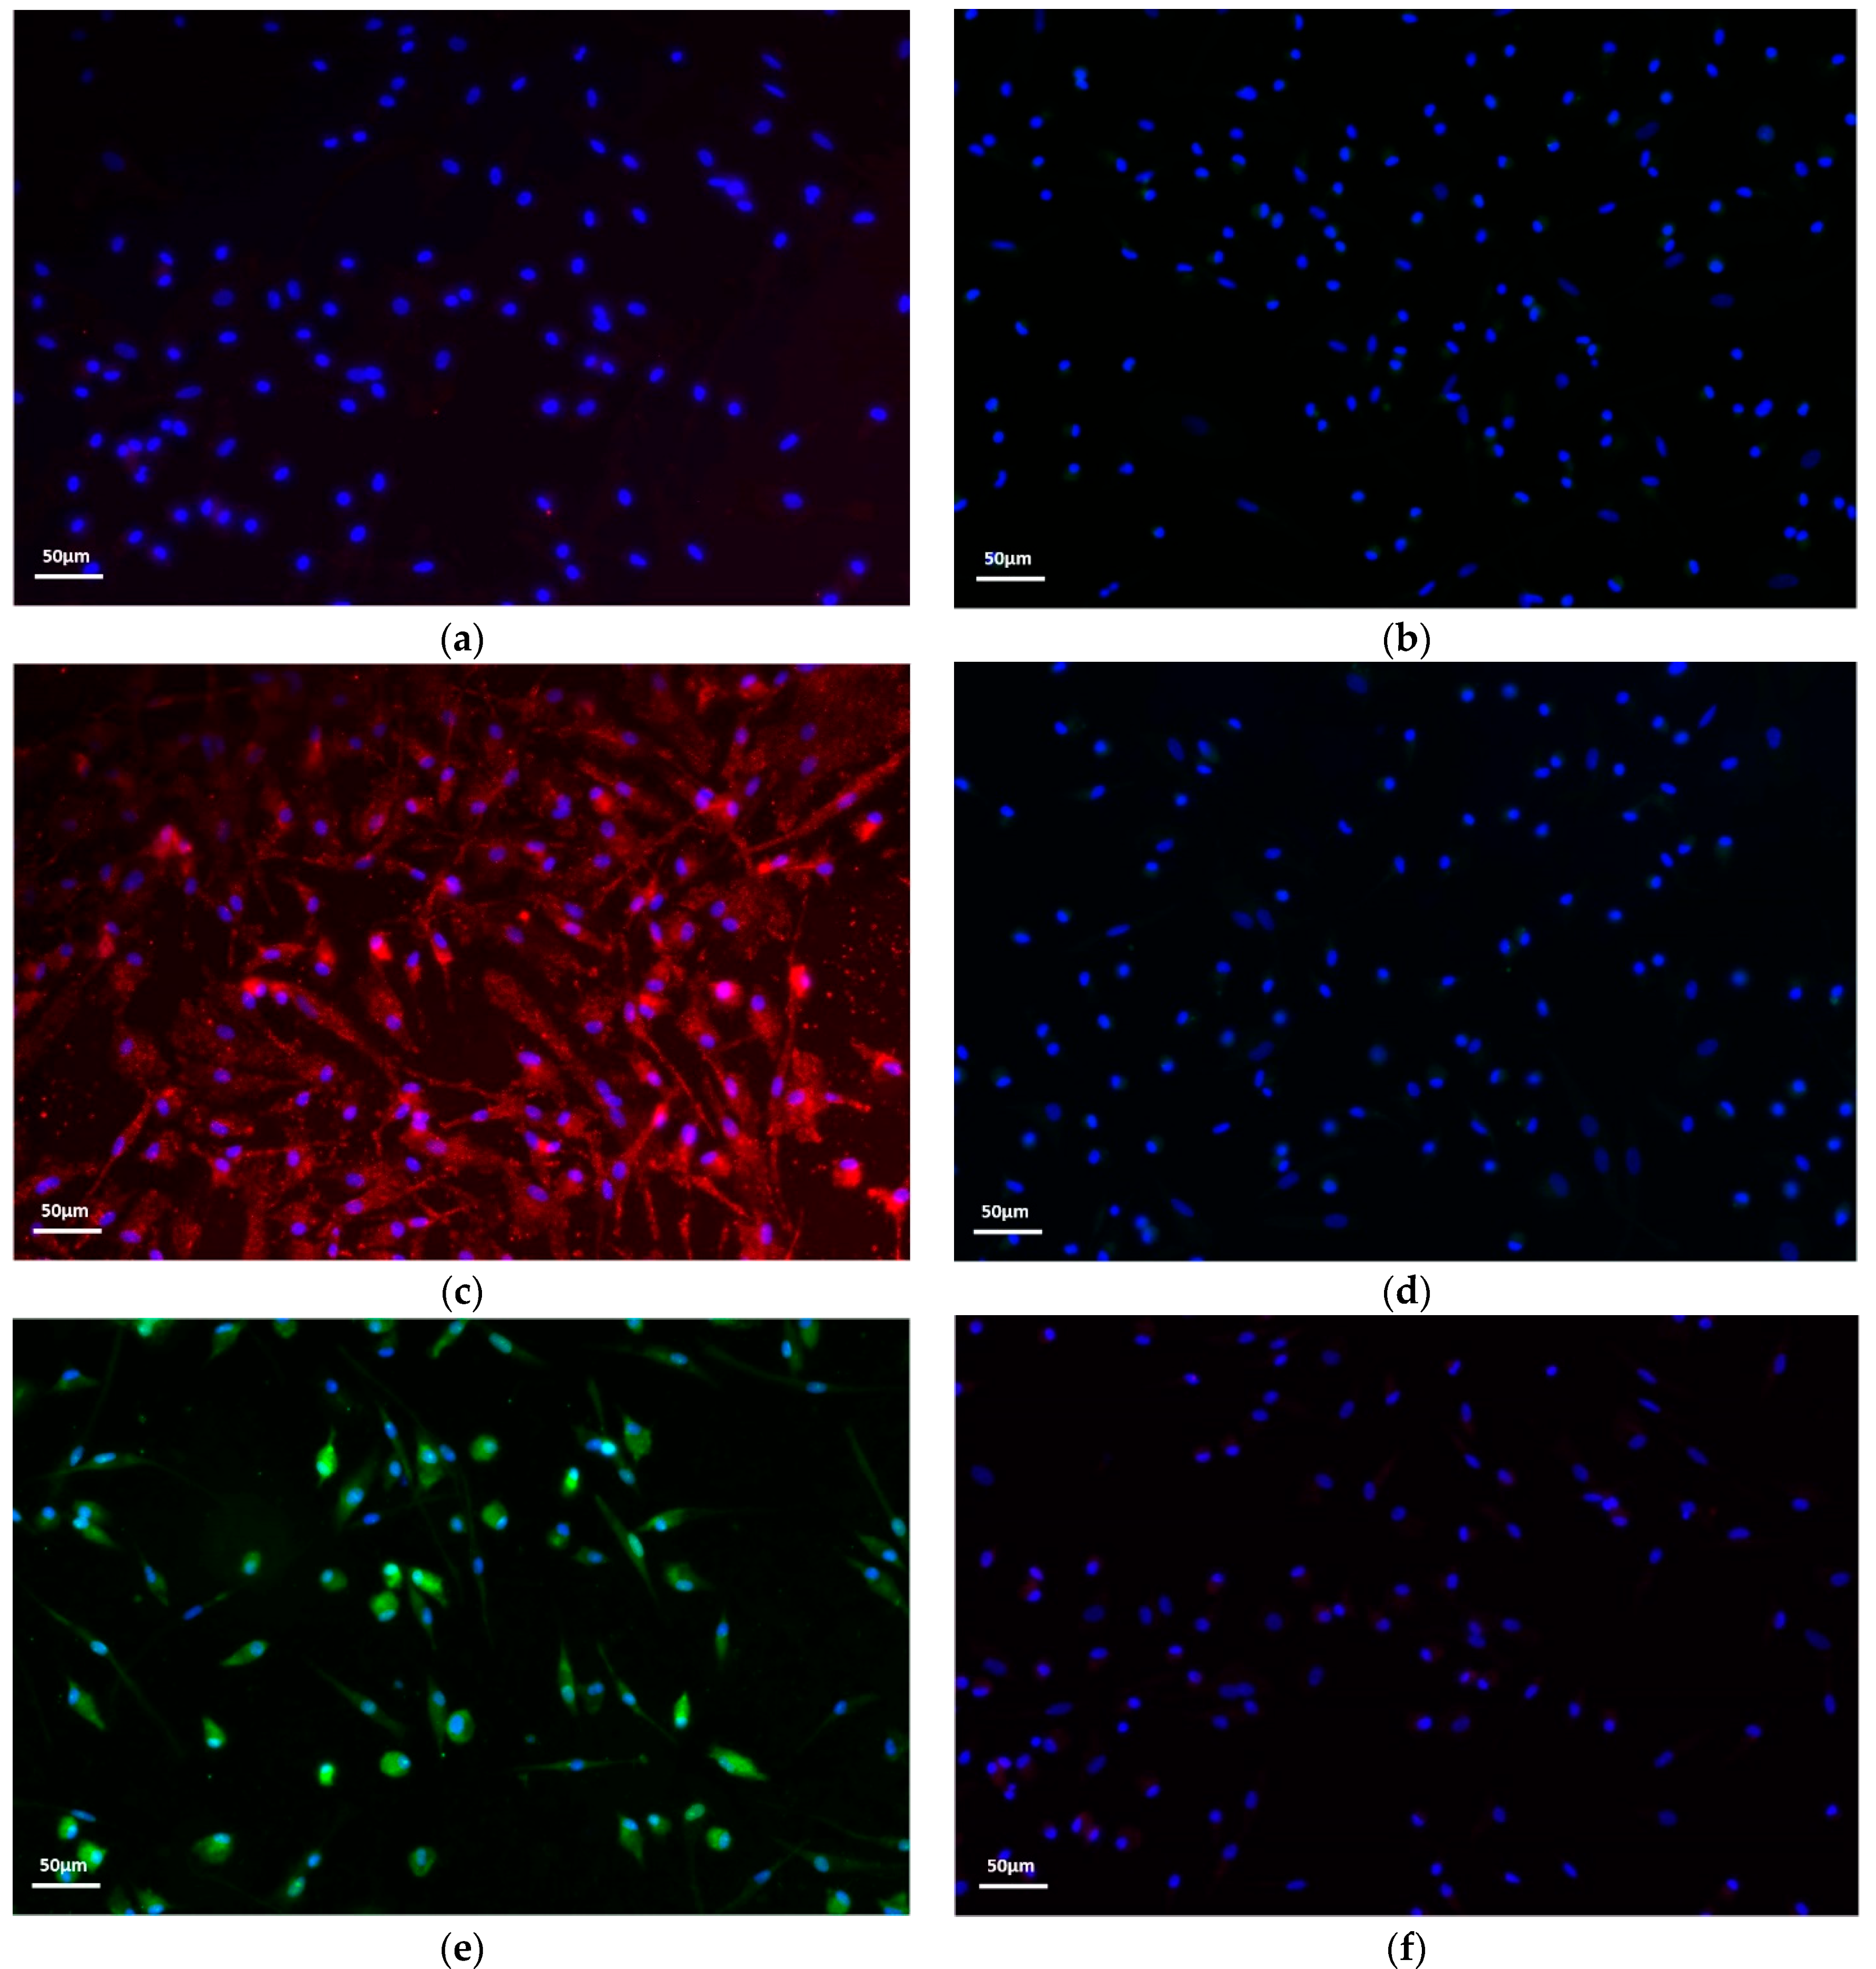
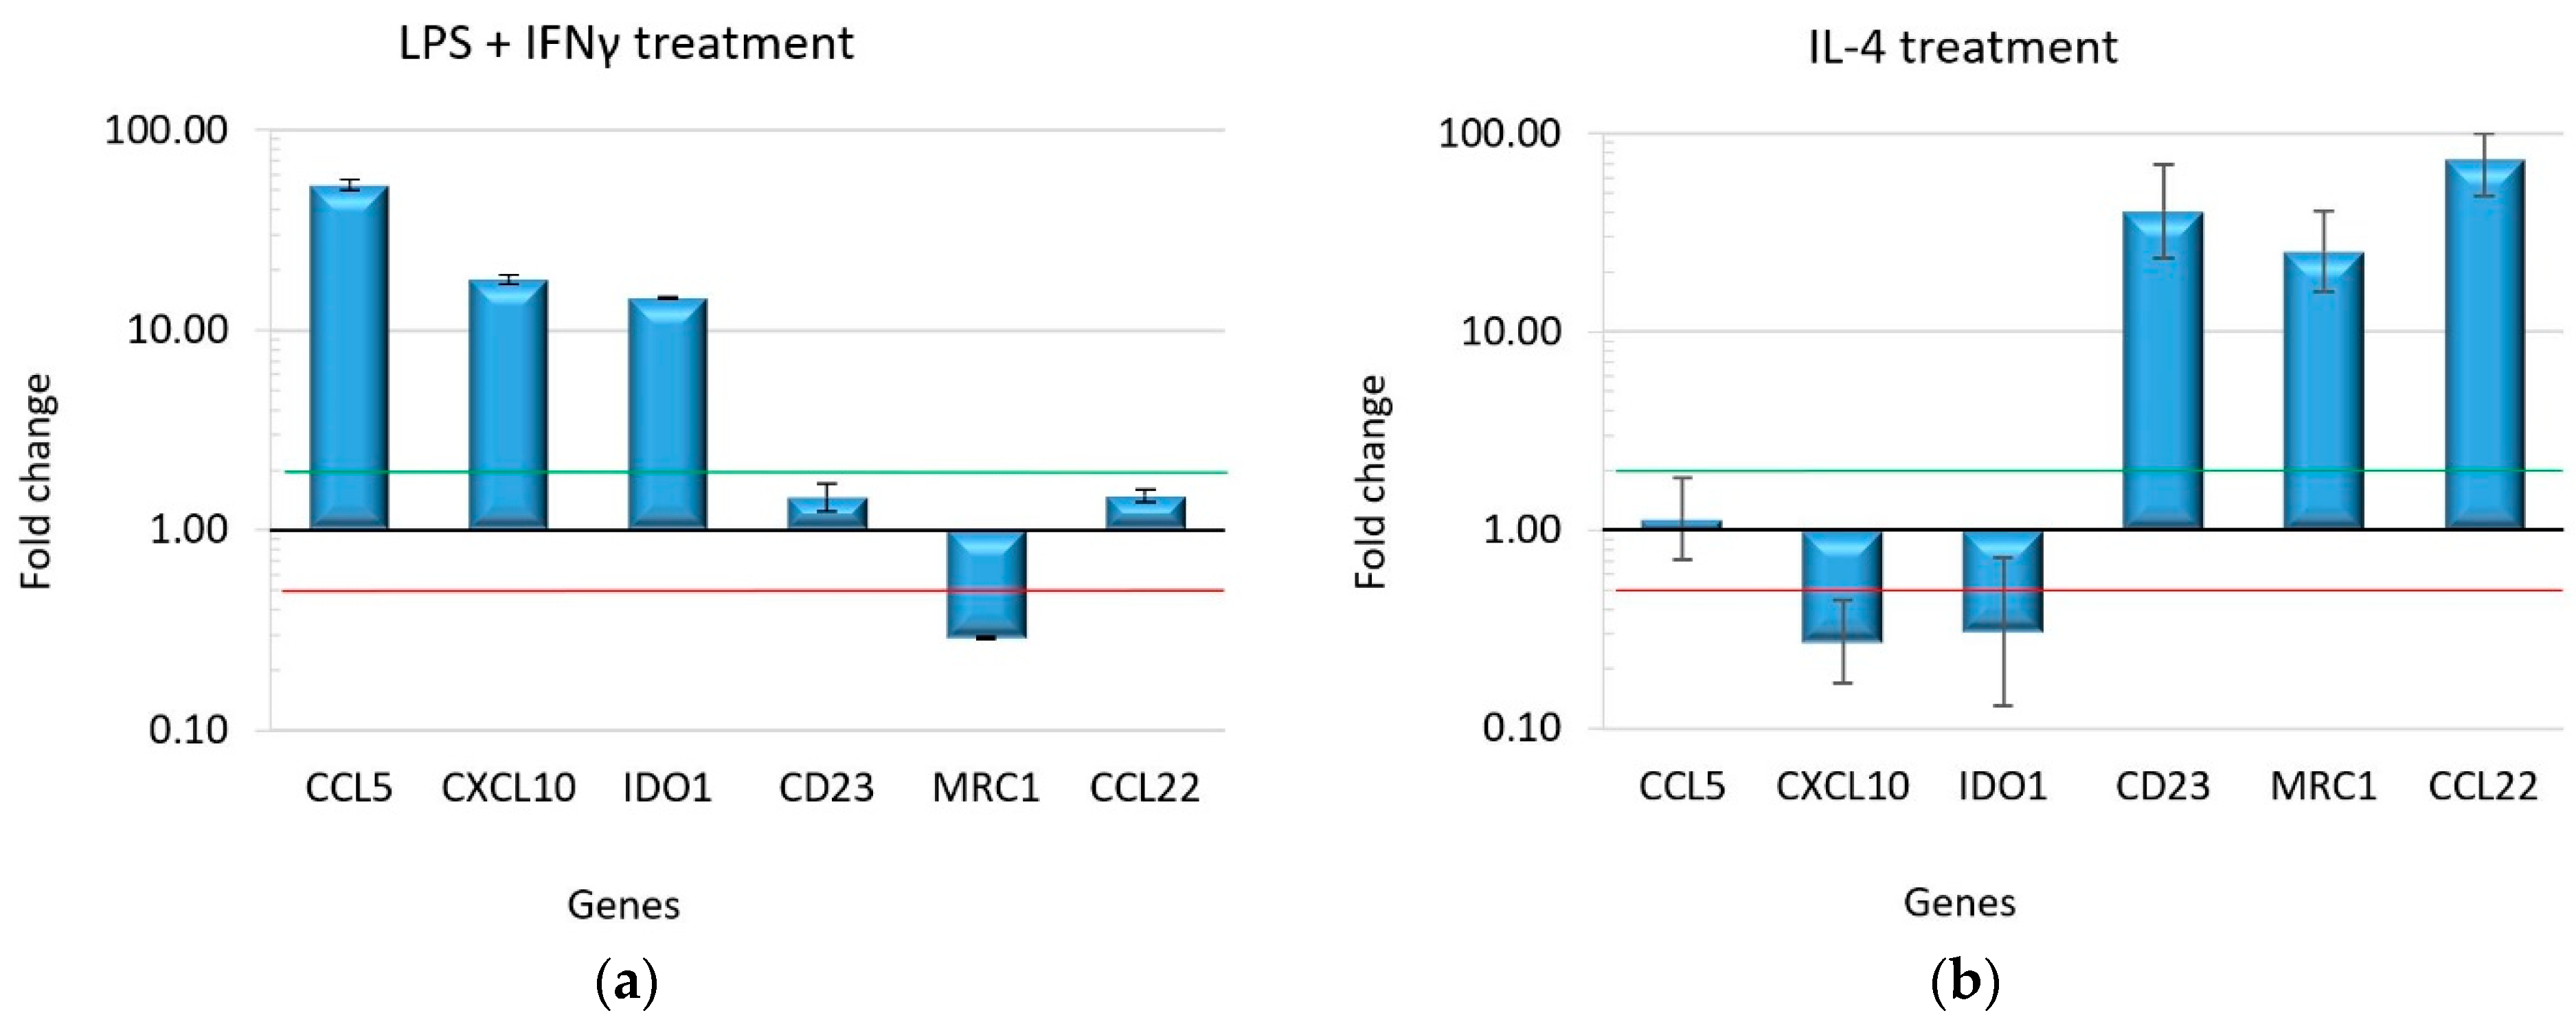
2.1. Macrophage Polarization Assay
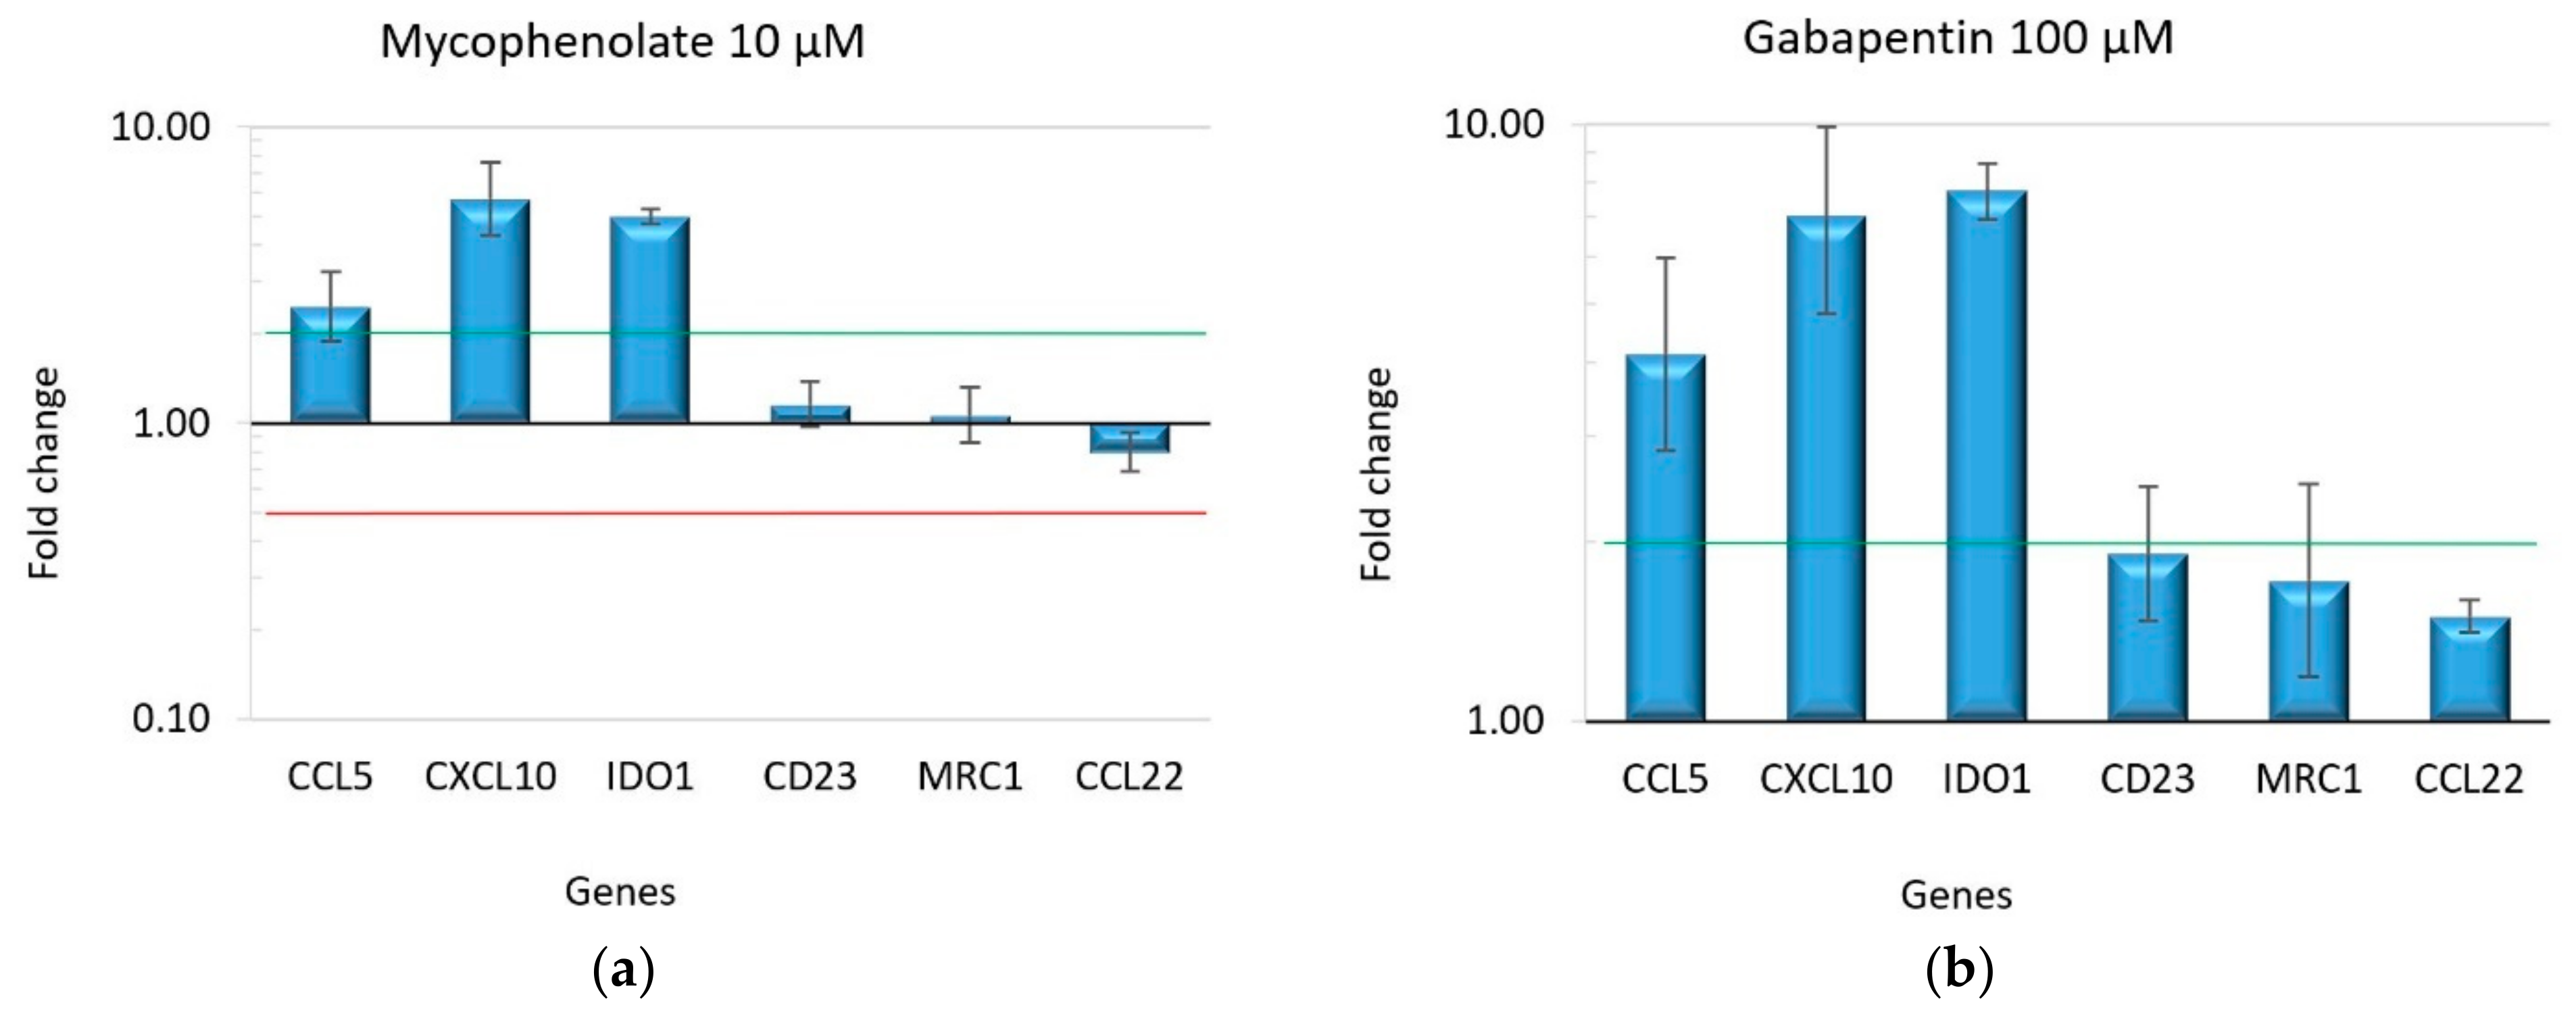
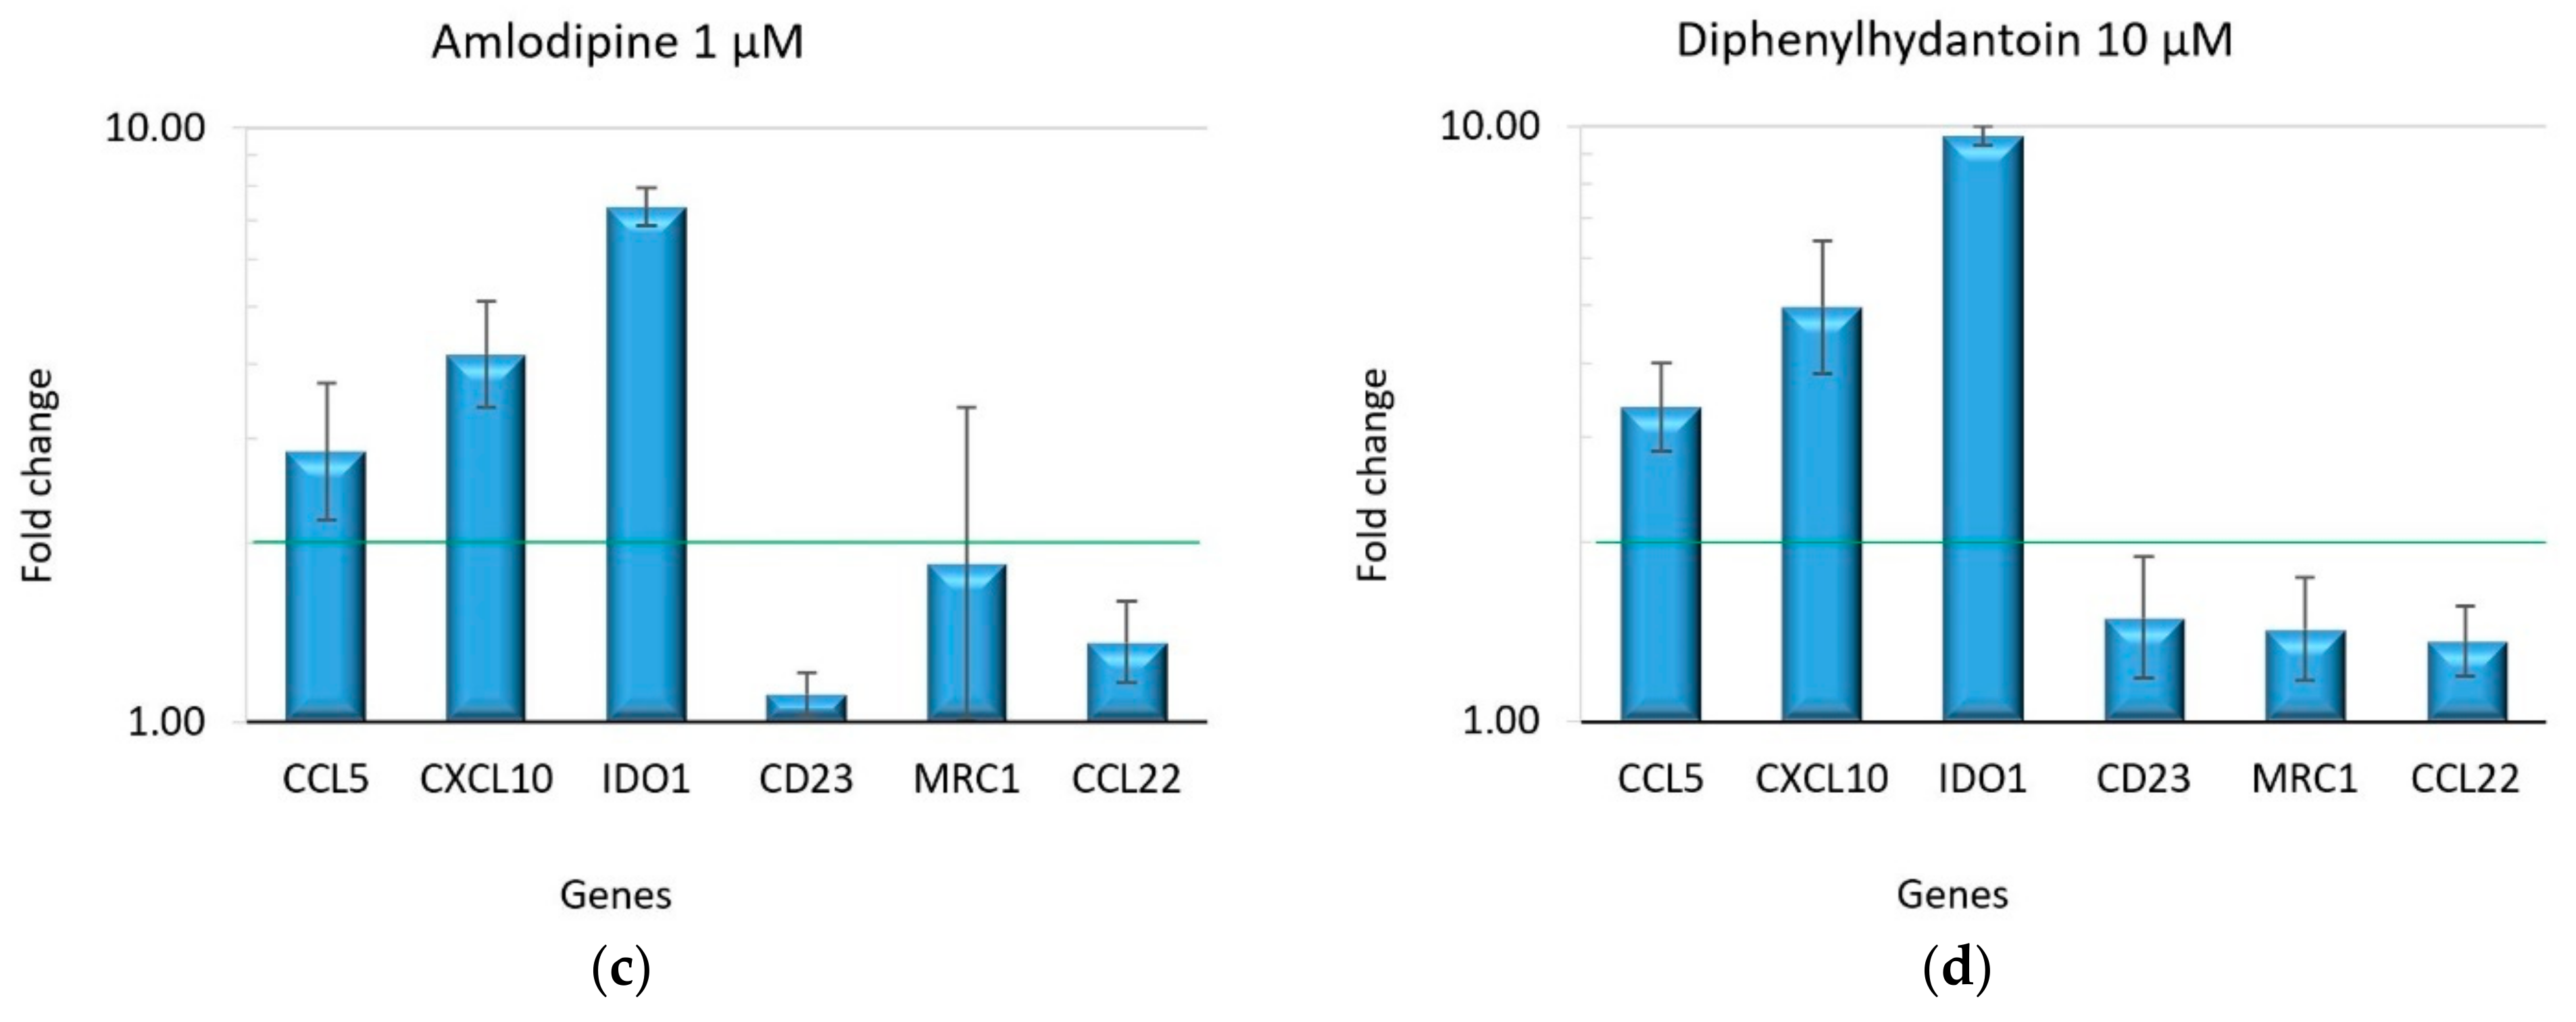
2.2. Effect of Drugs on Macrophage Polarization
3. Discussion
4. Materials and Methods
4.1. Isolation of Monocytes from Peripheral Blood, Differentiation into Macrophages and Their Polarization
4.2. Immunofluorescence
4.3. Cell Viability Assay
4.4. Treatment of Naïve Macrophages with Drugs
4.5. RNA Extraction and Reverse Transcription
4.6. Real-Time PCR Amplification
4.7. Statistical Analysis
5. Conclusions
Supplementary Materials
Author Contributions
Funding
Institutional Review Board Statement
Informed Consent Statement
Data Availability Statement
Acknowledgments
Conflicts of Interest
References
- Kimball, O.P. The Treatment of Epilepsy with Sodium Diphenyl Hydantoinate. J. Am. Med. Assoc. 1939, 112, 1244–1245. [Google Scholar] [CrossRef]
- Drozdzik, A.; Drozdzik, M. Drug-Induced Gingival Overgrowth-Molecular Aspects of Drug Actions. Int. J. Mol. Sci. 2023, 24, 5448. [Google Scholar] [CrossRef] [PubMed]
- Wang, Q.; Ji, C.; Smith, P.; McCulloch, C.A. Impact of TRP Channels on Extracellular Matrix Remodeling: Focus on TRPV4 and Collagen. Int. J. Mol. Sci. 2024, 25, 3566. [Google Scholar] [CrossRef]
- Sume, S.S.; Kantarci, A.; Lee, A.; Hasturk, H.; Trackman, P.C. Epithelial to mesenchymal transition in gingival overgrowth. Am. J. Pathol. 2010, 177, 208–218. [Google Scholar] [CrossRef]
- Chen, P.H.; Chuang, Y.T.; Huang, C.F.; Lu, H.K. Expression of epithelial-mesenchymal transition-associated proteins and proliferating cell nuclear antigen in dihydropyridine-induced gingival overgrowth fibroblasts: A preliminary study. J. Dent. Sci. 2023, 18, 551–559. [Google Scholar] [CrossRef]
- Kato, T.; Okahashi, N.; Kawai, S.; Kato, T.; Inaba, H.; Morisaki, I.; Amano, A. Impaired degradation of matrix collagen in human gingival fibroblasts by the antiepileptic drug phenytoin. J. Periodontol. 2005, 76, 941–950. [Google Scholar] [CrossRef] [PubMed]
- Plemons, J.M.; Dill, R.E.; Rees, T.D.; Dyer, B.J.; Ng, M.C.; Iacopino, A.M. PDGF-B producing cells and PDGF-B gene expression in normal gingival and cyclosporine A-induced gingival overgrowth. J. Periodontol. 1996, 67, 264–270. [Google Scholar] [CrossRef]
- Kose, K.N.; Yilmaz, S.; Noyan, U.; Kuru, B.; Yildirim, H.S.; Agrali, O.B.; Ozener, H.O.; Kuru, L. The gingival crevicular fluid levels of growth factors in patients with amlodipine-induced gingival overgrowth: A pilot study. Niger. J. Clin. Pract. 2020, 23, 561–567. [Google Scholar] [CrossRef]
- Brown, R.S.; Arany, P.R. Mechanism of drug-induced gingival overgrowth revisited: A unifying hypothesis. Oral Dis. 2015, 21, e51–e61. [Google Scholar] [CrossRef]
- Sabarudin, M.A.; Taib, H.; Wan Mohamad, W.M. Refining the Mechanism of Drug-Influenced Gingival Enlargement and Its Management. Cureus 2022, 14, e25009. [Google Scholar] [CrossRef]
- Hasturk, H.; Kantarci, A.; Van Dyke, T.E. Oral inflammatory diseases and systemic inflammation: Role of the macrophage. Front. Immunol. 2012, 3, 118. [Google Scholar] [CrossRef] [PubMed]
- Mantovani, A.; Biswas, S.K.; Galdiero, M.R.; Sica, A.; Locati, M. Macrophage plasticity and polarization in tissue repair and remodelling. J. Pathol. 2013, 229, 176–185. [Google Scholar] [CrossRef] [PubMed]
- Mills, C.D. M1 and M2 Macrophages: Oracles of Health and Disease. Crit. Rev. Immunol. 2012, 32, 463–488. [Google Scholar] [CrossRef]
- Martinez, F.O.; Sica, A.; Mantovani, A.; Locati, M. Macrophage activation and polarization. Front. Biosci. 2008, 13, 453–461. [Google Scholar] [CrossRef] [PubMed]
- Yu, Y.; Yue, Z.; Xu, M.; Zhang, M.; Shen, X.; Ma, Z.; Li, J.; Xie, X. Macrophages play a key role in tissue repair and regeneration. PeerJ 2022, 10, e14053. [Google Scholar] [CrossRef]
- Iacopino, A.M.; Doxey, D.; Cutler, C.W.; Nares, S.; Stoever, K.; Fojt, J.; Gonzales, A.; Dill, R.E. Phenytoin and cyclosporine A specifically regulate macrophage phenotype and expression of platelet-derived growth factor and interleukin-1 in vitro and in vivo: Possible molecular mechanism of drug-induced gingival hyperplasia. J. Periodontol. 1997, 68, 73–83. [Google Scholar] [CrossRef]
- Wright, H.J.; Chapple, I.L.; Cooper, P.; Matthews, J.B. Platelet-derived growth factor (PDGF) isoform and PDGF receptor expression in drug-induced gingival overgrowth and hereditary gingival fibrosis. Oral. Dis. 2006, 12, 315–323. [Google Scholar] [CrossRef]
- Sica, A.; Mantovani, A. Macrophage plasticity and polarization: In vivo veritas. J. Clin. Investig. 2012, 122, 787–795. [Google Scholar] [CrossRef]
- Novak, M.L.; Koh, T.J. Macrophage phenotypes during tissue repair. J. Leukoc. Biol. 2013, 93, 875–881. [Google Scholar] [CrossRef]
- Luo, M.; Zhao, F.; Cheng, H.; Su, M.; Wang, Y. Macrophage polarization: An important role in inflammatory diseases. Front. Immunol. 2024, 15, 1352946. [Google Scholar] [CrossRef]
- Dongari-Bagtzoglou, A.; Research, S.; Research, Science and Therapy Committee, American Academy of Periodontology. Drug-associated gingival enlargement. J. Periodontol. 2004, 75, 1424–1431. [Google Scholar] [CrossRef] [PubMed]
- Lafzi, A.; Farahani, R.M.; Shoja, M.A. Amlodipine-induced gingival hyperplasia. Med. Oral. Patol. Oral. Cir. Bucal 2006, 11, E480–E482. [Google Scholar]
- Jaguin, M.; Houlbert, N.; Fardel, O.; Lecureur, V. Polarization profiles of human M-CSF-generated macrophages and comparison of M1-markers in classically activated macrophages from GM-CSF and M-CSF origin. Cell. Immunol. 2013, 281, 51–61. [Google Scholar] [CrossRef]
- Martinez, F.O.; Gordon, S. The M1 and M2 paradigm of macrophage activation: Time for reassessment. F1000Prime Rep. 2014, 6, 13. [Google Scholar] [CrossRef] [PubMed]
- Bharti, V.; Bansal, C. Drug-induced gingival overgrowth: The nemesis of gingiva unravelled. J. Indian Soc. Periodontol. 2013, 17, 182–187. [Google Scholar] [CrossRef]
- Murakami, S.; Mealey, B.L.; Mariotti, A.; Chapple, I.L.C. Dental plaque-induced gingival conditions. J. Periodontol. 2018, 89 (Suppl. 1), S17–S27. [Google Scholar] [CrossRef] [PubMed]
- Trackman, P.C.; Kantarci, A. Molecular and clinical aspects of drug-induced gingival overgrowth. J. Dent. Res. 2015, 94, 540–546. [Google Scholar] [CrossRef] [PubMed]
- Newman, M.G.; Takei, H.; Klokkevold, P.R.; Carranza, F.A. The Role of Dental Calculus and Other Predisposing Factors. In Carranza’s Clinical Periodontology, 10th ed.; Elsevier: St. Louis, MO, USA, 2006; pp. 375–376. [Google Scholar]
- Imagawa, M.; Shinjo, T.; Sato, K.; Kawakami, K.; Zeze, T.; Nishimura, Y.; Toyoda, M.; Chen, S.; Ryo, N.; Ahmed, A.K.; et al. Epithelial-to-mesenchymal transition, inflammation, subsequent collagen production, and reduced proteinase expression cooperatively contribute to cyclosporin-A-induced gingival overgrowth development. Front. Physiol. 2023, 14, 1298813. [Google Scholar] [CrossRef]
- Hallmon, W.W.; Rossmann, J.A. The role of drugs in the pathogenesis of gingival overgrowth. A collective review of current concepts. Periodontol. 2000 1999, 21, 176–196. [Google Scholar] [CrossRef]
- Martin, K.E.; Garcia, A.J. Macrophage phenotypes in tissue repair and the foreign body response: Implications for biomaterial-based regenerative medicine strategies. Acta Biomater. 2021, 133, 4–16. [Google Scholar] [CrossRef]
- Kamemoto, A.; Ara, T.; Hattori, T.; Fujinami, Y.; Imamura, Y.; Wang, P.L. Macrolide antibiotics like azithromycin increase lipopolysaccharide-induced IL-8 production by human gingival fibroblasts. Eur. J. Med. Res. 2009, 14, 309–314. [Google Scholar] [CrossRef] [PubMed]
- Assaggaf, M.A.; Kantarci, A.; Sume, S.S.; Trackman, P.C. Prevention of phenytoin-induced gingival overgrowth by lovastatin in mice. Am. J. Pathol. 2015, 185, 1588–1599. [Google Scholar] [CrossRef] [PubMed]
- Wang, Y.; Smith, W.; Hao, D.; He, B.; Kong, L. M1 and M2 macrophage polarization and potentially therapeutic naturally occurring compounds. Int. Immunopharmacol. 2019, 70, 459–466. [Google Scholar] [CrossRef] [PubMed]
- Livak, K.J.; Schmittgen, T.D. Analysis of relative gene expression data using real-time quantitative PCR and the 2(-Delta Delta C(T)) Method. Methods 2001, 25, 402–408. [Google Scholar] [CrossRef]

| Gene | Primer Forward 5′-3′ | Primer Reverse 5′-3′ | Probe 5′-3′ |
|---|---|---|---|
| IDO1 | CAGCTTCGAGAAAGAGTTTGATGA | CTTTCACGTTCTTTGTTCTCAGGT | TGCCTGTGAGTCCGATTTCTGAGGCTGA—FAM |
| CXCL10 | AGCCTCTGTGTGGTCCAT | TCGAAGGCCATCAAGAATTTA | ACTGCATCGATTTTGCTCCCCTCTGGT—FAM |
| CCL5 | GCAAGTCTGGCAGGATTTCC | ACACACTTGGCGGTTCTTTC | TGACTCCCGGCTGAACAAGGGCAA—FAM |
| Gene | Primer Forward 5′-3′ | Primer Reverse 5′-3′ | Probe 5′-3′ |
|---|---|---|---|
| CCL22 | TGGCGCTTCAAGCAACTG | TAGAAGTGTTTCACCACGCG | GCGTCTGCTGCCGTGATTACGTCC—FAM |
| MRC1 | TCGAGGAAGAGGTTCGGTTC | CTCCAATCCCGGTTCTCATG | CCCACTGGAATTCAGTATGCCAGGGCG—FAM |
| CD23 | TATGCCTGTGACGACATGGA | GCATGCGTCAGGAAGTC | CTGGTCAGCATCCACAGCCCGGAG—FAM |
Disclaimer/Publisher’s Note: The statements, opinions and data contained in all publications are solely those of the individual author(s) and contributor(s) and not of MDPI and/or the editor(s). MDPI and/or the editor(s) disclaim responsibility for any injury to people or property resulting from any ideas, methods, instructions or products referred to in the content. |
© 2024 by the authors. Licensee MDPI, Basel, Switzerland. This article is an open access article distributed under the terms and conditions of the Creative Commons Attribution (CC BY) license (https://creativecommons.org/licenses/by/4.0/).
Share and Cite
Palmieri, A.; Pellati, A.; Lauritano, D.; Lucchese, A.; Carinci, F.; Scapoli, L.; Martinelli, M. Drugs That Induce Gingival Overgrowth Drive the Pro-Inflammatory Polarization of Macrophages In Vitro. Int. J. Mol. Sci. 2024, 25, 11441. https://doi.org/10.3390/ijms252111441
Palmieri A, Pellati A, Lauritano D, Lucchese A, Carinci F, Scapoli L, Martinelli M. Drugs That Induce Gingival Overgrowth Drive the Pro-Inflammatory Polarization of Macrophages In Vitro. International Journal of Molecular Sciences. 2024; 25(21):11441. https://doi.org/10.3390/ijms252111441
Chicago/Turabian StylePalmieri, Annalisa, Agnese Pellati, Dorina Lauritano, Alberta Lucchese, Francesco Carinci, Luca Scapoli, and Marcella Martinelli. 2024. "Drugs That Induce Gingival Overgrowth Drive the Pro-Inflammatory Polarization of Macrophages In Vitro" International Journal of Molecular Sciences 25, no. 21: 11441. https://doi.org/10.3390/ijms252111441
APA StylePalmieri, A., Pellati, A., Lauritano, D., Lucchese, A., Carinci, F., Scapoli, L., & Martinelli, M. (2024). Drugs That Induce Gingival Overgrowth Drive the Pro-Inflammatory Polarization of Macrophages In Vitro. International Journal of Molecular Sciences, 25(21), 11441. https://doi.org/10.3390/ijms252111441