
Origin of Elevated S-Glutathionylated GAPDH in Chronic Neurodegenerative Diseases


Abstract
1. Introduction
2. Results
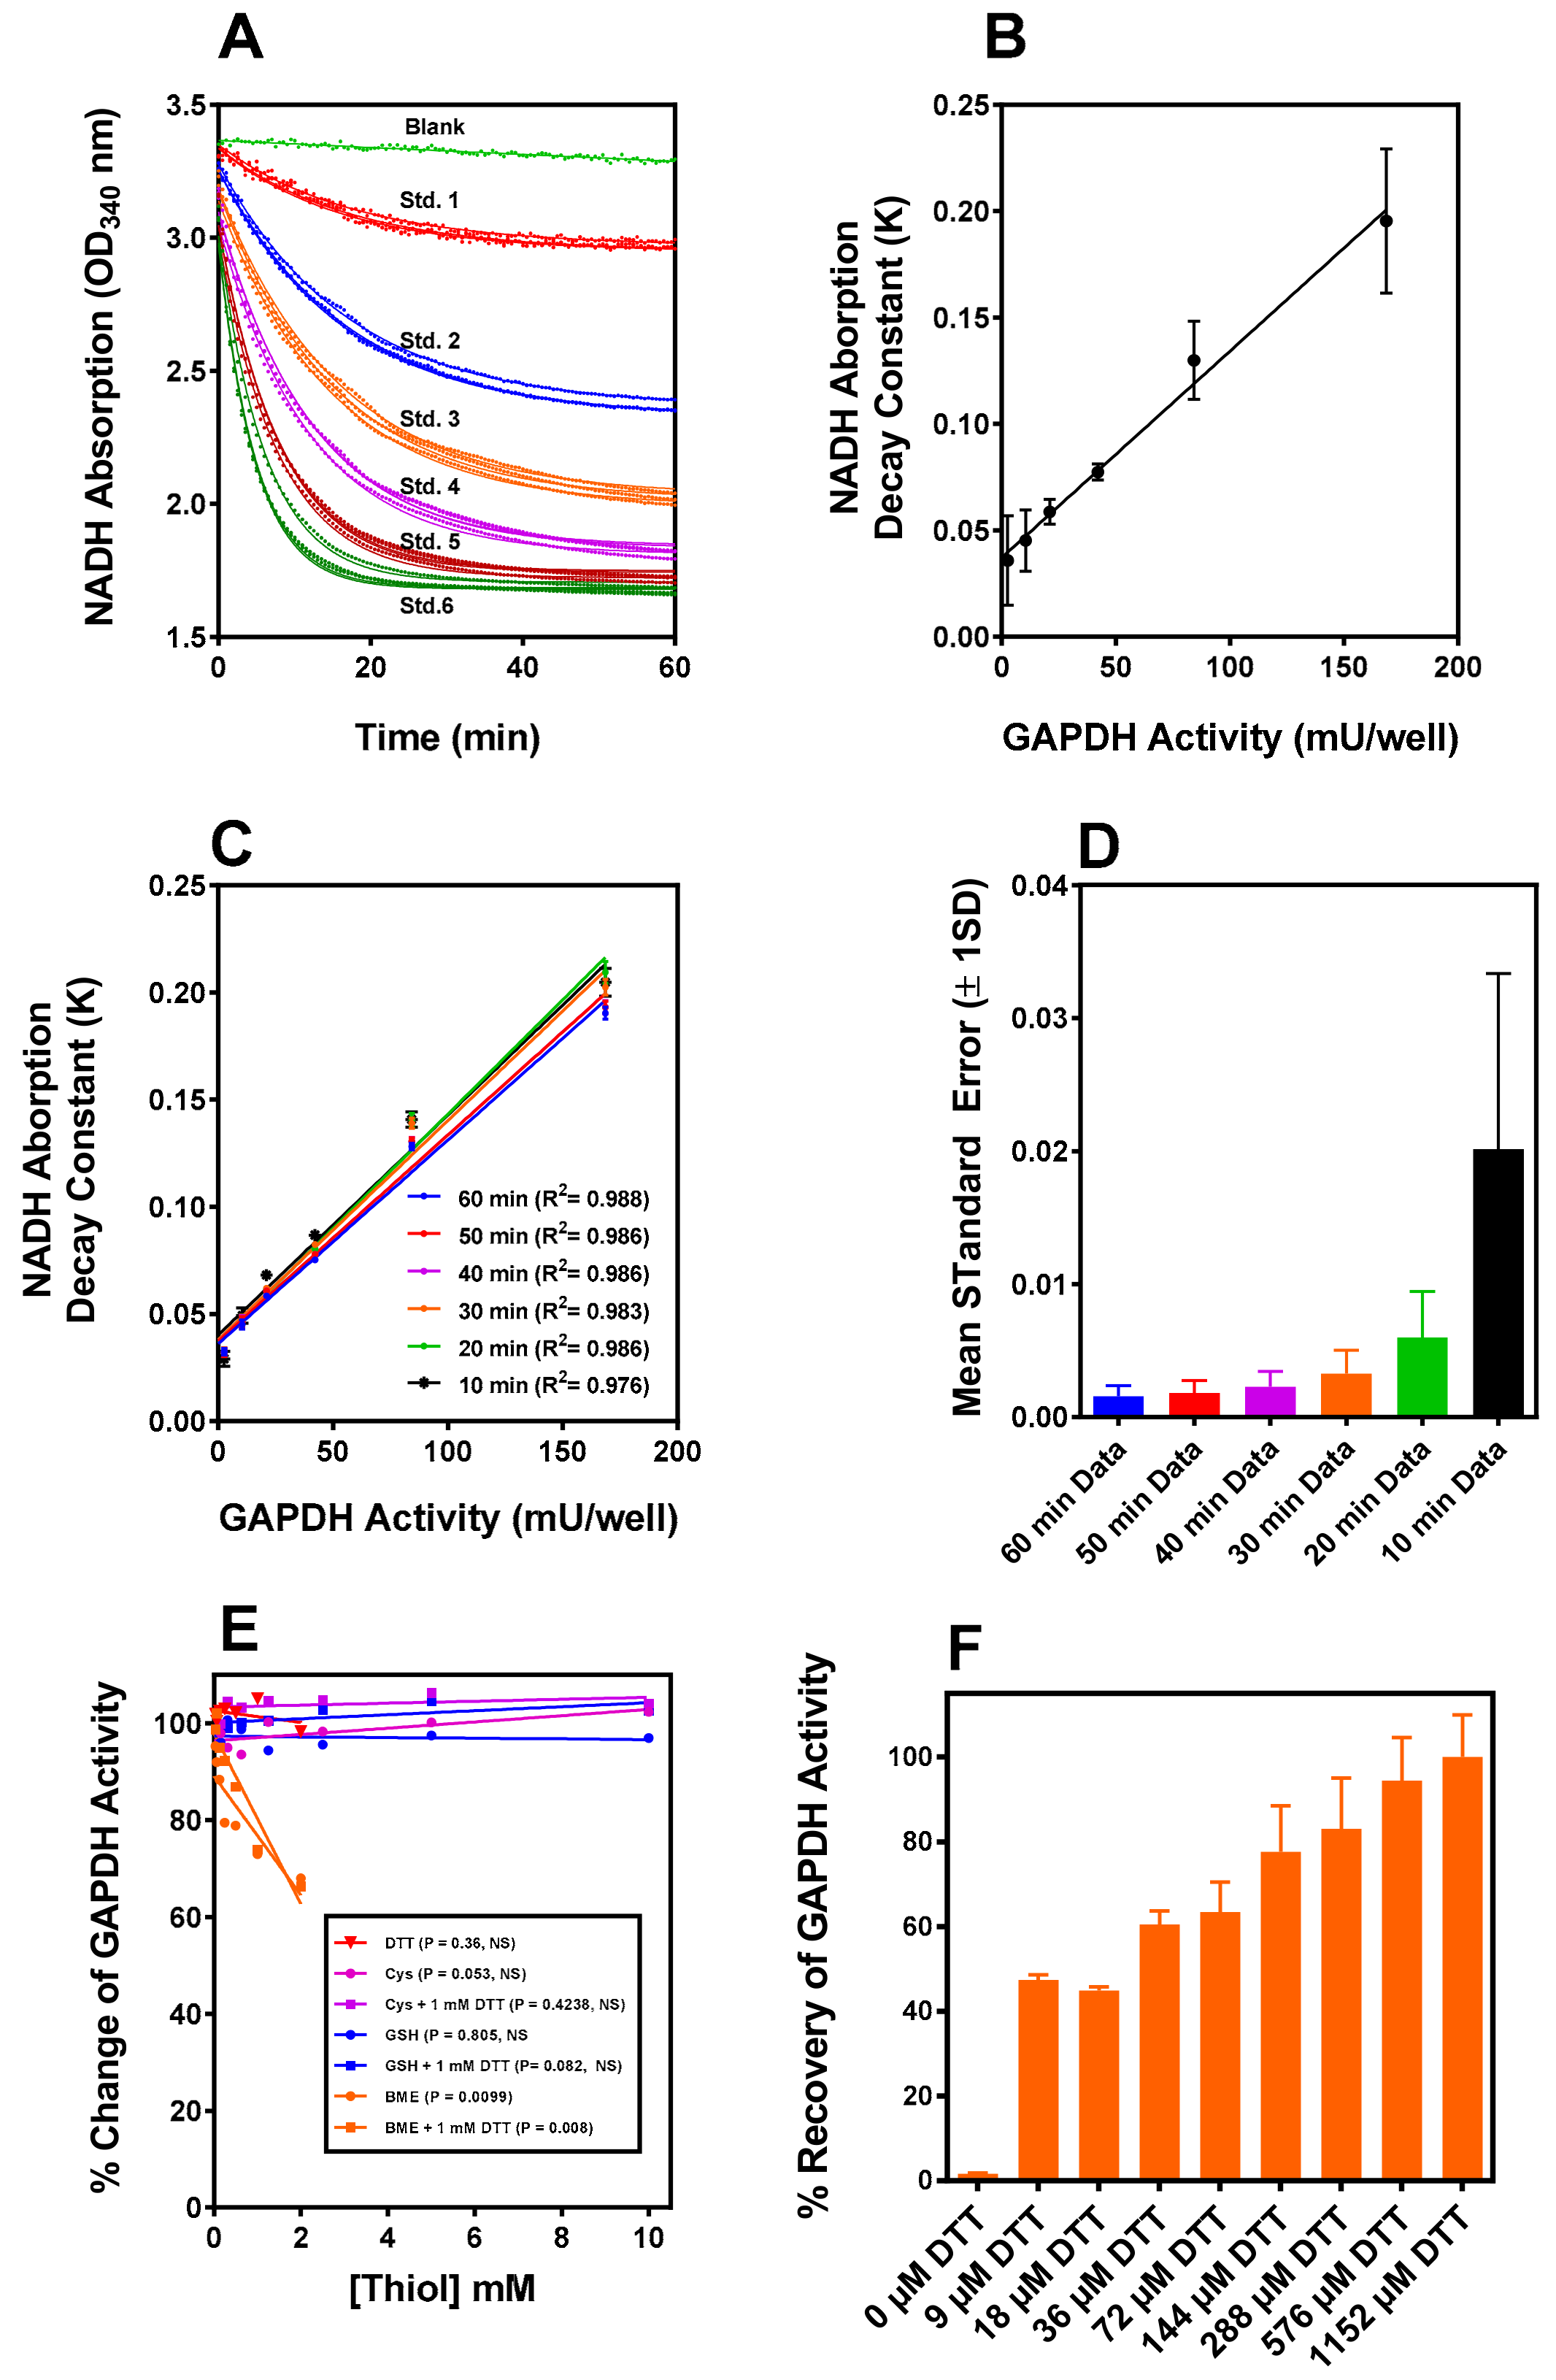
2.1. GAPDH Assay
2.2. Iodosobenzoic Acid (IOB) Oxidation of GAPDH
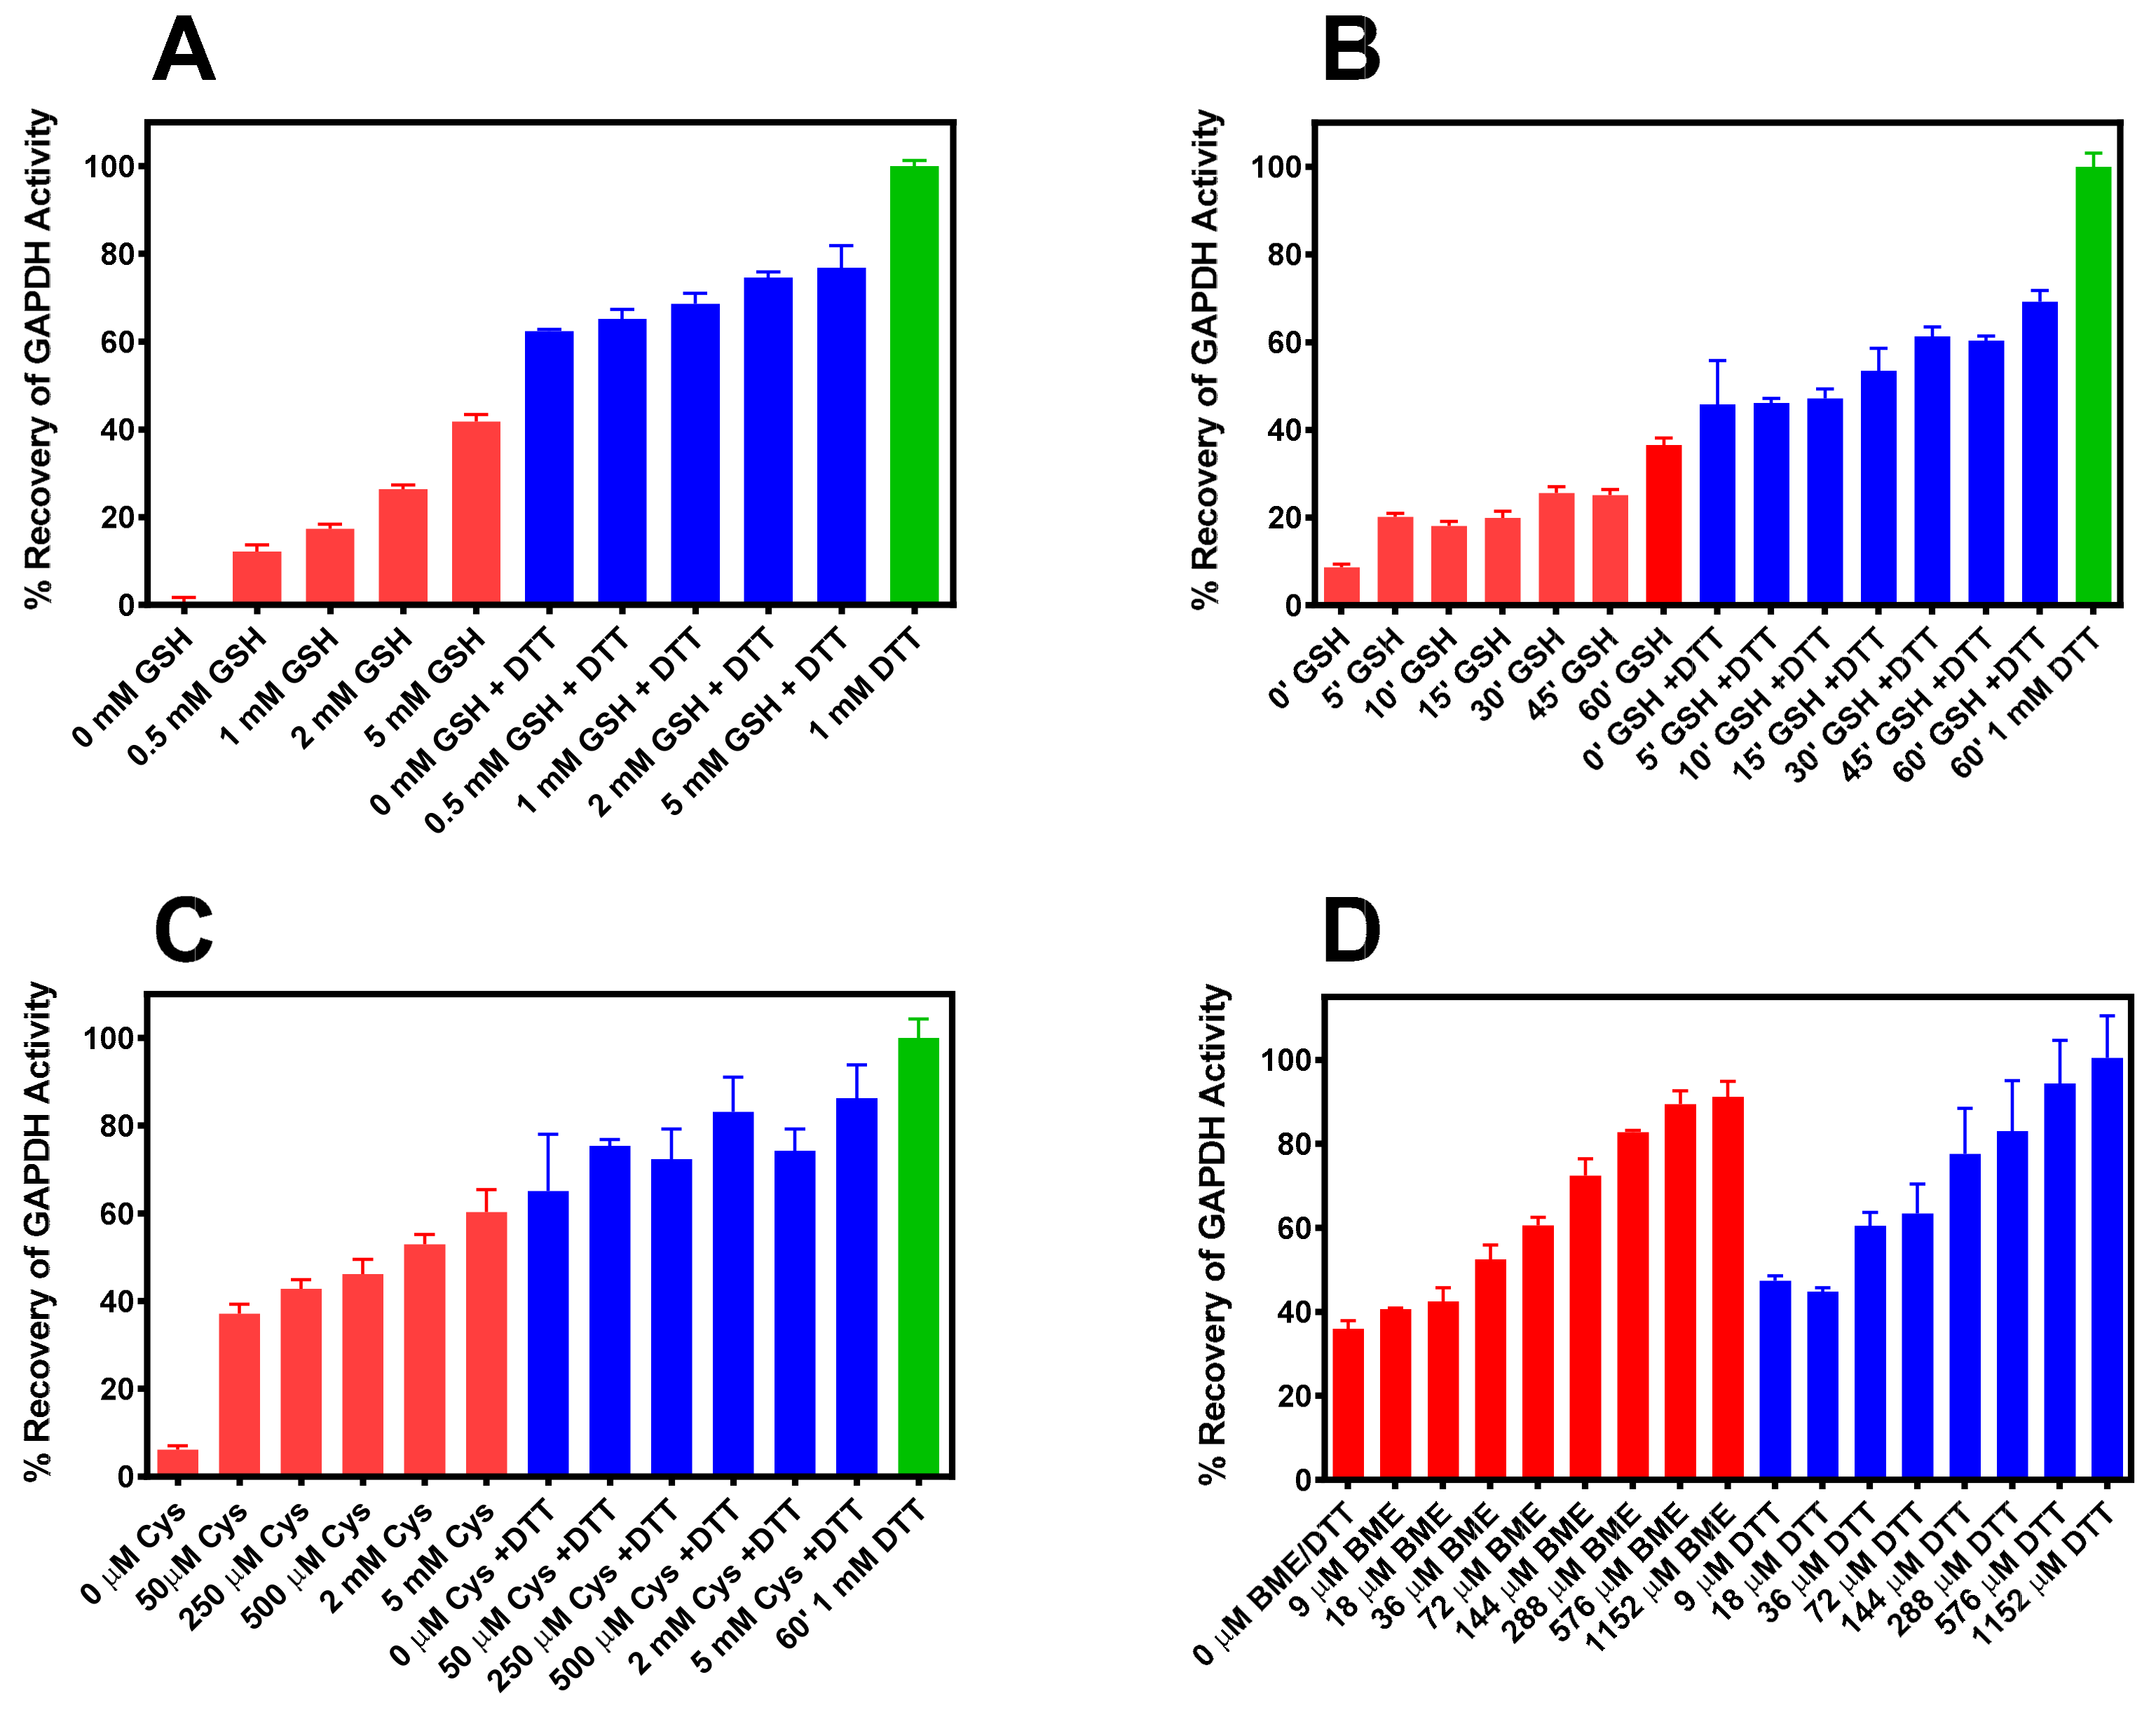
2.3. Reaction of IOB-Oxidized GAPDH with G(SH)
2.4. Reaction of IOB-Oxidized GAPDH with Cysteine
2.5. Reaction of IOB-Oxidized GAPDH with BME and DTT
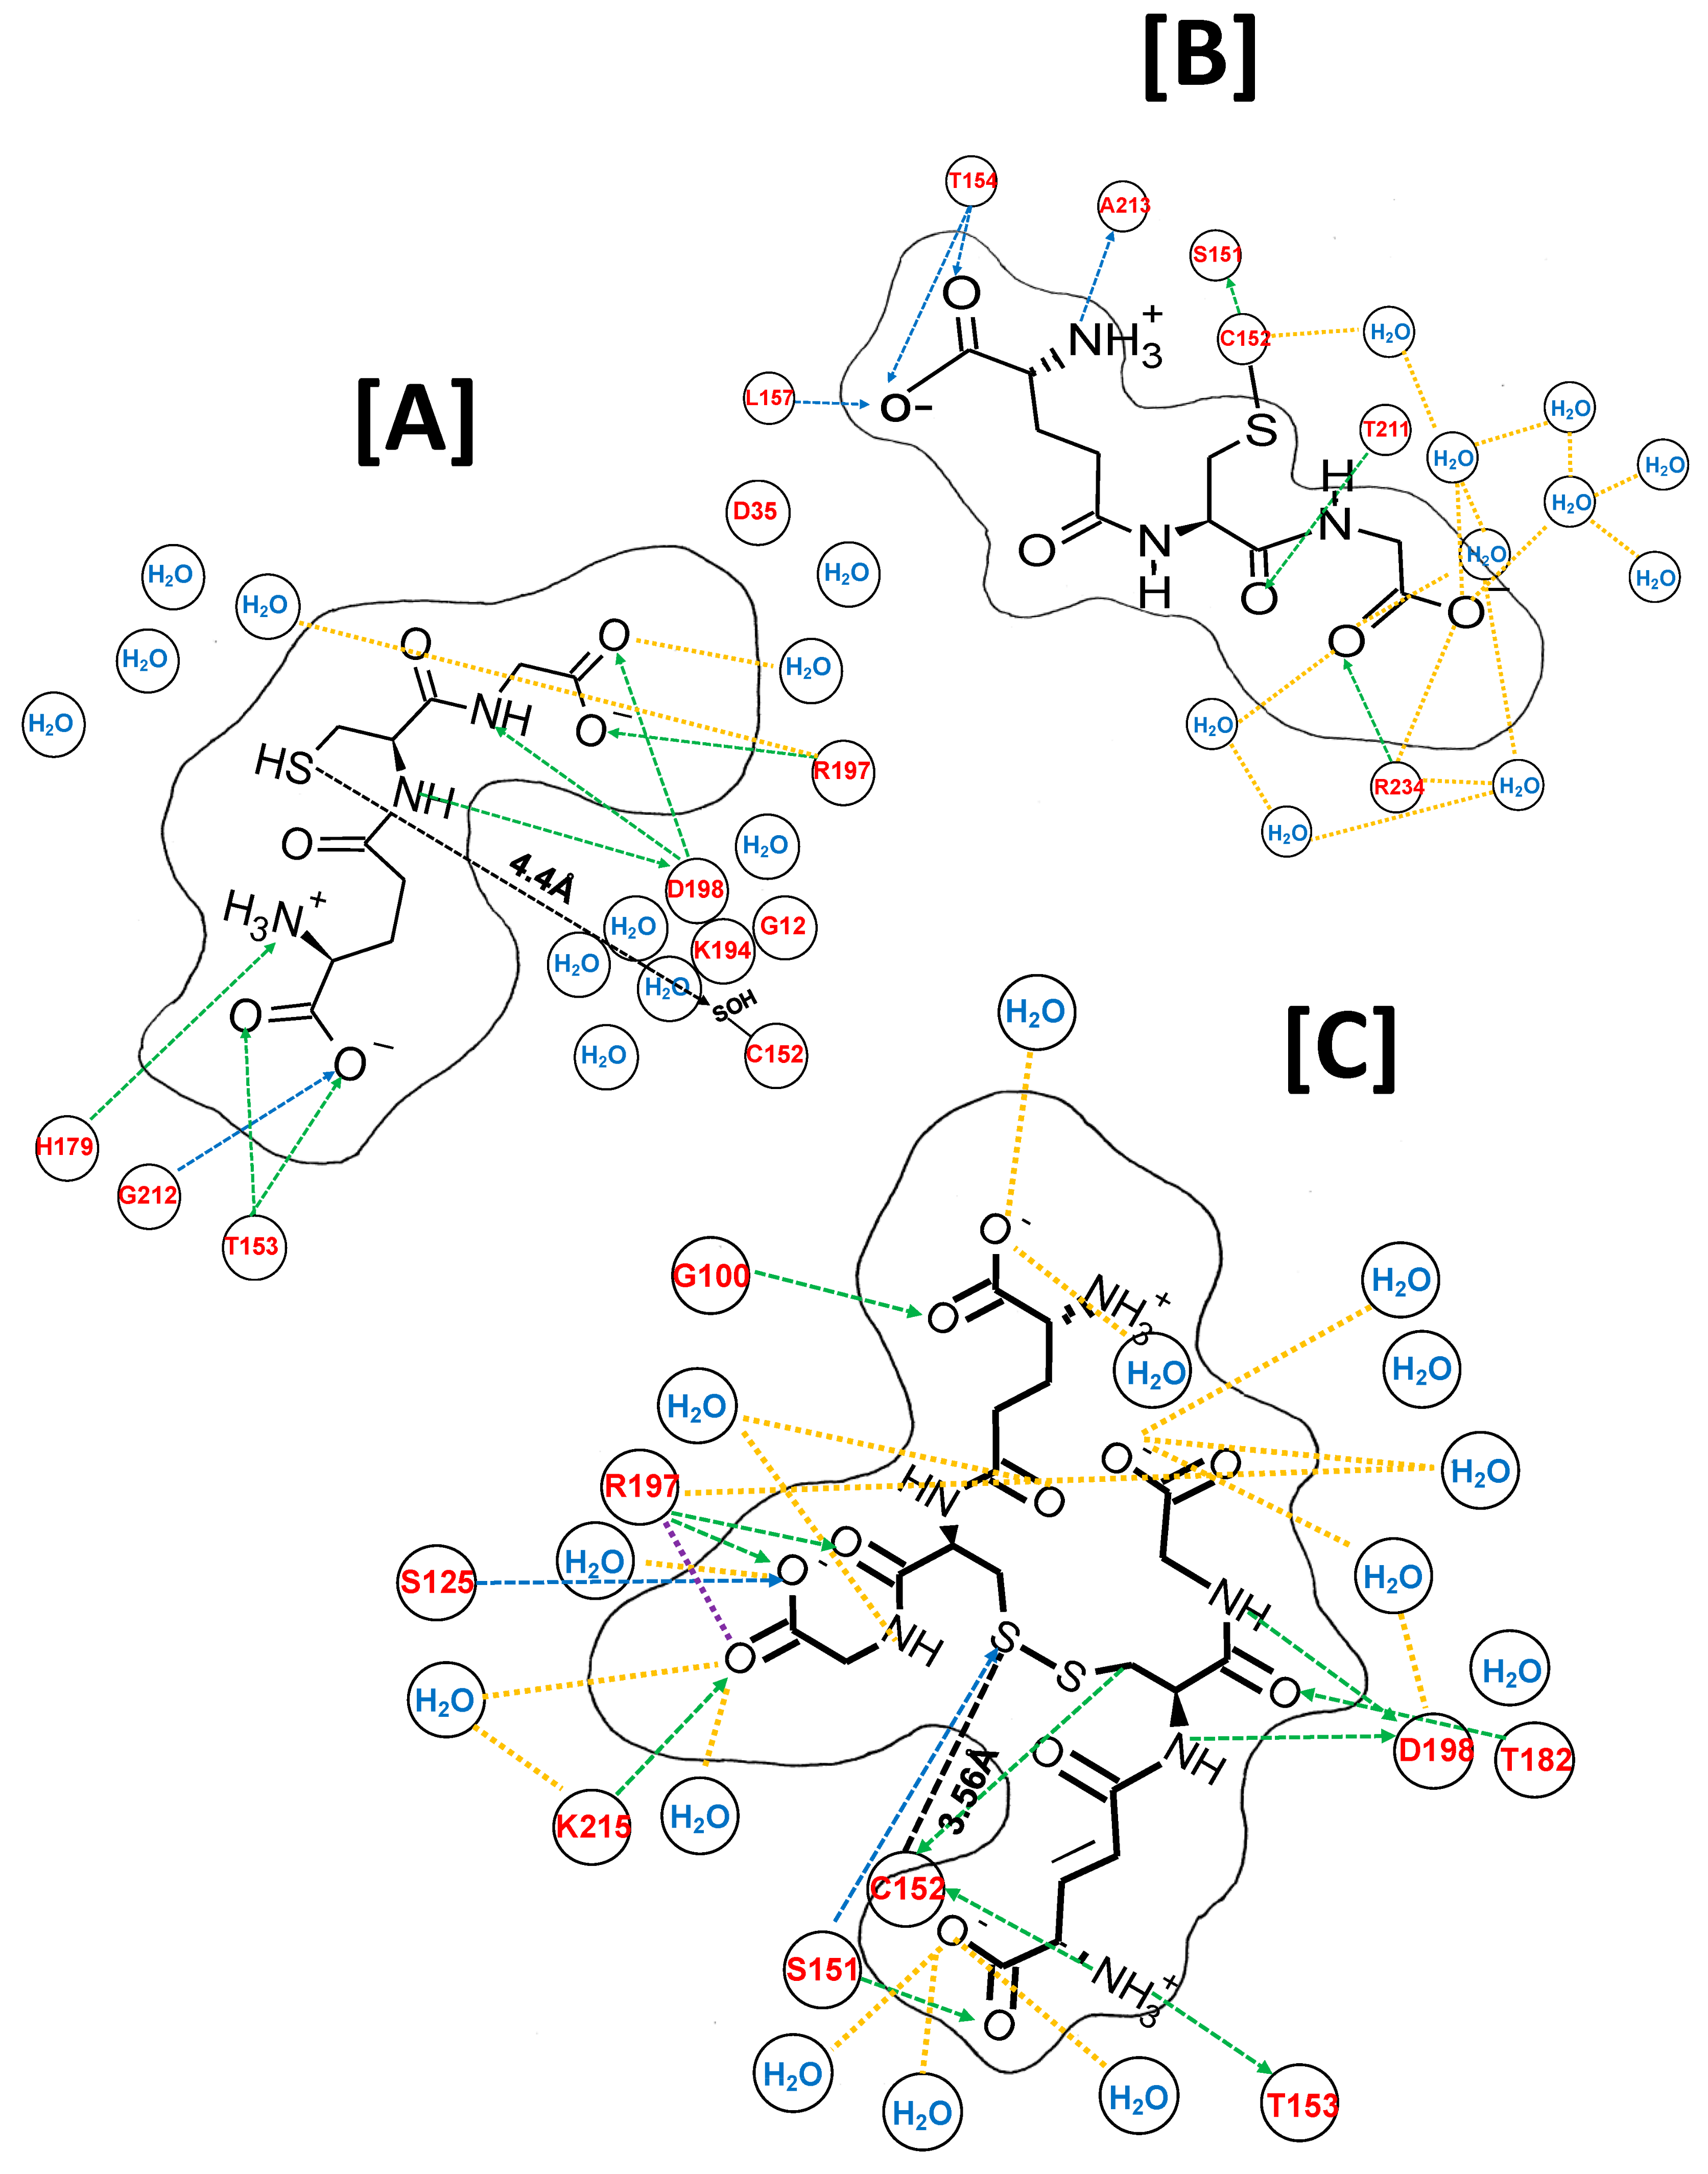
2.6. Molecular Dynamic Simulations of G(SH) Docking in the Active Site of Oxidized GAPDH
2.7. Molecular Dynamic Simulations of Atomic Interactions of S-Glutathione within the Active Site
2.8. Molecular Dynamic Simulations of the Atomic Interactions within the Active Site after Introducing a Second Molecule of G(SH)
2.9. Molecular Dynamic Simulations of the Atomic Interactions within the Active Site after Breaking the GAPDH S-Glutathione Mixed Disulfide Bond and Formation of Cystine (G(SS)G
2.10. Molecular Dynamic Simulations of Cysteine Docking in the Active Site of Oxidized GAPD
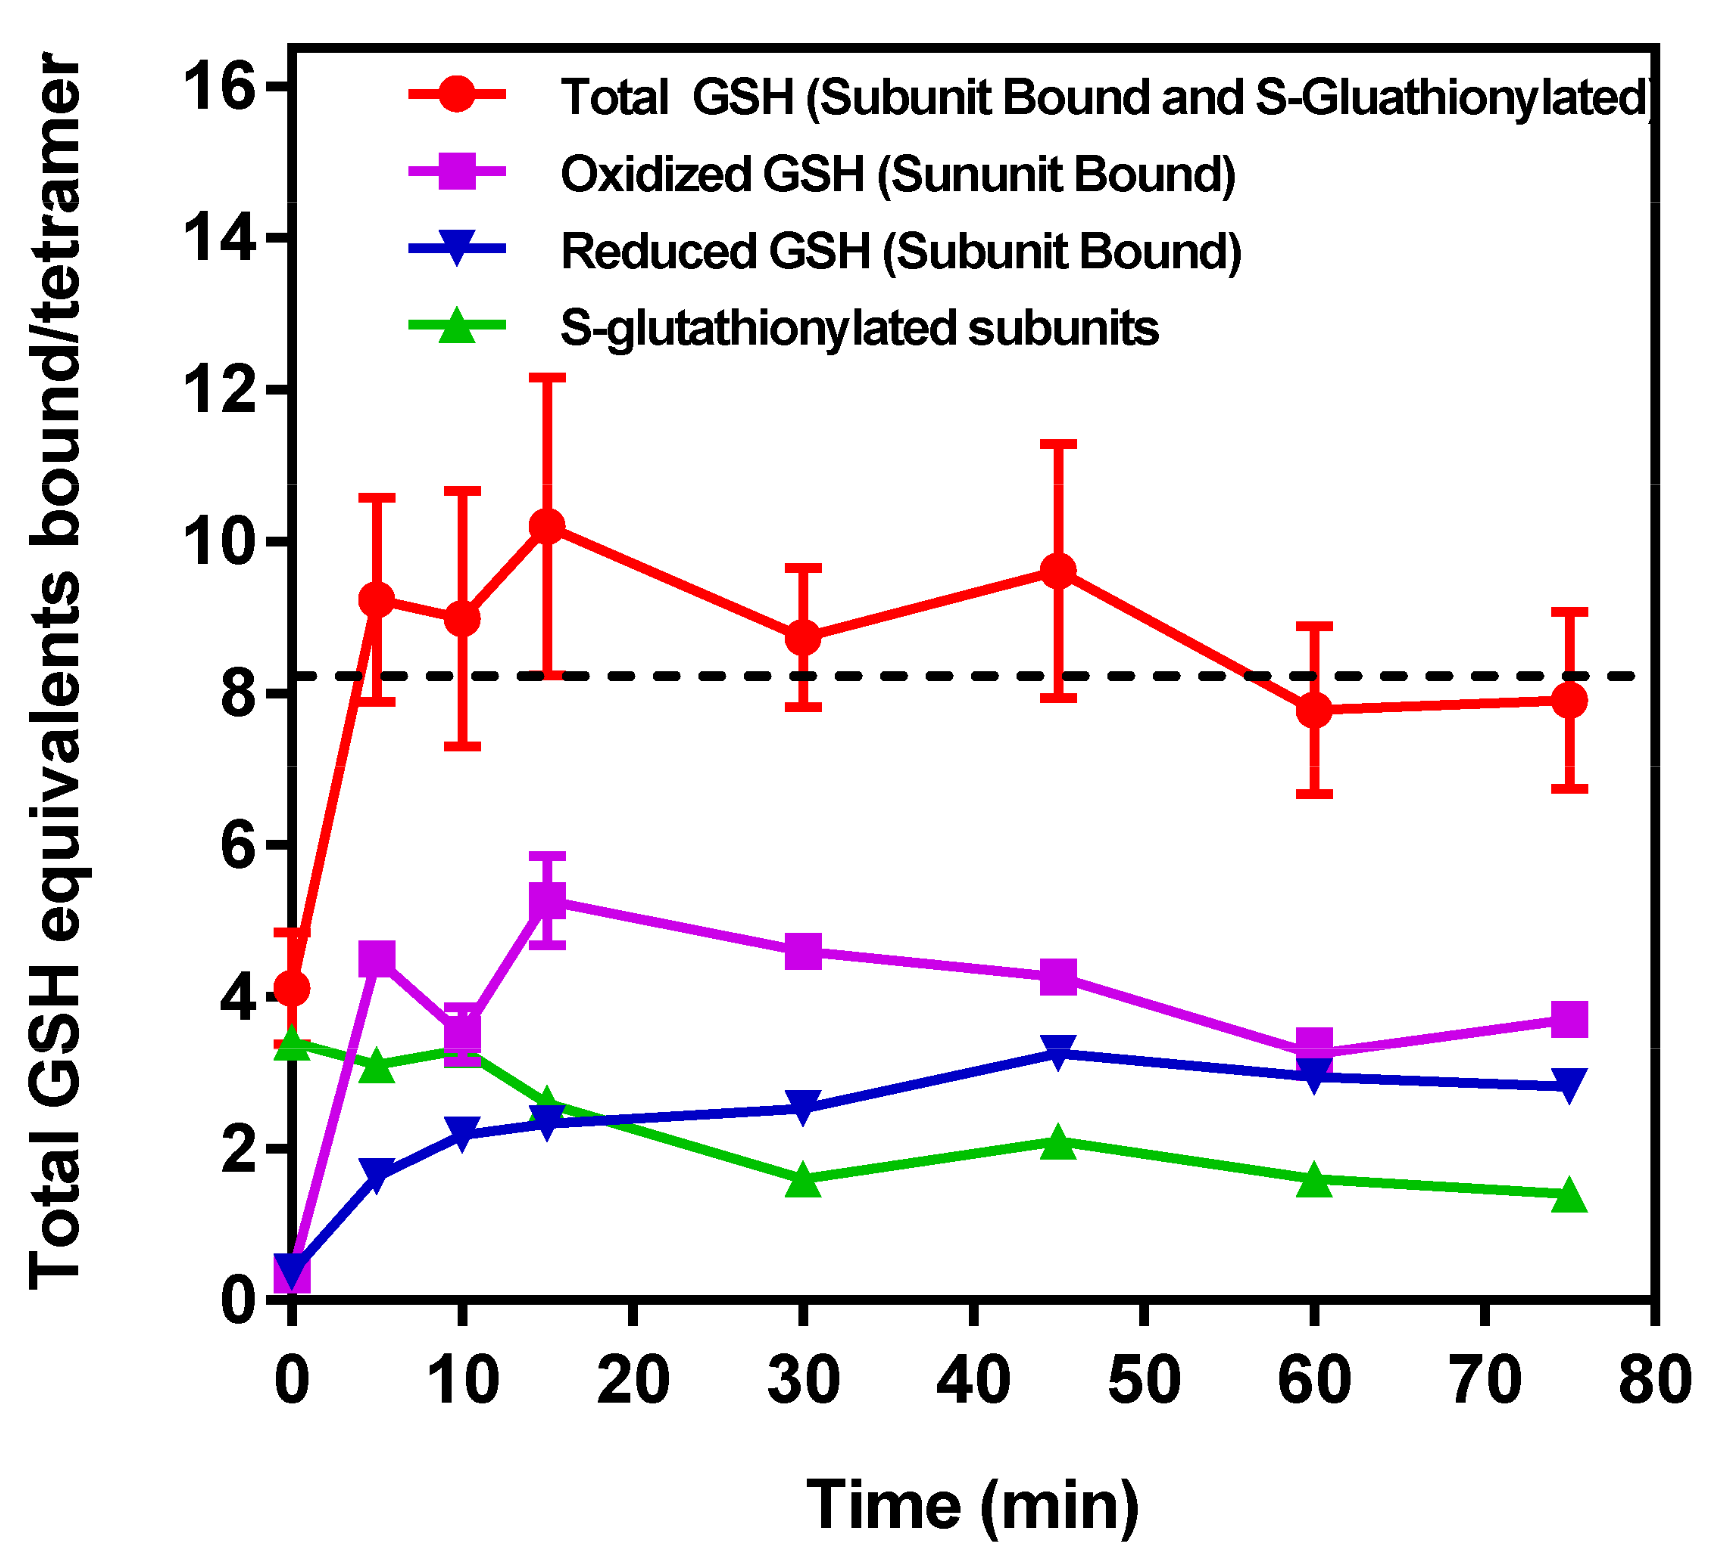
2.11. Measurement of Time-Dependent S-glutathionylated and Non-Covalently Bound G(SH) and G(SS)G to GAPDH
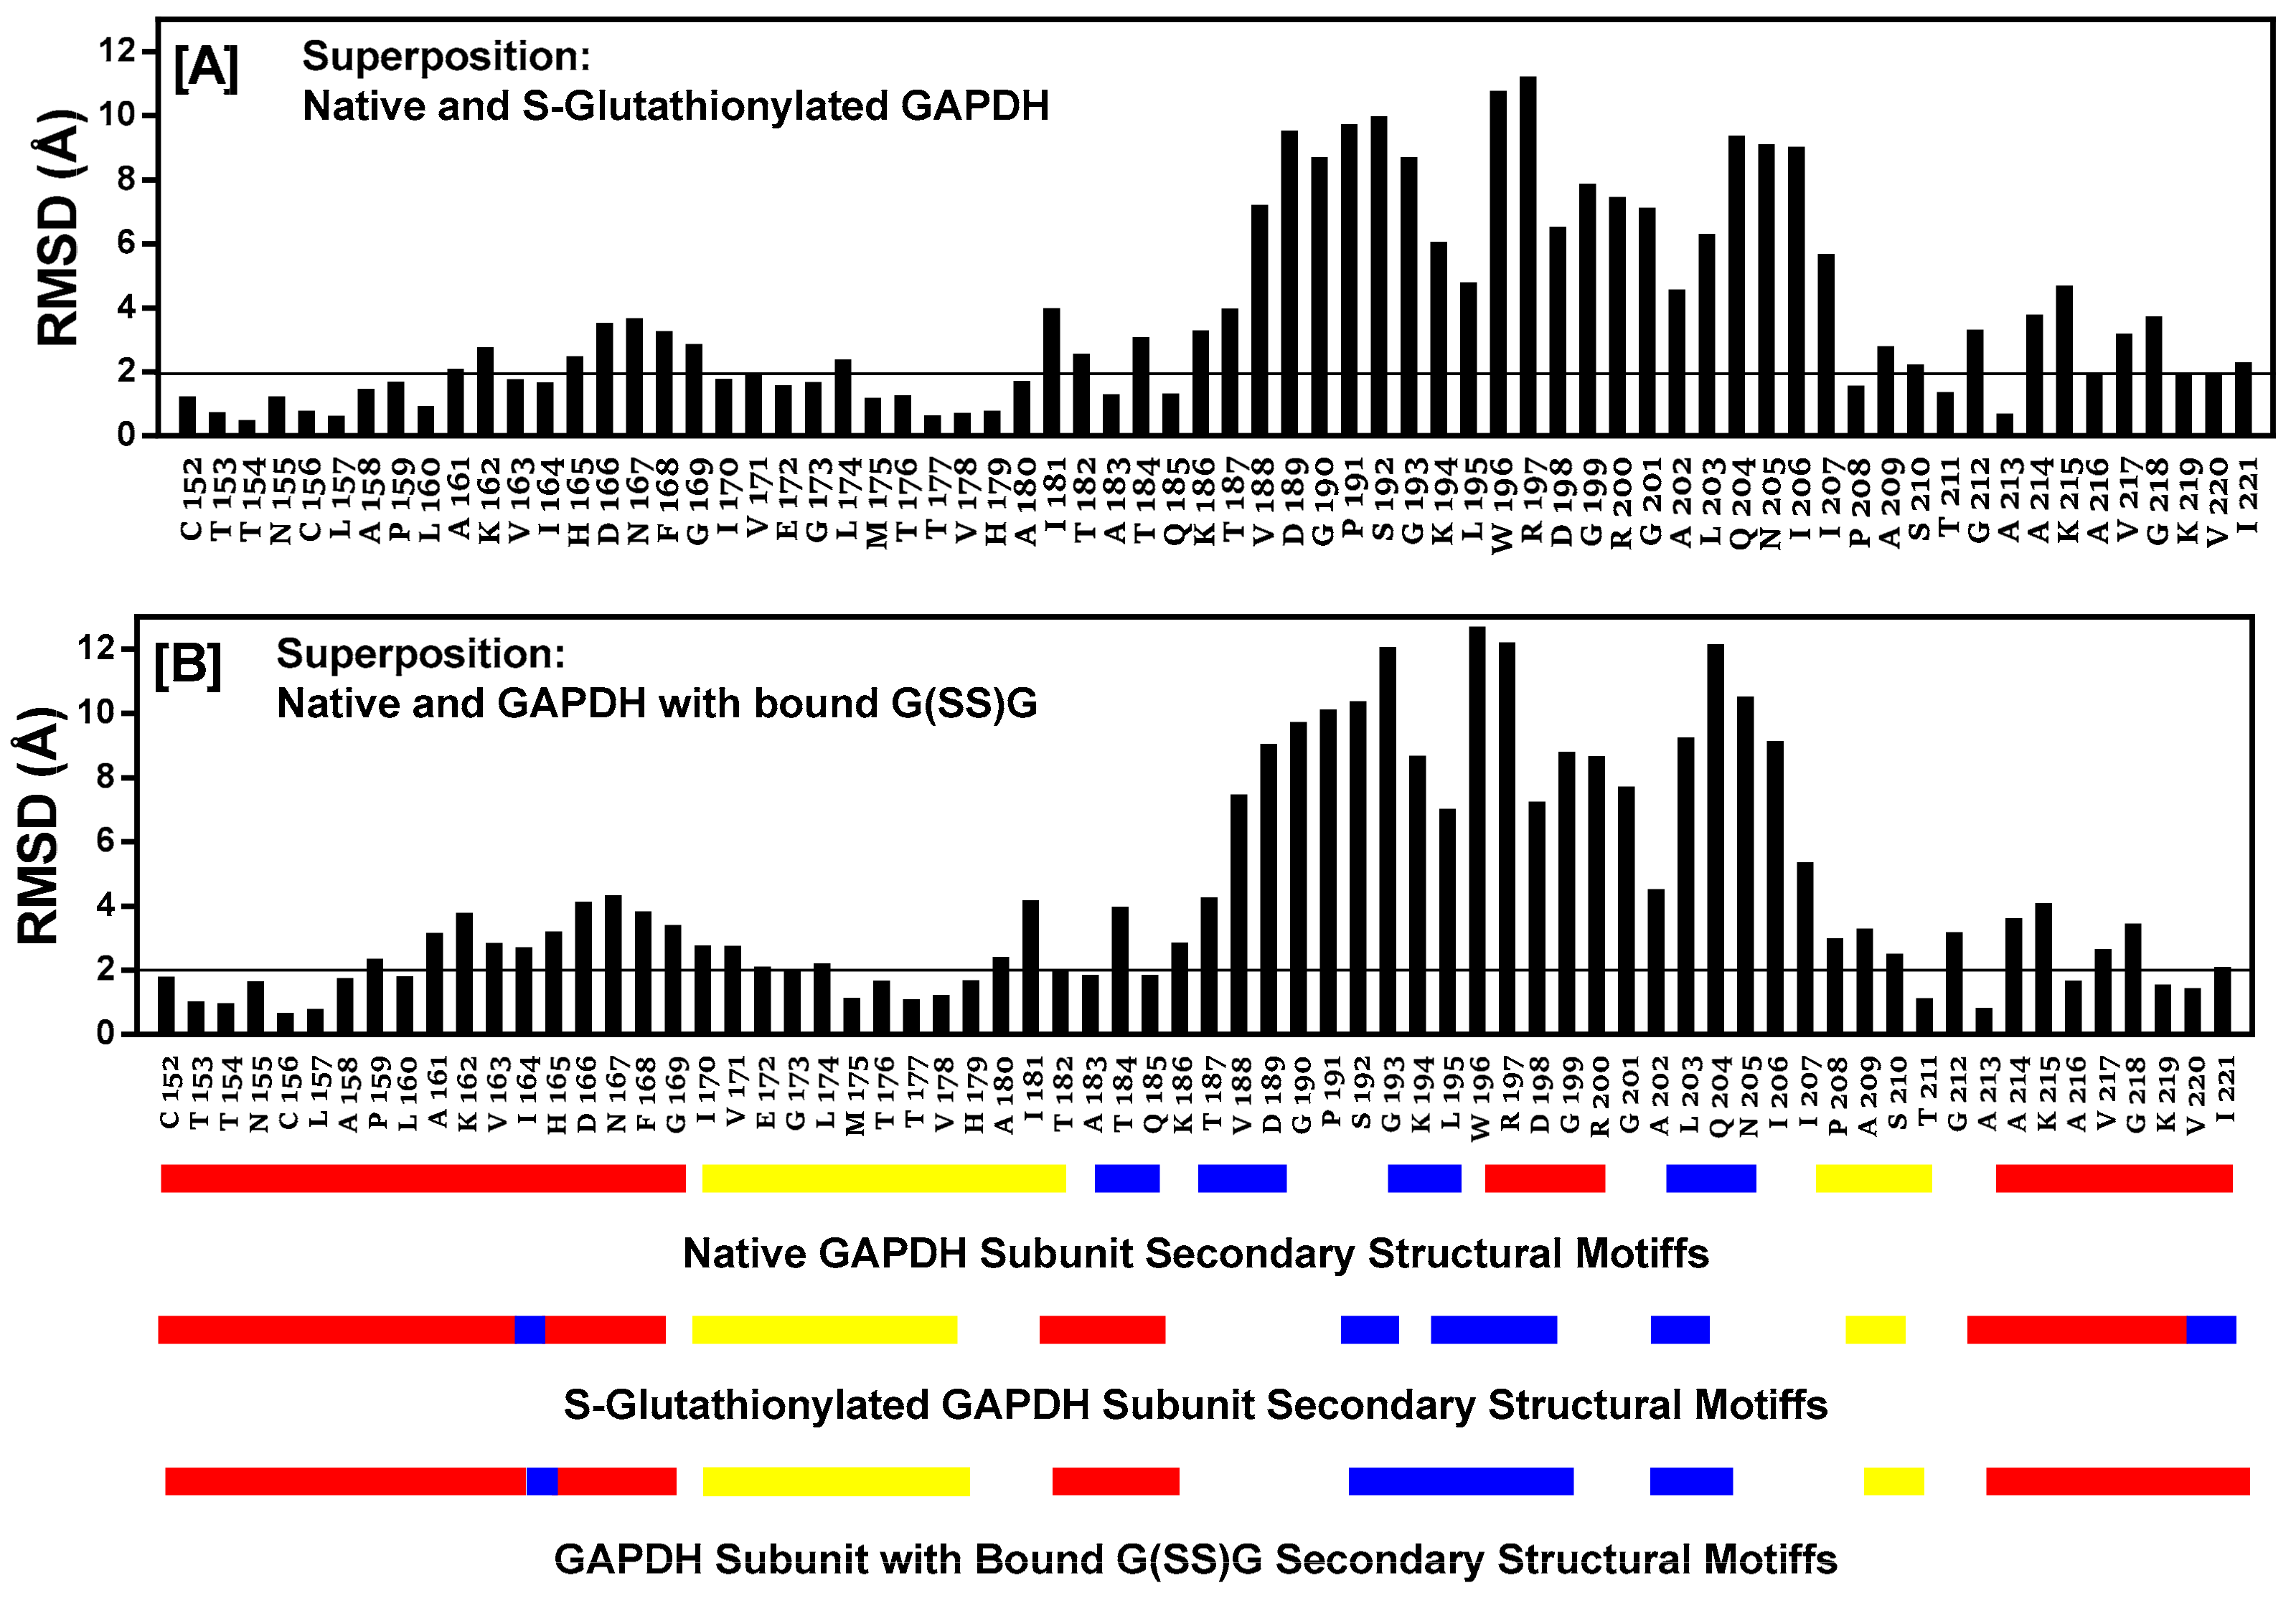
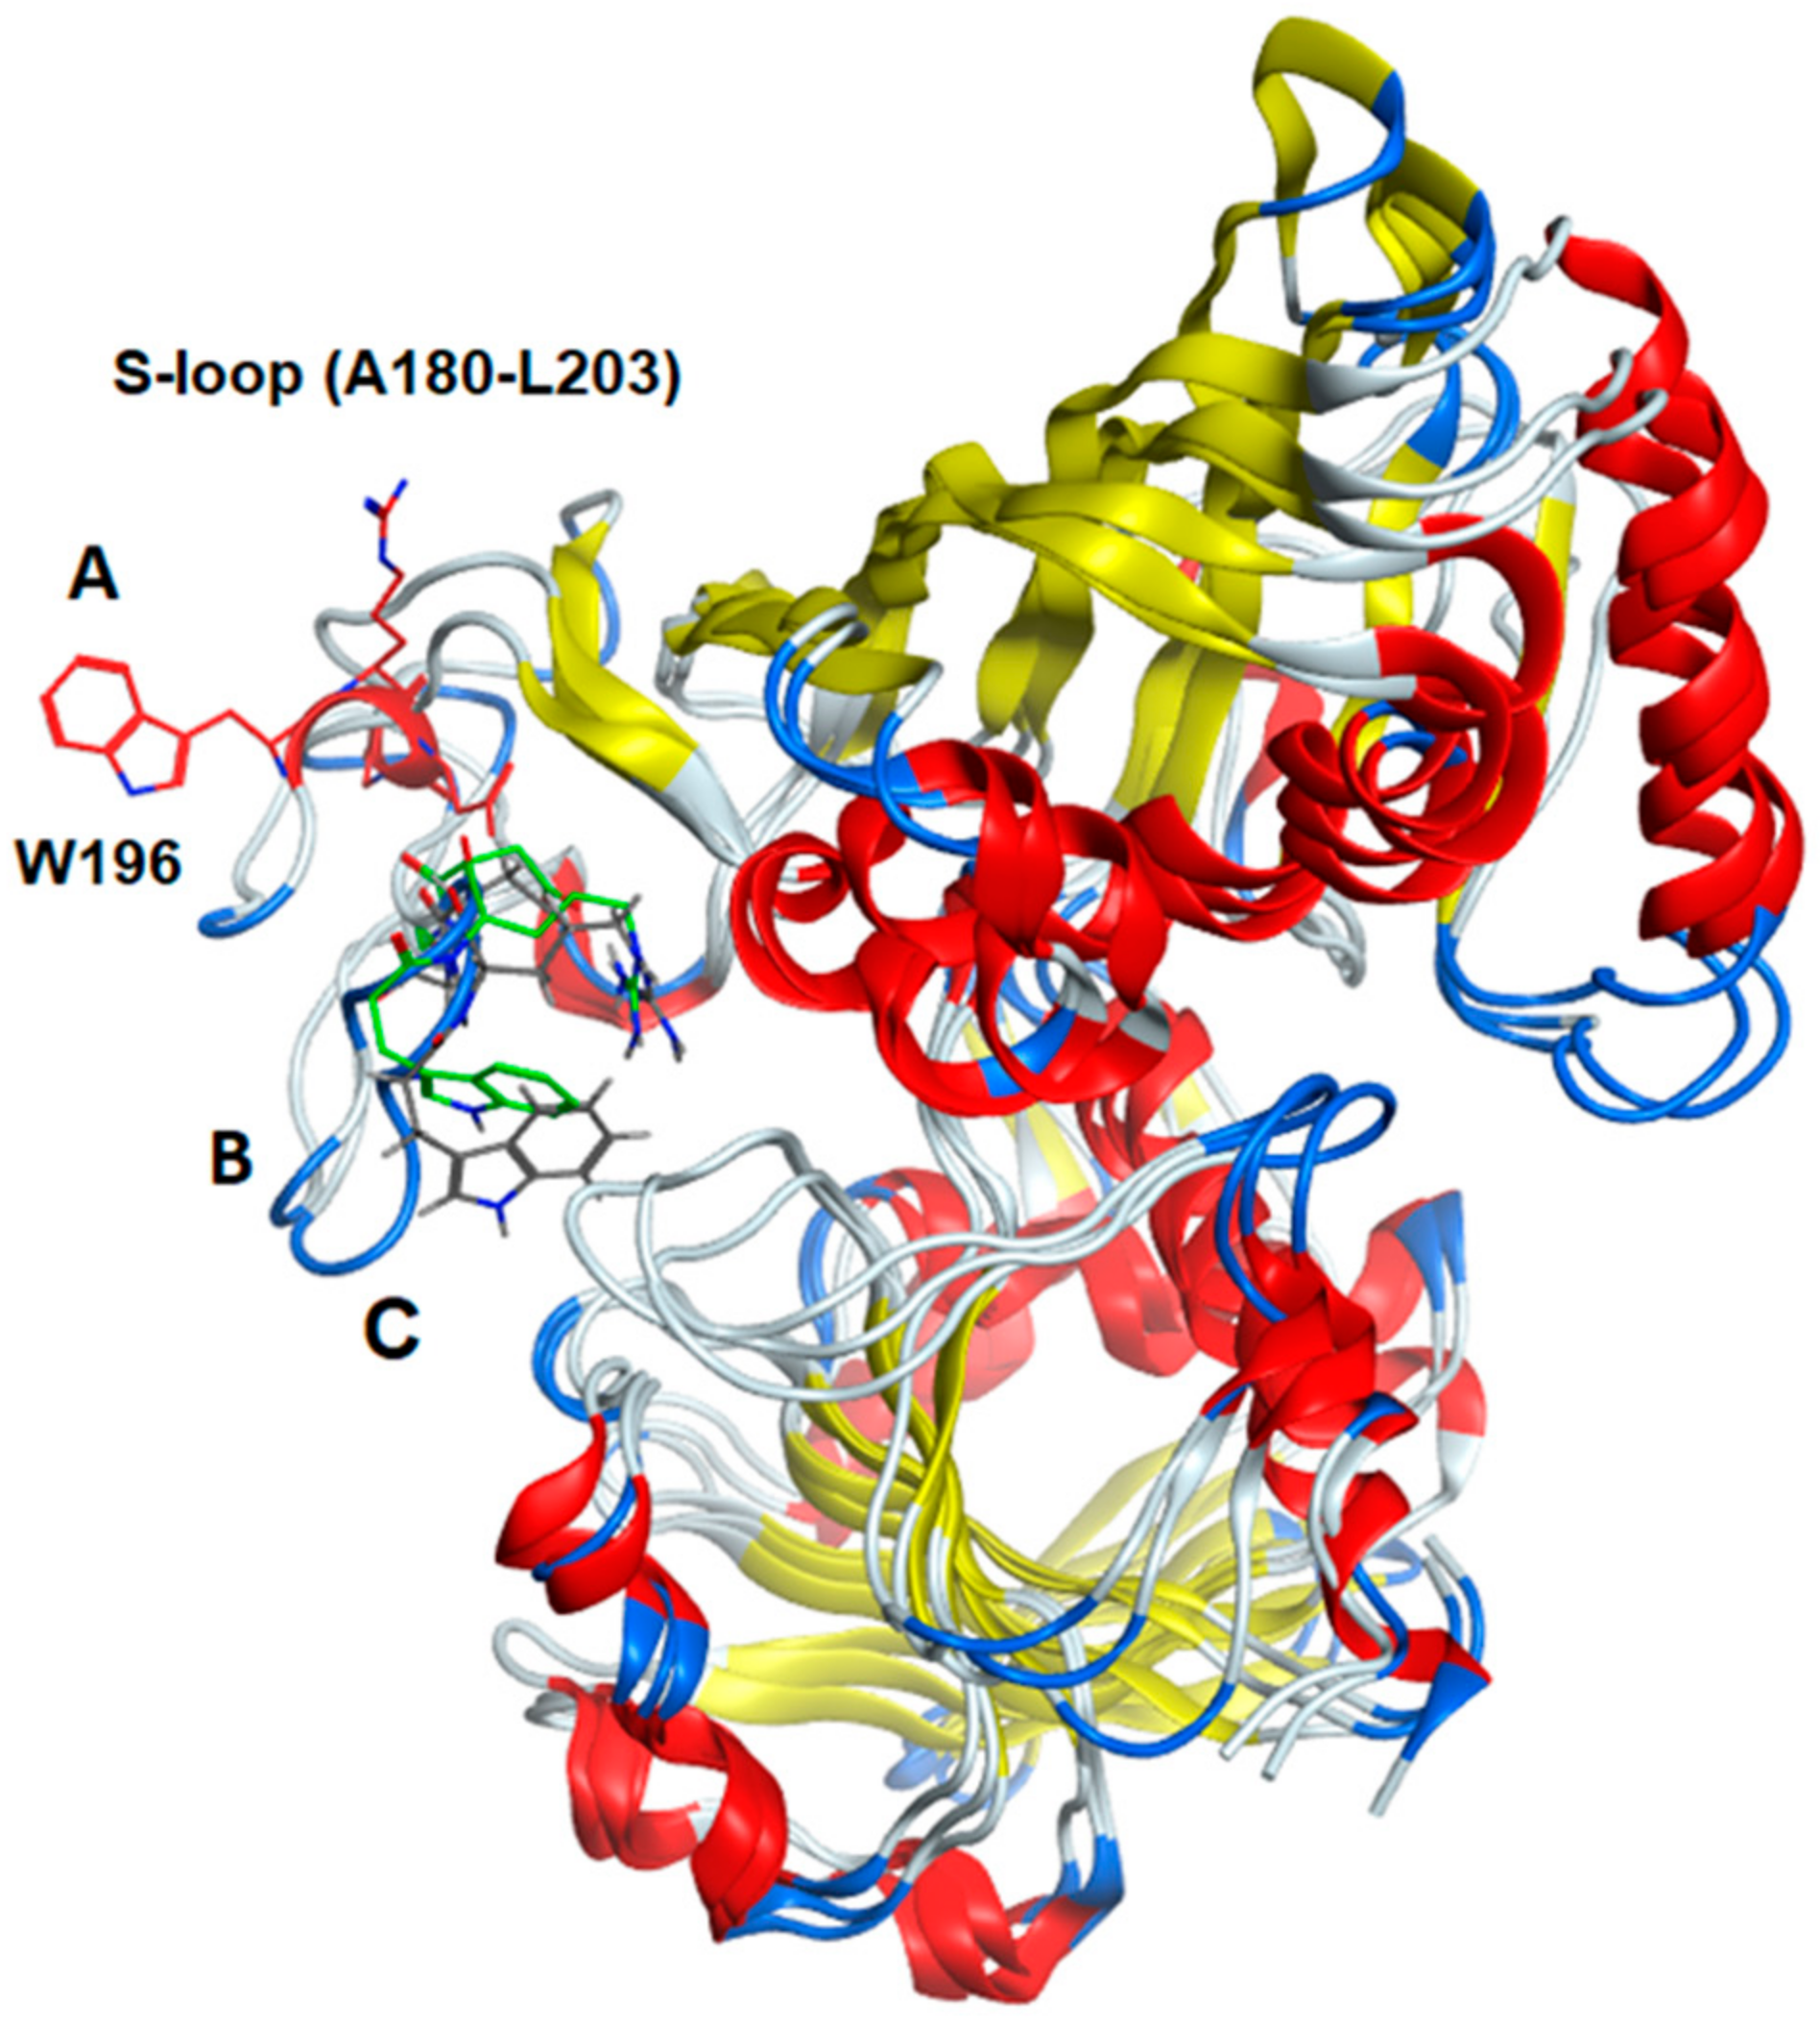
2.12. Comparison of Secondary Structural Motifs of S-Glutathionylated GAPDH
3. Discussion
4. Methods and Materials
4.1. GAPDH Sample Preparation and Oxidation
4.2. Reduction of Oxidized GAPDH
4.3. Kinetic Assay for GAPDH
4.4. Measurement of S-Glutathionylation, Bound G(SH), and Bound G(SS)G to r-GAPDH
4.5. h-GAPDH Active Site Computational Model Methods
Supplementary Materials
Author Contributions
Funding
Institutional Review Board Statement
Informed Consent Statement
Data Availability Statement
Acknowledgments
Conflicts of Interest
References
- Butterfield, D.A.; Hardas, S.S.; Lange, M.L. Oxidatively modified glyceraldehyde-3-phosphate dehydrogenase (GAPDH) and Alzheimer’s disease: Many pathways to neurodegeneration. J. Alzheimers Dis. 2010, 20, 369–393. [Google Scholar] [CrossRef] [PubMed]
- Sirover, M.A. Moonlighting glyceraldehyde-3-phosphate dehydrogenase: Posttranslational modification, protein and nucleic acid interactions in normal cells and in human pathology. Crit. Rev. Biochem. Mol. Biol. 2020, 55, 354–371. [Google Scholar] [CrossRef] [PubMed]
- Gerszon, J.; Rodacka, A. Oxidatively modified glyceraldehyde-3-phosphate dehydrogenase in neurodegenerative processes and the role of low molecular weight compounds in counteracting its aggregation and nuclear translocation. Ageing Res. Rev. 2018, 48, 21–31. [Google Scholar] [CrossRef]
- Semenyuk, P.; Barinova, K.; Muronetz, V. Glycation of alpha-synuclein amplifies the binding with glyceraldehyde-3-phosphate dehydrogenase. Int. J. Biol. Macromol. 2019, 127, 278–285. [Google Scholar] [CrossRef]
- Delport, A.; Kins, S.; Hewer, R. The amyloid precursor protein affects glyceraldehyde 3-phosphate dehydrogenase levels, organelle localisation and thermal stability. Mol. Biol. Rep. 2020, 47, 3019–3024. [Google Scholar] [CrossRef]
- Sekar, S.; Taghibiglou, C. Nuclear accumulation of GAPDH, GluA2 and p53 in post-mortem substantia nigral region of patients with Parkinson’s disease. Neurosci. Lett. 2020, 716, 134641. [Google Scholar] [CrossRef] [PubMed]
- Ping, Z.; Fan, H.; Wen, C.; Ji, Z.; Liang, S. GAPDH siRNA Regulates SH-SY5Y Cell Apoptosis Induced by Exogenous alpha-Synuclein Protein. Neuroscience 2021, 469, 91–102. [Google Scholar] [CrossRef]
- Butera, G.; Mullappilly, N.; Masetto, F.; Palmieri, M.; Scupoli, M.T.; Pacchiana, R.; Donadelli, M. Regulation of Autophagy by Nuclear GAPDH and Its Aggregates in Cancer and Neurodegenerative Disorders. Int. J. Mol. Sci. 2019, 20, 2062. [Google Scholar] [CrossRef]
- Hyslop, P.A.; Chaney, M.O. Mechanism of GAPDH Redox Signaling by H2O2 Activation of a Two-Cysteine Switch. Int. J. Mol. Sci. 2022, 23, 4604. [Google Scholar] [CrossRef]
- Sies, H. Role of Metabolic H2O2 Generation. J. Biol. Chem. 2014, 289, 8735–8741. [Google Scholar] [CrossRef]
- Tossounian, M.A.; Zhang, B.; Gout, I. The Writers, Readers, and Erasers in Redox Regulation of GAPDH. Antioxidants 2020, 9, 1288. [Google Scholar] [CrossRef] [PubMed]
- Barinova, K.V.; Serebryakova, M.V.; Eldarov, M.A.; Kulikova, A.A.; Mitkevich, V.A.; Muronetz, V.I.; Schmalhausen, E.V. S-glutathionylation of human glyceraldehyde-3-phosphate dehydrogenase and possible role of Cys152-Cys156 disulfide bridge in the active site of the protein. Biochim. Et Biophys. Acta Gen. Subj. 2020, 1864, 129560. [Google Scholar] [CrossRef] [PubMed]
- Schuppe-Koistinen, I.; Gerdes, R.; Moldeus, P.; Cotgreave, I.A. Studies on the reversibility of protein S-thiolation in human endothelial cells. Arch. Biochem. Biophys. 1994, 315, 226–234. [Google Scholar] [CrossRef]
- Brodie, A.E.; Reed, D.J. Reversible oxidation of glyceraldehyde 3-phosphate dehydrogenase thiols in human lung carcinoma cells by hydrogen peroxide. Biochem. Biophys. Res. Commun. 1987, 148, 120–125. [Google Scholar] [CrossRef]
- Brodie, A.E.; Reed, D.J. Cellular recovery of glyceraldehyde-3-phosphate dehydrogenase activity and thiol status after exposure to hydroperoxides. Arch. Biochem. Biophys. 1990, 276, 212–218. [Google Scholar] [CrossRef]
- Townsend, D.M.; Manevich, Y.; He, L.; Hutchens, S.; Pazoles, C.J.; Tew, K.D. Novel Role for Glutathione S-Transferase π. J. Biol. Chem. 2009, 284, 436–445. [Google Scholar] [CrossRef]
- Mustafa Rizvi, S.H.; Shao, D.; Tsukahara, Y.; Pimentel, D.R.; Weisbrod, R.M.; Hamburg, N.M.; McComb, M.E.; Matsui, R.; Bachschmid, M.M. Oxidized GAPDH transfers S-glutathionylation to a nuclear protein Sirtuin-1 leading to apoptosis. Free Radic. Biol. Med. 2021, 174, 73–83. [Google Scholar] [CrossRef]
- Eaton, P.; Byers, H.L.; Leeds, N.; Ward, M.A.; Shattock, M.J. Detection, quantitation, purification, and identification of cardiac proteins S-thiolated during ischemia and reperfusion. J. Biol. Chem. 2002, 277, 9806–9811. [Google Scholar] [CrossRef]
- Newman, S.F.; Sultana, R.; Perluigi, M.; Coccia, R.; Cai, J.; Pierce, W.M.; Klein, J.B.; Turner, D.M.; Butterfield, D.A. An increase in S-glutathionylated proteins in the Alzheimer’s disease inferior parietal lobule, a proteomics approach. J. Neurosci. Res. 2007, 85, 1506–1514. [Google Scholar] [CrossRef]
- Nonaka, K.; Kume, N.; Urata, Y.; Seto, S.; Kohno, T.; Honda, S.; Ikeda, S.; Muroya, T.; Ikeda, Y.; Ihara, Y.; et al. Serum levels of S-glutathionylated proteins as a risk-marker for arteriosclerosis obliterans. Circ. J. 2007, 71, 100–105. [Google Scholar] [CrossRef]
- Tsai, C.W.; Tsai, C.F.; Lin, K.H.; Chen, W.J.; Lin, M.S.; Hsieh, C.C.; Lin, C.C. An investigation of the correlation between the S-glutathionylated GAPDH levels in blood and Alzheimer’s disease progression. PLoS ONE 2020, 15, e0233289. [Google Scholar] [CrossRef] [PubMed]
- Kim, Y.J. A cryoprotectant induces conformational change in glyceraldehyde-3-phosphate dehydrogenase. Acta Crystallogr. Sect. F Struct. Biol. Commun. 2018, 74, 277–282. [Google Scholar] [CrossRef]
- Smith, C.M.; Velick, S.F. The glyceraldehyde 3-phosphate dehydrogenases of liver and muscle. Cooperative interactions and conditions for functional reversibility. J. Biol. Chem. 1972, 247, 273–284. [Google Scholar] [CrossRef]
- You, K.S.; Benitez, L.V.; McConachie, W.A.; Allison, W.S. The conversion of glyceraldehyde-3-phosphate dehydrogenase to an acylphosphatase by trinitroglycerin and inactivation of this activity by azide and ascorbate. Biochim. Biophys. Acta 1975, 384, 317–330. [Google Scholar] [CrossRef]
- Parker, D.J.; Allison, W.S. The mechanism of inactivation of glyceraldehyde 3-phosphate dehydrogenase by tetrathionate, o-iodosobenzoate, and iodine monochloride. J. Biol. Chem. 1969, 244, 180–189. [Google Scholar] [CrossRef] [PubMed]
- Harris, J.I.; Waters, M. Glyceraldehyde-3-phosphate dehydrogenase. In The Enzymes; Boyer, P.D., Ed.; Academic Press: Boca Raton, FL, USA, 1976; Chapter 1; pp. 1–49. [Google Scholar]
- Kitatani, T.; Nakamura, Y.; Wada, K.; Kinoshita, T.; Tamoi, M.; Shigeoka, S.; Tada, T. Structure of NADP-dependent glyceraldehyde-3-phosphate dehydrogenase from Synechococcus PCC7942 complexed with NADP. Acta Crystallogr. Sect. F Struct. Biol. Cryst. Commun. 2006, 62, 315–319. [Google Scholar] [CrossRef]
- Vaidyanathan, V.V.; Sastry, P.S.; Ramasarma, T. Regulation of the activity of glyceraldehyde 3-phosphate dehydrogenase by glutathione and H2O2. Mol. Cell Biochem. 1993, 129, 57–65. [Google Scholar] [CrossRef] [PubMed]
- Zaffagnini, M.; Marchand, C.H.; Malferrari, M.; Murail, S.; Bonacchi, S.; Genovese, D.; Montalti, M.; Venturoli, G.; Falini, G.; Baaden, M.; et al. Glutathionylation primes soluble glyceraldehyde-3-phosphate dehydrogenase for late collapse into insoluble aggregates. Proc. Natl. Acad. Sci. USA 2019, 116, 26057–26065. [Google Scholar] [CrossRef]
- Hyslop, P.A.; Hinshaw, D.B.; Halsey, W.A., Jr.; Schraufstatter, I.U.; Sauerheber, R.D.; Spragg, R.G.; Jackson, J.H.; Cochrane, C.G. Mechanisms of oxidant-mediated cell injury. The glycolytic and mitochondrial pathways of ADP phosphorylation are major intracellular targets inactivated by hydrogen peroxide. J. Biol. Chem. 1988, 263, 1665–1675. [Google Scholar] [CrossRef]
- Schraufstatter, I.U.; Hinshaw, D.B.; Hyslop, P.A.; Spragg, R.G.; Cochrane, C.G. Glutathione cycle activity and pyridine nucleotide levels in oxidant-induced injury of cells. J. Clin. Investig. 1985, 76, 1131–1139. [Google Scholar] [CrossRef]
- Schraufstatter, I.U.; Hinshaw, D.B.; Hyslop, P.A.; Spragg, R.G.; Cochrane, C.G. Oxidant injury of cells. DNA strand-breaks activate polyadenosine diphosphate-ribose polymerase and lead to depletion of nicotinamide adenine dinucleotide. J. Clin. Investig. 1986, 77, 1312–1320. [Google Scholar] [CrossRef] [PubMed]
- Schraufstatter, I.U.; Hyslop, P.A.; Hinshaw, D.B.; Spragg, R.G.; Sklar, L.A.; Cochrane, C.G. Hydrogen peroxide-induced injury of cells and its prevention by inhibitors of poly(ADP-ribose) polymerase. Proc. Natl. Acad. Sci. USA 1986, 83, 4908–4912. [Google Scholar] [CrossRef] [PubMed]
- Spragg, R.G.; Hinshaw, D.B.; Hyslop, P.A.; Schraufstatter, I.U.; Cochrane, C.G. Alterations in adenosine triphosphate and energy charge in cultured endothelial and P388D1 cells after oxidant injury. J. Clin. Investig. 1985, 76, 1471–1476. [Google Scholar] [CrossRef] [PubMed]
- Hinshaw, D.B.; Miller, M.T.; Omann, G.M.; Beals, T.F.; Hyslop, P.A. A cellular model of oxidant-mediated neuronal injury. Brain Res. 1993, 615, 13–26. [Google Scholar] [CrossRef]
- Zhang, Z.; Turner, D.C.; Drzewiecki, G.J.; Hinshaw, D.B.; Hyslop, P.A. Impairment of integrin-mediated cell-matrix adhesion in oxidant-stressed PC12 cells. Brain Res. 1994, 662, 189–197. [Google Scholar] [CrossRef]
- Labute, P. The generalized Born/volume integral implicit solvent model: Estimation of the free energy of hydration using London dispersion instead of atomic surface area. J. Comput. Chem. 2008, 29, 1693–1698. [Google Scholar] [CrossRef]


 ) Time course of the decline in total mol of S-glutathionylated subunits GAPDH/mol tetramer measured following the removal of all unbound G(SH) and G(SS)G after subunit denaturation and washing in the retentate following Microcon® spin separation (see text for details). (b
  ) Time course of unbound reduced G(SH) recovered and measured in the eluate following Microcon® spin separation. (c
  ) Time course of unbound G(SS)G recovered and measured in the eluate following Microcon® spin separation. Note: the data represents 2 mol equivalents of G(SH) derived from 1 mol equivalent of G(SS)G in the Promega protocol). (d
  ) The total number of G(SH) equivalents bound to GAPDH over the time course of the incubation of S-glutathionylated GAPDH with 1 mM G(SH) is shown as the sum of measurements. (a), (b), (c) The associated cumulative SD of the triplicate samples. The black dashed line represents the theoretical maximal G(SH) binding capacity of the four active sites within the GAPDH tetramer. The data show the combined mean values ± SD from two separate experiments with technical triplicates.
) Time course of the decline in total mol of S-glutathionylated subunits GAPDH/mol tetramer measured following the removal of all unbound G(SH) and G(SS)G after subunit denaturation and washing in the retentate following Microcon® spin separation (see text for details). (b ) Time course of unbound reduced G(SH) recovered and measured in the eluate following Microcon® spin separation. (c ) Time course of unbound G(SS)G recovered and measured in the eluate following Microcon® spin separation. Note: the data represents 2 mol equivalents of G(SH) derived from 1 mol equivalent of G(SS)G in the Promega protocol). (d ) The total number of G(SH) equivalents bound to GAPDH over the time course of the incubation of S-glutathionylated GAPDH with 1 mM G(SH) is shown as the sum of measurements. (a), (b), (c) The associated cumulative SD of the triplicate samples. The black dashed line represents the theoretical maximal G(SH) binding capacity of the four active sites within the GAPDH tetramer. The data show the combined mean values ± SD from two separate experiments with technical triplicates.
) The total number of G(SH) equivalents bound to GAPDH over the time course of the incubation of S-glutathionylated GAPDH with 1 mM G(SH) is shown as the sum of measurements. (a), (b), (c) The associated cumulative SD of the triplicate samples. The black dashed line represents the theoretical maximal G(SH) binding capacity of the four active sites within the GAPDH tetramer. The data show the combined mean values ± SD from two separate experiments with technical triplicates.
) Time course of the decline in total mol of S-glutathionylated subunits GAPDH/mol tetramer measured following the removal of all unbound G(SH) and G(SS)G after subunit denaturation and washing in the retentate following Microcon® spin separation (see text for details). (b ) Time course of unbound reduced G(SH) recovered and measured in the eluate following Microcon® spin separation. (c ) Time course of unbound G(SS)G recovered and measured in the eluate following Microcon® spin separation. Note: the data represents 2 mol equivalents of G(SH) derived from 1 mol equivalent of G(SS)G in the Promega protocol). (d ) The total number of G(SH) equivalents bound to GAPDH over the time course of the incubation of S-glutathionylated GAPDH with 1 mM G(SH) is shown as the sum of measurements. (a), (b), (c) The associated cumulative SD of the triplicate samples. The black dashed line represents the theoretical maximal G(SH) binding capacity of the four active sites within the GAPDH tetramer. The data show the combined mean values ± SD from two separate experiments with technical triplicates.


| Total Ligand Interaction Energies (ΔE kcal/mol) | NAD+ | G(SH) or G(SS)G |
|---|---|---|
| Native GAPDH | −60.5 kcal/mol | - |
| G(SH) docked in active site with Cc(SH) oxidized to CcS(OH) | −73.2 kcal/mol | −77.2 kcal/mol |
| S-glutathionylated Cc(SS)G | −43.0 kcal/mol | −44.3 kcal/mol |
| G(SH) interactions docked for SN2 attack on Cc(SS)G | Not calculated | −55.6 kcal/mol |
| Cc(SS)G interactions with G(SH) docked for SN2 attack by G(SH) | Not calculated | −68.1 kcal/mol |
| Glutathione disulfide G(SS)G docked in active site | −44.1 kcal/mol | −85.3 kcal/mol |
Disclaimer/Publisher’s Note: The statements, opinions and data contained in all publications are solely those of the individual author(s) and contributor(s) and not of MDPI and/or the editor(s). MDPI and/or the editor(s) disclaim responsibility for any injury to people or property resulting from any ideas, methods, instructions or products referred to in the content. |
© 2023 by the authors. Licensee MDPI, Basel, Switzerland. This article is an open access article distributed under the terms and conditions of the Creative Commons Attribution (CC BY) license (https://creativecommons.org/licenses/by/4.0/).
Share and Cite
Hyslop, P.A.; Boggs, L.N.; Chaney, M.O. Origin of Elevated S-Glutathionylated GAPDH in Chronic Neurodegenerative Diseases. Int. J. Mol. Sci. 2023, 24, 5529. https://doi.org/10.3390/ijms24065529
Hyslop PA, Boggs LN, Chaney MO. Origin of Elevated S-Glutathionylated GAPDH in Chronic Neurodegenerative Diseases. International Journal of Molecular Sciences. 2023; 24(6):5529. https://doi.org/10.3390/ijms24065529
Chicago/Turabian StyleHyslop, Paul A., Leonard N. Boggs, and Michael O. Chaney. 2023. "Origin of Elevated S-Glutathionylated GAPDH in Chronic Neurodegenerative Diseases" International Journal of Molecular Sciences 24, no. 6: 5529. https://doi.org/10.3390/ijms24065529
APA StyleHyslop, P. A., Boggs, L. N., & Chaney, M. O. (2023). Origin of Elevated S-Glutathionylated GAPDH in Chronic Neurodegenerative Diseases. International Journal of Molecular Sciences, 24(6), 5529. https://doi.org/10.3390/ijms24065529