
Status of Metabolomic Measurement for Insights in Alzheimer’s Disease Progression—What Is Missing?

 , , , and
Abstract
1. Introduction
2. Metabolomics
2.1. Metabolomics Platforms for Identification of AD Biomarkers
2.2. Metabolomics Studies Related to AD
2.2.1. Metabolomics in AD Human Studies
2.2.2. Metabolomics in Animal Models of AD
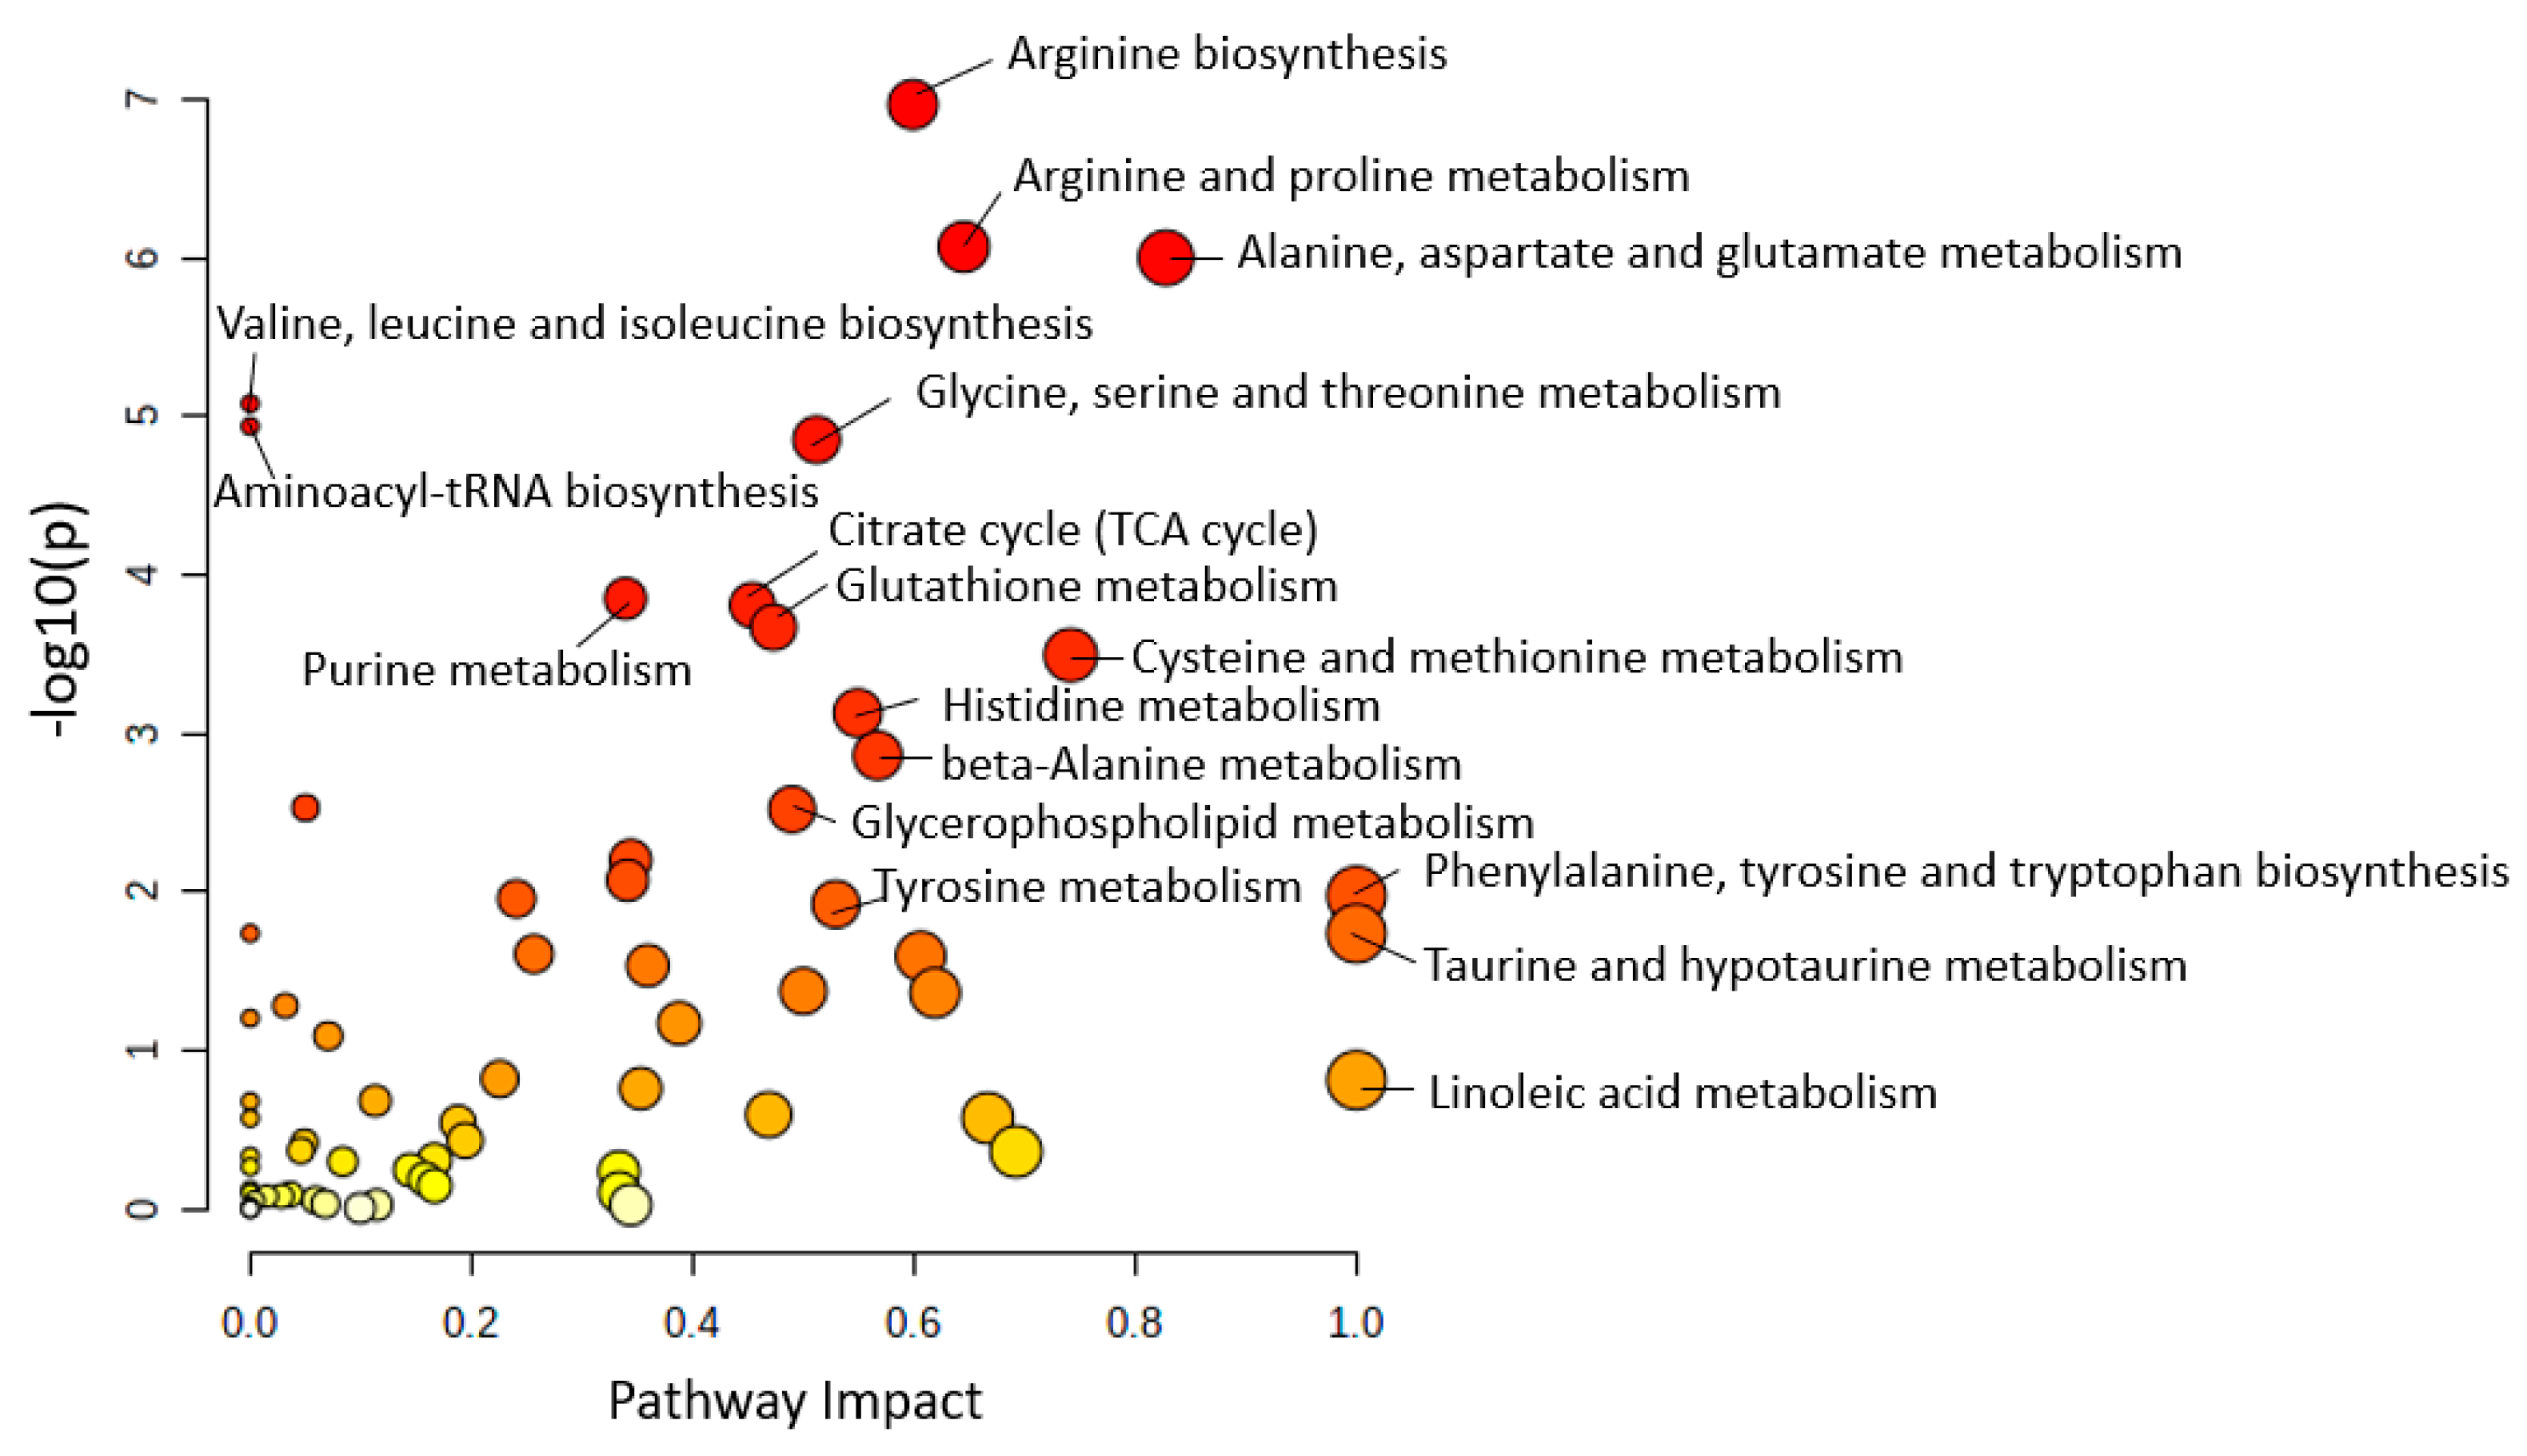
3. AD Metabolic Pathways Analysis
3.1. Metabolic Pathway Analysis among Human Studies
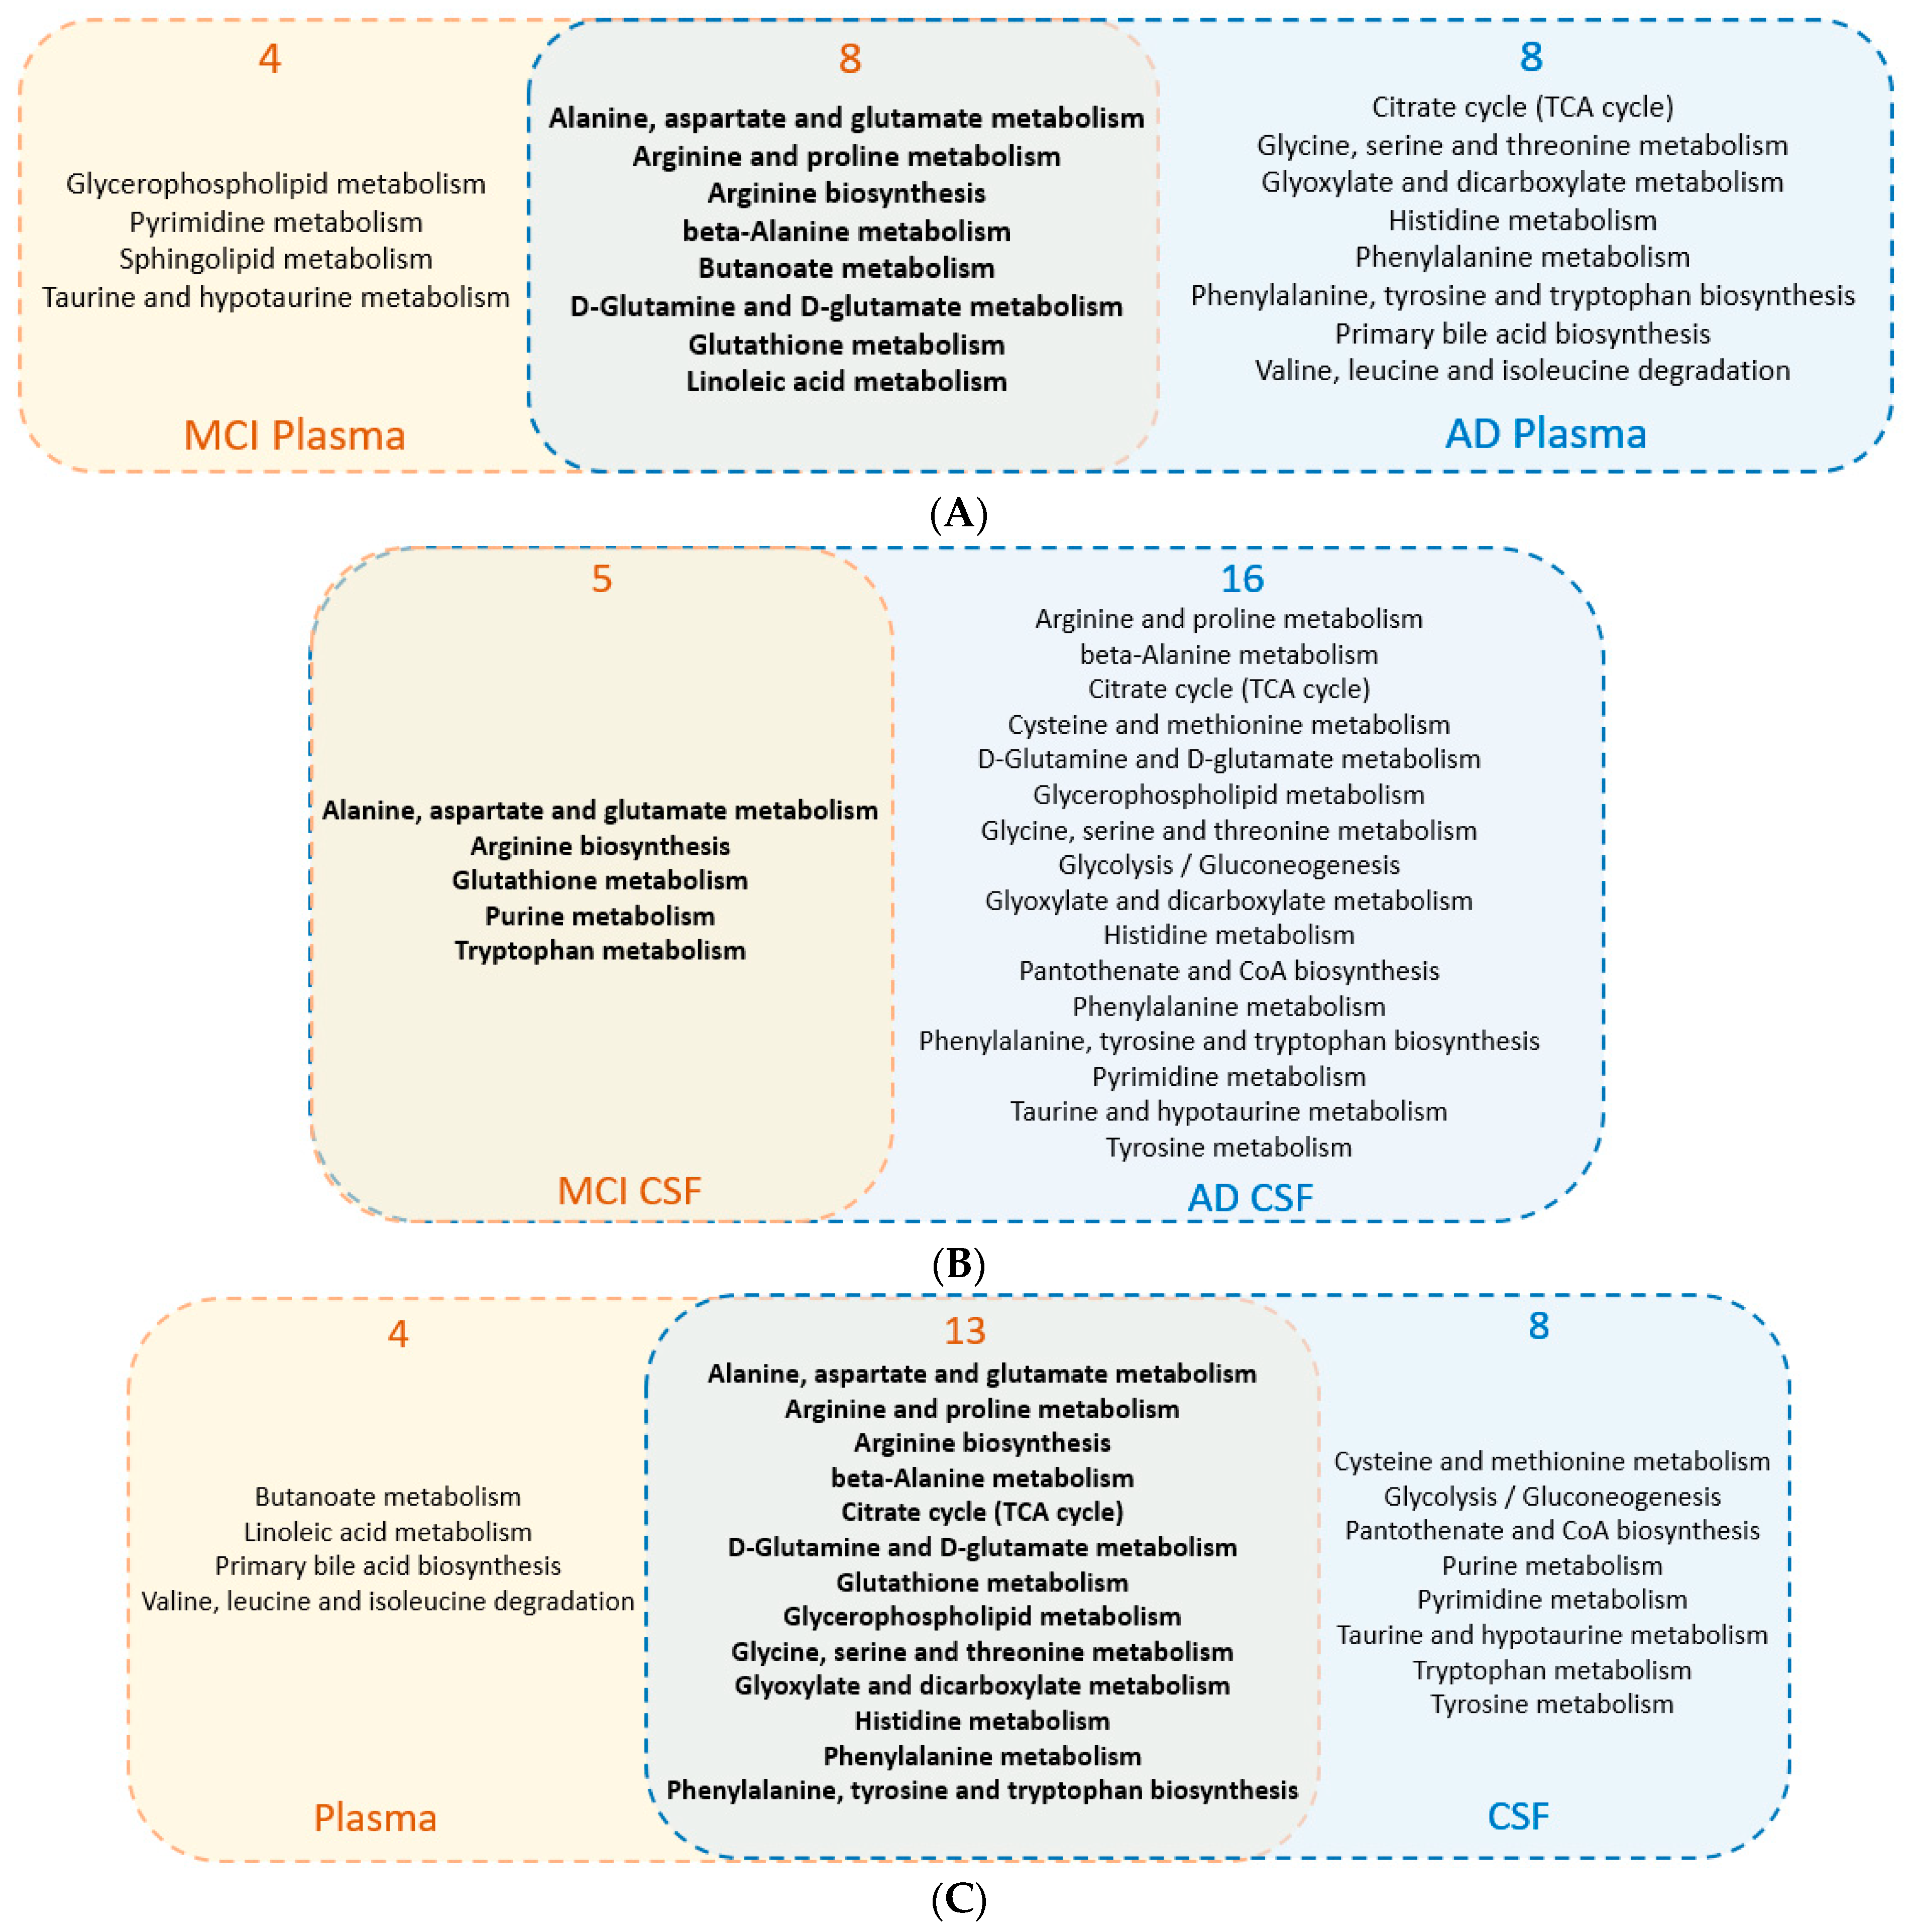
3.2. Common Regulated Metabolic Pathways among Human Plasma and CSF Sample
3.3. Significantly Altered Metabolic Pathways among AD Mouse Models
3.4. Common Regulated Metabolic Pathways among Mouse Plasma and Brain Sample
4. Main Metabolic Pathways and Main Lipid Species with Respect to AD
4.1. Arginine Metabolism
4.2. Alanine, Aspartate, and Glutamate Metabolism
4.3. Purine Metabolism
4.4. Taurine and Hypotaurine Metabolism
4.5. Cholinergic System
4.6. Fatty Acids
4.7. Glycerolipids
4.8. Glycerophospholipids
4.9. Sphingolipids
4.10. Cholesterol and Cholesteryl Esters
5. Conclusions and Future Directions
Supplementary Materials
Author Contributions
Funding
Institutional Review Board Statement
Informed Consent Statement
Data Availability Statement
Acknowledgments
Conflicts of Interest
Abbreviations
References
- Altiné-Samey, R.; Antier, D.; Mavel, S.; Dufour-Rainfray, D.; Balageas, A.C.; Beaufils, E.; Emond, P.; Foucault-Fruchard, L.; Chalon, S. The contributions of metabolomics in the discovery of new therapeutic targets in Alzheimer’s disease. Fundam. Clin. Pharmacol. 2021, 35, 582–594. [Google Scholar] [CrossRef]
- Lane, C.A.; Hardy, J.; Schott, J.M. Alzheimer’s disease. Eur. J. Neurol. 2018, 25, 59–70. [Google Scholar] [CrossRef]
- Querfurth, H.W.; LaFerla, F.M. Alzheimer’s disease. N. Engl. J. Med. 2010, 362, 329–344. [Google Scholar] [CrossRef] [PubMed]
- Livingston, G.; Huntley, J.; Sommerlad, A.; Ames, D.; Ballard, C.; Banerjee, S.; Brayne, C.; Burns, A.; Cohen-Mansfield, J.; Cooper, C.; et al. Dementia prevention, intervention, and care: 2020 report of the Lancet Commission. Lancet 2020, 396, 413–446. [Google Scholar] [CrossRef] [PubMed]
- van Dyck, C.H.; Swanson, C.J.; Aisen, P.; Bateman, R.J.; Chen, C.; Gee, M.; Kanekiyo, M.; Li, D.; Reyderman, L.; Cohen, S.; et al. Lecanemab in Early Alzheimer’s Disease. N. Engl. J. Med. 2023, 388, 9–21. [Google Scholar] [CrossRef] [PubMed]
- Serrano-Pozo, A.; Frosch, M.P.; Masliah, E.; Hyman, B.T. Neuropathological alterations in Alzheimer disease. Cold Spring Harb. Perspect. Med. 2011, 1, a006189. [Google Scholar] [CrossRef] [PubMed]
- Wilkins, J.M.; Trushina, E. Application of Metabolomics in Alzheimer’s Disease. Front. Neurol. 2017, 8, 719. [Google Scholar] [CrossRef]
- Rinschen, M.M.; Ivanisevic, J.; Giera, M.; Siuzdak, G. Identification of bioactive metabolites using activity metabolomics. Nat. Rev. Mol. Cell Biol. 2019, 20, 353–367. [Google Scholar] [CrossRef] [PubMed]
- Gowda, G.A.; Zhang, S.; Gu, H.; Asiago, V.; Shanaiah, N.; Raftery, D. Metabolomics-based methods for early disease diagnostics. Expert Rev. Mol. Diagn. 2008, 8, 617–633. [Google Scholar] [CrossRef]
- Dunn, W.B.; Broadhurst, D.I.; Atherton, H.J.; Goodacre, R.; Griffin, J.L. Systems level studies of mammalian metabolomes: The roles of mass spectrometry and nuclear magnetic resonance spectroscopy. Chem. Soc. Rev. 2011, 40, 387–426. [Google Scholar] [CrossRef]
- Goodacre, R.; Vaidyanathan, S.; Dunn, W.B.; Harrigan, G.G.; Kell, D.B. Metabolomics by numbers: Acquiring and understanding global metabolite data. Trends Biotechnol. 2004, 22, 245–252. [Google Scholar] [CrossRef]
- Hollywood, K.; Brison, D.R.; Goodacre, R. Metabolomics: Current technologies and future trends. Proteomics 2006, 6, 4716–4723. [Google Scholar] [CrossRef] [PubMed]
- Mamas, M.; Dunn, W.B.; Neyses, L.; Goodacre, R. The role of metabolites and metabolomics in clinically applicable biomarkers of disease. Arch. Toxicol. 2011, 85, 5–17. [Google Scholar] [CrossRef] [PubMed]
- Spratlin, J.L.; Serkova, N.J.; Eckhardt, S.G. Clinical applications of metabolomics in oncology: A review. Clin. Cancer Res. 2009, 15, 431–440. [Google Scholar] [CrossRef] [PubMed]
- Enche Ady, C.N.A.; Lim, S.M.; Teh, L.K.; Salleh, M.Z.; Chin, A.V.; Tan, M.P.; Poi, P.J.H.; Kamaruzzaman, S.B.; Abdul Majeed, A.B.; Ramasamy, K. Metabolomic-guided discovery of Alzheimer’s disease biomarkers from body fluid. J. Neurosci. Res. 2017, 95, 2005–2024. [Google Scholar] [CrossRef] [PubMed]
- Griffin, J.L.; Shockcor, J.P. Metabolic profiles of cancer cells. Nat. Rev. Cancer 2004, 4, 551–561. [Google Scholar] [CrossRef]
- Arrese, E.L.; Soulages, J.L. Insect fat body: Energy, metabolism, and regulation. Annu. Rev. Entomol. 2010, 55, 207–225. [Google Scholar] [CrossRef]
- Ooi, K.M.; Vacy, K.; Boon, W.C. Fatty acids and beyond: Age and Alzheimer’s disease related changes in lipids reveal the neuro-nutraceutical potential of lipids in cognition. Neurochem. Int. 2021, 149, 105143. [Google Scholar] [CrossRef] [PubMed]
- Yin, F. Lipid metabolism and Alzheimer’s disease: Clinical evidence, mechanistic link and therapeutic promise. FEBS J. 2022; Early View. [Google Scholar] [CrossRef]
- Sastry, P.S. Lipids of nervous tissue: Composition and metabolism. Prog. Lipid Res. 1985, 24, 69–176. [Google Scholar] [CrossRef]
- Kuo, Y.-M.; Emmerling, M.R.; Bisgaier, C.L.; Essenburg, A.D.; Lampert, H.C.; Drumm, D.; Roher, A.E. Elevated Low-Density Lipoprotein in Alzheimer’s Disease Correlates with Brain Aβ 1–42 Levels. Biochem. Biophys. Res. Commun. 1998, 252, 711–715. [Google Scholar] [CrossRef]
- Merched, A.; Xia, Y.; Visvikis, S.; Serot, J.M.; Siest, G. Decreased high-density lipoprotein cholesterol and serum apolipoprotein AI concentrations are highly correlated with the severity of Alzheimer’s disease☆. Neurobiol. Aging 2000, 21, 27–30. [Google Scholar] [CrossRef]
- Roher, A.E.; Kuo, Y.M.; Kokjohn, K.M.; Emmerling, M.R.; Gracon, S. Amyloid and lipids in the pathology of Alzheimer disease. Amyloid 1999, 6, 136–145. [Google Scholar] [CrossRef] [PubMed]
- Davis, V.W.; Bathe, O.F.; Schiller, D.E.; Slupsky, C.M.; Sawyer, M.B. Metabolomics and surgical oncology: Potential role for small molecule biomarkers. J. Surg. Oncol. 2011, 103, 451–459. [Google Scholar] [CrossRef] [PubMed]
- Bujak, R.; Struck-Lewicka, W.; Markuszewski, M.J.; Kaliszan, R. Metabolomics for laboratory diagnostics. J. Pharm. Biomed. Anal. 2015, 113, 108–120. [Google Scholar] [CrossRef]
- Weiss, R.H.; Kim, K. Metabolomics in the study of kidney diseases. Nat. Rev. Nephrol. 2011, 8, 22–33. [Google Scholar] [CrossRef]
- Manach, C.; Hubert, J.; Llorach, R.; Scalbert, A. The complex links between dietary phytochemicals and human health deciphered by metabolomics. Mol. Nutr. Food Res. 2009, 53, 1303–1315. [Google Scholar] [CrossRef]
- Beale, D.J.; Pinu, F.R.; Kouremenos, K.A.; Poojary, M.M.; Narayana, V.K.; Boughton, B.A.; Kanojia, K.; Dayalan, S.; Jones, O.A.H.; Dias, D.A. Review of recent developments in GC-MS approaches to metabolomics-based research. Metabolomics 2018, 14, 152. [Google Scholar] [CrossRef]
- Zhang, A.; Sun, H.; Wang, P.; Han, Y.; Wang, X. Modern analytical techniques in metabolomics analysis. Analyst 2012, 137, 293–300. [Google Scholar] [CrossRef]
- Farajzadeh, M.A.; Nouri, N.; Khorram, P. Derivatization and microextraction methods for determination of organic compounds by gas chromatography. TrAC Trends Anal. Chem. 2014, 55, 14–23. [Google Scholar] [CrossRef]
- Gathungu, R.M.; Bird, S.S.; Sheldon, D.P.; Kautz, R.; Vouros, P.; Matson, W.R.; Kristal, B.S. Identification of metabolites from liquid chromatography-coulometric array detection profiling: Gas chromatography-mass spectrometry and refractionation provide essential information orthogonal to LC-MS/microNMR. Anal. Biochem. 2014, 454, 23–32. [Google Scholar] [CrossRef]
- Alon, T.; Amirav, A. Isotope abundance analysis methods and software for improved sample identification with supersonic gas chromatography/mass spectrometry. Rapid Commun. Mass Spectrom. RCM 2006, 20, 2579–2588. [Google Scholar] [CrossRef]
- Halket, J.M.; Waterman, D.; Przyborowska, A.M.; Patel, R.K.; Fraser, P.D.; Bramley, P.M. Chemical derivatization and mass spectral libraries in metabolic profiling by GC/MS and LC/MS/MS. J. Exp. Bot. 2005, 56, 219–243. [Google Scholar] [CrossRef]
- Tang, D.Q.; Zou, L.; Yin, X.X.; Ong, C.N. HILIC-MS for metabolomics: An attractive and complementary approach to RPLC-MS. Mass Spectrom. Rev. 2016, 35, 574–600. [Google Scholar] [CrossRef]
- Ramautar, R.; Somsen, G.W.; de Jong, G.J. CE-MS in metabolomics. Electrophoresis 2009, 30, 276–291. [Google Scholar] [CrossRef] [PubMed]
- Mischak, H.; Schanstra, J.P. CE-MS in biomarker discovery, validation, and clinical application. Proteom. Clin. Appl. 2011, 5, 9–23. [Google Scholar] [CrossRef] [PubMed]
- Khakimov, B.; Bak, S.; Engelsen, S.B. High-throughput cereal metabolomics: Current analytical technologies, challenges and perspectives. J. Cereal Sci. 2014, 59, 393–418. [Google Scholar] [CrossRef]
- Putri, S.P.; Yamamoto, S.; Tsugawa, H.; Fukusaki, E. Current metabolomics: Technological advances. J. Biosci. Bioeng. 2013, 116, 9–16. [Google Scholar] [CrossRef]
- Giavalisco, P.; Hummel, J.; Lisec, J.; Inostroza, A.C.; Catchpole, G.; Willmitzer, L. High-Resolution Direct Infusion-Based Mass Spectrometry in Combination with Whole 13C Metabolome Isotope Labeling Allows Unambiguous Assignment of Chemical Sum Formulas. Anal. Chem. 2008, 80, 9417–9425. [Google Scholar] [CrossRef]
- Monteiro, M.S.; Carvalho, M.; Bastos, M.L.; Guedes de Pinho, P. Metabolomics analysis for biomarker discovery: Advances and challenges. Curr. Med. Chem. 2013, 20, 257–271. [Google Scholar] [CrossRef] [PubMed]
- Du, Z.; Shen, A.; Huang, Y.; Su, L.; Lai, W.; Wang, P.; Xie, Z.; Xie, Z.; Zeng, Q.; Ren, H.; et al. 1H-NMR-based metabolic analysis of human serum reveals novel markers of myocardial energy expenditure in heart failure patients. PLoS ONE 2014, 9, e88102. [Google Scholar] [CrossRef] [PubMed]
- Yilmaz, A.; Geddes, T.; Han, B.; Bahado-Singh, R.O.; Wilson, G.D.; Imam, K.; Maddens, M.; Graham, S.F. Diagnostic Biomarkers of Alzheimer’s Disease as Identified in Saliva using 1H NMR-Based Metabolomics. J. Alzheimers Dis. 2017, 58, 355–359. [Google Scholar] [CrossRef] [PubMed]
- Zordoky, B.N.; Sung, M.M.; Ezekowitz, J.; Mandal, R.; Han, B.; Bjorndahl, T.C.; Bouatra, S.; Anderson, T.; Oudit, G.Y.; Wishart, D.S.; et al. Metabolomic fingerprint of heart failure with preserved ejection fraction. PLoS ONE 2015, 10, e0124844. [Google Scholar] [CrossRef]
- Wang, J.; Li, Z.; Chen, J.; Zhao, H.; Luo, L.; Chen, C.; Xu, X.; Zhang, W.; Gao, K.; Li, B.; et al. Metabolomic identification of diagnostic plasma biomarkers in humans with chronic heart failure. Mol. Biosyst. 2013, 9, 2618–2626. [Google Scholar] [CrossRef] [PubMed]
- Eddy, M.T.; Belenky, M.; Sivertsen, A.C.; Griffin, R.G.; Herzfeld, J. Selectively dispersed isotope labeling for protein structure determination by magic angle spinning NMR. J. Biomol. NMR 2013, 57, 129–139. [Google Scholar] [CrossRef]
- Khan, M.T.; Busch, M.; Molina, V.G.; Emwas, A.H.; Aubry, C.; Croue, J.P. How different is the composition of the fouling layer of wastewater reuse and seawater desalination RO membranes? Water Res. 2014, 59, 271–282. [Google Scholar] [CrossRef]
- Atherton, H.J.; Bailey, N.J.; Zhang, W.; Taylor, J.; Major, H.; Shockcor, J.; Clarke, K.; Griffin, J.L. A combined 1H-NMR spectroscopy- and mass spectrometry-based metabolomic study of the PPAR-alpha null mutant mouse defines profound systemic changes in metabolism linked to the metabolic syndrome. Physiol. Genom. 2006, 27, 178–186. [Google Scholar] [CrossRef]
- Risa, O.; Melø, T.M.; Sonnewald, U. Quantification of amounts and (13)C content of metabolites in brain tissue using high-resolution magic angle spinning (13)C NMR spectroscopy. NMR Biomed. 2009, 22, 266–271. [Google Scholar] [CrossRef] [PubMed]
- Komoroski, R.A.; Pearce, J.M.; Mrak, R.E. 31P NMR spectroscopy of phospholipid metabolites in postmortem schizophrenic brain. Magn. Reson Med. 2008, 59, 469–474. [Google Scholar] [CrossRef]
- Lutz, N.W.; Béraud, E.; Cozzone, P.J. Metabolomic analysis of rat brain by high resolution nuclear magnetic resonance spectroscopy of tissue extracts. J. Vis. Exp. 2014, 91, 51829. [Google Scholar]
- Naz, S.; Vallejo, M.; Garcia, A.; Barbas, C. Method validation strategies involved in non-targeted metabolomics. J. Chromatogr. A 2014, 1353, 99–105. [Google Scholar] [CrossRef]
- Schrimpe-Rutledge, A.C.; Codreanu, S.G.; Sherrod, S.D.; McLean, J.A. Untargeted Metabolomics Strategies-Challenges and Emerging Directions. J. Am. Soc. Mass Spectrom. 2016, 27, 1897–1905. [Google Scholar] [CrossRef] [PubMed]
- Sana, T.R.; Roark, J.C.; Li, X.; Waddell, K.; Fischer, S.M. Molecular formula and METLIN Personal Metabolite Database matching applied to the identification of compounds generated by LC/TOF-MS. J. Biomol. Tech. 2008, 19, 258–266. [Google Scholar]
- Draper, J.; Enot, D.P.; Parker, D.; Beckmann, M.; Snowdon, S.; Lin, W.; Zubair, H. Metabolite signal identification in accurate mass metabolomics data with MZedDB, an interactive m/z annotation tool utilising predicted ionisation behaviour ‘rules’. BMC Bioinform. 2009, 10, 227. [Google Scholar] [CrossRef]
- Kind, T.; Fiehn, O. Metabolomic database annotations via query of elemental compositions: Mass accuracy is insufficient even at less than 1 ppm. BMC Bioinform. 2006, 7, 234. [Google Scholar] [CrossRef]
- Chen, C.; Krausz, K.W.; Idle, J.R.; Gonzalez, F.J. Identification of novel toxicity-associated metabolites by metabolomics and mass isotopomer analysis of acetaminophen metabolism in wild-type and Cyp2e1-null mice. J. Biol. Chem. 2008, 283, 4543–4559. [Google Scholar] [CrossRef] [PubMed]
- Viant, M.R.; Rosenblum, E.S.; Tieerdema, R.S. NMR-based metabolomics: A powerful approach for characterizing the effects of environmental stressors on organism health. Environ. Sci. Technol. 2003, 37, 4982–4989. [Google Scholar] [CrossRef]
- Roberts, L.D.; Souza, A.L.; Gerszten, R.E.; Clish, C.B. Targeted metabolomics. Curr. Protoc. Mol. Biol. 2012, 98, 30.2.1–30.2.24. [Google Scholar] [CrossRef]
- Patti, G.J.; Yanes, O.; Siuzdak, G. Innovation: Metabolomics: The apogee of the omics trilogy. Nat. Rev. Mol. Cell Biol. 2012, 13, 263–269. [Google Scholar] [CrossRef]
- Nicholson, J.K.; Connelly, J.; Lindon, J.C.; Holmes, E. Metabonomics: A platform for studying drug toxicity and gene function. Nat. Rev. Drug Discov. 2002, 1, 153–161. [Google Scholar] [CrossRef] [PubMed]
- Go, E.P. Database Resources in Metabolomics: An Overview. J. Neuroimmune Pharmacol. 2010, 5, 18–30. [Google Scholar] [CrossRef]
- Pang, Z.; Zhou, G.; Ewald, J.; Chang, L.; Hacariz, O.; Basu, N.; Xia, J. Using MetaboAnalyst 5.0 for LC–HRMS spectra processing, multi-omics integration and covariate adjustment of global metabolomics data. Nat. Protoc. 2022, 17, 1735–1761. [Google Scholar] [CrossRef]
- Czech, C.; Berndt, P.; Busch, K.; Schmitz, O.; Wiemer, J.; Most, V.; Hampel, H.; Kastler, J.; Senn, H. Metabolite profiling of Alzheimer’s disease cerebrospinal fluid. PLoS ONE 2012, 7, e31501. [Google Scholar] [CrossRef] [PubMed]
- Ibanez, C.; Simo, C.; Martin-Alvarez, P.J.; Kivipelto, M.; Winblad, B.; Cedazo-Minguez, A.; Cifuentes, A. Toward a predictive model of Alzheimer’s disease progression using capillary electrophoresis-mass spectrometry metabolomics. Anal. Chem. 2012, 84, 8532–8540. [Google Scholar] [CrossRef] [PubMed]
- Sato, Y.; Suzuki, I.; Nakamura, T.; Bernier, F.; Aoshima, K.; Oda, Y. Identification of a new plasma biomarker of Alzheimer’s disease using metabolomics technology. J. Lipid Res. 2012, 53, 567–576. [Google Scholar] [CrossRef]
- Ibáñez, C.; Simó, C.; Barupal, D.K.; Fiehn, O.; Kivipelto, M.; Cedazo-Mínguez, A.; Cifuentes, A. A new metabolomic workflow for early detection of Alzheimer’s disease. J. Chromatogr. A 2013, 1302, 65–71. [Google Scholar] [CrossRef] [PubMed]
- Iuliano, L.; Pacelli, A.; Ciacciarelli, M.; Zerbinati, C.; Fagioli, S.; Piras, F.; Orfei, M.D.; Bossù, P.; Pazzelli, F.; Serviddio, G.; et al. Plasma fatty acid lipidomics in amnestic mild cognitive impairment and Alzheimer’s disease. J. Alzheimers Dis. 2013, 36, 545–553. [Google Scholar] [CrossRef]
- González-Domínguez, R.; García, A.; García-Barrera, T.; Barbas, C.; Gómez-Ariza, J.L. Metabolomic profiling of serum in the progression of Alzheimer’s disease by capillary electrophoresis-mass spectrometry. Electrophoresis 2014, 35, 3321–3330. [Google Scholar] [CrossRef]
- Gonzalez-Dominguez, R.; Garcia-Barrera, T.; Gomez-Ariza, J.L. Using direct infusion mass spectrometry for serum metabolomics in Alzheimer’s disease. Anal. Bioanal. Chem. 2014, 406, 7137–7148. [Google Scholar] [CrossRef]
- González-Domínguez, R.; García-Barrera, T.; Gómez-Ariza, J.L. Metabolomic study of lipids in serum for biomarker discovery in Alzheimer’s disease using direct infusion mass spectrometry. J. Pharm. Biomed. Anal. 2014, 98, 321–326. [Google Scholar] [CrossRef]
- Wang, G.; Zhou, Y.; Huang, F.J.; Tang, H.D.; Xu, X.H.; Liu, J.J.; Wang, Y.; Deng, Y.L.; Ren, R.J.; Xu, W.; et al. Plasma metabolite profiles of Alzheimer’s disease and mild cognitive impairment. J. Proteome Res. 2014, 13, 2649–2658. [Google Scholar] [CrossRef] [PubMed]
- Gonzalez-Dominguez, R.; Garcia-Barrera, T.; Gomez-Ariza, J.L. Application of a novel metabolomic approach based on atmospheric pressure photoionization mass spectrometry using flow injection analysis for the study of Alzheimer’s disease. Talanta 2015, 131, 480–489. [Google Scholar] [CrossRef] [PubMed]
- González-Domínguez, R.; García-Barrera, T.; Gómez-Ariza, J.L. Metabolite profiling for the identification of altered metabolic pathways in Alzheimer’s disease. J. Pharm. Biomed. Anal. 2015, 107, 75–81. [Google Scholar] [CrossRef]
- Graham, S.F.; Chevallier, O.P.; Elliott, C.T.; Holscher, C.; Johnston, J.; McGuinness, B.; Kehoe, P.G.; Passmore, A.P.; Green, B.D. Untargeted metabolomic analysis of human plasma indicates differentially affected polyamine and L-arginine metabolism in mild cognitive impairment subjects converting to Alzheimer’s disease. PLoS ONE 2015, 10, e0119452. [Google Scholar] [CrossRef]
- González-Domínguez, R.; Rupérez, F.J.; García-Barrera, T.; Barbas, C.; Gómez-Ariza, J.L. Metabolomic-Driven Elucidation of Serum Disturbances Associated with Alzheimer’s Disease and Mild Cognitive Impairment. Curr. Alzheimer Res. 2016, 13, 641–653. [Google Scholar] [CrossRef]
- Paglia, G.; Stocchero, M.; Cacciatore, S.; Lai, S.; Angel, P.; Alam, M.T.; Keller, M.; Ralser, M.; Astarita, G. Unbiased Metabolomic Investigation of Alzheimer’s Disease Brain Points to Dysregulation of Mitochondrial Aspartate Metabolism. J. Proteome Res. 2016, 15, 608–618. [Google Scholar] [CrossRef]
- Vaňková, M.; Hill, M.; Velíková, M.; Včelák, J.; Vacínová, G.; Dvořáková, K.; Lukášová, P.; Vejražková, D.; Rusina, R.; Holmerová, I.; et al. Preliminary evidence of altered steroidogenesis in women with Alzheimer’s disease: Have the patients “OLDER” adrenal zona reticularis? J. Steroid. Biochem. Mol. Biol. 2016, 158, 157–177. [Google Scholar] [CrossRef]
- Xu, J.; Begley, P.; Church, S.J.; Patassini, S.; Hollywood, K.A.; Jüllig, M.; Curtis, M.A.; Waldvogel, H.J.; Faull, R.L.; Unwin, R.D.; et al. Graded perturbations of metabolism in multiple regions of human brain in Alzheimer’s disease: Snapshot of a pervasive metabolic disorder. Biochim. Biophys. Acta 2016, 1862, 1084–1092. [Google Scholar] [CrossRef]
- Chouraki, V.; Preis, S.R.; Yang, Q.; Beiser, A.; Li, S.; Larson, M.G.; Weinstein, G.; Wang, T.J.; Gerszten, R.E.; Vasan, R.S.; et al. Association of amine biomarkers with incident dementia and Alzheimer’s disease in the Framingham Study. Alzheimers Dement. 2017, 13, 1327–1336. [Google Scholar] [CrossRef] [PubMed]
- de Leeuw, F.A.; Peeters, C.F.W.; Kester, M.I.; Harms, A.C.; Struys, E.A.; Hankemeier, T.; van Vlijmen, H.W.T.; van der Lee, S.J.; van Duijn, C.M.; Scheltens, P.; et al. Blood-based metabolic signatures in Alzheimer’s disease. Alzheimers Dement. 2017, 8, 196–207. [Google Scholar] [CrossRef] [PubMed]
- Oberacher, H.; Arnhard, K.; Linhart, C.; Diwo, A.; Marksteiner, J.; Humpel, C. Targeted Metabolomic Analysis of Soluble Lysates from Platelets of Patients with Mild Cognitive Impairment and Alzheimer’s Disease Compared to Healthy Controls: Is PC aeC40:4 a Promising Diagnostic Tool? J. Alzheimers Dis. 2017, 57, 493–504. [Google Scholar] [CrossRef] [PubMed]
- Snowden, S.G.; Ebshiana, A.A.; Hye, A.; An, Y.; Pletnikova, O.; O’Brien, R.; Troncoso, J.; Legido-Quigley, C.; Thambisetty, M. Association between fatty acid metabolism in the brain and Alzheimer disease neuropathology and cognitive performance: A nontargeted metabolomic study. PLoS Med. 2017, 14, e1002266. [Google Scholar] [CrossRef]
- Hao, L.; Wang, J.; Page, D.; Asthana, S.; Zetterberg, H.; Carlsson, C.; Okonkwo, O.C.; Li, L. Comparative Evaluation of MS-based Metabolomics Software and Its Application to Preclinical Alzheimer’s Disease. Sci. Rep. 2018, 8, 9291. [Google Scholar] [CrossRef]
- Kim, S.H.; Yang, J.S.; Lee, J.C.; Lee, J.Y.; Lee, J.Y.; Kim, E.; Moon, M.H. Lipidomic alterations in lipoproteins of patients with mild cognitive impairment and Alzheimer’s disease by asymmetrical flow field-flow fractionation and nanoflow ultrahigh performance liquid chromatography-tandem mass spectrometry. J. Chromatogr. A 2018, 1568, 91–100. [Google Scholar] [CrossRef]
- Muguruma, Y.; Tsutsui, H.; Noda, T.; Akatsu, H.; Inoue, K. Widely targeted metabolomics of Alzheimer’s disease postmortem cerebrospinal fluid based on 9-fluorenylmethyl chloroformate derivatized ultra-high performance liquid chromatography tandem mass spectrometry. J. Chromatogr. B Anal. Technol. Biomed. Life Sci. 2018, 1091, 53–66. [Google Scholar] [CrossRef]
- Nasaruddin, M.L.; Pan, X.; McGuinness, B.; Passmore, P.; Kehoe, P.G.; Hölscher, C.; Graham, S.F.; Green, B.D. Evidence That Parietal Lobe Fatty Acids May Be More Profoundly Affected in Moderate Alzheimer’s Disease (AD) Pathology Than in Severe AD Pathology. Metabolites 2018, 8, 69. [Google Scholar] [CrossRef] [PubMed]
- van der Lee, S.J.; Teunissen, C.E.; Pool, R.; Shipley, M.J.; Teumer, A.; Chouraki, V.; Melo van Lent, D.; Tynkkynen, J.; Fischer, K.; Hernesniemi, J.; et al. Circulating metabolites and general cognitive ability and dementia: Evidence from 11 cohort studies. Alzheimers Dement. 2018, 14, 707–722. [Google Scholar]
- Kim, Y.H.; Shim, H.S.; Kim, K.H.; Lee, J.; Chung, B.C.; Kowall, N.W.; Ryu, H.; Lee, J. Metabolomic Analysis Identifies Alterations of Amino Acid Metabolome Signatures in the Postmortem Brain of Alzheimer’s Disease. Exp. Neurobiol. 2019, 28, 376–389. [Google Scholar] [CrossRef]
- Lin, C.N.; Huang, C.C.; Huang, K.L.; Lin, K.J.; Yen, T.C.; Kuo, H.C. A metabolomic approach to identifying biomarkers in blood of Alzheimer’s disease. Ann. Clin. Transl. Neurol. 2019, 6, 537–545. [Google Scholar] [CrossRef]
- MahmoudianDehkordi, S.; Arnold, M.; Nho, K.; Ahmad, S.; Jia, W.; Xie, G.; Louie, G.; Kueider-Paisley, A.; Moseley, M.A.; Thompson, J.W.; et al. Altered bile acid profile associates with cognitive impairment in Alzheimer’s disease-An emerging role for gut microbiome. Alzheimers Dement. 2019, 15, 76–92. [Google Scholar] [CrossRef] [PubMed]
- Marksteiner, J.; Oberacher, H.; Humpel, C. Acyl-Alkyl-Phosphatidlycholines are Decreased in Saliva of Patients with Alzheimer’s Disease as Identified by Targeted Metabolomics. J. Alzheimers Dis. 2019, 68, 583–589. [Google Scholar] [CrossRef] [PubMed]
- Peña-Bautista, C.; Roca, M.; Hervás, D.; Cuevas, A.; López-Cuevas, R.; Vento, M.; Baquero, M.; García-Blanco, A.; Cháfer-Pericás, C. Plasma metabolomics in early Alzheimer’s disease patients diagnosed with amyloid biomarker. J. Proteom. 2019, 200, 144–152. [Google Scholar] [CrossRef] [PubMed]
- Snowden, S.G.; Ebshiana, A.A.; Hye, A.; Pletnikova, O.; O’Brien, R.; Yang, A.; Troncoso, J.; Legido-Quigley, C.; Thambisetty, M. Neurotransmitter Imbalance in the Brain and Alzheimer’s Disease Pathology. J. Alzheimers Dis. 2019, 72, 35–43. [Google Scholar] [CrossRef] [PubMed]
- van der Velpen, V.; Teav, T.; Gallart-Ayala, H.; Mehl, F.; Konz, I.; Clark, C.; Oikonomidi, A.; Peyratout, G.; Henry, H.; Delorenzi, M.; et al. Systemic and central nervous system metabolic alterations in Alzheimer’s disease. Alzheimers Res. Ther. 2019, 11, 93. [Google Scholar] [CrossRef]
- Ahmad, S.; Orellana, A.; Kohler, I.; Frölich, L.; de Rojas, I.; Gil, S.; Boada, M.; Hernández, I.; Hausner, L.; Bakker, M.H.M.; et al. Association of lysophosphatidic acids with cerebrospinal fluid biomarkers and progression to Alzheimer’s disease. Alzheimers Res. Ther. 2020, 12, 124. [Google Scholar] [CrossRef]
- Shao, Y.; Ouyang, Y.; Li, T.; Liu, X.; Xu, X.; Li, S.; Xu, G.; Le, W. Alteration of Metabolic Profile and Potential Biomarkers in the Plasma of Alzheimer’s Disease. Aging Dis. 2020, 11, 1459–1470. [Google Scholar] [CrossRef]
- Byeon, S.K.; Madugundu, A.K.; Jain, A.P.; Bhat, F.A.; Jung, J.H.; Renuse, S.; Darrow, J.; Bakker, A.; Albert, M.; Moghekar, A.; et al. Cerebrospinal fluid lipidomics for biomarkers of Alzheimer’s disease. Mol. Omics 2021, 17, 454–463. [Google Scholar] [CrossRef]
- Liu, P.; Yang, Q.; Yu, N.; Cao, Y.; Wang, X.; Wang, Z.; Qiu, W.Y.; Ma, C. Phenylalanine Metabolism Is Dysregulated in Human Hippocampus with Alzheimer’s Disease Related Pathological Changes. J. Alzheimers Dis. 2021, 83, 609–622. [Google Scholar] [CrossRef]
- Liu, Y.; Thalamuthu, A.; Mather, K.A.; Crawford, J.; Ulanova, M.; Wong, M.W.K.; Pickford, R.; Sachdev, P.S.; Braidy, N. Plasma lipidome is dysregulated in Alzheimer’s disease and is associated with disease risk genes. Transl. Psychiatry 2021, 11, 344. [Google Scholar] [CrossRef]
- Nielsen, J.E.; Maltesen, R.G.; Havelund, J.F.; Færgeman, N.J.; Gotfredsen, C.H.; Vestergård, K.; Kristensen, S.R.; Pedersen, S. Characterising Alzheimer’s disease through integrative NMR- and LC-MS-based metabolomics. Metab. Open 2021, 12, 100125. [Google Scholar] [CrossRef]
- Horgusluoglu, E.; Neff, R.; Song, W.M.; Wang, M.; Wang, Q.; Arnold, M.; Krumsiek, J.; Galindo-Prieto, B.; Ming, C.; Nho, K.; et al. Integrative metabolomics-genomics approach reveals key metabolic pathways and regulators of Alzheimer’s disease. Alzheimers Dement. 2022, 18, 1260–1278. [Google Scholar] [CrossRef]
- Khan, M.J.; Chung, N.A.; Hansen, S.; Dumitrescu, L.; Hohman, T.J.; Kamboh, M.I.; Lopez, O.L.; Robinson, R.A.S. Targeted Lipidomics To Measure Phospholipids and Sphingomyelins in Plasma: A Pilot Study To Understand the Impact of Race/Ethnicity in Alzheimer’s Disease. Anal. Chem. 2022, 94, 4165–4174. [Google Scholar] [CrossRef]
- Maffioli, E.; Murtas, G.; Rabattoni, V.; Badone, B.; Tripodi, F.; Iannuzzi, F.; Licastro, D.; Nonnis, S.; Rinaldi, A.M.; Motta, Z.; et al. Insulin and serine metabolism as sex-specific hallmarks of Alzheimer’s disease in the human hippocampus. Cell Rep. 2022, 40, 111271. [Google Scholar] [CrossRef]
- Ozaki, T.; Yoshino, Y.; Tachibana, A.; Shimizu, H.; Mori, T.; Nakayama, T.; Mawatari, K.; Numata, S.; Iga, J.I.; Takahashi, A.; et al. Metabolomic alterations in the blood plasma of older adults with mild cognitive impairment and Alzheimer’s disease (from the Nakayama Study). Sci. Rep. 2022, 12, 15205. [Google Scholar] [CrossRef] [PubMed]
- Peña-Bautista, C.; Álvarez-Sánchez, L.; Roca, M.; García-Vallés, L.; Baquero, M.; Cháfer-Pericás, C. Plasma Lipidomics Approach in Early and Specific Alzheimer’s Disease Diagnosis. J. Clin. Med. 2022, 11, 5030. [Google Scholar] [CrossRef] [PubMed]
- Weng, J.; Muti, I.H.; Zhong, A.B.; Kivisäkk, P.; Hyman, B.T.; Arnold, S.E.; Cheng, L.L. A Nuclear Magnetic Resonance Spectroscopy Method in Characterization of Blood Metabolomics for Alzheimer’s Disease. Metabolites 2022, 12, 181. [Google Scholar] [CrossRef]
- Roche, S.; Gabelle, A.; Lehmann, S. Clinical proteomics of the cerebrospinal fluid: Towards the discovery of new biomarkers. Proteom. Clin. Appl. 2008, 2, 428–436. [Google Scholar] [CrossRef] [PubMed]
- Schraen-Maschke, S.; Sergeant, N.; Dhaenens, C.M.; Bombois, S.; Deramecourt, V.; Caillet-Boudin, M.L.; Pasquier, F.; Maurage, C.A.; Sablonnière, B.; Vanmechelen, E.; et al. Tau as a biomarker of neurodegenerative diseases. Biomark. Med. 2008, 2, 363–384. [Google Scholar] [CrossRef]
- Andreasen, N.; Blennow, K. CSF biomarkers for mild cognitive impairment and early Alzheimer’s disease. Clin. Neurol. Neurosurg. 2005, 107, 165–173. [Google Scholar] [CrossRef]
- Guzman-Martinez, L.; Maccioni, R.B.; Farías, G.A.; Fuentes, P.; Navarrete, L.P. Biomarkers for Alzheimer’s Disease. Curr. Alzheimer Res. 2019, 16, 518–528. [Google Scholar] [CrossRef]
- Henriksen, K.; O’Bryant, S.E.; Hampel, H.; Trojanowski, J.Q.; Montine, T.J.; Jeromin, A.; Blennow, K.; Lönneborg, A.; Wyss-Coray, T.; Soares, H.; et al. The future of blood-based biomarkers for Alzheimer’s disease. Alzheimers Dement. 2014, 10, 115–131. [Google Scholar] [CrossRef] [PubMed]
- de Lange, E.C.M.; Hammarlund Udenaes, M. Understanding the Blood-Brain Barrier and Beyond: Challenges and Opportunities for Novel CNS Therapeutics. Clin. Pharmacol. Ther. 2022, 111, 758–773. [Google Scholar] [CrossRef]
- Veitch, D.P.; Weiner, M.W.; Aisen, P.S.; Beckett, L.A.; DeCarli, C.; Green, R.C.; Harvey, D.; Jack, C.R., Jr.; Jagust, W.; Landau, S.M.; et al. Using the Alzheimer’s Disease Neuroimaging Initiative to improve early detection, diagnosis, and treatment of Alzheimer’s disease. Alzheimers Dement. 2022, 18, 824–857. [Google Scholar] [CrossRef]
- Arnold, M.; Nho, K.; Kueider-Paisley, A.; Massaro, T.; Huynh, K.; Brauner, B.; MahmoudianDehkordi, S.; Louie, G.; Moseley, M.A.; Thompson, J.W.; et al. Sex and APOE ε4 genotype modify the Alzheimer’s disease serum metabolome. Nat. Commun. 2020, 11, 1148. [Google Scholar] [CrossRef] [PubMed]
- Qin, T.; Prins, S.; Groeneveld, G.J.; Van Westen, G.; de Vries, H.E.; Wong, Y.C.; Bischoff, L.J.M.; de Lange, E.C.M. Utility of Animal Models to Understand Human Alzheimer’s Disease, Using the Mastermind Research Approach to Avoid Unnecessary Further Sacrifices of Animals. Int. J. Mol. Sci. 2020, 21, 3158. [Google Scholar] [CrossRef]
- Drummond, E.; Wisniewski, T. Alzheimer’s disease: Experimental models and reality. Acta Neuropathol. 2017, 133, 155–175. [Google Scholar] [CrossRef]
- Boutajangout, A.; Wisniewski, T. Tau-based therapeutic approaches for Alzheimer’s disease—A mini-review. Gerontology 2014, 60, 381–385. [Google Scholar] [CrossRef] [PubMed]
- Dujardin, S.; Colin, M.; Buée, L. Invited review: Animal models of tauopathies and their implications for research/translation into the clinic. Neuropathol. Appl. Neurobiol. 2015, 41, 59–80. [Google Scholar] [CrossRef]
- Puzzo, D.; Gulisano, W.; Palmeri, A.; Arancio, O. Rodent models for Alzheimer’s disease drug discovery. Expert Opin. Drug Discov. 2015, 10, 703–711. [Google Scholar] [CrossRef]
- Kitazawa, M.; Medeiros, R.; Laferla, F.M. Transgenic mouse models of Alzheimer disease: Developing a better model as a tool for therapeutic interventions. Curr. Pharm. Des. 2012, 18, 1131–1147. [Google Scholar] [CrossRef]
- Hamanaka, H.; Katoh-Fukui, Y.; Suzuki, K.; Kobayashi, M.; Suzuki, R.; Motegi, Y.; Nakahara, Y.; Takeshita, A.; Kawai, M.; Ishiguro, K.; et al. Altered cholesterol metabolism in human apolipoprotein E4 knock-in mice. Hum. Mol. Genet. 2000, 9, 353–361. [Google Scholar] [CrossRef] [PubMed]
- Tai, L.M.; Youmans, K.L.; Jungbauer, L.; Yu, C.; Ladu, M.J. Introducing Human APOE into Aβ Transgenic Mouse Models. Int. J. Alzheimers Dis. 2011, 2011, 810981. [Google Scholar] [PubMed]
- Salek, R.M.; Xia, J.; Innes, A.; Sweatman, B.C.; Adalbert, R.; Randle, S.; McGowan, E.; Emson, P.C.; Griffin, J.L. A metabolomic study of the CRND8 transgenic mouse model of Alzheimer’s disease. Neurochem. Int. 2010, 56, 937–947. [Google Scholar] [CrossRef]
- Hu, Z.P.; Browne, E.R.; Liu, T.; Angel, T.E.; Ho, P.C.; Chan, E.C. Metabonomic profiling of TASTPM transgenic Alzheimer’s disease mouse model. J. Proteome Res. 2012, 11, 5903–5913. [Google Scholar] [CrossRef]
- Trushina, E.; Nemutlu, E.; Zhang, S.; Christensen, T.; Camp, J.; Mesa, J.; Siddiqui, A.; Tamura, Y.; Sesaki, H.; Wengenack, T.M.; et al. Defects in mitochondrial dynamics and metabolomic signatures of evolving energetic stress in mouse models of familial Alzheimer’s disease. PLoS ONE 2012, 7, e32737. [Google Scholar] [CrossRef]
- Tajima, Y.; Ishikawa, M.; Maekawa, K.; Murayama, M.; Senoo, Y.; Nishimaki-Mogami, T.; Nakanishi, H.; Ikeda, K.; Arita, M.; Taguchi, R.; et al. Lipidomic analysis of brain tissues and plasma in a mouse model expressing mutated human amyloid precursor protein/tau for Alzheimer’s disease. Lipids Health Dis. 2013, 12, 68. [Google Scholar] [CrossRef]
- González-Domínguez, R.; García-Barrera, T.; Vitorica, J.; Gómez-Ariza, J.L. Region-specific metabolic alterations in the brain of the APP/PS1 transgenic mice of Alzheimer’s disease. Biochim. Biophys. Acta 2014, 1842 Pt A, 2395–2402. [Google Scholar] [CrossRef]
- Kim, E.; Jung, Y.S.; Kim, H.; Kim, J.S.; Park, M.; Jeong, J.; Lee, S.K.; Yoon, H.G.; Hwang, G.S.; Namkoong, K. Metabolomic signatures in peripheral blood associated with Alzheimer’s disease amyloid-beta-induced neuroinflammation. J. Alzheimers Dis. 2014, 42, 421–433. [Google Scholar] [CrossRef]
- Lalande, J.; Halley, H.; Balayssac, S.; Gilard, V.; Déjean, S.; Martino, R.; Francés, B.; Lassalle, J.M.; Malet-Martino, M. 1H NMR metabolomic signatures in five brain regions of the AβPPswe Tg2576 mouse model of Alzheimer’s disease at four ages. J. Alzheimers Dis. 2014, 39, 121–143. [Google Scholar] [CrossRef]
- Gonzalez-Dominguez, R.; Garcia-Barrera, T.; Vitorica, J.; Gomez-Ariza, J.L. Application of metabolomics based on direct mass spectrometry analysis for the elucidation of altered metabolic pathways in serum from the APP/PS1 transgenic model of Alzheimer’s disease. J. Pharm. Biomed. Anal. 2015, 107, 378–385. [Google Scholar] [CrossRef]
- González-Domínguez, R.; García-Barrera, T.; Vitorica, J.; Gómez-Ariza, J.L. Deciphering metabolic abnormalities associated with Alzheimer’s disease in the APP/PS1 mouse model using integrated metabolomic approaches. Biochimie 2015, 110, 119–128. [Google Scholar] [CrossRef]
- González-Domínguez, R.; García-Barrera, T.; Vitorica, J.; Gómez-Ariza, J.L. Metabolomic screening of regional brain alterations in the APP/PS1 transgenic model of Alzheimer’s disease by direct infusion mass spectrometry. J. Pharm. Biomed. Anal. 2015, 102, 425–435. [Google Scholar] [CrossRef] [PubMed]
- Li, N.; Zhou, L.; Li, W.; Liu, Y.; Wang, J.; He, P. Protective effects of ginsenosides Rg1 and Rb1 on an Alzheimer’s disease mouse model: A metabolomics study. J. Chromatogr. B 2015, 985, 54–61. [Google Scholar] [CrossRef]
- Li, N.; Liu, Y.; Li, W.; Zhou, L.; Li, Q.; Wang, X.; He, P. A UPLC/MS-based metabolomics investigation of the protective effect of ginsenosides Rg1 and Rg2 in mice with Alzheimer’s disease. J. Ginseng Res. 2016, 40, 9–17. [Google Scholar] [CrossRef]
- Pan, X.; Nasaruddin, M.B.; Elliott, C.T.; McGuinness, B.; Passmore, A.P.; Kehoe, P.G.; Hölscher, C.; McClean, P.L.; Graham, S.F.; Green, B.D. Alzheimer’s disease-like pathology has transient effects on the brain and blood metabolome. Neurobiol. Aging 2016, 38, 151–163. [Google Scholar] [CrossRef] [PubMed]
- Nuriel, T.; Angulo, S.L.; Khan, U.; Ashok, A.; Chen, Q.; Figueroa, H.Y.; Emrani, S.; Liu, L.; Herman, M.; Barrett, G.; et al. Neuronal hyperactivity due to loss of inhibitory tone in APOE4 mice lacking Alzheimer’s disease-like pathology. Nat. Commun. 2017, 8, 1464. [Google Scholar] [CrossRef]
- Pan, X.; Elliott, C.T.; McGuinness, B.; Passmore, P.; Kehoe, P.G.; Hölscher, C.; McClean, P.L.; Graham, S.F.; Green, B.D. Metabolomic Profiling of Bile Acids in Clinical and Experimental Samples of Alzheimer’s Disease. Metabolites 2017, 7, 28. [Google Scholar] [CrossRef]
- Bergin, D.H.; Jing, Y.; Mockett, B.G.; Zhang, H.; Abraham, W.C.; Liu, P. Altered plasma arginine metabolome precedes behavioural and brain arginine metabolomic profile changes in the APPswe/PS1ΔE9 mouse model of Alzheimer’s disease. Transl. Psychiatry 2018, 8, 108. [Google Scholar] [CrossRef]
- Gao, H.L.; Zhang, A.H.; Yu, J.B.; Sun, H.; Kong, L.; Wang, X.Q.; Yan, G.L.; Liu, L.; Wang, X.J. High-throughput lipidomics characterize key lipid molecules as potential therapeutic targets of Kaixinsan protects against Alzheimer’s disease in APP/PS1 transgenic mice. J. Chromatogr. B Anal. Technol. Biomed. Life Sci. 2018, 1092, 286–295. [Google Scholar] [CrossRef]
- Sun, L.M.; Zhu, B.J.; Cao, H.T.; Zhang, X.Y.; Zhang, Q.C.; Xin, G.Z.; Pan, L.M.; Liu, L.F.; Zhu, H.X. Explore the effects of Huang-Lian-Jie-Du-Tang on Alzheimer’s disease by UPLC-QTOF/MS-based plasma metabolomics study. J. Pharm. Biomed. Anal. 2018, 151, 75–83. [Google Scholar] [CrossRef]
- Zheng, H.; Zhou, Q.; Du, Y.; Li, C.; Xu, P.; Lin, L.; Xiao, J.; Gao, H. The hypothalamus as the primary brain region of metabolic abnormalities in APP/PS1 transgenic mouse model of Alzheimer’s disease. Biochim. Biophys. Acta BBA-Mol. Basis Dis. 2018, 1864, 263–273. [Google Scholar] [CrossRef]
- Zhou, Q.; Zheng, H.; Chen, J.; Li, C.; Du, Y.; Xia, H.; Gao, H. Metabolic fate of glucose in the brain of APP/PS1 transgenic mice at 10 months of age: A (13)C NMR metabolomic study. Metab. Brain Dis. 2018, 33, 1661–1668. [Google Scholar] [CrossRef] [PubMed]
- Chang, K.L.; Wong, L.R.; Pee, H.N.; Yang, S.; Ho, P.C. Reverting Metabolic Dysfunction in Cortex and Cerebellum of APP/PS1 Mice, a Model for Alzheimer’s Disease by Pioglitazone, a Peroxisome Proliferator-Activated Receptor Gamma (PPARγ) Agonist. Mol. Neurobiol. 2019, 56, 7267–7283. [Google Scholar] [CrossRef] [PubMed]
- Li, G.; Zhang, N.; Geng, F.; Liu, G.; Liu, B.; Lei, X.; Li, G.; Chen, X. High-throughput metabolomics and ingenuity pathway approach reveals the pharmacological effect and targets of Ginsenoside Rg1 in Alzheimer’s disease mice. Sci. Rep. 2019, 9, 7040. [Google Scholar] [CrossRef]
- Liu, X.; Wang, W.; Chen, H.L.; Zhang, H.Y.; Zhang, N.X. Interplay between Alzheimer’s disease and global glucose metabolism revealed by the metabolic profile alterations of pancreatic tissue and serum in APP/PS1 transgenic mice. Acta Pharmacol. Sin. 2019, 40, 1259–1268. [Google Scholar] [CrossRef]
- Liu, Y.; Du, T.; Zhang, W.; Lu, W.; Peng, Z.; Huang, S.; Sun, X.; Zhu, X.; Chen, C.; Qian, L.; et al. Modified Huang-Lian-Jie-Du Decoction Ameliorates Aβ Synaptotoxicity in a Murine Model of Alzheimer’s Disease. Oxid. Med. Cell Longev. 2019, 2019, 8340192. [Google Scholar] [CrossRef]
- Pan, X.; Green, B.D. Temporal Effects of Neuron-specific beta-secretase 1 (BACE1) Knock-in on the Mouse Brain Metabolome: Implications for Alzheimer’s Disease. Neuroscience 2019, 397, 138–146. [Google Scholar] [CrossRef]
- Rong, W.; Ding, K.; Guo, S.; Xie, F.; Li, Q.; Bi, K. Metabolomics analysis of Xanthoceras sorbifolia husks protection of rats against Alzheimer’s disease using liquid chromatography mass spectrometry. J. Chromatogr. B Anal. Technol. Biomed. Life Sci. 2019, 1126–1127, 121739. [Google Scholar] [CrossRef]
- Hunsberger, H.C.; Greenwood, B.P.; Tolstikov, V.; Narain, N.R.; Kiebish, M.A.; Denny, C.A. Divergence in the metabolome between natural aging and Alzheimer’s disease. Sci. Rep. 2020, 10, 12171. [Google Scholar] [CrossRef]
- Kim, H.; Kim, B.; Kim, H.S.; Cho, J.Y. Nicotinamide attenuates the decrease in dendritic spine density in hippocampal primary neurons from 5xFAD mice, an Alzheimer’s disease animal model. Mol. Brain 2020, 13, 17. [Google Scholar] [CrossRef]
- Sun, W.; Liu, C.; Zhou, X.; Li, X.; Chu, X.; Wang, X.; Han, F. Serum lipidomics study reveals protective effects of Rhodiola crenulata extract on Alzheimer’s disease rats. J. Chromatogr. B Anal. Technol. Biomed. Life Sci. 2020, 1158, 122346. [Google Scholar] [CrossRef] [PubMed]
- Tondo, M.; Wasek, B.; Escola-Gil, J.C.; de Gonzalo-Calvo, D.; Harmon, C.; Arning, E.; Bottiglieri, T. Altered Brain Metabolome Is Associated with Memory Impairment in the rTg4510 Mouse Model of Tauopathy. Metabolites 2020, 10, 69. [Google Scholar] [CrossRef]
- Yi, M.; Zhang, C.; Zhang, Z.; Yi, P.; Xu, P.; Huang, J.; Peng, W. Integrated Metabolomic and Lipidomic Analysis Reveals the Neuroprotective Mechanisms of Bushen Tiansui Formula in an Aβ1-42-Induced Rat Model of Alzheimer’s Disease. Oxid. Med. Cell. Longev. 2020, 2020, 5243453. [Google Scholar] [CrossRef]
- Zhang, X.; Liu, W.; Cao, Y.; Tan, W. Hippocampus Proteomics and Brain Lipidomics Reveal Network Dysfunction and Lipid Molecular Abnormalities in APP/PS1 Mouse Model of Alzheimer’s Disease. J. Proteome Res. 2020, 19, 3427–3437. [Google Scholar] [CrossRef] [PubMed]
- Zhang, X.; Liu, W.; Zan, J.; Wu, C.; Tan, W. Untargeted lipidomics reveals progression of early Alzheimer’s disease in APP/PS1 transgenic mice. Sci. Rep. 2020, 10, 14509. [Google Scholar] [CrossRef]
- Dejakaisaya, H.; Harutyunyan, A.; Kwan, P.; Jones, N.C. Altered metabolic pathways in a transgenic mouse model suggest mechanistic role of amyloid precursor protein overexpression in Alzheimer’s disease. Metabolomics 2021, 17, 42. [Google Scholar] [CrossRef]
- Speers, A.B.; García-Jaramillo, M.; Feryn, A.; Matthews, D.G.; Lichtenberg, T.; Caruso, M.; Wright, K.M.; Quinn, J.F.; Stevens, J.F.; Maier, C.S.; et al. Centella asiatica Alters Metabolic Pathways Associated With Alzheimer’s Disease in the 5xFAD Mouse Model of ß-Amyloid Accumulation. Front. Pharmacol. 2021, 12, 788312. [Google Scholar] [CrossRef] [PubMed]
- Sun, W.; Liu, C.; Wang, Y.; Zhou, X.; Sui, W.; Zhang, Y.; Zhang, Q.; Han, J.; Li, X.; Han, F. Rhodiola crenulata protects against Alzheimer’s disease in rats: A brain lipidomics study by Fourier-transform ion cyclotron resonance mass spectrometry coupled with high-performance reversed-phase liquid chromatography and hydrophilic interaction liquid chromatography. Rapid Commun. Mass Spectrom. RCM 2021, 35, e8969. [Google Scholar]
- Zhao, Y.; Chen, H.; Iqbal, J.; Liu, X.; Zhang, H.; Xiao, S.; Jin, N.; Yao, F.; Shen, L. Targeted metabolomics study of early pathological features in hippocampus of triple transgenic Alzheimer’s disease male mice. J. Neurosci. Res. 2021, 99, 927–946. [Google Scholar] [CrossRef]
- Cheng, X.; Tan, Y.; Li, H.; Huang, J.; Zhao, D.; Zhang, Z.; Yi, M.; Zhu, L.; Hui, S.; Yang, J.; et al. Fecal 16S rRNA sequencing and multi-compartment metabolomics revealed gut microbiota and metabolites interactions in APP/PS1 mice. Comput. Biol. Med. 2022, 151 Pt A, 106312. [Google Scholar] [CrossRef]
- Dai, Z.; Hu, T.; Su, S.; Liu, J.; Ma, Y.; Zhuo, Y.; Fang, S.; Wang, Q.; Mo, Z.; Pan, H.; et al. Comparative Metabolomics Analysis Reveals Key Metabolic Mechanisms and Protein Biomarkers in Alzheimer’s Disease. Front. Pharmacol. 2022, 13, 904857. [Google Scholar] [CrossRef] [PubMed]
- Dehghan, A.; Pinto, R.C.; Karaman, I.; Huang, J.; Durainayagam, B.R.; Ghanbari, M.; Nazeer, A.; Zhong, Q.; Liggi, S.; Whiley, L.; et al. Metabolome-wide association study on ABCA7 indicates a role of ceramide metabolism in Alzheimer’s disease. Proc. Natl. Acad. Sci. USA 2022, 119, e2206083119. [Google Scholar] [CrossRef] [PubMed]
- Dunham, S.J.B.; McNair, K.A.; Adams, E.D.; Avelar-Barragan, J.; Forner, S.; Mapstone, M.; Whiteson, K.L. Longitudinal Analysis of the Microbiome and Metabolome in the 5xfAD Mouse Model of Alzheimer’s Disease. mBio 2022, 13, e0179422. [Google Scholar] [CrossRef] [PubMed]
- Sun, P.; Zhu, H.; Li, X.; Shi, W.; Guo, Y.; Du, X.; Zhang, L.; Su, L.; Qin, C. Comparative Metagenomics and Metabolomes Reveals Abnormal Metabolism Activity Is Associated with Gut Microbiota in Alzheimer’s Disease Mice. Int. J. Mol. Sci. 2022, 23, 11560. [Google Scholar] [CrossRef] [PubMed]
- Trushina, E.; Mielke, M.M. Recent advances in the application of metabolomics to Alzheimer’s Disease. Biochim. Biophys. Acta BBA-Mol. Basis Dis. 2014, 1842, 1232–1239. [Google Scholar] [CrossRef]
- Xia, J.; Wishart, D.S. MetPA: A web-based metabolomics tool for pathway analysis and visualization. Bioinformatics 2010, 26, 2342–2344. [Google Scholar] [CrossRef]
- Wu, G.; Morris, S.M., Jr. Arginine metabolism: Nitric oxide and beyond. Biochem. J. 1998, 336 Pt 1, 1–17. [Google Scholar] [CrossRef]
- Morris, S.M., Jr. Enzymes of Arginine Metabolism. J. Nutr. 2004, 134, 2743S–2747S. [Google Scholar] [CrossRef]
- Aktan, F. iNOS-mediated nitric oxide production and its regulation. Life Sci. 2004, 75, 639–653. [Google Scholar] [CrossRef]
- Ellison, D.W.; Beal, M.F.; Mazurek, M.F.; Bird, E.D.; Martin, J.B. A postmortem study of amino acid neurotransmitters in Alzheimer’s disease. Ann. Neurol. 1986, 20, 616–621. [Google Scholar] [CrossRef]
- Tumani, H.; Shen, G.; Peter, J.B.; Brück, W. Glutamine synthetase in cerebrospinal fluid, serum, and brain: A diagnostic marker for Alzheimer disease? Arch. Neurol. 1999, 56, 1241–1246. [Google Scholar] [CrossRef]
- Satriano, J. Arginine pathways and the inflammatory response: Interregulation of nitric oxide and polyamines: Review article. Amino Acids 2004, 26, 321–329. [Google Scholar] [CrossRef]
- Zhou, L.; Zhu, D.Y. Neuronal nitric oxide synthase: Structure, subcellular localization, regulation, and clinical implications. Nitric Oxide 2009, 20, 223–230. [Google Scholar] [CrossRef] [PubMed]
- Susswein, A.J.; Katzoff, A.; Miller, N.; Hurwitz, I. Nitric oxide and memory. Neuroscientist 2004, 10, 153–162. [Google Scholar] [CrossRef] [PubMed]
- Feil, R.; Kleppisch, T. NO/cGMP-dependent modulation of synaptic transmission. In Pharmacology of Neurotransmitter Release; Handbook of Experimental Pharmacology; Springer: Berlin/Heidelberg, Germany, 2008; pp. 529–560. [Google Scholar]
- Böger, R.H.; Bode-Böger, S.M.; Frölich, J.C. The L-arginine-nitric oxide pathway: Role in atherosclerosis and therapeutic implications. Atherosclerosis 1996, 127, 1–11. [Google Scholar] [CrossRef] [PubMed]
- Cooke, J.P.; Dzau, V.J. Nitric oxide synthase: Role in the genesis of vascular disease. Annu. Rev. Med. 1997, 48, 489–509. [Google Scholar] [CrossRef]
- Cooke, J.P. The pivotal role of nitric oxide for vascular health. Can. J. Cardiol. 2004, 20 (Suppl. B), 7b–15b. [Google Scholar]
- Li, X.A.; Everson, W.; Smart, E.J. Nitric oxide, caveolae, and vascular pathology. Cardiovasc. Toxicol. 2006, 6, 1–13. [Google Scholar] [CrossRef] [PubMed]
- Napoli, C.; de Nigris, F.; Williams-Ignarro, S.; Pignalosa, O.; Sica, V.; Ignarro, L.J. Nitric oxide and atherosclerosis: An update. Nitric Oxide 2006, 15, 265–279. [Google Scholar] [CrossRef] [PubMed]
- Fonnum, F. Glutamate: A neurotransmitter in mammalian brain. J. Neurochem. 1984, 42, 1–11. [Google Scholar] [CrossRef]
- Francis, P.T.; Sims, N.R.; Procter, A.W.; Bowen, D.M. Cortical pyramidal neurone loss may cause glutamatergic hypoactivity and cognitive impairment in Alzheimer’s disease: Investigative and therapeutic perspectives. J. Neurochem. 1993, 60, 1589–1604. [Google Scholar] [CrossRef]
- Bruno, V.; Battaglia, G.; Copani, A.; D’Onofrio, M.; Di Iorio, P.; De Blasi, A.; Melchiorri, D.; Flor, P.J.; Nicoletti, F. Metabotropic glutamate receptor subtypes as targets for neuroprotective drugs. J. Cereb. Blood Flow Metab. 2001, 21, 1013–1033. [Google Scholar] [CrossRef]
- Gadea, A.; López-Colomé, A.M. Glial transporters for glutamate, glycine and GABA I. Glutamate transporters. J. Neurosci. Res. 2001, 63, 453–460. [Google Scholar] [CrossRef] [PubMed]
- Ozawa, S.; Kamiya, H.; Tsuzuki, K. Glutamate receptors in the mammalian central nervous system. Prog. Neurobiol. 1998, 54, 581–618. [Google Scholar] [CrossRef] [PubMed]
- Lynch, G. Memory and the brain: Unexpected chemistries and a new pharmacology. Neurobiol. Learn. Mem. 1998, 70, 82–100. [Google Scholar] [CrossRef] [PubMed]
- Riedel, G.; Micheau, J. Function of the hippocampus in memory formation: Desperately seeking resolution. Prog. Neuropsychopharmacol. Biol. Psychiatry 2001, 25, 835–853. [Google Scholar] [CrossRef]
- Myhrer, T. Effects of selective perirhinal and postrhinal lesions on acquisition and retention of a visual discrimination task in rats. Neurobiol. Learn. Mem. 2000, 73, 68–78. [Google Scholar] [CrossRef]
- Baudry, M.; Lynch, G. Remembrance of arguments past: How well is the glutamate receptor hypothesis of LTP holding up after 20 years? Neurobiol. Learn. Mem. 2001, 76, 284–297. [Google Scholar] [CrossRef]
- Jay, T.M.; Zilkha, E.; Obrenovitch, T.P. Long-term potentiation in the dentate gyrus is not linked to increased extracellular glutamate concentration. J. Neurophysiol. 1999, 81, 1741–1748. [Google Scholar] [CrossRef]
- Scannevin, R.H.; Huganir, R.L. Postsynaptic organization and regulation of excitatory synapses. Nat. Rev. Neurosci. 2000, 1, 133–141. [Google Scholar] [CrossRef]
- Ansoleaga, B.; Jové, M.; Schlüter, A.; Garcia-Esparcia, P.; Moreno, J.; Pujol, A.; Pamplona, R.; Portero-Otín, M.; Ferrer, I. Deregulation of purine metabolism in Alzheimer’s disease. Neurobiol. Aging 2015, 36, 68–80. [Google Scholar] [CrossRef] [PubMed]
- Ipata, P.L.; Camici, M.; Micheli, V.; Tozz, M.G. Metabolic network of nucleosides in the brain. Curr. Top. Med. Chem. 2011, 11, 909–922. [Google Scholar] [CrossRef] [PubMed]
- Ferreira, I.L.; Resende, R.; Ferreiro, E.; Rego, A.C.; Pereira, C.F. Multiple defects in energy metabolism in Alzheimer’s disease. Curr. Drug Targets 2010, 11, 1193–1206. [Google Scholar] [CrossRef] [PubMed]
- Ferrer, I. Altered mitochondria, energy metabolism, voltage-dependent anion channel, and lipid rafts converge to exhaust neurons in Alzheimer’s disease. J. Bioenerg. Biomembr. 2009, 41, 425–431. [Google Scholar] [CrossRef]
- Lovell, M.A.; Markesbery, W.R. Oxidatively modified RNA in mild cognitive impairment. Neurobiol. Dis. 2008, 29, 169–175. [Google Scholar] [CrossRef]
- Lovell, M.A.; Soman, S.; Bradley, M.A. Oxidatively modified nucleic acids in preclinical Alzheimer’s disease (PCAD) brain. Mech. Ageing Dev. 2011, 132, 443–448. [Google Scholar] [CrossRef]
- Markesbery, W.R.; Lovell, M.A. DNA oxidation in Alzheimer’s disease. Antioxid. Redox Signal. 2006, 8, 2039–2045. [Google Scholar] [CrossRef] [PubMed]
- Nunomura, A.; Tamaoki, T.; Motohashi, N.; Nakamura, M.; McKeel, D.W., Jr.; Tabaton, M.; Lee, H.G.; Smith, M.A.; Perry, G.; Zhu, X. The earliest stage of cognitive impairment in transition from normal aging to Alzheimer disease is marked by prominent RNA oxidation in vulnerable neurons. J. Neuropathol. Exp. Neurol. 2012, 71, 233–241. [Google Scholar] [CrossRef]
- Kaddurah-Daouk, R.; Rozen, S.; Matson, W.; Han, X.; Hulette, C.M.; Burke, J.R.; Doraiswamy, P.M.; Welsh-Bohmer, K.A. Metabolomic changes in autopsy-confirmed Alzheimer’s disease. Alzheimers Dement. 2011, 7, 309–317. [Google Scholar] [CrossRef]
- Isobe, C.; Abe, T.; Terayama, Y. Levels of reduced and oxidized coenzyme Q-10 and 8-hydroxy-2’-deoxyguanosine in the CSF of patients with Alzheimer’s disease demonstrate that mitochondrial oxidative damage and/or oxidative DNA damage contributes to the neurodegenerative process. J. Neurol. 2010, 257, 399–404. [Google Scholar] [CrossRef]
- Kaddurah-Daouk, R.; Zhu, H.; Sharma, S.; Bogdanov, M.; Rozen, S.G.; Matson, W.; Oki, N.O.; Motsinger-Reif, A.A.; Churchill, E.; Lei, Z.; et al. Alterations in metabolic pathways and networks in Alzheimer’s disease. Transl. Psychiatry 2013, 3, e244. [Google Scholar] [CrossRef] [PubMed]
- Jové, M.; Portero-Otín, M.; Naudí, A.; Ferrer, I.; Pamplona, R. Metabolomics of human brain aging and age-related neurodegenerative diseases. J. Neuropathol. Exp. Neurol. 2014, 73, 640–657. [Google Scholar] [CrossRef] [PubMed]
- Frosini, M.; Sesti, C.; Saponara, S.; Ricci, L.; Valoti, M.; Palmi, M.; Machetti, F.; Sgaragli, G. A specific taurine recognition site in the rabbit brain is responsible for taurine effects on thermoregulation. Br. J. Pharmacol. 2003, 139, 487–494. [Google Scholar] [CrossRef]
- Bhat, M.A.; Ahmad, K.; Khan, M.S.A.; Bhat, M.A.; Almatroudi, A.; Rahman, S.; Jan, A.T. Expedition into Taurine Biology: Structural Insights and Therapeutic Perspective of Taurine in Neurodegenerative Diseases. Biomolecules 2020, 10, 863. [Google Scholar] [CrossRef]
- Qaradakhi, T.; Gadanec, L.K.; McSweeney, K.R.; Abraham, J.R.; Apostolopoulos, V.; Zulli, A. The Anti-Inflammatory Effect of Taurine on Cardiovascular Disease. Nutrients 2020, 12, 2847. [Google Scholar] [CrossRef]
- Schaffer, S.W.; Azuma, J.; Mozaffari, M. Role of antioxidant activity of taurine in diabetes. Can. J. Physiol. Pharmacol. 2009, 87, 91–99. [Google Scholar] [CrossRef]
- Schaffer, S.; Takahashi, K.; Azuma, J. Role of osmoregulation in the actions of taurine. Amino Acids 2000, 19, 527–546. [Google Scholar] [CrossRef] [PubMed]
- Foos, T.M.; Wu, J.Y. The role of taurine in the central nervous system and the modulation of intracellular calcium homeostasis. Neurochem. Res. 2002, 27, 21–26. [Google Scholar] [CrossRef]
- Vohra, B.P.; Hui, X. Improvement of impaired memory in mice by taurine. Neural Plast. 2000, 7, 245–259. [Google Scholar] [CrossRef]
- Su, Y.; Fan, W.; Ma, Z.; Wen, X.; Wang, W.; Wu, Q.; Huang, H. Taurine improves functional and histological outcomes and reduces inflammation in traumatic brain injury. Neuroscience 2014, 266, 56–65. [Google Scholar] [CrossRef]
- Malcangio, M.; Bartolini, A.; Ghelardini, C.; Bennardini, F.; Malmberg-Aiello, P.; Franconi, F.; Giotti, A. Effect of ICV taurine on the impairment of learning, convulsions and death caused by hypoxia. Psychopharmacology 1989, 98, 316–320. [Google Scholar] [CrossRef]
- Javed, H.; Khan, A.; Vaibhav, K.; Moshahid Khan, M.; Ahmad, A.; Ejaz Ahmad, M.; Ahmad, A.; Tabassum, R.; Islam, F.; Safhi, M.M.; et al. Taurine ameliorates neurobehavioral, neurochemical and immunohistochemical changes in sporadic dementia of Alzheimer’s type (SDAT) caused by intracerebroventricular streptozotocin in rats. Neurol. Sci. 2013, 34, 2181–2192. [Google Scholar] [CrossRef] [PubMed]
- Santa-María, I.; Hernández, F.; Moreno, F.J.; Avila, J. Taurine, an inducer for tau polymerization and a weak inhibitor for amyloid-beta-peptide aggregation. Neurosci. Lett. 2007, 429, 91–94. [Google Scholar] [CrossRef] [PubMed]
- Pan, C.; Prentice, H.; Price, A.L.; Wu, J.Y. Beneficial effect of taurine on hypoxia- and glutamate-induced endoplasmic reticulum stress pathways in primary neuronal culture. Amino Acids 2012, 43, 845–855. [Google Scholar] [CrossRef]
- Ferreira-Vieira, T.H.; Guimaraes, I.M.; Silva, F.R.; Ribeiro, F.M. Alzheimer’s disease: Targeting the Cholinergic System. Curr. Neuropharmacol. 2016, 14, 101–115. [Google Scholar] [CrossRef]
- Kása, P.; Rakonczay, Z.; Gulya, K. The cholinergic system in Alzheimer’s disease. Prog. Neurobiol. 1997, 52, 511–535. [Google Scholar] [CrossRef]
- Hampel, H.; Mesulam, M.M.; Cuello, A.C.; Farlow, M.R.; Giacobini, E.; Grossberg, G.T.; Khachaturian, A.S.; Vergallo, A.; Cavedo, E.; Snyder, P.J.; et al. The cholinergic system in the pathophysiology and treatment of Alzheimer’s disease. Brain 2018, 141, 1917–1933. [Google Scholar] [CrossRef] [PubMed]
- de Carvalho, C.; Caramujo, M.J. The Various Roles of Fatty Acids. Molecules 2018, 23, 2583. [Google Scholar] [CrossRef]
- Kao, Y.C.; Ho, P.C.; Tu, Y.K.; Jou, I.M.; Tsai, K.J. Lipids and Alzheimer’s Disease. Int. J. Mol. Sci. 2020, 21, 1505. [Google Scholar] [CrossRef]
- Fonteh, A.N.; Cipolla, M.; Chiang, A.J.; Edminster, S.P.; Arakaki, X.; Harrington, M.G. Polyunsaturated Fatty Acid Composition of Cerebrospinal Fluid Fractions Shows Their Contribution to Cognitive Resilience of a Pre-symptomatic Alzheimer’s Disease Cohort. Front. Physiol. 2020, 11, 83. [Google Scholar] [CrossRef]
- Cunnane, S.C.; Schneider, J.A.; Tangney, C.; Tremblay-Mercier, J.; Fortier, M.; Bennett, D.A.; Morris, M.C. Plasma and brain fatty acid profiles in mild cognitive impairment and Alzheimer’s disease. J. Alzheimers Dis. 2012, 29, 691–697. [Google Scholar] [CrossRef]
- Kalmijn, S.; Launer, L.J.; Ott, A.; Witteman, J.C.; Hofman, A.; Breteler, M.M. Dietary fat intake and the risk of incident dementia in the Rotterdam Study. Ann. Neurol. 1997, 42, 776–782. [Google Scholar] [CrossRef]
- Morris, M.C.; Evans, D.A.; Bienias, J.L.; Tangney, C.C.; Bennett, D.A.; Wilson, R.S.; Aggarwal, N.; Schneider, J. Consumption of fish and n-3 fatty acids and risk of incident Alzheimer disease. Arch. Neurol. 2003, 60, 940–946. [Google Scholar] [CrossRef]
- Huang, T.L.; Zandi, P.P.; Tucker, K.L.; Fitzpatrick, A.L.; Kuller, L.H.; Fried, L.P.; Burke, G.L.; Carlson, M.C. Benefits of fatty fish on dementia risk are stronger for those without APOE epsilon4. Neurology 2005, 65, 1409–1414. [Google Scholar] [CrossRef]
- Sanchez-Mejia, R.O.; Mucke, L. Phospholipase A2 and arachidonic acid in Alzheimer’s disease. Biochim. Biophys. Acta 2010, 1801, 784–790. [Google Scholar] [CrossRef]
- Prasad, M.R.; Lovell, M.A.; Yatin, M.; Dhillon, H.; Markesbery, W.R. Regional membrane phospholipid alterations in Alzheimer’s disease. Neurochem. Res. 1998, 23, 81–88. [Google Scholar] [CrossRef]
- Proitsi, P.; Kim, M.; Whiley, L.; Simmons, A.; Sattlecker, M.; Velayudhan, L.; Lupton, M.K.; Soininen, H.; Kloszewska, I.; Mecocci, P.; et al. Association of blood lipids with Alzheimer’s disease: A comprehensive lipidomics analysis. Alzheimers Dement. 2017, 13, 140–151. [Google Scholar] [CrossRef] [PubMed]
- Chan, R.B.; Oliveira, T.G.; Cortes, E.P.; Honig, L.S.; Duff, K.E.; Small, S.A.; Wenk, M.R.; Shui, G.; Di Paolo, G. Comparative lipidomic analysis of mouse and human brain with Alzheimer disease. J. Biol. Chem. 2012, 287, 2678–2688. [Google Scholar] [CrossRef] [PubMed]
- Wood, P.L.; Medicherla, S.; Sheikh, N.; Terry, B.; Phillipps, A.; Kaye, J.A.; Quinn, J.F.; Woltjer, R.L. Targeted Lipidomics of Fontal Cortex and Plasma Diacylglycerols (DAG) in Mild Cognitive Impairment and Alzheimer’s Disease: Validation of DAG Accumulation Early in the Pathophysiology of Alzheimer’s Disease. J. Alzheimers Dis. 2015, 48, 537–546. [Google Scholar] [CrossRef]
- Wood, P.L.; Barnette, B.L.; Kaye, J.A.; Quinn, J.F.; Woltjer, R.L. Non-targeted lipidomics of CSF and frontal cortex grey and white matter in control, mild cognitive impairment, and Alzheimer’s disease subjects. Acta Neuropsychiatr. 2015, 27, 270–278. [Google Scholar] [CrossRef] [PubMed]
- Farooqui, A.A.; Horrocks, L.A.; Farooqui, T. Glycerophospholipids in brain: Their metabolism, incorporation into membranes, functions, and involvement in neurological disorders. Chem. Phys. Lipids 2000, 106, 1–29. [Google Scholar] [CrossRef] [PubMed]
- Bargui, R.; Solgadi, A.; Prost, B.; Chester, M.; Ferreiro, A.; Piquereau, J.; Moulin, M. Phospholipids: Identification and Implication in Muscle Pathophysiology. Int. J. Mol. Sci. 2021, 22, 8176. [Google Scholar] [CrossRef]
- Pettegrew, J.W.; Panchalingam, K.; Hamilton, R.L.; McClure, R.J. Brain membrane phospholipid alterations in Alzheimer’s disease. Neurochem. Res. 2001, 26, 771–782. [Google Scholar] [CrossRef] [PubMed]
- Igarashi, M.; Ma, K.; Gao, F.; Kim, H.W.; Rapoport, S.I.; Rao, J.S. Disturbed choline plasmalogen and phospholipid fatty acid concentrations in Alzheimer’s disease prefrontal cortex. J. Alzheimers Dis. 2011, 24, 507–517. [Google Scholar] [CrossRef] [PubMed]
- Han, X.; Holtzman, D.M.; McKeel, D.W., Jr. Plasmalogen deficiency in early Alzheimer’s disease subjects and in animal models: Molecular characterization using electrospray ionization mass spectrometry. J. Neurochem. 2001, 77, 1168–1180. [Google Scholar] [CrossRef]
- Guan, Z.; Wang, Y.; Cairns, N.J.; Lantos, P.L.; Dallner, G.; Sindelar, P.J. Decrease and structural modifications of phosphatidylethanolamine plasmalogen in the brain with Alzheimer disease. J. Neuropathol. Exp. Neurol. 1999, 58, 740–747. [Google Scholar] [CrossRef]
- Wells, K.; Farooqui, A.A.; Liss, L.; Horrocks, L.A. Neural membrane phospholipids in Alzheimer disease. Neurochem. Res. 1995, 20, 1329–1333. [Google Scholar] [CrossRef]
- Söderberg, M.; Edlund, C.; Kristensson, K.; Dallner, G. Fatty acid composition of brain phospholipids in aging and in Alzheimer’s disease. Lipids 1991, 26, 421–425. [Google Scholar] [CrossRef]
- Stephenson, D.T.; Lemere, C.A.; Selkoe, D.J.; Clemens, J.A. Cytosolic phospholipase A2 (cPLA2) immunoreactivity is elevated in Alzheimer’s disease brain. Neurobiol. Dis. 1996, 3, 51–63. [Google Scholar] [CrossRef]
- Gattaz, W.F.; Maras, A.; Cairns, N.J.; Levy, R.; Förstl, H. Decreased phospholipase A2 activity in Alzheimer brains. Biol. Psychatry 1995, 37, 13–17. [Google Scholar] [CrossRef]
- Schaeffer, E.L.; Gattaz, W.F. Requirement of hippocampal phospholipase A2 activity for long-term memory retrieval in rats. J. Neural Transm. 2007, 114, 379–385. [Google Scholar] [CrossRef] [PubMed]
- Kim, H.Y.; Huang, B.X.; Spector, A.A. Phosphatidylserine in the brain: Metabolism and function. Prog. Lipid Res. 2014, 56, 1–18. [Google Scholar] [CrossRef] [PubMed]
- Zhang, Y.Y.; Yang, L.Q.; Guo, L.M. Effect of phosphatidylserine on memory in patients and rats with Alzheimer’s disease. Genet. Mol. Res. 2015, 14, 9325–9333. [Google Scholar] [CrossRef]
- Kidd, P.M. Omega-3 DHA and EPA for cognition, behavior, and mood: Clinical findings and structural-functional synergies with cell membrane phospholipids. Altern. Med. Rev. 2007, 12, 207–227. [Google Scholar]
- Frisardi, V.; Panza, F.; Seripa, D.; Farooqui, T.; Farooqui, A.A. Glycerophospholipids and glycerophospholipid-derived lipid mediators: A complex meshwork in Alzheimer’s disease pathology. Prog. Lipid Res. 2011, 50, 313–330. [Google Scholar] [CrossRef] [PubMed]
- Schaeffer, E.L.; da Silva, E.R.; Novaes Bde, A.; Skaf, H.D.; Gattaz, W.F. Differential roles of phospholipases A2 in neuronal death and neurogenesis: Implications for Alzheimer disease. Prog. Neuropsychopharmacol. Biol. Psychiatry 2010, 34, 1381–1389. [Google Scholar] [CrossRef]
- Perttu, E.K.; Kohli, A.G.; Szoka, F.C., Jr. Inverse-phosphocholine lipids: A remix of a common phospholipid. J. Am. Chem. Soc. 2012, 134, 4485–4488. [Google Scholar] [CrossRef]
- Whiley, L.; Sen, A.; Heaton, J.; Proitsi, P.; García-Gómez, D.; Leung, R.; Smith, N.; Thambisetty, M.; Kloszewska, I.; Mecocci, P.; et al. Evidence of altered phosphatidylcholine metabolism in Alzheimer’s disease. Neurobiol. Aging 2014, 35, 271–278. [Google Scholar] [CrossRef]
- Kang, S.; Han, J.; Song, S.Y.; Kim, W.S.; Shin, S.; Kim, J.H.; Ahn, H.; Jeong, J.H.; Hwang, S.J.; Sung, J.H. Lysophosphatidic acid increases the proliferation and migration of adipose-derived stem cells via the generation of reactive oxygen species. Mol. Med. Rep. 2015, 12, 5203–5210. [Google Scholar] [CrossRef]
- Jones, E.E.; Dworski, S.; Canals, D.; Casas, J.; Fabrias, G.; Schoenling, D.; Levade, T.; Denlinger, C.; Hannun, Y.A.; Medin, J.A.; et al. On-tissue localization of ceramides and other sphingolipids by MALDI mass spectrometry imaging. Anal. Chem. 2014, 86, 8303–8311. [Google Scholar] [CrossRef]
- Jazvinšćak Jembrek, M.; Hof, P.R.; Šimić, G. Ceramides in Alzheimer’s Disease: Key Mediators of Neuronal Apoptosis Induced by Oxidative Stress and Aβ Accumulation. Oxid. Med. Cell. Longev. 2015, 2015, 346783. [Google Scholar] [CrossRef] [PubMed]
- Panchal, M.; Gaudin, M.; Lazar, A.N.; Salvati, E.; Rivals, I.; Ayciriex, S.; Dauphinot, L.; Dargère, D.; Auzeil, N.; Masserini, M.; et al. Ceramides and sphingomyelinases in senile plaques. Neurobiol. Dis. 2014, 65, 193–201. [Google Scholar] [CrossRef]
- Mielke, M.M.; Bandaru, V.V.; Haughey, N.J.; Xia, J.; Fried, L.P.; Yasar, S.; Albert, M.; Varma, V.; Harris, G.; Schneider, E.B.; et al. Serum ceramides increase the risk of Alzheimer disease: The Women’s Health and Aging Study II. Neurology 2012, 79, 633–641. [Google Scholar] [CrossRef] [PubMed]
- Satoi, H.; Tomimoto, H.; Ohtani, R.; Kitano, T.; Kondo, T.; Watanabe, M.; Oka, N.; Akiguchi, I.; Furuya, S.; Hirabayashi, Y.; et al. Astroglial expression of ceramide in Alzheimer’s disease brains: A role during neuronal apoptosis. Neuroscience 2005, 130, 657–666. [Google Scholar] [CrossRef] [PubMed]
- Couttas, T.A.; Kain, N.; Daniels, B.; Lim, X.Y.; Shepherd, C.; Kril, J.; Pickford, R.; Li, H.; Garner, B.; Don, A.S. Loss of the neuroprotective factor Sphingosine 1-phosphate early in Alzheimer’s disease pathogenesis. Acta Neuropathol. Commun. 2014, 2, 9. [Google Scholar] [CrossRef]
- He, X.; Huang, Y.; Li, B.; Gong, C.X.; Schuchman, E.H. Deregulation of sphingolipid metabolism in Alzheimer’s disease. Neurobiol. Aging 2010, 31, 398–408. [Google Scholar] [CrossRef]
- Feringa, F.M.; van der Kant, R. Cholesterol and Alzheimer’s Disease; From Risk Genes to Pathological Effects. Front. Aging Neurosci. 2021, 13, 690372. [Google Scholar] [CrossRef]
- Cutler, R.G.; Kelly, J.; Storie, K.; Pedersen, W.A.; Tammara, A.; Hatanpaa, K.; Troncoso, J.C.; Mattson, M.P. Involvement of oxidative stress-induced abnormalities in ceramide and cholesterol metabolism in brain aging and Alzheimer’s disease. Proc. Natl. Acad. Sci. USA 2004, 101, 2070–2075. [Google Scholar] [CrossRef]
- Heverin, M.; Bogdanovic, N.; Lütjohann, D.; Bayer, T.; Pikuleva, I.; Bretillon, L.; Diczfalusy, U.; Winblad, B.; Björkhem, I. Changes in the levels of cerebral and extracerebral sterols in the brain of patients with Alzheimer’s disease. J. Lipid Res. 2004, 45, 186–193. [Google Scholar] [CrossRef] [PubMed]
- Mori, T.; Paris, D.; Town, T.; Rojiani, A.M.; Sparks, D.L.; Delledonne, A.; Crawford, F.; Abdullah, L.I.; Humphrey, J.A.; Dickson, D.W.; et al. Cholesterol accumulates in senile plaques of Alzheimer disease patients and in transgenic APP(SW) mice. J. Neuropathol. Exp. Neurol. 2001, 60, 778–785. [Google Scholar] [CrossRef] [PubMed]


| No. | Reference | Study Population | Sample Type | Analytical Platform | Altered Metabolites |
|---|---|---|---|---|---|
| 1 | Czech, et al., 2012 [63] | 51 HC, 79 AD | CSF | LC-MS, GC-MS | Citrulline, Cortisol, Creatinine, Cysteine, Dopamine, Erythrol, Galactitol, Histamine, Methionine, Noradrenaline, Normetanephrine, Phenylalanine, Pseudouridine, Pyruvate (incl. Phosphoenolpyruvate), Quinic acid (incl. Chlorogenic acid), Ribonic acid, Scyllo-inositol, Serine, Sorbitol (incl. Mannitol, Galactitol), Tyrosine, Uridine, Ornithine (incl. Arginine, Citrulline) |
| 2 | Ibáñez, et al., 2012 [64] | 19 HC, 22 MCI, 9 MCI-AD, 23 AD | CSF | CE-TOF-MS | Choline, Valine, Arginine, Tripeptide, Carnitine, Dimethy-L-arginine, Creatine |
| 3 | Sato, et al., 2012 [65] | 10 HC, 10 AD | Plasma, CSF | LC/APCI-MS | Cholesterol, Desmosterol |
| 4 | Ibáñez, et al., 2013 [66] | 21 HC, 21 MCI-S, 12 MCI-AD, 21 AD | CSF | UHPLC-TOF-MS | Uracil, Xanthine, Uridine, Tyrosyl-serine, Methylsalsolinol, Nonanoylglycine, Dopamine-quinone, Caproic acid, Vanylglycol, Histidine, Pipecolic acid, Hydroxyphosphinyl-pyruvate, Creatinine, Taurine, Sphingosine-1-phosphate, Tryptophan, Methylthioadenosine |
| 5 | Luliano, et al., 2013 [67] | 30 HC, 14 MCI, 30 AD | Plasma | GC-MS | Arachidic acid, Cerotic acid, cis-Vaccenic acid, Erucic acid, Linoleic acid, Mead acid |
| 6 | González-Domínguez, et al., 2014 [68] | 37 HC, 14 MCI, 42 AD | Plasma | CE-MS | Choline, Creatinine, Asparagine, Proline betaine, Methionine, Histidine, Carnitine, N-acetyl-spermidine, Asymmetric dimethyl-Arginine, Tripeptide |
| 7 | González-Domínguez, et al., 2014 [69] | 18 HC, 22 AD | Plasma | DIMS/MS | Caprylic acid, Capric acid, Lauric acid, Myristic acid, Palmitoleic acid, Palmitic acid, Linoleic acid, Docosahexaenoic acid, Leukotriene B4, Prostaglandin, Choline, Valine, Creatine, Glutamine, Glutamate, Dopamine, Histidine, Carnitine, Arginine, N-acetyl glutamine, Glucose, Glycerophosphocholine, Lyso-phospholipids, Phospholipids |
| 8 | González-Domínguez, et al., 2014 [70] | 18 HC, 22 AD | Plasma | ESI-Q-TOFMS | Arginine, Guanidine, Histidine, Imidazole, Kynurenine, Oleamide, P18:0/C22:6-PlsEt, P18:1/C20:4-PlsEt, Prostaglandins, Putrescine, Taurine |
| 9 | Wang, et al., 2014 [71] | 57 HC, 58 MCI, 57 AD | Plasma | UPLC-QTOF-MS | Panel for MCI: Thymine, Arachidonic acid, 2-Aminoadipic acid, N,N-dimethylglycine, 5,8-Tetradecadienoic acid Panel for AD: Arachidonic acid, N,N-dimethylglycine, Thymine, Glutamine, Glutamic acid, Cytidine |
| 10 | González-Domínguez, et al., 2015 [72] | 30 HC, 30 AD | Plasma | FIA-APPI-QTOFMS | Palmitoleamide, Palmitamide, Linolenamide, Linoleamide, Oleamide, Stearamide, Palmitoleic acid, Palmitic acid, Oleic acid, Urea, Alanine, Taurine, Picolinic acid, Creatine, Malic acid, Dopamine, Serotonin, Ceramides (Cers), Diacylglycerols (DAG) |
| 11 | González-Domínguez, et al., 2015 [73] | 21 HC, 23 AD | Plasma | GC-MS | Adenosine, Asparagine, Aspartic acid, Cholesterol, Cystine, Glucose, Glutamine, Histidine, Isocitric acid, Lactic acid, Oleic acid, Ornithine, Palmitic acid, Phenylalanine, Pipecolic acid, Pyroglutamic acid, Stearic acid, Tryptophan, Tyrosine, Urea, Uric acid, Valine, α-Ketoglutarate |
| 12 | Graham, et al., 2015 [74] | 37 HC, 16 MCI, 19 MCI-AD | Plasma | LC-QTOF-MS | 4-Aminobutanal, Creatine, γ-aminobutyric acid (GABA), L-ornithine, N1-diacetlyspermine, N-acetylputrescine, Spermine, L-arginine, Methylthioadenosine, N1-acetyl-spermidine, Putrescine, Spermidine |
| 13 | González-Domínguez, et al., 2016 [75] | 45 HC, 17 MCI, 75 AD | Plasma | UPLC-QTOF-MS | Lyso-phospholipids, Phospholipids, S1P, Cers, Sphingomyelins, Glycosphingolipids, Monoglycerides, Acyl-carnitines, Histidine, Phenyl-acetyl-glutamine, Oleamide |
| 14 | Paglia, et al., 2016 [76] | 19 HC, 21 AD | Frontal cortex | UPLC-MS | Acetylaspartic acid, Acetylglutamic acid, ADP, ADP-ribose, Alanine, AMP, Arginine, Asparagine, Aspartic acid, Choline, Cystine, Glutamic acid, Glutamine, GMP, Guanosine, Hydroxyproline, Hypoxanthine, IMP, Inosine, Methionine, Pantothenic acid, Pentose 5-phosphate, Proline, Pyruvate, SAH, SAMe, Serine, Succinic acid, Threonine, Tryptophan, Uric acid, Valine, Xanthine, Xanthosine |
| 15 | Vaňková, et al., 2016 [77] | 22 HC, 16 AD | Plasma | GC-MS | 17-Hydroxypregnenolone, 17-Hydroxyprogesterone, 20α-Dihydroprogesterone, Allopregnanolone, Allopregnanolone sulfate, Androstenedione, Conjugated 5α-androstane-3b,17b-diol, Isopregnanolone, Pregnanolone, Pregnenolone sulfate, steroid |
| 16 | Xu, et al., 2016 [78] | 9 HC, 9 AD | Brain | GC-MS | 55 altered metabolites belonging to glucose utilization/clearance and brain energetics metabolism, and urea and amino-acid metabolism |
| 17 | Chouraki, et al., 2017 [79] | 1974HC, 93AD | Plasma | LC-MS | Anthranilic acid, Glutamic acid, Taurine, Hypoxanthine |
| 18 | de Leeuw, et al., 2017 [80] | 121 HC, 127 AD | Plasma | Multiple Mass spectrometry platforms | Tyrosine, Glycylglycine, Glutamine, Lysophosphatic acid C18:2 |
| 19 | Oberacher, et al., 2017 [81] | 18 HC, 15 MCI, 21 AD | Plasma | FIA-MS/MS | PCaa C32:0, PCaa C34:1, PCaa C36:5, PCaa C36:6, PCaa C38:0, PCaa C38:3, PCae C32:1, PCae C32:2, PCae C34:1, PCae C40:4, lysoPC aC16:0, lysoPC aC18:1, lysoPC aC18:2, SM (OH) C14:1 |
| 20 | Snowden, et al., 2017 [82] | 14 HC, 14 AD | Brain | LC-MS and GC-MS | Linoleic acid, Linolenic acid, Eicosapentaenoic acid, Oleic acid, Arachidonic acid |
| 21 | Hao, et al., 2018 [83] | 14 HC, 16 AD | CSF | LC-MS/MS | 142 metabolites belong to carboxylic acids, amino acids, fatty acyls, fatty acids and conjugates, pyrimidines, nucleosides, and analogs. E.g.: 3-Oxododecanoic acid, Dodecanedioic acid, Methylerythritol phosphate, Glutamine, Dihydrothioctic acid, Deoxyinosine, Succinyl-glutamate |
| 22 | Kim, et al., 2018 [84] | 13 HC, 23 MCI, 14 AD | Plasma | UHPLC-ESI-MS/MS | PE (34:2), PE (36:2), PE (38:4), PE (38:5), PA (18:1/22:6), PI (18:0/20:4), PI (18:1/16:1), PI (18:2/16:1), Cer (d18:1/22:0), Cer (d18:1/24:1), HexCer (d18:1/24:0), DG (18:0/22:6), DG (18:1/18:1), TG (50:1) |
| 23 | Muguruma, et al., 2018 [85] | 10 HC, 10 AD | Postmortem CSF (pCSF) | UHPLC-MS/MS | Polyamine and tryptophan-kynurenine (Trp-Kyn) metabolisms, such as methionine sulfoxide, 3-methoxy-anthranilate, cadaverine, guanine, and histamine |
| 24 | Nasaruddin, et al., 2018 [86] | 27 HC, 16 AD | Brain | GC-MS | Arachidic acid, Arachidonic acid, Behenic acid, Cis-10-heptanoic acid, Cis-11,14,17-eicosatrienoic acid, Cis-13,16-docosadienoic acid, Erucic acid, Lignoceric acid, Linolenic acid, Nervonic acid, Oleic acid, Palmitic acid, Stearic acid |
| 25 | van der Lee, et al., 2018 [87] | 23,882 HC, 1356 AD | Plasma | NMR spectroscopy | High-density lipoprotein subfractions, Docosahexaenoic acid, Ornithine, Glutamine, Glycoprotein acetyls |
| 26 | Kim, et al., 2019 [88] | 9 HC, 9 AD | Postmortem, brain | UPLC-MS | Hypotaurine, Myo-inositol, Oxo-proline, Glutamate, N-acetyl-aspartate, Cortisol, N-acetylaspartate (NAA), N-acetylaspartylglutamate (NAAG), Acetylcholine, Alanine |
| 27 | Lin, et al., 2019 [89] | 15 HC, 10 MCI, 15 AD | Plasma | LC-MS/MS | Propionylcarnitine, Valerylcarnitine, Glutarylcarnitine/Hydroxyhexanoylcarnitine, Arginine, Phenylalanine, Creatinine, Symmetric dimethylarginine (SDMA) |
| 28 | MahmoudianDehkordi, et al., 2019 [90] | 37 HC, 284 early MCI, 505 late MCI, 305 AD | Plasma | UPLC-MS/MS | Cholic acid, Deoxycholic acid (DCA), Glycodeoxycholic acid (GDCA), Glycolithocholic acid (GLCA), Taurolithocholic acid (TLCA) |
| 29 | Marksteiner, et al., 2019 [91] | 25 HC, 26 MCI, 27 AD | Saliva | FIA-MS/MS | PCae C34:1-2, PCae C36:1-2-3, PCaeC38:1-3, PCae C40:2-3, PCae C36: (1-2-3) |
| 30 | Peña-Bautista, et al., 2019 [92] | 29 HC, 29 AD | Plasma | UPLC-Q-TOF-MS | Choline, L-carnitine, 4-Deoxyphysalolactone, Rescinnamine, Chlorohydrin, Brassinin, Nicotinamide ribotide, Cyasterone |
| 31 | Snowden, et al., 2019, [93] | 14 HC, 14 AD | Brain | LC-MS | Aminobutanal, Arginine, Aspartate, Dihydroxy-phenylalanine, Dopamine, Gamma-aminobutanoate, Glutamate, Glycine, Guanidinobutanoate, Guanosine, Ornithine, Serotonin, Tryptophan, Tyrosine |
| 32 | van der Velpen, et al., 2019 [94] | 34 HC, 40 AD | Plasma, CSF | LC-MS/MS | Acetylcarnitine, Acylcarnitines C14, Acylcarnitines C16, Acylcarnitines C18, cis-Aconitate, Citrate, Creatinine, Decanoylcarnitine, Hexanoylcarnitine, Kynurenic acid, Lauroylcarnitine, L-carnitine, Octanoylcarnitine, Quinolinic acid, Tryptophan, α-Ketoglutarate |
| 33 | Ahmad, et al., 2020 [95] | Two independent cohorts: 142 MCI and 40 MCI | CSF and plasma | UHPLC-MS/MS | LPA (C16:0), LPA (C16:1), LPA (C22:4), LPA (C22:6), and isomer-LPA (C22:5) |
| 34 | Shao, et al., 2020 [96] | 94 HC, 44 AD | Plasma | UPLC-MS | Polyunsaturated fatty acids (PUFAs), Docosahexaenoic acid (DHA, C22:6), medium- and long-chain Acyl-Carnitines, Cholic acid (CA), Chenodeoxycholic acid (CDCA), Allocholic acid, Tryptophan, Serotonin, Indolelactic acid |
| 35 | Byeon, et al., 2021 [97] | 18 HC, 15 MCI, 17 AD | CSF | LC-MS | LPC, PC, LdMePE, LPE, dMePE, PE class |
| 36 | Liu, et al., 2021 [98] | 19 HC, 25 AD | Brain tissue | LC-MS/MS | 3-Methylguanine, Acetylcholine, Cytosine, Glycylproline, Guanosine, Histidinyl-aspartate, Imidazoleacetic acid, Indole-3-propionic acid, Inosine, Ketoleucine, Linoleamide, L-methionine, L-norleucine, L-valine, N6-methyladenosine, N-acetylglutamic acid, N-acetyl-L-aspartic acid, N-acetyl-L-phenylalanine, Palmitoleic acid, Phenylalanine, Phenylpyruvic acid, Piperidine, Sarcosine, Serylglycine, S-formylglutathione, Sphingosine, Theaflavin |
| 37 | Liu, et al., 2021 [99] | 42 HC, 40 AD | Plasma | LC-MS/MS | Cer, ChE, DG, LPC, PC, PE, PI, SM, and TG class |
| 38 | Nielsen, et al., 2020 [100] | 10 HC, 10 MCI, 10 AD | Plasma | LC-MS and NMR, spectroscopy | Valine, Histidine, Allopurinol riboside, Inosine, 4-Pyridoxic acid, Guanosine |
| 39 | Horgusluoglu, et al., 2022 [101] | 362 HC, 270 early MCI, 494 late MCI, 298 AD | Plasma | HPLC-MS/MS | Short-chain Acylcarnitines/amino acids and medium/long-chain Acylcarnitines |
| 40 | Khan, et al., 2022 [102] | 54 HC, 59 AD | Plasma | LC-MS/MS | PS (18:0/18:0), PS (18:0/20:0), PC (16:0/22:6), PC (18:0/22:6), PS (18:1/22:6) |
| 41 | Maffioli, et al., 2022 [103] | 20 HC, 23 AD | Hippocampal tissue | LC-MS and GC-MS | Glycerol 3 phosphate, Erythrose 4 phosphate, Glucose, Deoxyuridine, Lactic acid, Saccharopine, Uridine 5′ diphosphate, Oxidized glutathione, Urea, Uracil, Succinic acid, Arginine, Beta D Glucose 6 phosphate, Glucosamine 6 phosphate, AICAR, Citrulline, Alanine, Pyruvic acid, Glutathione, Guanidoacetic acid, Mevalonate P, Lysine |
| 42 | Ozaki, et al., 2022 [104] | 40 HC, 26 MCI, 40 AD | Plasma | CE-TOF-MS | Ornithine, Uracil, Lysine |
| 43 | Peña-Bautista, et al., 2022 [105] | 20 HC, 11 AD, 31 MCI-AD | Plasma | UPLC-TOF/MS | Cer, LPE, LPC, MG, and SM were observed as being altered significantly between the preclinical AD and healthy groups. DG, MG, and PE were observed as being altered significantly between the MCI-AD and healthy groups. |
| 44 | Weng, et al., 2022 [106] | 19 HC, 16 AD | Plasma | NMR spectroscopy | 3-Phosphoglycerate, Fructose-6-phosphate, Glucose-6-phosphate, Betaine, Methyl-histidine, Glycerylphosphorylcholine, 2-Oxoglutarate, Citrate, Malate, Ergothioneine, Glutathione disulfide, Taurine, Carnosine, Ornithine, Glycine, Alanine, Serine, Glutamine, Tryptophan, Valine |
| Reference | Study Population | Sample Type | Analytical Platform | Altered Metabolites | |
|---|---|---|---|---|---|
| 1 | Salek, et al., 2010 [123] | Two age groups (2–3 months and 12–13 months) of transgenic CRND8 APP 695 and non-transgenic littermates (controls) | Brain samples with seven different brain regions | NMR-based metabolomics | Lactate, Aspartate, Glycine, Alanine, Leucine, Iso-leucine, Valine, N-acetyl-L-aspartate, Glutamate, Glutamine, Taurine, Gamma-amino butyric acid, Choline, Phosphocholine, Creatine, Phosphocreatine, Succinate |
| 2 | Hu, et al., 2012 [124] | 50-week-old TASTPM transgenic AD mice and 5-month old wild type C57BL/6J mice | Plasma and brain tissues | GC-MS | AA, Androstenedione, Cortisol, D-fructose, D-galactose, D-glucose, Gluconic acid, Linoleic acid, L-serine, L-threonine, L-valine, Palmitic acid |
| 3 | Trushina, et al., 2012 [125] | APP/PS1 mice at 16 months of age and age-matched nTg controls | Hippocampus | GC-MS | Threonic acid, Ethanolamine, Alanine, Mannitol, Glycerol 3-P, Pyroglutamic acid, N-acetyl-aspartate, Lactic Acid |
| 4 | Tajima, et al., 2013 [126] | APP/tau mice at 4, 10, and 15 months of age and age-matched wild-type mice | Brain tissue, Plasma | RPLC-ESI-TOFMS | 12-HETE, 19,20-diHDoPE, 17,18-diHETE, 19,20-EpDPE, 17,18-EpETE, Prostaglandin D2, 15-HETE, Phosphatidylcholines, PEs with Polyunsaturated fatty acids, Docosahexaenoyl (22:6) Cholesterol Ester (ChE), Ethanolamine Plasmalogens (pPEs), Sphingomyelins (SMs) |
| 5 | González-Domínguez, et al., 2014 [127] | 6-month-old APP/PS1 mice and age-matched controls | Brain tissue with different regions | GC-MS and UPLC-MS | 40 significant differences in metabolites related to abnormal purine metabolism, bioenergetic failures, dyshomeostasis of amino acids, and disturbances in membrane lipids |
| 6 | Kim, et al., 2014 [128] | Model: mice receive an intracerebroventricular infusion of Aβ, Control: age-matched untreated mice | Plasma | NMR-MS | Niacinamide, AMP, Hypoxanthine, Citrate, Lactate, Pyruvate, Creatine, Choline, Acetate, Phenylalanine, Glycine, Valine, Tyrosine, Alanine, Glucose, Glutamine |
| 7 | Lalande, et al., 2014 [129] | Single-transgenic Tg2576 mice at 1, 3, 6, and 11 months of age, and age-matched controls | Brain tissues with five different brain regions | NMR-MS | γ-Aminobutyric acid, Glutamate, N-acetylaspartate (NAA), Myo-Inositol, Creatine, Phosphocholine, Glu, Creatine, Taurine |
| 8 | González-Domínguez, et al., 2015 [130] | APP/PS1 mice at 6 months old, and age-matched nTg controls | Plasma | FI-APPI-MS, DI-ESI-MS | Choline, Serine, Valine, Threonine, Pyroglutamate, Creatine, Phosphoethanolamine, Histidine, Carnitine, Glucose, Tyrosine, Tryptophan, GPE, Inosine, Urea, Myristic Acid, Palmitoleic acid, HEPE, Lysophosphocholines, Phosphocholines, Diacylglycerols, Cholesteryl esters, Triacylglycerols |
| 9 | González-Domínguez, et al., 2015 [131] | APP/PS1 mice at 6 months of age and age-matched nTg controls | Plasma | GC-MS, UHPLC-MS | Phosphoethanolamine, Adenosine monophosphate, Citrulline, Citric acid, Monostearin, Bile acids, Eicosanoids, Fatty acid amides, Sphingoid bases, Lyso-phospholipids, Phospholipids, Sphingomyelins, Lactic acid, B-hydroxybutyric acid, Urea, Phosphoric acid, Glycine, Succinic acid, Threonine, Malic acid, Pyroglutamic Acid, Creatinine, Proline, Glycerol-3-phosphate, Citric acid, Glucose, Tyrosine, 6Myoinositol, Uric Acid, Glucose-6-phosphate, Tryptophan, Stearic acid, Myoinositol-1-phosphate, Serotonin, 1,3-Bisphosphoglycerate, Cholesterol |
| 10 | González-Domínguez, et al., 2015 [132] | 6-month-old APP/PS1 mice and age-matched controls | Brain tissue with different regions | LC-QTOF-MS | 52 significant differences in metabolites including phospholipids, fatty acids, purine and pyrimidine metabolites, acylcarnitines, sterols, and amino acids which related to the homeostasis of lipids, energy management, and metabolism of amino acids and nucleotides |
| 11 | Li, et al., 2015 [133] | Model: mice receive hippocampal region infusion of Aβ1-42, Control: age-matched untreated mice | Plasma, Brain tissues | UPLC-MS/MS | Phenylalanine, Tryptophan, Dihydrosphingosine, LPC (18:2), LPC (20:4), LPC (22:6), LPC (16:0), LPC (16:0), LPC (18:1), LPC (18:0) |
| 12 | Li, et al., 2016 [134] | APP/PS1 mice at 1 month old and age-matched nTg controls | Brain tissues | UPLC-MS | Hypoxanthine, Hexadecasphinganine, Dihydrosphingosine, Phytosphingosine, LPC (13:0), LPC (15:1), LPC (15:0), LPC (16:0), LPC (18:3), LPC (18:1), LPC (18:0) |
| 13 | Pan, et al., 2016 [135] | APP/PS1 mice at 1, 8, 10, 12, and 18 months of age, and age-matched nTg controls | Plasma and brain tissues | UPLC-TQ-MS | Phenylalanine, Trypotophan, Tyrosine, a-Aminoadipic acid, Asparagine, Histidine, Phenylalanine, Valine, Isoleucine, Methionine, Tyrosine, Methionine sulfoxide, Serotonin, Taurine |
| 14 | Nuriel, et al., 2017 [136] | APOE mice at 14.5 months of age and age-matched controls | Brain tissues | UPLC-MS | Myristic acid, DHA, Stearic acid, 12-Hydroxydodecanoic acid, Arachidic acid, Palmitic acid, Trisaccharide, Tetrasaccharide, Disaccharide, Phylloquinone, Tocopherol, Dehydroascorbic acid, Inosine 5′-monophosphate (IMP), D-fructose 6-phosphate, Succinoadenosine, Carnitine, Citric acid/Isocitric acid, Malic acid, ATP, Lanosterol, Cholesteryl 19acetate, Leucine, Proline, Glycine, Quinaldic acid, Kynurenine, Kynurenic acid, S-Adenosylhomocysteine, Carnosine, 4-Oxoproline, Tyramine, Thymidine, Uracil, GMP, Methylglutarylcarnitine, Trimethylamine N-oxide, 2-Hydroxypyridine, N-acetylneuraminic acid, Hydroxybutyric acid |
| 15 | Pan, et al., 2017 [137] | APP/PS1 mice at 6 and 12 months of age and age-matched controls | Plasma and brain tissues | LC-MS/MS | Cholic acid, Hyodeoxycholic acid, Lithocholic acid, Taurocholic acid, Tauromuricholic acid (α and β), Tauroursodeoxycholic acid, β-Muricholic acid, Ω-Muricholic acid |
| 16 | Bergin, et al., 2018 [138] | APP/PS1 mice at 7 and 13 months of age and age-matched nTg controls | Brain tissues, Plasma | HPLC-MS | Arginine, Citrulline, Ornithine, Agmatine, Putrescine, Spermine, Spermidine |
| 17 | Gao, et al., 2018 [139] | APP/PS1 mice at 12 months of age and age-matched nTg controls | Plasma | UPLC-MS | Acetoacetyl-CoA, 21-Deoxycortisol, 9 (10)-EpOME, 3α-Hydroxy-5β-androstan-17-one, PGF2α, Dehydroepiandrosterone, 3α,21-Dihydroxy-5β-pregnane-11,20-dione, Sphinganine, Sphingosine, DHA, Linoleic acid, 4,4-Dimethyl-5α-cholest-7-en-3β-ol, Arachidonic acid, PC (20:4 (5Z,8Z,11Z,14Z)/0:0), 9-Cis-retinoic acid, LTA4 |
| 18 | Sun, et al., 2018 [140] | 21-week-old APP/PS1 mice and age-matched controls | Plasma | UPLC-QTOF/MS | Arachidonic acid, Cer (d18:0/12:0), Glycerophosphocholine, Leukotriene B4, Linoleic acid, L-tryptophan, Phosphorylcholine, Phytosphingosine, Prostaglandin F2a, Prostaglandin G2, Sphinganine |
| 19 | Zheng, et al., 2018 [141] | APP/PS1 mice at 5 and 10 months of age and age-matched controls | Brain tissues | NMR-based metabolomics | Adenosine monophosphate, ADP, Alanine, Aspartate, Choline, Creatine/phosphocreatine, Glutamate, Glutamine, Glycerolphorylcholine, Glycine, Inosine, Inosine monophosphate, Lactate, Myo-inositol, N-acetylaspartate, Nicotinamide adenine dinucleotide, Phosphocholine, Succinate, γ-Aminobutyric acid |
| 20 | Zhou, et al., 2018 [142] | 10-month-old APP/PS1 double transgenic mice and age-matched controls | Brain tissues | 13C NMR based metabolomic | Glutamate, Glutamine, γ-Aminobutyric acid, Aspartate, Succinate, Lactate, Alanine |
| 21 | Chang, et al., 2019 [143] | 5-month-old APP/PS1 mice and age-matched controls | Brain tissue with different regions | GC-TOF-MS | 2-Hydroxyglutaric acid, 4-Guanidinobutyric acid, Aspartic acid, Beta-alanine, Citric acid, Creatinine, Ethanolamine, Fumaric acid, GABA, Glucose, Glucose-6-phosphate, Glutamic acid, Glycerol, Glycine, Inosine, Lactic acid, Leucine, Malic acid, N-acetyl-L-aspartic acid, Oleic acid, Proline, Pyroglutamic acid, Ribose-5-phosphate, Serine, Succinic acid, Threonine, Threonolactone, Tyrosine, Uracil, Urea, Valine |
| 22 | Li, et al., 2019 [144] | 3xTg-AD mice at 19 months of age and age-matched nTg controls | Plasma | UPLC-Q/TOF-MS | Linoleic acid, 9 (10)-EpOME, DHA, Arachidonic acid, 11b-PGF2a, Sphingosine, Pyruvate, L-Leucine, Ursocholic acid, Corticosterone, L-Tryptophan, Dodecanoic acid, L-lysine |
| 23 | Liu, et al., 2019 [145] | APP/PS1 mice at 6 and 9 months of age and age-matched controls | Pancreas and serum | NMR-based metabolomics | 2-Aminobutyrate, Acetate, Adenosine-monophosphate, AMP, Adenosine-triphosphate, ATP, Alanine, Allantoin, Aspartate, Betaine, Choline, Citrate, Fumarate, Glucose, Glucose 1-phosphate, Glutamine, Glycine, Lactate, Leucine, Malate, Nicotinurate, Pyruvate, Reduced nicotinamide adenine dinucleotide phosphate, NADPH, Serine, Succinate, Taurine, Valine |
| 24 | Liu, et al., 2019 [146] | 3-month-old C57BL/6 mouse with local administration of Aβ peptide into brain, and 3-month-old controls | Hippocampus | UPLC-QTOF/MS | Adenine, Adenosine, Citrulline, Inosine, L-Arginine, L-Isoleucine, L-Threonine, Normetanephrine |
| 25 | Pan, et al., 2019 [147] | 8-month-old PLB4 mice and age-matched controls | Brain tissues | LC-MS | Leucine, Creatinine, Putrescine and species of Acylcarnitines, LysoPC, PCs, Sphingomyelin |
| 26 | Rong, et al., 2019 [148] | Model: SD rats (200 ± 20 g) induced by D-Gal and Aβ25–35 injection, Control: age-matched untreated rats | Plasma, Brain tissue | UPLC-Q/TOF-MS | LysoPC (17:0), LysoPC (20:2), LysoPC (20:4), LysoPC (16:0), LysoPC (18:0), LysoPE (20:4), PE (18:1), PE (22:4) |
| 27 | Hunsberger, et al., 2020 [149] | APP/PS1 mice at 6, 12, and 24 months of age and age-matched controls | Prefrontal cortex, Hippocampus, Spleen | LC-MS and GC-MS | 1-Methyl nicotinamide, 2-Methylbutyroylcarnitine, 7-Methylguanine, Arginine, Argininosuccinic acid, Azelaic acid, Dimethylglycine, Formiminoglutamic acid, Glutathione, Glycerate, Glycolic acid, Guanidinobutanoic acid, Hydroxyproline, Hydroxypyruvic acid, Isovalerylcarnitine, L-glutamic acid, L-methionine, L-tyrosine, Methylhistamine, Methylhistidine, N6-acetyl-L-lysine, N-acetyl L-aspartic acid, N-acetylneuraminic acid, Orotate, Phenylpyruvic acid, Phosphocreatine, Propionylcarnitine, Pyroglutamic acid, Pyruvate, S-adenosylmethionine, SAICAR, Sphingosine-1-phosphate, Uracil, Uridine |
| 28 | Kim, et al., 2020 [150] | 5xFAD mice at 8 and 12 months of age and age-matched controls | Hippocampus | UPLC-MS | Nicotinamide, Adenosine monophosphate, LysoPC (16:0), LysoPC (18:0), and LysoPE (16:0) |
| 29 | Sun, et al., 2020 [151] | Model: SD rats (weight 260 ± 20 g) receive an infusion of Aβ1-42. Control: age-matched untreated rats. | Plasma | HPLC-MS | Arachidic acid, FA (18:0), FA (18:1), FA (18:2), FA (18:3), CE (20:5), CE (22:6), Cer (d18:0/20:0), Cer (d18:1/24:0), MG (16:0/0:0/0:0), DG (18:0/16:0/0:0), TG (16:0/18:0/18:1), LPC (18:0), LPC (20:4), LPC (20:5), LPC (20:1), LPC (O-18:0), LPC (P-16:0), LPC (P-18:0), PC (18:2/18:0), PC (18:2/18:2), PC (18:2/20:4), PC (35:1), PC (35:4), PC (36:1), PC (O-32:0), SM (d18:0/16:1), SM (d40:2) |
| 30 | Tondo, et al., 2020 [152] | 4-month-old 16 rTg4510 mice and age-matched controls | Brain | LC-MS | Glutamine, Serotonin, Sphingomyelin C18:0 |
| 31 | Yi, et al., 2020 [153] | SD rats (180 ± 40 g) were induced by Aβ1-42 injection, Control: age-matched untreated rats | Prefrontal cortex | UPLC-TripleTOF/MS | Cer (d18:1/16:0), Cer (d18:1/24:1 (15Z)), GlcCer (d14:1/20:0), Galbeta-cer (d18:1/20:0), Cer (d18:1/18:0), PI (18:0/0:0), LysoPE (16:1 (9Z)/0:0), Glucosylceramide (d18:1/18:0), PE (18:1 (9Z)/16:0), LysoPC (16:1 (9Z)/0:0), PI (20:4 (5Z,8Z,11Z,14Z)/0:0), PE (16:1 (9Z)/P-16:0), 4-Nitrophenol, LysoPE (0:0/22:6 (4Z,7Z,10Z,13Z,16Z,19Z)), PE (15:0/14:1 (9Z)), Cer (d18:1/20:0), PC (18:1 (11Z)/18:2 (9Z,12Z)), PS (20:1 (11Z)/18:0), PC (18:1 (11Z)/20:4 (5Z,8Z,11Z,14Z)), PE (18:3 (9Z,12Z,15Z)/22:1 (13Z)), Cer (d18:0/22:0), PE (15:0/22:0) |
| 32 | Zhang, et al., 2020 [154] | APP/tau mice at 7 months of age and age-matched wild-type mice | Brain tissue | UHPLC-QTOF/MS | Hydroxy-E4-neuroprostane, Prostaglandin D3, PS (18:0/22:5), PC (14:0/16:0), PC (16:0/19:0), PE (22:5/22:6), PE (15:0/22:4), PE (18:1/20:2), Leukotriene D4, Cer (d18:1/18:1) |
| 33 | Zhang, et al., 2020 [155] | APP/tau mice at 2, 3, and 7 months of age and age-matched wild-type mice | Brain tissue, Plasma | UHPLC-QTOF/MS | Lysophospholipids, PCs, Pes, Cer, Fatty acids, Diacylglycerols (DGs), Triacylglycerols (TGs) |
| 34 | Dejakaisaya, et al., 2021 [156] | Six-month-old mixed-sex Tg2576 mice and c57 × SJL (WT) littermates | Cortex | LC-MS | 2′-Deoxyguanosine 5′-monophosphate, Lysophosphatidylethanolamines (18:0), Diglyceride (P-32:1), 3–4-Hydroxyphenyllactate, Npi-methyl-l-histidine, O-butanoylcarnitine, O-propanoylcarnitine, Phosphatidylethanolamine (44:3), Phosphatidylserine (36:2), Phosphatidylserine (40:7), Phosphatidylserine (44:12) |
| 35 | Speers, et al., 2021 [157] | 8-month-old 5xFAD mice and age-matched controls | Cortical tissue | HPLC-MS | Betaine, Lysine, Pyridoxamine, Urate, NAD, Erythritol, Spermine, N-Acetylmannosamine, Glycerol 2-phosphate, Lauroyl-L-carnitine, Nicotinamide hypoxanthine Dinucleotide, Sodium taurocholate, Homocysteine, Betaine, N-acetyl-mannosamine, S-adenosyl-homocysteine, Adenosine 3′5′-cyclic monophosphate |
| 36 | Sun, et al., 2021 [158] | Model: SD rats with Aβ1-42 protein injection. Control: age-matched untreated rats. | Brain tissue | HPLC/FT-ICR MS | DG (20:4/16:0), DG (22:6/16:0), TG (10:0/18:0/16:0), TG (16:0/16:0/18:1), TG (43:1), TG (16:0/14:0/16:1), Glucosylceramide (d18:1/24:1), PA (22:6/22:5), PG (18:0/22:4), PG (40:5), PG (43:6), PI (18:0/20:4), PI (36:4), PI (18:1/20:4), PS (18:0/20:4), LPE (22:6), PC (17:1/18:1), PC (20:0), PC (34:5), Adrenic acid |
| 37 | Zhao, et al., 2021 [159] | 3×Tg-AD mice at 2 and 6 months of age and age-matched nTg controls | Hippocampus | UPLC-MRM-MS | 84 significant differences in metabolites related to abnormal purine, pyrimidine, arginine, and proline metabolism, glycerophospholipid metabolism |
| 38 | Cheng, et al., 2022 [160] | 9-month-old male APP/PS1 mice and age-matched controls | Plasma | UHPLC-MS/MS | 3-Indole carboxylic acid glucuronide, Cyclic dAMP, (5Z,9Z)-2-Methoxy-hexacosadienoic acid, Caffeoyl aspartic acid, Saccharin, (Z)-13-Oxo-9-octadecenoic acid, 5C-Aglycone, PS (O-16:0/20:2 (11Z,14Z)), Bisacurone Epoxide, PS (22:0/15:0), 6-Hydroxymelatonin glucuronide, Methyl 2-undecynoate, Cis-3-hexenyl trans-4-hexenoate |
| 39 | Dai, et al., 2022 [161] | 4-month old APPswe/PS1∆E9 (PAP) transgenic mice and age-matched controls | Brain and plasma | LC-MS | 23-Nordeoxycholic acid, 23-Norcholic acid, 7-Ketodeoxycholic acid, Deoxycholic acid, β-muricholic acid, Cholic acid, Cholecalciferol, Pyridoxal, Flavin adenine dinucleotide, Riboflavin, Arachidic acid, Eicosapentaenoic acid, Neuronic acid, Erucic acid, Acetoacetate, Fumaric acid, Estradiol, Progesterone, Testosterone |
| 40 | Dehghan, et al., 2022 [162] | 50-week-old Abca7 knockout mice and age-matched controls | Brain | UPLC-MS | LacCer, Sphingomyelins, Cers, Hexosylceramides |
| 41 | Dunham, et al., 2022 [163] | 4, 8, 12, and 18 months 5xFAD and wild-type littermates | Plasma | UPLC-MRMs | Glycine, Carnosine, Serine, SM C24:1, Serotonin, Serotonin, Spermidine, Spermine, Aspartic acid phosphatidylcholines (PCs), α-Aminoadipic acid, Serotonin, Glutamic acid |
| 42 | Sun, et al., 2022 [164] | 4-month-old APP/PS1 mice and age-matched controls | Serum, Brain Tissues, Feces | LC-MS | 88 significant differences in metabolites related to neurotransmitters metabolism, lipid metabolism, aromatic amino acids metabolism, energy metabolism, vitamin digestion and absorption, and bile metabolism |
Disclaimer/Publisher’s Note: The statements, opinions and data contained in all publications are solely those of the individual author(s) and contributor(s) and not of MDPI and/or the editor(s). MDPI and/or the editor(s) disclaim responsibility for any injury to people or property resulting from any ideas, methods, instructions or products referred to in the content. |
© 2023 by the authors. Licensee MDPI, Basel, Switzerland. This article is an open access article distributed under the terms and conditions of the Creative Commons Attribution (CC BY) license (https://creativecommons.org/licenses/by/4.0/).
Share and Cite
Yin, C.; Harms, A.C.; Hankemeier, T.; Kindt, A.; de Lange, E.C.M. Status of Metabolomic Measurement for Insights in Alzheimer’s Disease Progression—What Is Missing? Int. J. Mol. Sci. 2023, 24, 4960. https://doi.org/10.3390/ijms24054960
Yin C, Harms AC, Hankemeier T, Kindt A, de Lange ECM. Status of Metabolomic Measurement for Insights in Alzheimer’s Disease Progression—What Is Missing? International Journal of Molecular Sciences. 2023; 24(5):4960. https://doi.org/10.3390/ijms24054960
Chicago/Turabian StyleYin, Chunyuan, Amy C. Harms, Thomas Hankemeier, Alida Kindt, and Elizabeth C. M. de Lange. 2023. "Status of Metabolomic Measurement for Insights in Alzheimer’s Disease Progression—What Is Missing?" International Journal of Molecular Sciences 24, no. 5: 4960. https://doi.org/10.3390/ijms24054960
APA StyleYin, C., Harms, A. C., Hankemeier, T., Kindt, A., & de Lange, E. C. M. (2023). Status of Metabolomic Measurement for Insights in Alzheimer’s Disease Progression—What Is Missing? International Journal of Molecular Sciences, 24(5), 4960. https://doi.org/10.3390/ijms24054960