
Differentially Expressed Genes and Molecular Susceptibility to Human Age-Related Diseases

 , , , ,
Abstract
1. Introduction
2. Results
2.1. RNA-Seq and Mapping to the Reference Rat Genome
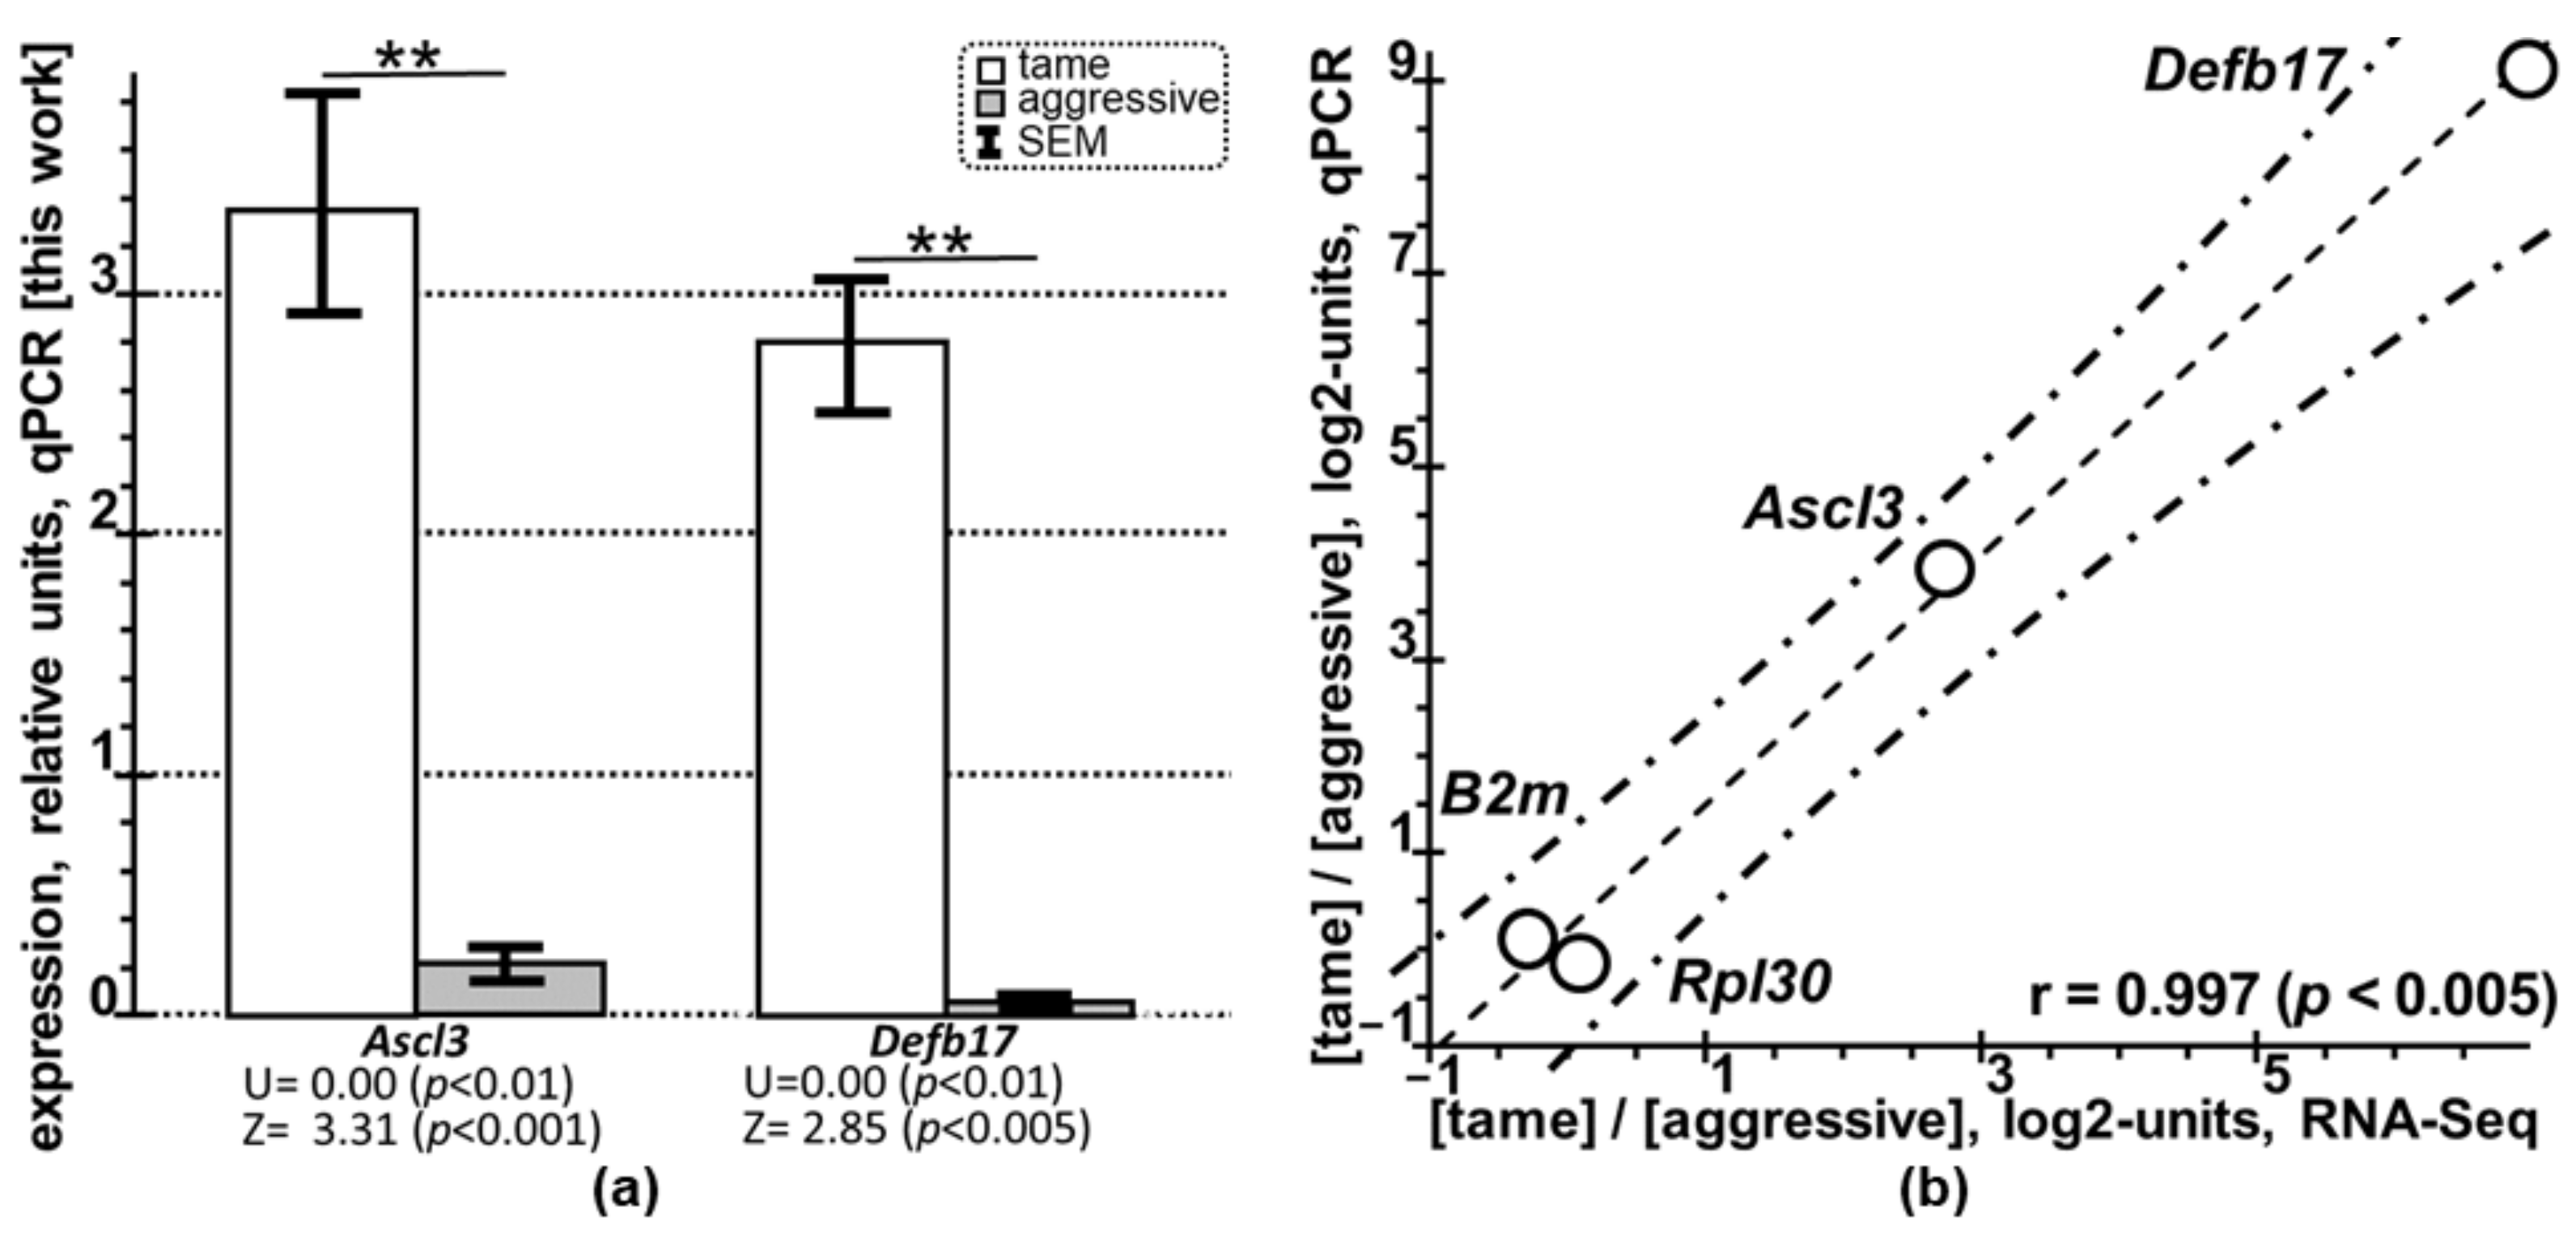
2.2. Quantitative PCR (qPCR)-Based Selective Verification of the Novel PAG-Related DEGs of the Tame and Aggressive Rats
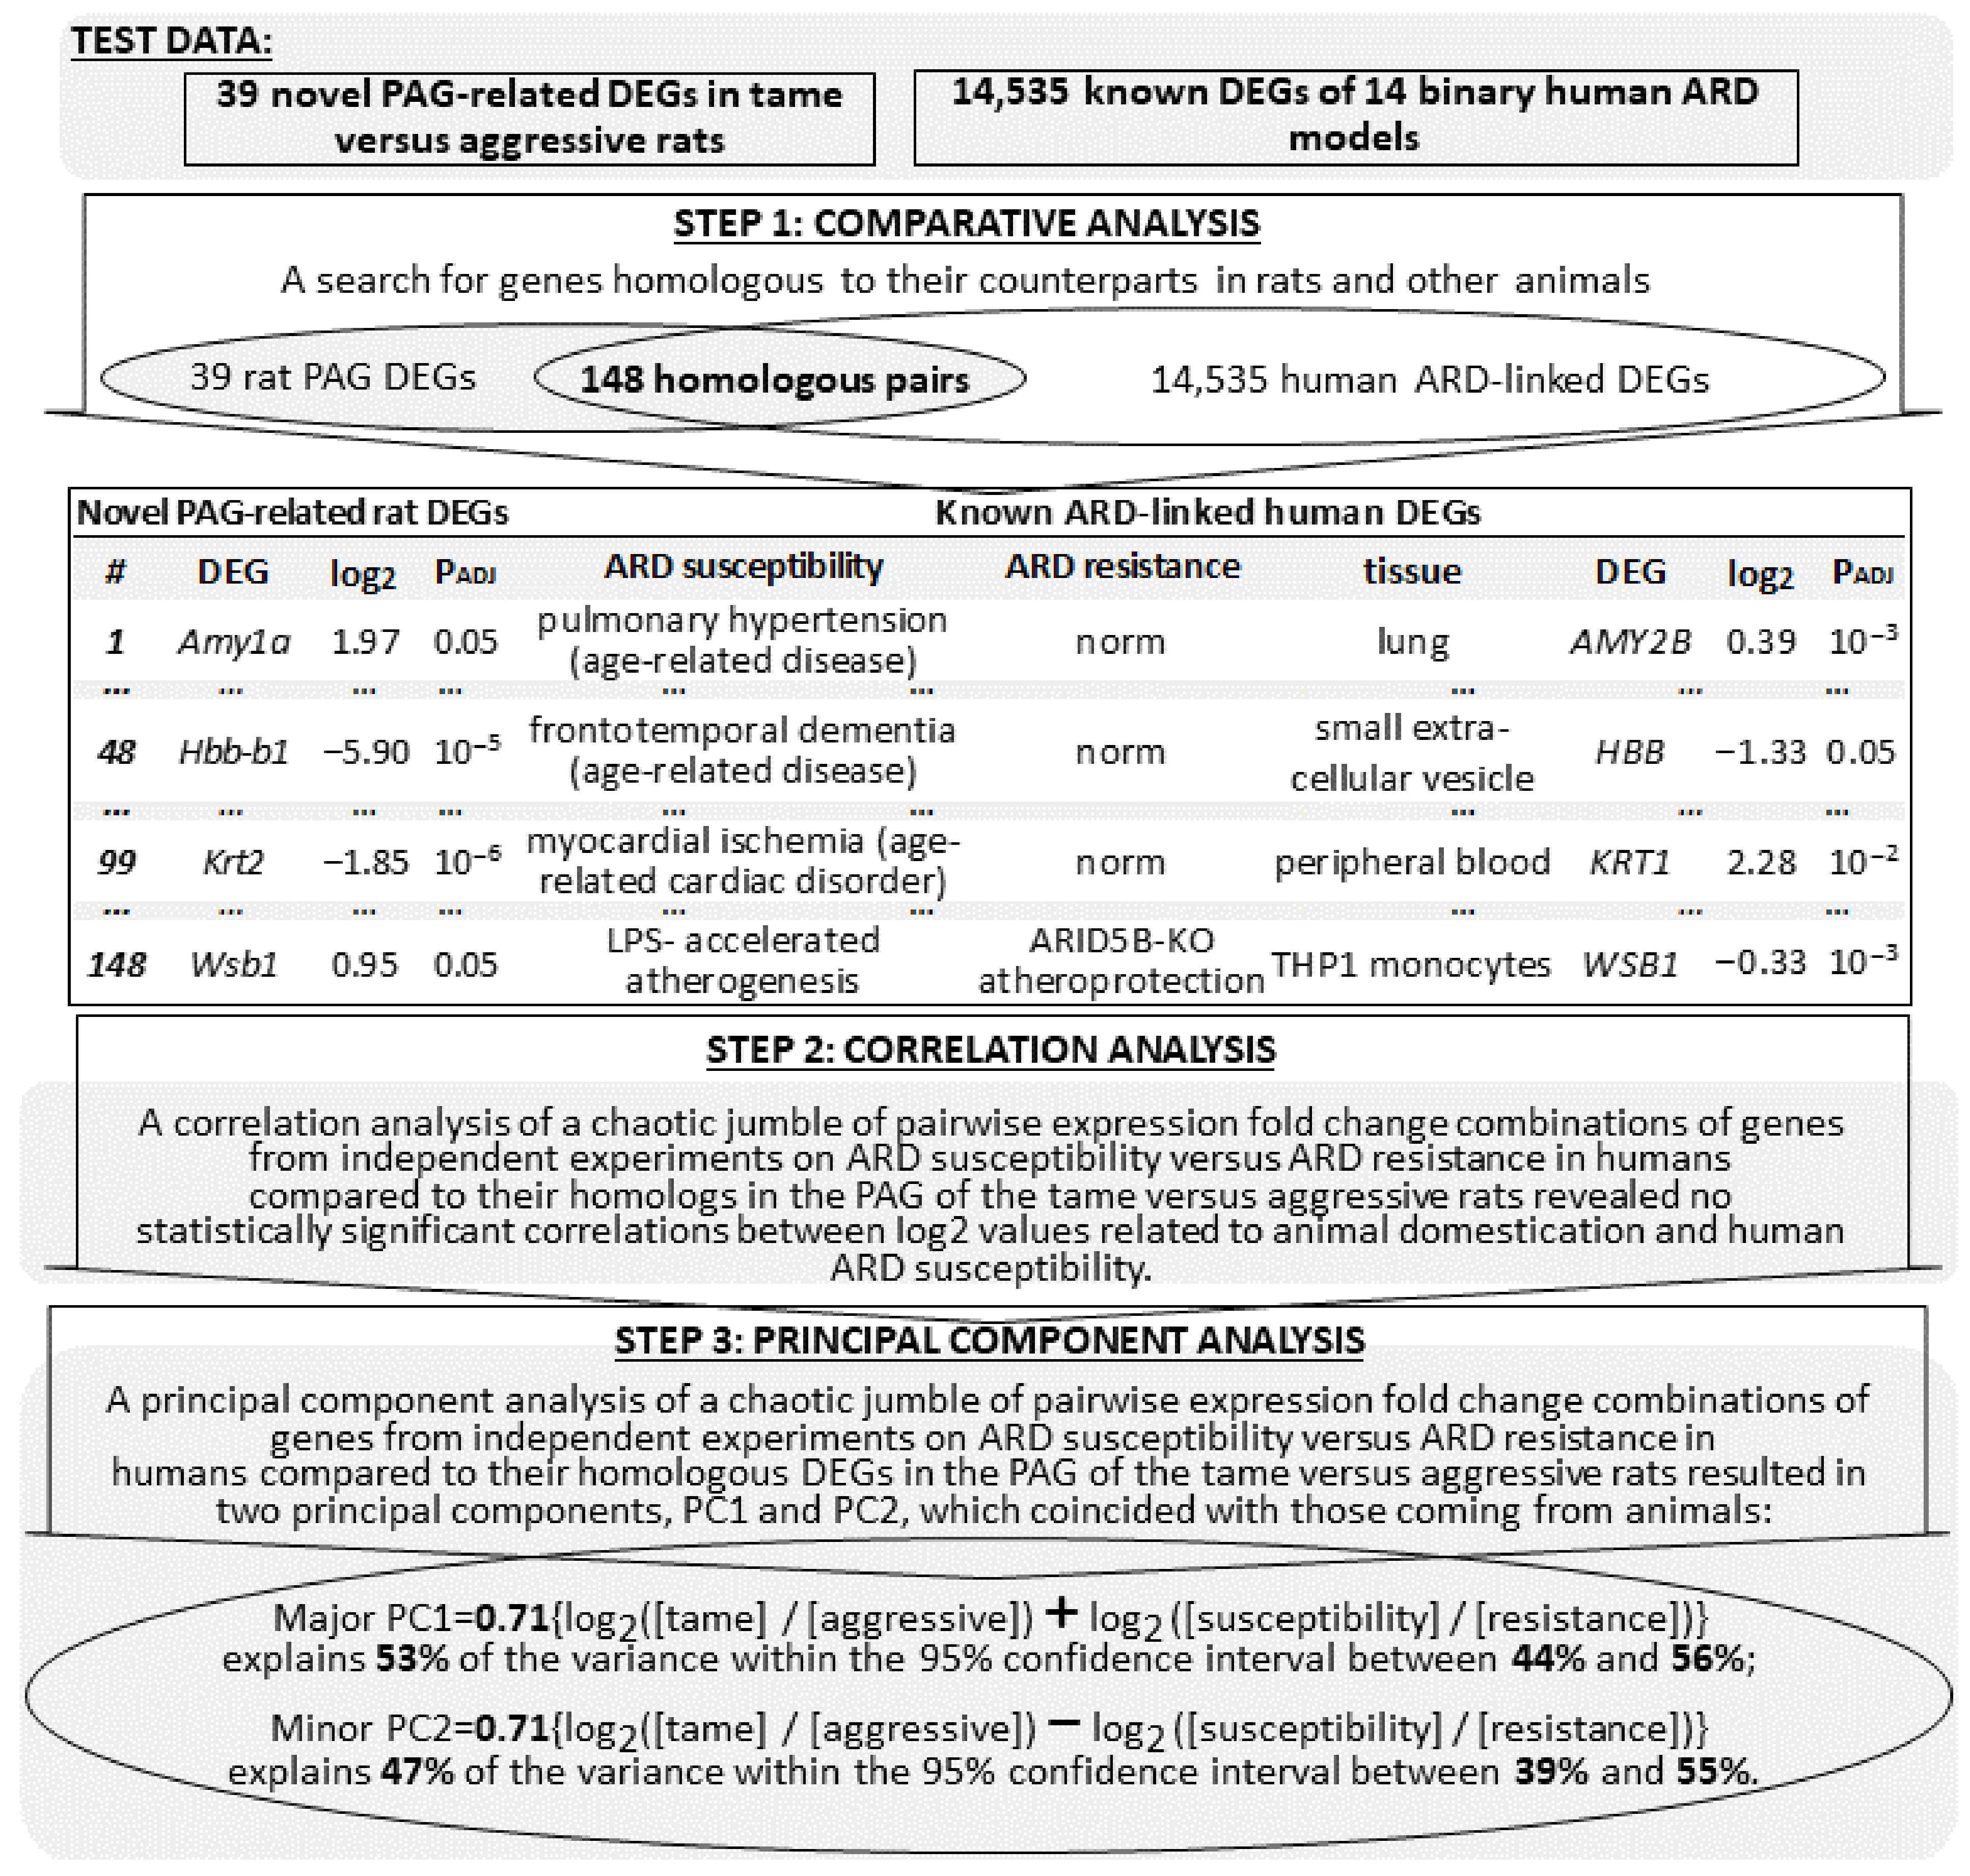
2.3. Comparison of Known Animal ARD-Linked DEGs with Their Homologs among 39 Novel PAG-Related DEGs of the Tame and Aggressive Rats
2.4. Animal ARD-Linked DEGs Are Relevant to Humans
2.5. Searching for ARD Molecular Markers among Human Genes Orthologous to 39 Novel PAG-Related DEGs of the Tame and Aggressive Rats
2.6. Can Human Fcγ Receptor IIb Upregulation Serve as a Theranostic Molecular Marker for ARDs?
3. Discussion
3.1. Overexpression of Human Genes Homologous to the Rat Fcgr2b Gene Identified as A Molecular Marker for ARDs Is Consistent with Overexpression of Known ARD-Linked DEGs
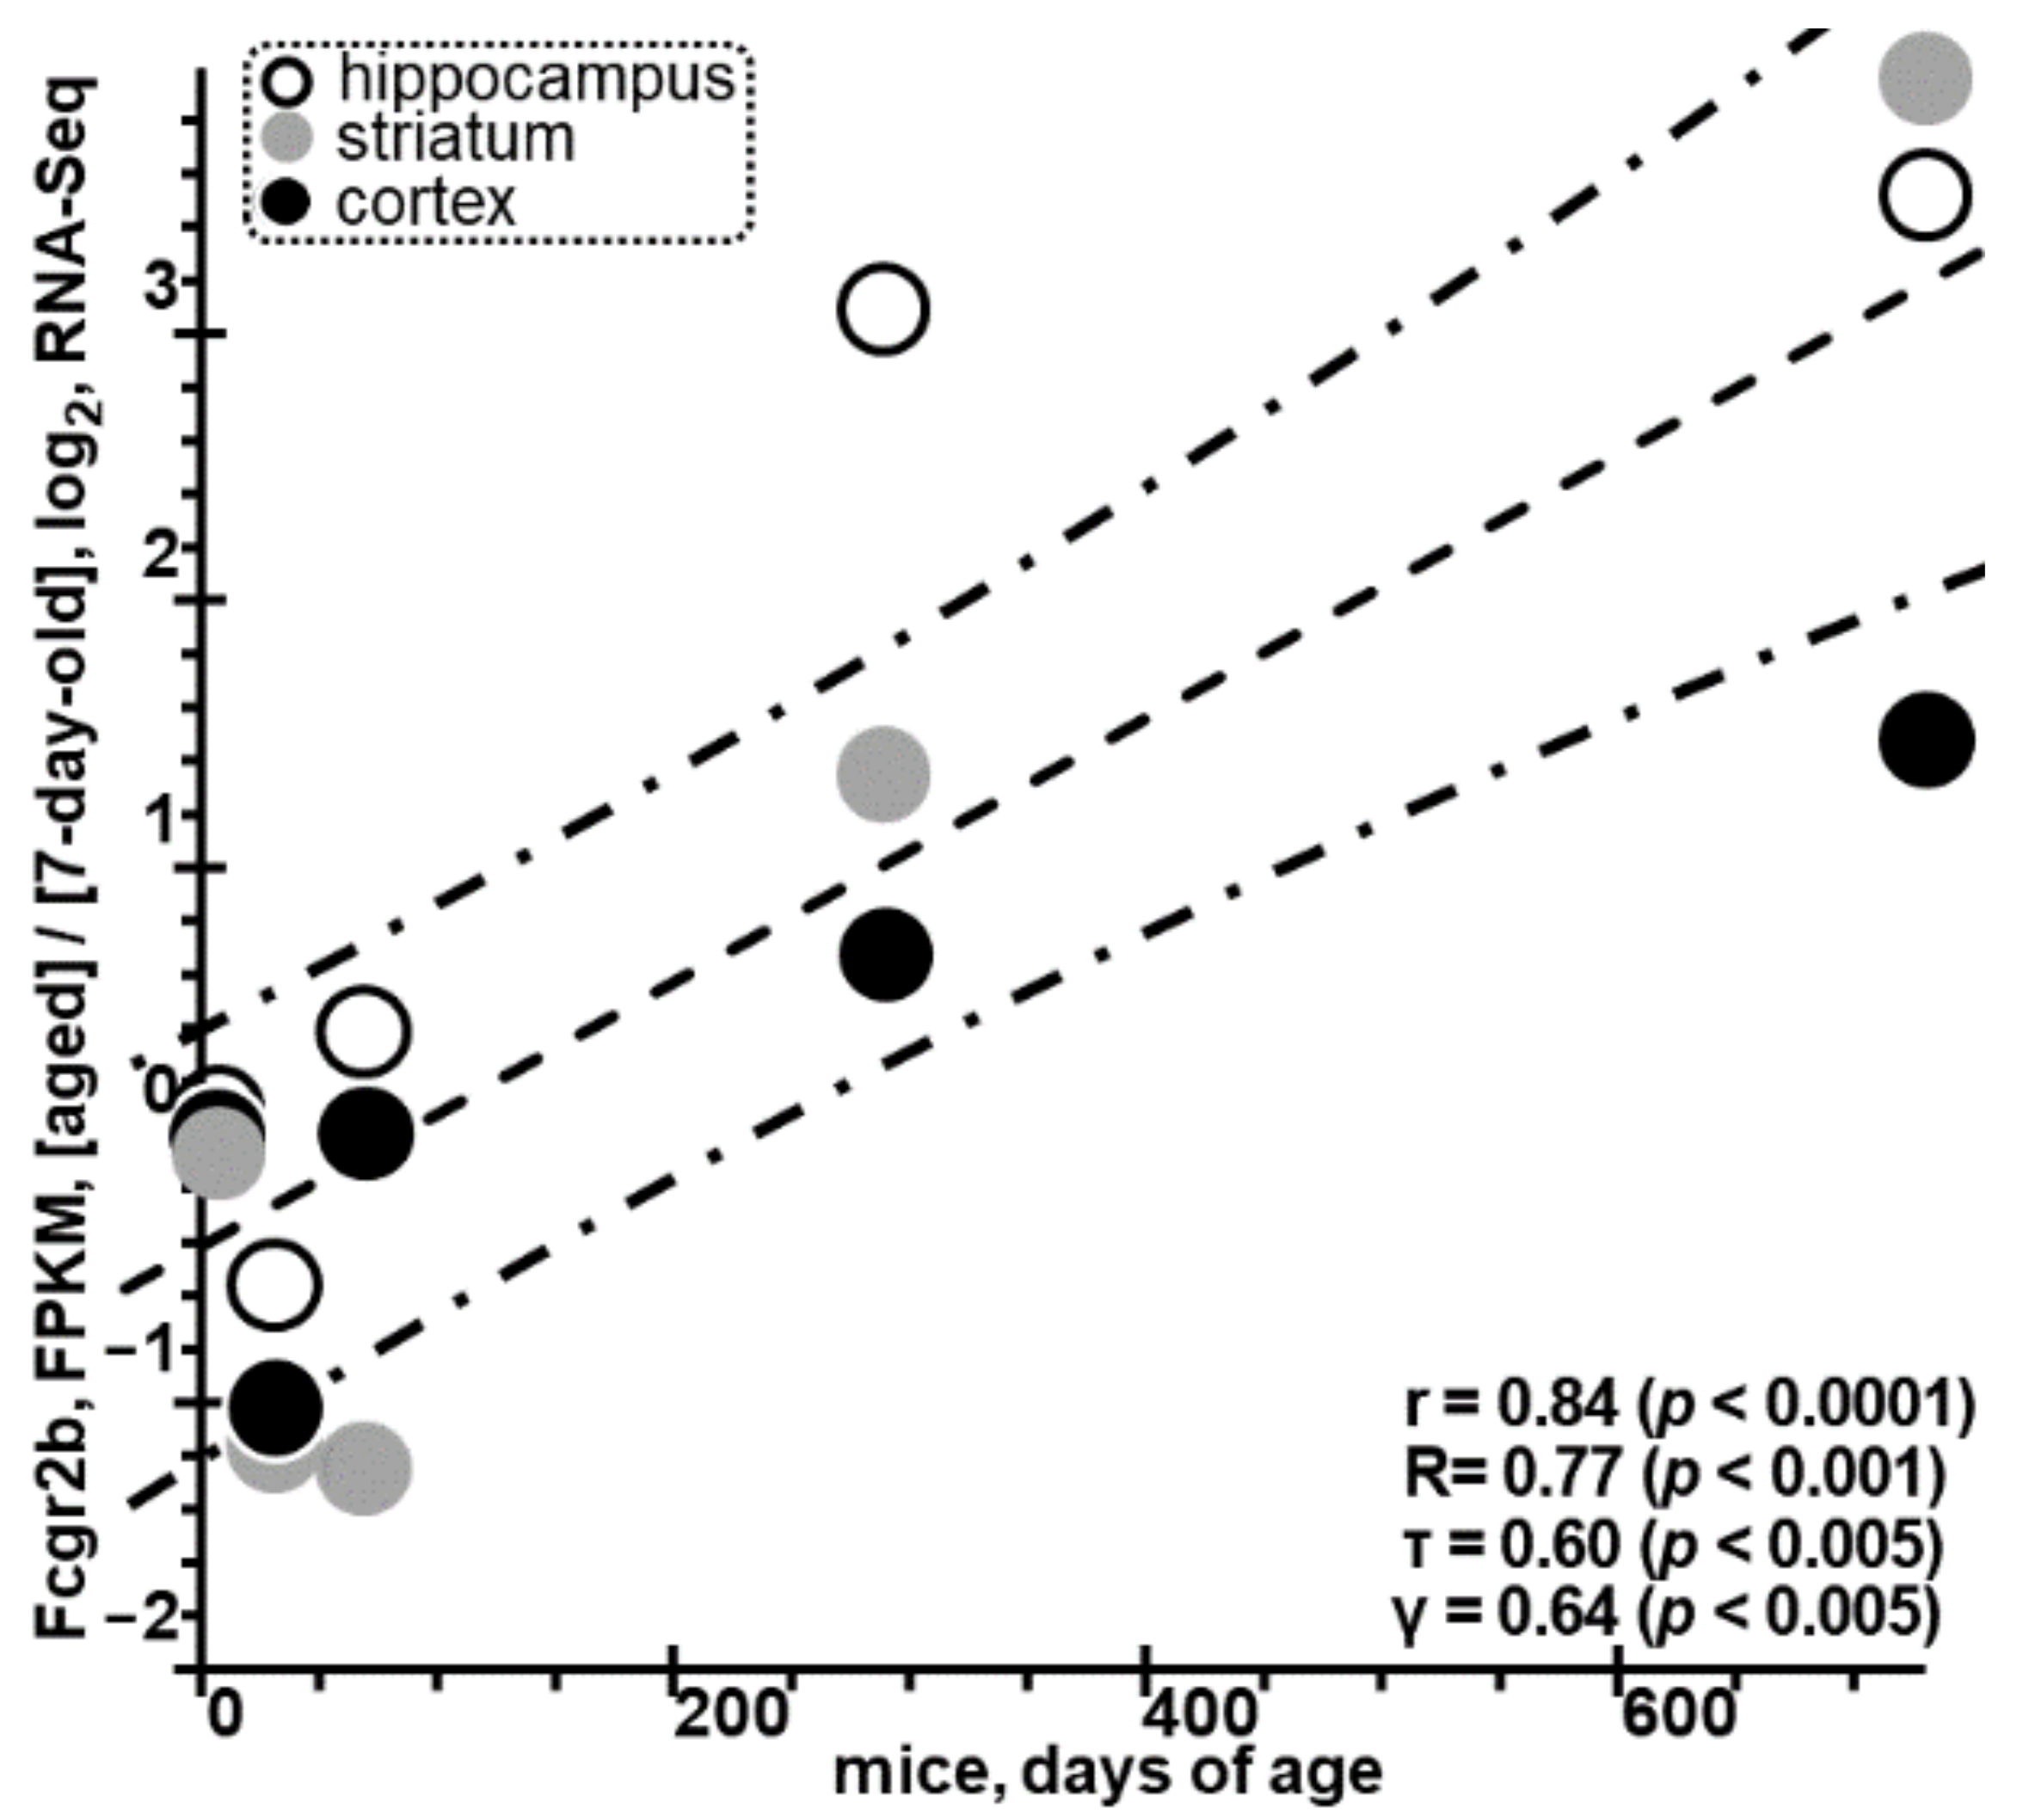
3.2. Excess of Rat Fcgr2b Identified as A Molecular Marker for ARDs Is Consistent with Independent RNA-Seq Data on the Rise in the Levels of Murine Fcgr2b in Astrocytes with Age
3.3. Stabilizing Selection Preserves the Expression Pattern of the Human FCGR2B Gene Orthologous to the Rat Fcgr2b Gene, a Molecular Marker for ARDs
3.4. The Use of Tame and Aggressive Rats as Belyaev’s Laboratory-Animal-Based Domestication Model can Represent an Adequate Domesticated-Animal-Based Model of Human ARDs
3.5. Our Focus on the PAG of Tame and Aggressive Rats Is Adequate for the Search for the ARD-Linked Rat DEGs
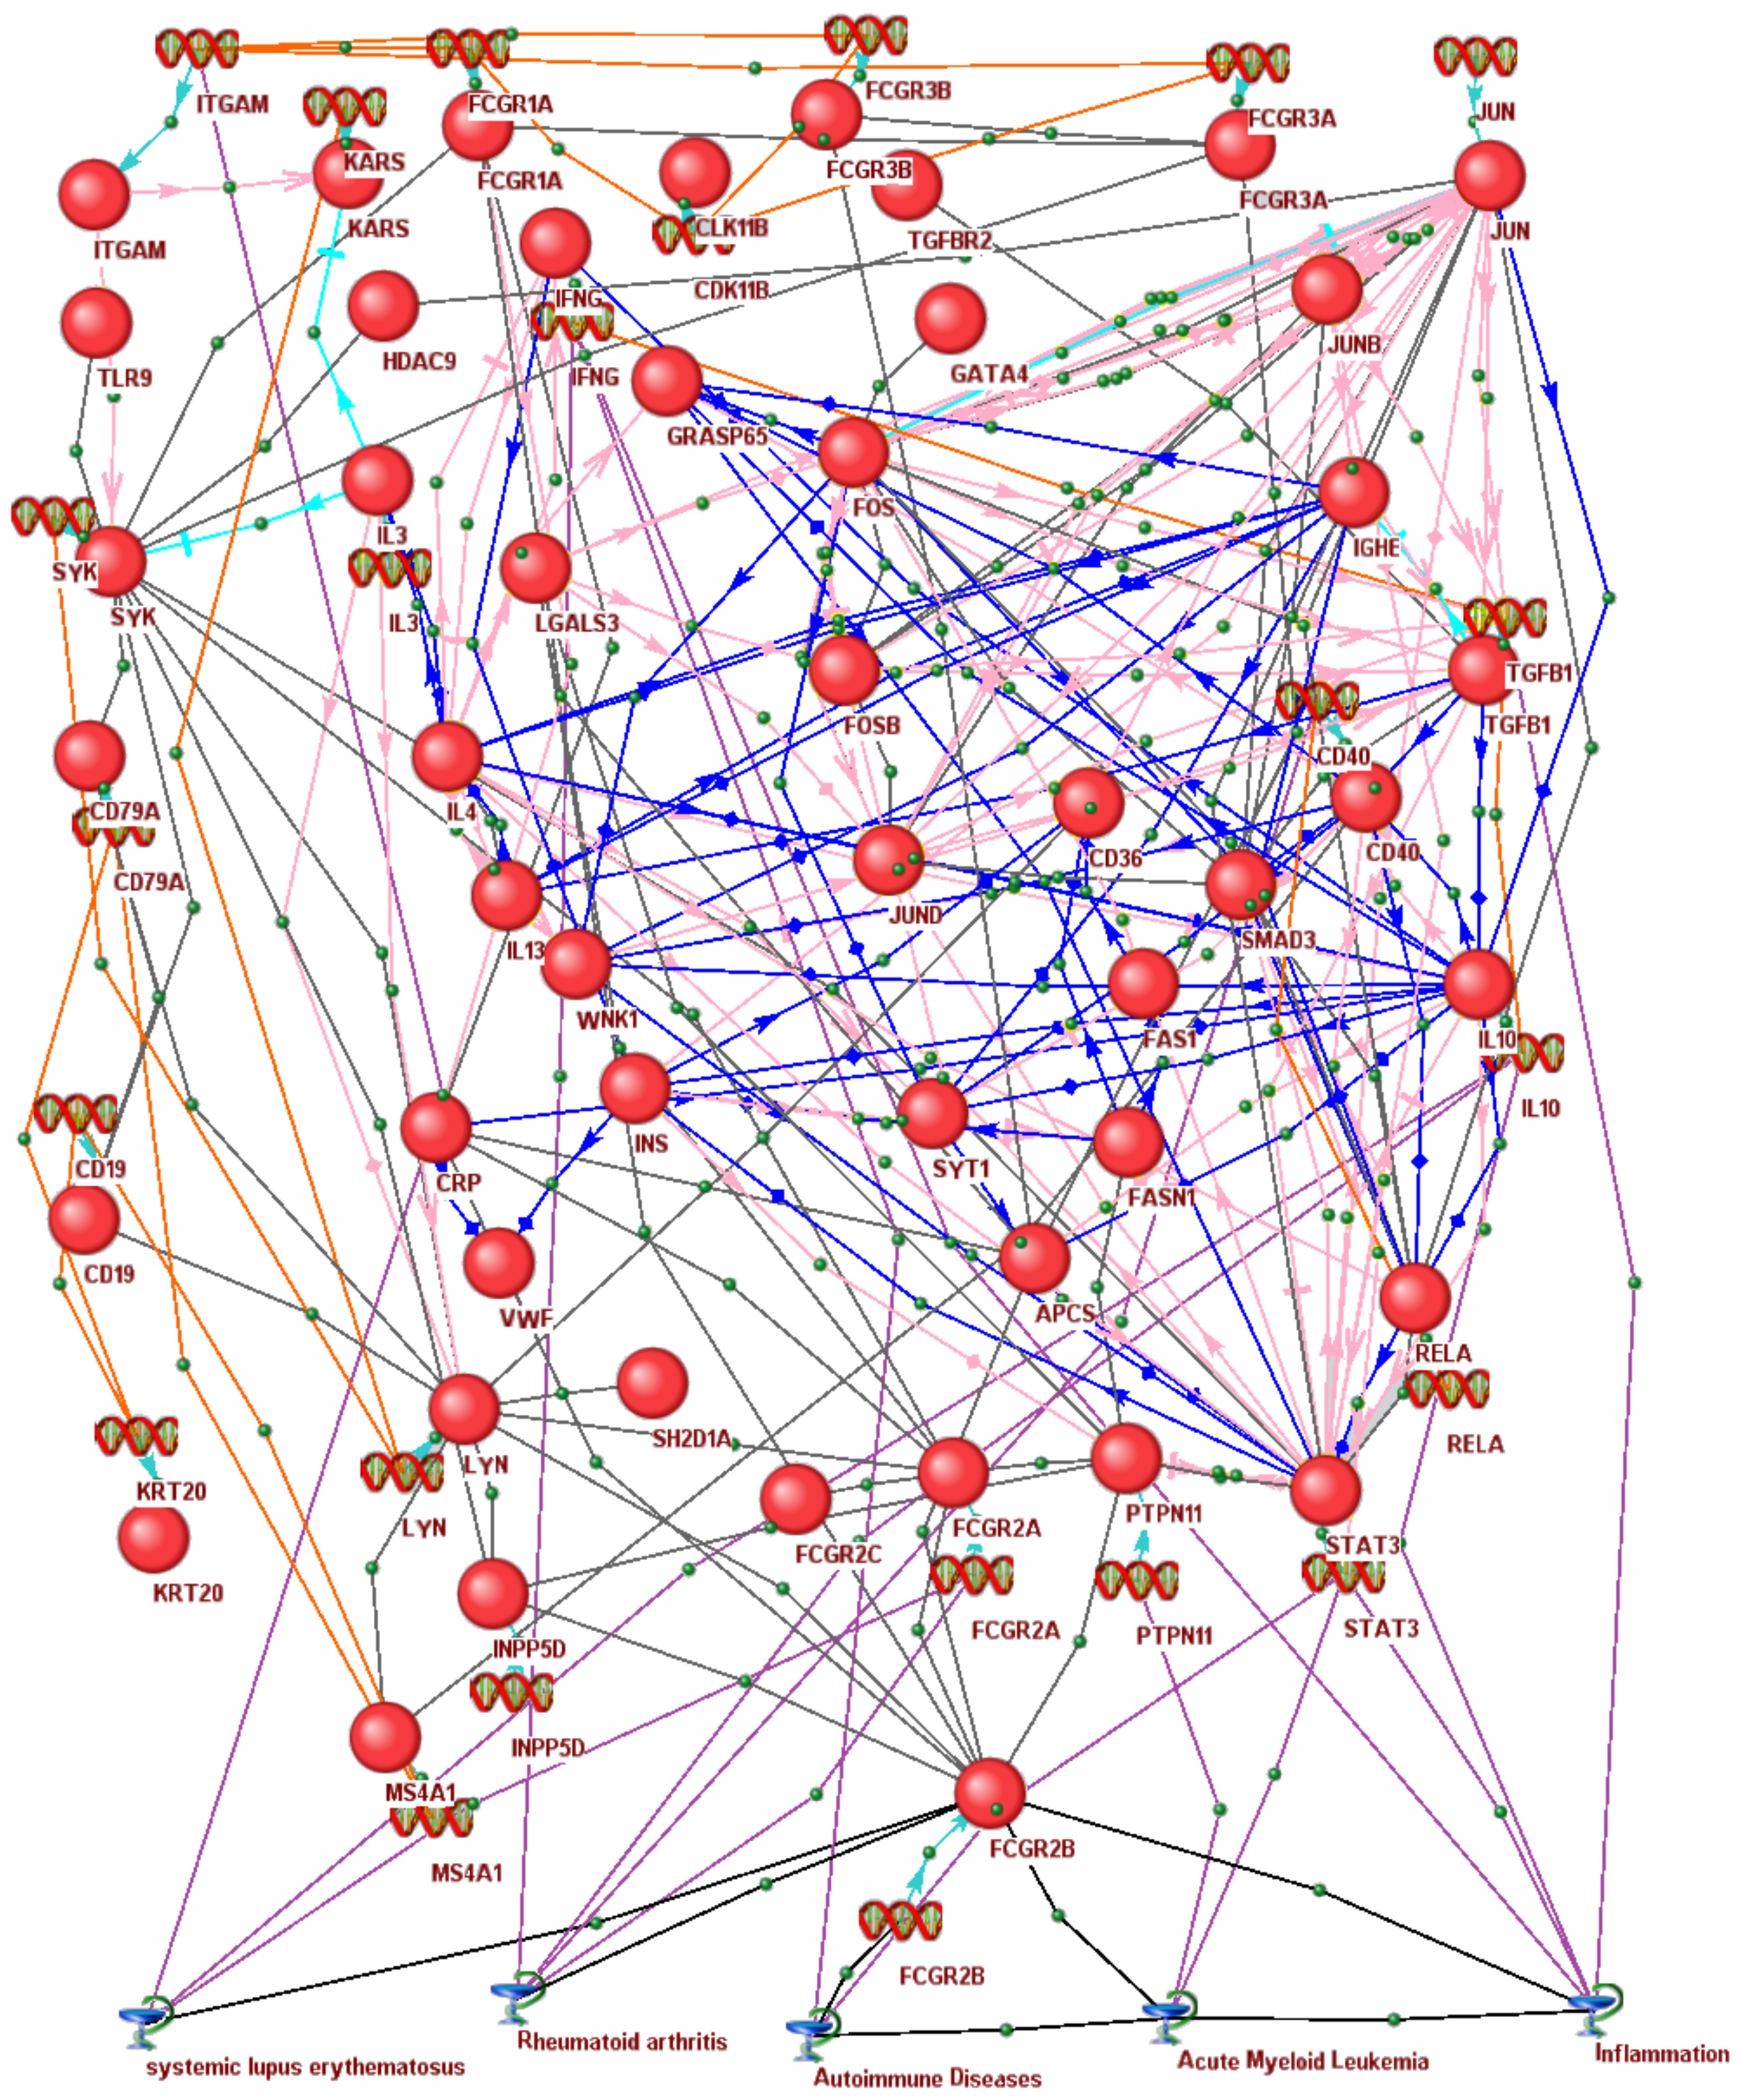
3.6. In Silico Associative Gene Network of Human Immunoregulators Homologous to the Rat Fcgr2b Gene Identified as a Molecular Marker for Pain Tolerance in ARDs
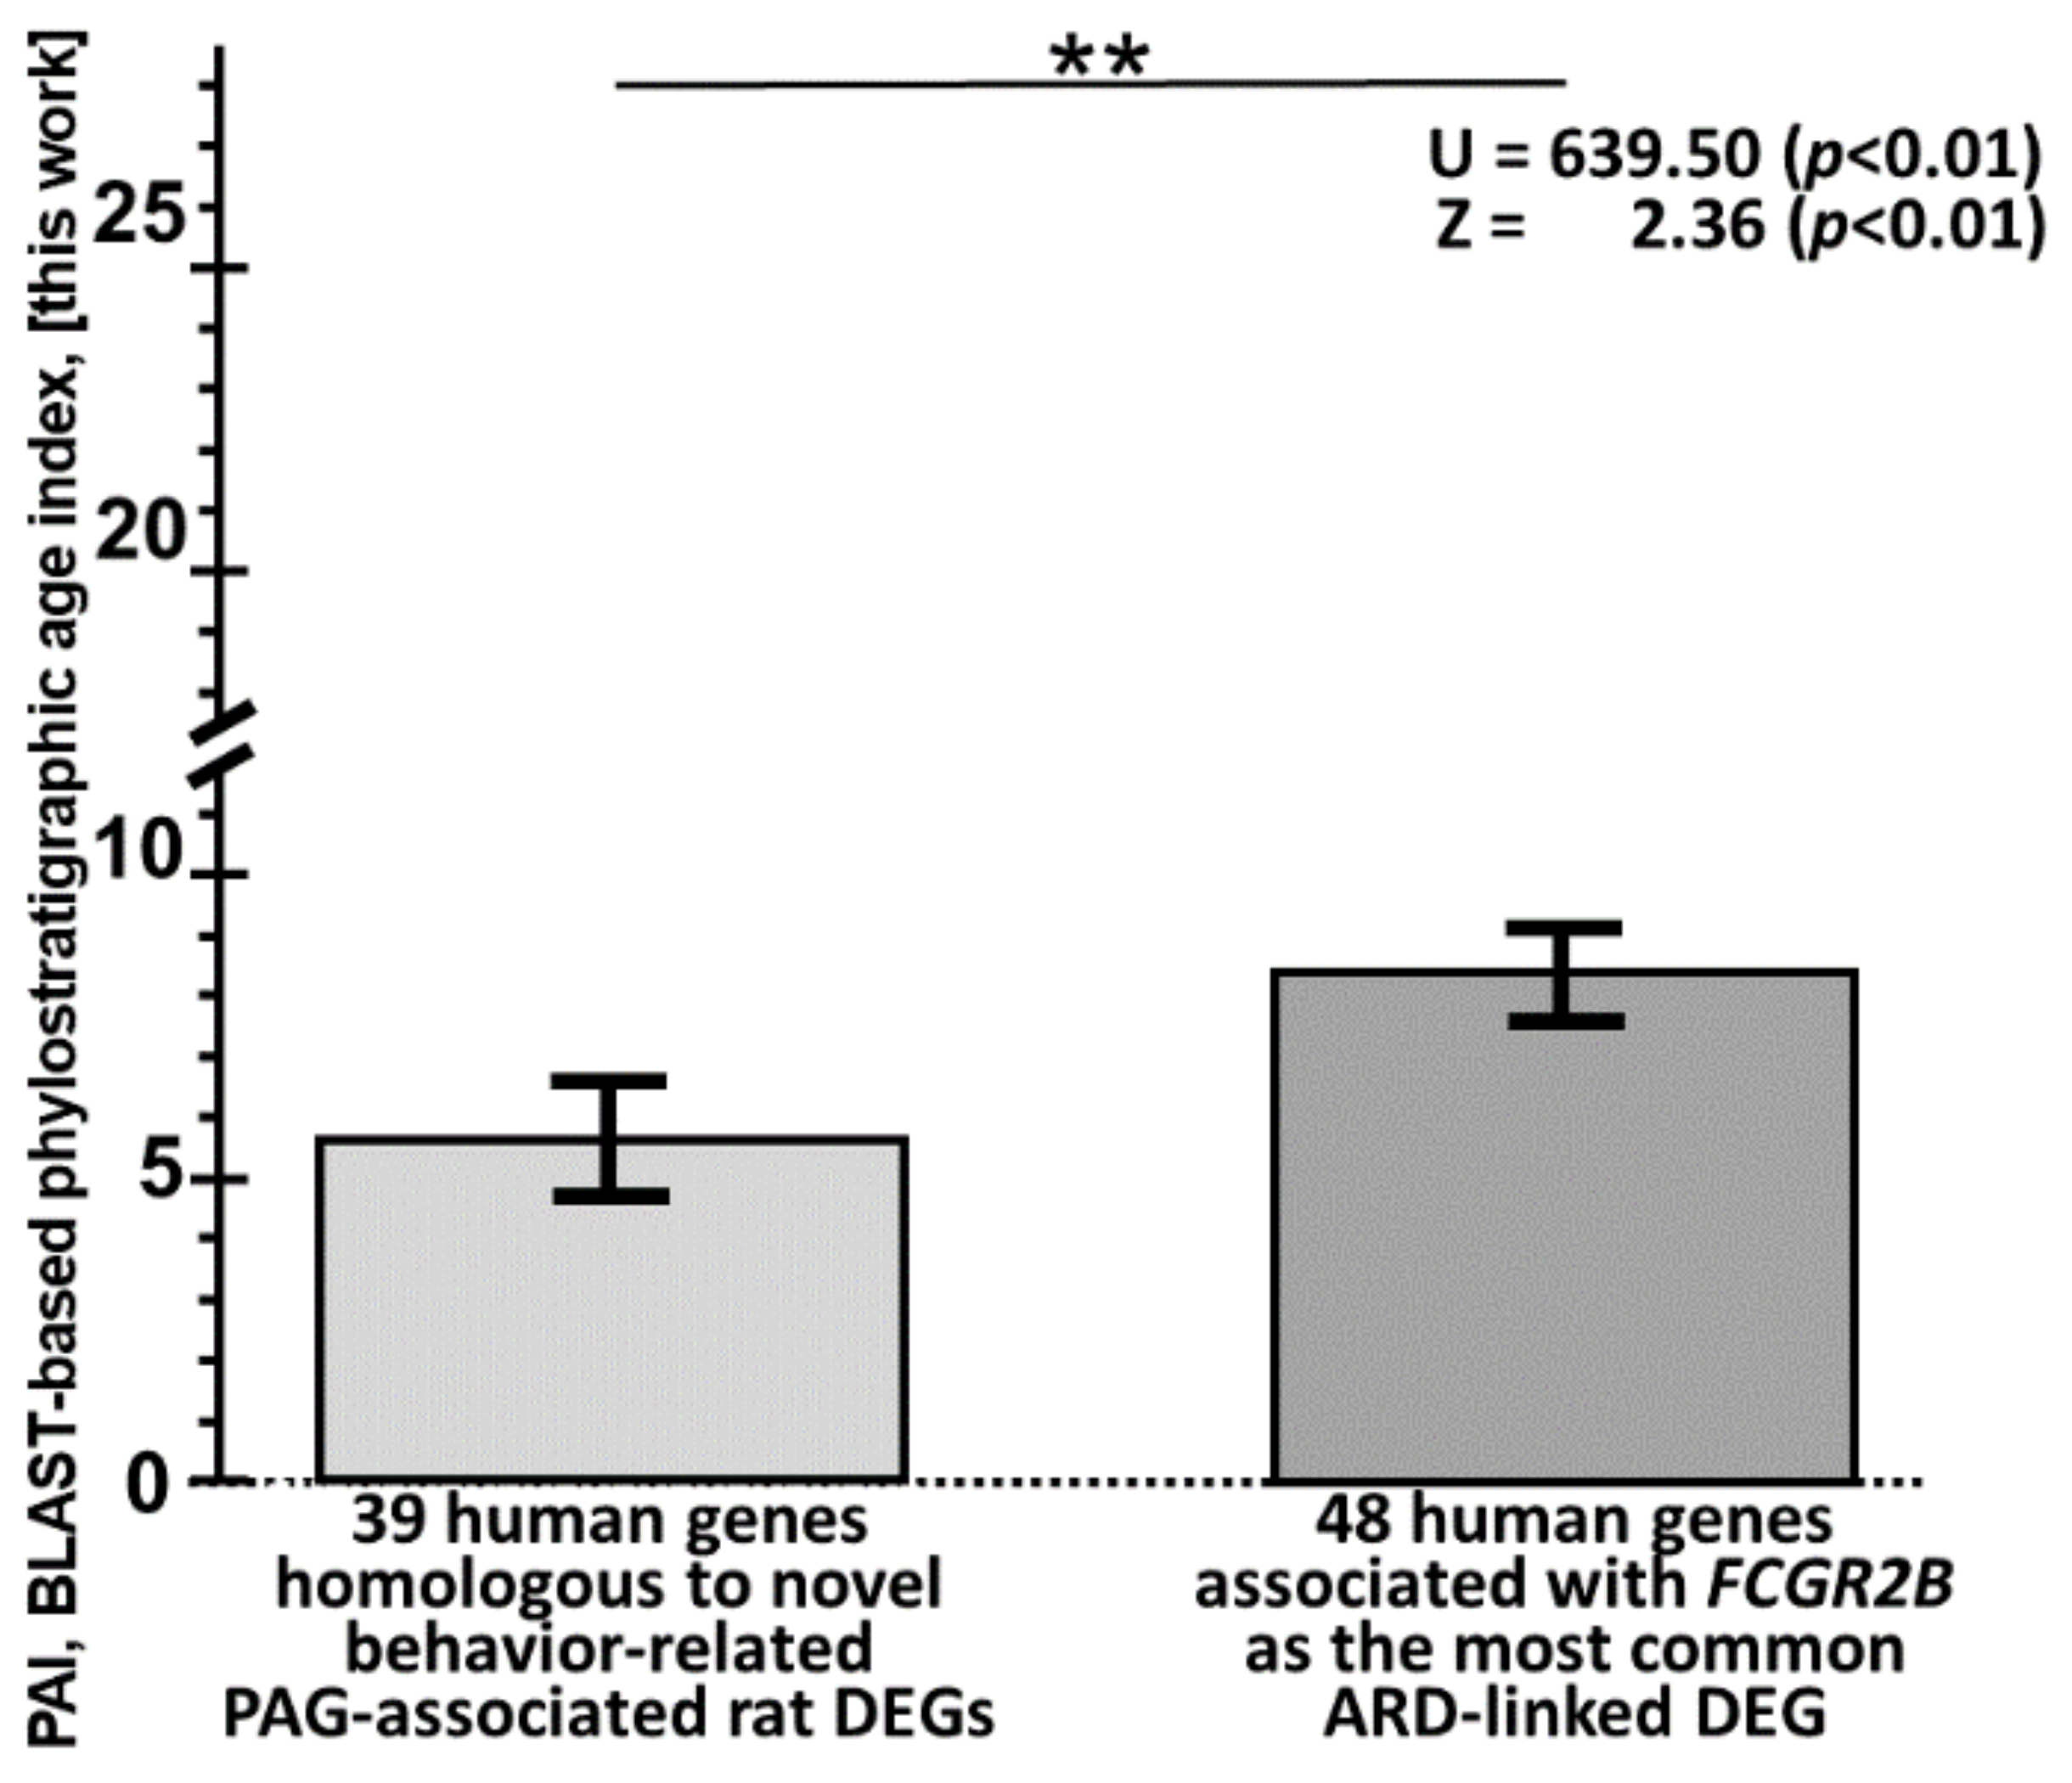
3.7. Human Immunoregulatory Genes Homologous to the Rat Fcgr2b Gene Identified as a Molecular Marker for Pain Tolerance in Age-Related Diseases Are Young on the Molecular-Evolution Scale
3.8. Human Immunoregulatory Genes Homologous to the Rat Fcgr2b Gene Identified as a Molecular Marker for Pain Tolerance in ARDs can Be Permanently Available in Any Tissue of Anyone’s Organism
4. Materials and Methods
4.1. Animals
4.2. RNA-Seq
4.3. Mapping of RNA Sequences to the R. norvegicus Reference Genome
4.4. qPCR
4.5. DEGs
4.6. Human Genes
4.7. DNA Sequences
4.8. In Silico Analysis of DNA Sequences
4.9. A Knowledge Base for Domestic Animal DEGs Whose Human Orthologs Can Affect ARD Severity
4.10. Data Mining of Literature Sources and Databases Publicly Available on the Internet
4.11. In Silico Estimation of the BLAST-Based PAIs of a Given Human Gene
4.12. Statistical Analysis
5. Conclusions
Supplementary Materials
Author Contributions
Funding
Institutional Review Board Statement
Informed Consent Statement
Data Availability Statement
Acknowledgments
Conflicts of Interest
Abbreviations
| ARD | age-related disease |
| DEG | differentially expressed gene |
| log2 value | log2-transformed gene expression fold change |
| PAG | periaqueductal gray matter |
| PAI | phylostratigraphic age index |
| PC1 (PC2) | major (minor) principal component |
| qPCR | quantitative polymerase chain reaction |
| RNA-Seq | RNA sequencing |
| SNP | single-nucleotide polymorphism |
| TBP | TATA-binding protein |
| WHO | World Health Organization |
References
- Byles, J. The 45 and up study: An investment in healthy ageing. Public. Health Res. Pract. 2022, 32, 3242231. [Google Scholar] [CrossRef] [PubMed]
- Lum, T.Y.S. The pathways to healthy ageing: Evidence from longitudinal studies and real-time data. Innov. Aging. 2021, 5, 467. [Google Scholar] [CrossRef]
- Le Couteur, D.G.; Thillainadesan, J. What is an aging-related disease? An epidemiological perspective. J. Gerontol. A. Biol. Sci. Med. Sci. 2022, 77, 2168–2174. [Google Scholar] [CrossRef] [PubMed]
- Nunan, E.; Wright, C.L.; Semola, O.A.; Subramanian, M.; Balasubramanian, P.; Lovern, P.C.; Fancher, I.S.; Butcher, J.T. Obesity as a premature aging phenotype–Implications for sarcopenic obesity. Geroscience 2022, 44, 1393–1405. [Google Scholar] [CrossRef] [PubMed]
- Yue, Z.; Nie, L.; Zhang, P.; Chen, Q.; Lv, Q.; Wang, Q. Tissue-resident macrophage inflammaging aggravates homeostasis dysregulation in age-related diseases. Cell. Immunol. 2021, 361, 104278. [Google Scholar] [CrossRef]
- Deryabin, P.I.; Borodkina, A.V. Epigenetic clocks provide clues to the mystery of uterine ageing. Hum. Reprod. Update 2022, dmac042. [Google Scholar] [CrossRef]
- Zammouri, J.; Vatier, C.; Capel, E.; Auclair, M.; Storey-London, C.; Bismuth, E.; Mosbah, H.; Donadille, B.; Janmaat, S.; Feve, B.; et al. Molecular and cellular bases of lipodystrophy syndromes. Front. Endocrinol. 2022, 12, 803189. [Google Scholar] [CrossRef]
- Zhang, X.; Li, H.; He, M.; Wang, J.; Wu, Y.; Li, Y. Immune system and sarcopenia: Presented relationship and future perspective. Exp. Gerontol. 2022, 164, 111823. [Google Scholar] [CrossRef]
- Armstrong, G.W.; Miller, J.B. Telemedicine for the diagnosis and management of age-related macular degeneration: A review. J. Clin. Med. 2022, 11, 835. [Google Scholar] [CrossRef]
- Gomez, C.R. Role of heat shock proteins in aging and chronic inflammatory diseases. Geroscience 2021, 43, 2515–2532. [Google Scholar] [CrossRef]
- Boulestreau, J.; Maumus, M.; Jorgensen, C.; Noel, D. Extracellular vesicles from mesenchymal stromal cells: Therapeutic perspectives for targeting senescence in osteoarthritis. Adv. Drug. Deliv. Rev. 2021, 175, 113836. [Google Scholar] [CrossRef]
- Ting, K.K.; Coleman, P.; Zhao, Y.; Vadas, M.A.; Gamble, J.R. The aging endothelium. Vasc. Biol. 2021, 3, R35–R47. [Google Scholar] [CrossRef] [PubMed]
- Tuttle, C.S.L.; Luesken, S.W.M.; Waaijer, M.E.C.; Maier, A.B. Senescence in tissue samples of humans with age-related diseases: A systematic review. Ageing. Res. Rev. 2021, 68, 101334. [Google Scholar] [CrossRef] [PubMed]
- Martins, W.K.; Belotto, R.; Silva, M.N.; Grasso, D.; Suriani, M.D.; Lavor, T.S.; Itri, R.; Baptista, M.S.; Tsubone, T.M. Autophagy regulation and photodynamic therapy: Insights to improve outcomes of cancer treatment. Front Oncol. 2021, 10, 610472. [Google Scholar] [CrossRef] [PubMed]
- Kishimoto, Y.; Kondo, K.; Momiyama, Y. The protective role of sestrin2 in atherosclerotic and cardiac diseases. Int. J. Mol. Sci. 2021, 22, 1200. [Google Scholar] [CrossRef] [PubMed]
- Sutton, N.R.; Malhotra, R.; St Hilaire, C.; Aikawa, E.; Blumenthal, R.S.; Gackenbach, G.; Goyal, P.; Johnson, A.; Nigwekar, S.U.; Shanahan, C.M.; et al. Molecular mechanisms of vascular health: Insights from vascular aging and calcification. Arterioscler. Thromb. Vasc. Biol. 2023, 43, 15–29. [Google Scholar] [CrossRef]
- Figuer, A.; Bodega, G.; Tato, P.; Valera, G.; Serroukh, N.; Ceprian, N.; de Sequera, P.; Morales, E.; Carracedo, J.; Ramirez, R.; et al. Premature aging in chronic kidney disease: The outcome of persistent inflammation beyond the bounds. Int. J. Environ. Res. Public. Health. 2021, 18, 8044. [Google Scholar] [CrossRef]
- Li, X.; Gao, X.; Zhang, W.; Liu, M.; Han, Z.; Li, M.; Lei, P.; Liu, Q. Microglial replacement in the aged brain restricts neuroinflammation following intracerebral hemorrhage. Cell. Death. Dis. 2022, 13, 33. [Google Scholar] [CrossRef]
- Jicha, G.A. Medical management of frontotemporal dementias: The importance of the caregiver in symptom assessment and guidance of treatment strategies. J. Mol. Neurosci. 2011, 45, 713–723. [Google Scholar] [CrossRef]
- Schramm, C.; Wallon, D.; Nicolas, G.; Charbonnier, C. What contribution can genetics make to predict the risk of Alzheimer’s disease? Rev. Neurol. 2022, 178, 414–421. [Google Scholar] [CrossRef]
- Bohnen, N.I.; Yarnall, A.J.; Weil, R.S.; Moro, E.; Moehle, M.S.; Borghammer, P.; Bedard, M.A.; Albin, R.L. Cholinergic system changes in Parkinson’s disease: Emerging therapeutic approaches. Lancet. Neurol. 2022, 21, 381–392. [Google Scholar] [CrossRef]
- Ni, Y.Q.; Xu, H.; Liu, Y.S. Roles of long non-coding RNAs in the Development of aging-related neurodegenerative diseases. Front. Mol. Neurosci. 2022, 15, 844193. [Google Scholar] [CrossRef] [PubMed]
- Schroth, J.; Henson, S.M. Mitochondrial dysfunction accelerates ageing. Immunometabolism 2020, 2, e200035. [Google Scholar] [CrossRef] [PubMed]
- Wang, J.C.; Bennett, M. Aging and atherosclerosis: Mechanisms, functional consequences, and potential therapeutics for cellular senescence. Circ. Res. 2012, 111, 245–259. [Google Scholar] [CrossRef] [PubMed]
- Schreckenberger, Z.J.; Wenceslau, C.F.; Joe, B.; McCarthy, C.G. Mitophagy in hypertension-associated premature vascular aging. Am. J. Hypertens. 2020, 33, 804–812. [Google Scholar] [CrossRef] [PubMed]
- Liu, C.; Zou, C.; Zou, S.; Wang, Q.; Xiao, D.; Zhang, L. Abnormal hemoglobin H band in myelodysplastic syndromes (MDS): A case report. Transfus. Clin. Biol. 2021, 28, 206–210. [Google Scholar] [CrossRef]
- Mandelblatt, J. Squamous cell cancer of the cervix, immune senescence and HPV: Is cervical cancer an age-related neoplasm? Adv. Exp. Med. Biol. 1993, 330, 13–26. [Google Scholar] [PubMed]
- Manoogian, E.N.C.; Panda, S. Circadian rhythms, time-restricted feeding, and healthy aging. Ageing Res. Rev. 2017, 39, 59–67. [Google Scholar] [CrossRef]
- Longo, V.D.; Anderson, R.M. Nutrition, longevity and disease: From molecular mechanisms to interventions. Cell 2022, 185, 1455–1470. [Google Scholar] [CrossRef]
- Park, W.; Rengaraj, D.; Kil, D.Y.; Kim, H.; Lee, H.K.; Song, K.D. RNA-seq analysis of the kidneys of broiler chickens fed diets containing different concentrations of calcium. Sci. Rep. 2017, 7, 11740. [Google Scholar] [CrossRef]
- Mycielska, M.E.; James, E.N.; Parkinson, E.K. Metabolic alterations in cellular senescence: The role of citrate in ageing and age-related disease. Int. J. Mol. Sci. 2022, 23, 3652. [Google Scholar] [CrossRef] [PubMed]
- de Souto Barreto, P.; Cesari, M.; Morley, J.E.; Roberts, S.; Landi, F.; Cederholm, T.; Rolland, Y.; Vellas, B.; Fielding, R. Appetite loss and anorexia of aging in clinical care: An ICFSR task force report. J. Frailty. Aging. 2022, 11, 129–134. [Google Scholar] [CrossRef] [PubMed]
- Melov, S.; Tarnopolsky, M.A.; Beckman, K.; Felkey, K.; Hubbard, A. Resistance exercise reverses aging in human skeletal muscle. PLoS ONE 2007, 2, e465. [Google Scholar] [CrossRef] [PubMed]
- Zhang, T.; Chen, Y.; Wen, J.; Jia, Y.; Wang, L.; Lv, X.; Yang, W.; Qu, C.; Li, H.; Wang, H.; et al. Transcriptomic analysis of laying hens revealed the role of aging-related genes during forced molting. Genes 2021, 12, 1767. [Google Scholar] [CrossRef] [PubMed]
- Liu, X.; Zhan, Y.; Xu, W.; Liu, L.; Liu, X.; Da, J.; Zhang, K.; Zhang, X.; Wang, J.; Liu, Z.; et al. Characterization of transcriptional landscape in bone marrow-derived mesenchymal stromal cells treated with aspirin by RNA-seq. PeerJ 2022, 10, e12819. [Google Scholar] [CrossRef]
- Wu, Y.B.; Zang, W.D.; Yao, W.Z.; Luo, Y.; Hu, B.; Wang, L.; Liang, Y.L. Analysis of FOS, BTG2, and NR4A in the function of renal medullary hypertension. Genet. Mol. Res. 2013, 12, 3735–3741. [Google Scholar] [CrossRef]
- Li, C.; Zhang, Z.; Xu, Q.; Wu, T.; Shi, R. Potential mechanisms and serum biomarkers involved in sex differences in pulmonary arterial hypertension. Medicine 2020, 99, e19612. [Google Scholar] [CrossRef]
- Stearman, R.S.; Bui, Q.M.; Speyer, G.; Handen, A.; Cornelius, A.R.; Graham, B.B.; Kim, S.; Mickler, E.A.; Tuder, R.M.; Chan, S.Y.; et al. Systems analysis of the human pulmonary arterial hypertension lung transcriptome. Am. J. Respir. Cell Mol. Biol. 2019, 60, 637–649. [Google Scholar] [CrossRef]
- Yao, X.; Jing, T.; Wang, T.; Gu, C.; Chen, X.; Chen, F.; Feng, H.; Zhao, H.; Chen, D.; Ma, W. Molecular characterization and elucidation of pathways to identify novel therapeutic targets in pulmonary arterial hypertension. Front. Physiol. 2021, 12, 694702. [Google Scholar] [CrossRef]
- Neusser, M.A.; Lindenmeyer, M.T.; Moll, A.G.; Segerer, S.; Edenhofer, I.; Sen, K.; Stiehl, D.P.; Kretzler, M.; Grone, H.J.; Schlondorff, D.; et al. Human nephrosclerosis triggers a hypoxia-related glomerulopathy. Am. J. Pathol. 2010, 176, 594–607. [Google Scholar] [CrossRef]
- Zheng, Y.; He, J.Q. Common differentially expressed genes and pathways correlating both coronary artery disease and atrial fibrillation. EXCLI J. 2021, 20, 126–141. [Google Scholar] [PubMed]
- Sproviero, D.; Gagliardi, S.; Zucca, S.; Arigoni, M.; Giannini, M.; Garofalo, M.; Fantini, V.; Pansarasa, O.; Avenali, M.; Ramusino, M.C.; et al. Extracellular vesicles derived from plasma of patients with neurodegenerative disease have common transcriptomic profiling. Front. Aging. Neurosci. 2022, 14, 785741. [Google Scholar] [CrossRef] [PubMed]
- Liu, Y.; Reynolds, L.M.; Ding, J.; Hou, L.; Lohman, K.; Young, T.; Cui, W.; Huang, Z.; Grenier, C.; Wan, M.; et al. Blood monocyte transcriptome and epigenome analyses reveal loci associated with human atherosclerosis. Nat. Commun. 2017, 8, 393. [Google Scholar] [CrossRef] [PubMed]
- Stefanova, N.A.; Maksimova, K.Y.; Rudnitskaya, E.A.; Muraleva, N.A.; Kolosova, N.G. Association of cerebrovascular dysfunction with the development of Alzheimer’s disease-like pathology in OXYS rats. BMC Genom. 2018, 19, 75. [Google Scholar] [CrossRef] [PubMed]
- Stefanova, N.A.; Ershov, N.I.; Maksimova, K.Y.; Muraleva, N.A.; Tyumentsev, M.A.; Kolosova, N.G. The rat prefrontal-cortex transcriptome: Effects of aging and sporadic Alzheimer’s disease-like pathology. J. Gerontol. A Biol. Sci. Med. Sci. 2019, 74, 33–43. [Google Scholar] [CrossRef]
- Kozhevnikova, O.S.; Korbolina, E.E.; Ershov, N.I.; Kolosova, N.G. Rat retinal transcriptome: Effects of aging and AMD-like retinopathy. Cell Cycle 2013, 12, 1745–1761. [Google Scholar] [CrossRef]
- Fedoseeva, L.A.; Klimov, L.O.; Ershov, N.I.; Efimov, V.M.; Markel, A.L.; Orlov, Y.L.; Redina, O.E. The differences in brain stem transcriptional profiling in hypertensive ISIAH and normotensive WAG rats. BMC Genom. 2019, 20, 297. [Google Scholar] [CrossRef]
- Klimov, L.O.; Ershov, N.I.; Efimov, V.M.; Markel, A.L.; Redina, O.E. Genome-wide transcriptome analysis of hypothalamus in rats with inherited stress-induced arterial hypertension. BMC. Genet. 2016, 17, 13. [Google Scholar] [CrossRef]
- Ryazanova, M.A.; Fedoseeva, L.A.; Ershov, N.I.; Efimov, V.M.; Markel, A.L.; Redina, O.E. The gene-expression profile of renal medulla in ISIAH rats with inherited stress-induced arterial hypertension. BMC Genet 2016, 17, 151. [Google Scholar] [CrossRef]
- Fedoseeva, L.A.; Ryazanova, M.A.; Ershov, N.I.; Markel, A.L.; Redina, O.E. Comparative transcriptional profiling of renal cortex in rats with inherited stress-induced arterial hypertension and normotensive Wistar Albino Glaxo rats. BMC Genet. 2016, 17, 12. [Google Scholar] [CrossRef]
- Fedoseeva, L.A.; Klimov, L.O.; Ershov, N.I.; Alexandrovich, Y.V.; Efimov, V.M.; Markel, A.L.; Redina, O.E. Molecular determinants of the adrenal gland functioning related to stress-sensitive hypertension in ISIAH rats. BMC Genom. 2016, 17, 989. [Google Scholar] [CrossRef] [PubMed]
- Yuan, X.; Wu, Q.; Liu, X.; Zhang, H.; Xiu, R. Transcriptomic profile analysis of brain microvascular pericytes in spontaneously hypertensive rats by RNA-Seq. Am. J. Transl. Res. 2018, 10, 2372–2386. [Google Scholar]
- Liddelow, S.A.; Dziegielewska, K.M.; Ek, C.J.; Habgood, M.D.; Bauer, H.; Bauer, H.C.; Lindsay, H.; Wakefield, M.J.; Strazielle, N.; Kratzer, I.; et al. Mechanisms that determine the internal environment of the developing brain: A transcriptomic, functional and ultrastructural approach. PLoS ONE 2013, 8, e65629. [Google Scholar] [CrossRef] [PubMed]
- Chen, Z.; Huang, Z.; Zhao, X.; Zhou, Y.; Zhang, P.; Li, Y. Transcriptome analysis of differentially expressed genes involved in the inflammageing status of gingiva in aged mice. Oral. Dis. 2022. [Google Scholar] [CrossRef] [PubMed]
- Kaya, S.; Schurman, C.A.; Dole, N.S.; Evans, D.S.; Alliston, T. Prioritization of genes relevant to bone fragility through the unbiased integration of aging mouse bone transcriptomics and human GWAS analyses. J. Bone. Miner. Res. 2022, 37, 804–817. [Google Scholar] [CrossRef] [PubMed]
- Wang, Y.; Eng, D.G.; Pippin, J.W.; Gharib, S.A.; McClelland, A.; Gross, K.W.; Shankland, S.J. Sex differences in transcriptomic profiles in aged kidney cells of renin lineage. Aging 2018, 10, 606–621. [Google Scholar] [CrossRef]
- Li, J.; Gao, F.; Wei, L.; Chen, L.; Qu, N.; Zeng, L.; Luo, Y.; Huang, X.; Jiang, H. Predict the role of lncRNA in kidney aging based on RNA sequencing. BMC Genom. 2022, 23, 254. [Google Scholar] [CrossRef]
- Gorr, M.W.; Francois, A.; Marcho, L.M.; Saldana, T.; McGrail, E.; Sun, N.; Stratton, M.S. Molecular signature of cardiac remodeling associated with Polymerase Gamma mutation. Life Sci. 2022, 298, 120469. [Google Scholar] [CrossRef]
- Kiss, T.; Nyul-Tooth, A.; Gulej, R.; Tarantini, S.; Csipo, T.; Mukli, P.; Ungvari, A.; Balasubramanian, P.; Yabluchanskiy, A.; Benyo, Z.; et al. Old blood from heterochronic parabionts accelerates vascular aging in young mice: Transcriptomic signature of pathologic smooth muscle remodeling. Geroscience 2022, 44, 953–981. [Google Scholar] [CrossRef]
- Fang, K.; Liu, D.; Pathak, S.S.; Yang, B.; Li, J.; Karthikeyan, R.; Chao, O.Y.; Yang, Y.M.; Jin, V.X.; Cao, R. Disruption of circadian rhythms by ambient light during neurodevelopment leads to autistic-like molecular and behavioral alterations in adult mice. Cells 2021, 10, 3314. [Google Scholar] [CrossRef]
- Myers, M.J.; Shaik, F.; Shaik, F.; Always, S.E.; Mohamed, J.S. Skeletal muscle gene expression profile in response to caloric restriction and aging: A role for SirT1. Genes 2021, 12, 691. [Google Scholar] [CrossRef] [PubMed]
- Puig, O.; Wang, I.M.; Cheng, P.; Zhou, P.; Roy, S.; Cully, D.; Peters, M.; Benita, Y.; Thompson, J.; Cai, T.Q. Transcriptome profiling and network analysis of genetically hypertensive mice identifies potential pharmacological targets of hypertension. Physiol. Genomics. 2010, 42, 24–32. [Google Scholar] [CrossRef] [PubMed]
- Loke, S.Y.; Wong, P.T.; Ong, W.Y. Global gene expression changes in the prefrontal cortex of rabbits with hypercholesterolemia and/or hypertension. Neurochem. Int. 2017, 102, 33–56. [Google Scholar] [CrossRef] [PubMed]
- da Costa Silva, J.R.; Fujimura, P.T.; Batista, L.L.; Malta, S.M.; Filho, R.M.; Silva, M.H.; de Souza, A.G.; Silva, A.P.M.; Borges, L.D.F.; Bastos, V.A.F.; et al. Differential gene expression by RNA-seq during Alzheimer’s disease-like progression in the Drosophila melanogaster model. Neurosci. Res. 2022, 180, 1–12. [Google Scholar] [CrossRef] [PubMed]
- Trovato, G.M. Sustainable medical research by effective and comprehensive medical skills: Overcoming the frontiers by predictive, preventive and personalized medicine. EPMA. J. 2014, 5, 14. [Google Scholar] [CrossRef] [PubMed]
- Litwin, M.; Feber, J. Origins of primary hypertension in children: Early vascular or biological aging? Hypertension 2020, 76, 1400–1409. [Google Scholar] [CrossRef]
- Markel, A.L. Features of the behavior of the rat with hereditarily determined arterial hypertension. Zh. Vyssh. Nerv. Deiat. Im. IP. Pavlov. 1986, 36, 956–962. [Google Scholar]
- Oshchepkov, D.; Chadaeva, I.; Kozhemyakina, R.; Shikhevich, S.; Sharypova, E.; Savinkova, L.; Klimova, N.V.; Tsukanov, A.; Levitsky, V.G.; Markel, A.L. Transcription factors as important regulators of changes in behavior through domestication of gray rats: Quantitative data from RNA sequencing. Int. J. Mol. Sci. 2022, 23, 12269. [Google Scholar] [CrossRef]
- Herbek, Y.E.; Zakharov, I.K.; Trapezov, O.V.; Shumny, V.K. Evolution compressed in time. Philos. Sci. 2013, 1, 115–139. [Google Scholar]
- Oskina, I.N.; Herbeck, Y.E.; Shikhevich, S.G.; Plyusnina, I.Z.; Gulevich, R.G. Alterations in the hypothalamus-pituitary-adrenal and immune systems during selection of animals for tame behavior. Information. Bulletin. VOGiS 2008, 12, 39–49. [Google Scholar]
- Prasolova, L.A.; Gerbek, Y.E.; Gulevich, R.G.; Shikhevich, S.G.; Konoshenko, M.Y.; Kozhemyakina, R.V.; Oskina, I.N.; Plyusnina, I.Z. The effects of prolonged selection for behavior on the stress response and activity of the reproductive system of male grey mice (Rattus norvegicus). Russ. J. Genet. 2014, 50, 846–852. [Google Scholar] [CrossRef]
- Belyaev, D.K.; Borodin, P.M. The influence of stress on variation and its role in evolution. Biol. Zent. 1982, 100, 705–714. [Google Scholar]
- Melamed, D.; Scott, D.W. Aging and neoteny in the B lineage. Blood 2012, 120, 4143–4149. [Google Scholar] [CrossRef]
- Oshchepkov, D.; Chadaeva, I.; Kozhemyakina, R.; Zolotareva, K.; Khandaev, B.; Sharypova, E.; Ponomarenko, P.; Bogomolov, A.; Klimova, N.V.; Shikhevich, S.; et al. Stress reactivity, susceptibility to hypertension, and differential expression of genes in hypertensive compared to normotensive patients. Int. J. Mol. Sci. 2022, 23, 2835. [Google Scholar] [CrossRef] [PubMed]
- Lu, Z. PubMed and beyond: A survey of web tools for searching biomedical literature. Database 2011, 2011, baq036. [Google Scholar] [CrossRef] [PubMed]
- Petitjean, H.; Fatima, T.; Mouchbahani-Constance, S.; Davidova, A.; Ferland, C.E.; Orlowski, J.; Sharif-Naeini, R. Loss of SLC9A6/NHE6 impairs nociception in a mouse model of Christianson syndrome. Pain 2020, 161, 2619–2628. [Google Scholar] [CrossRef] [PubMed]
- Vrticka, P.; Black, J.M.; Neely, M.; Walter Shelly, E.; Reiss, A.L. Humor processing in children: Influence of temperament, age and IQ. Neuropsychologia 2013, 51, 2799–2811. [Google Scholar] [CrossRef]
- Osadchuk, A.V.; Markel, A.L.; Khusainov, R.A.; Naumenko, E.V.; Beliaev, D.K. Problems in the genetics of stress. IV. A genetic analysis of the level of autonomic reactivity in emotional stress in rats. Sov. Genet. 1979, 15, 1847–1857. [Google Scholar]
- Plyusnina, I.; Oskina, I. Behavioral and adrenocortical responses to open-field test in rats selected for reduced aggressiveness toward humans. Physiol. Behav. 1997, 61, 381–385. [Google Scholar] [CrossRef]
- Sayers, E.W.; Beck, J.; Bolton, E.E.; Bourexis, D.; Brister, J.R.; Canese, K.; Comeau, D.C.; Funk, K.; Kim, S.; Klimke, W.; et al. Database resources of the National Center for Biotechnology Information. Nucleic. Acids. Res. 2021, 49, D10–D17. [Google Scholar] [CrossRef]
- Tian, L.; Chen, Y.; Wang, D.W.; Liu, X.H. Validation of reference genes via qRT-PCR in multiple conditions in brandt’s voles, lasiopodomys brandtii. Animals 2021, 11, 897. [Google Scholar] [CrossRef] [PubMed]
- Zamani, A.; Powell, K.L.; May, A.; Semple, B.D. Validation of reference genes for gene expression analysis following experimental traumatic brain injury in a pediatric mouse model. Brain. Res. Bull. 2020, 156, 43–49. [Google Scholar] [CrossRef] [PubMed]
- Penning, L.C.; Vrieling, H.E.; Brinkhof, B.; Riemers, F.M.; Rothuizen, J.; Rutteman, G.R.; Hazewinkel, H.A. A validation of 10 feline reference genes for gene expression measurements in snap-frozen tissues. Vet. Immunol. Immunopathol. 2007, 120, 212–222. [Google Scholar] [CrossRef] [PubMed]
- Bustin, S.A.; Benes, V.; Garson, J.A.; Hellemans, J.; Huggett, J.; Kubista, M.; Mueller, R.; Nolan, T.; Pfaffl, M.W.; Shipley, G.L.; et al. The MIQE guidelines: Minimum information for publication of quantitative real-time PCR experiments. Clin. Chem. 2009, 55, 611–622. [Google Scholar] [CrossRef]
- Hammer, O.; Harper, D.A.T.; Ryan, P.D. PAST: Paleontological statistics software package for education and data analysis. Palaeontol. Electron. 2001, 4, 1–9. [Google Scholar]
- Byman, E.; Nagga, K.; Gustavsson, A.M.; Andersson-Assarsson, J.; Hansson, O.; Sonestedt, E.; Wennstrom, M.; Netherlands Brain Bank. Alpha-amylase 1A copy number variants and the association with memory performance and Alzheimer’s dementia. Alzheimers. Res. Ther 2020, 12, 158. [Google Scholar] [CrossRef]
- Alzheimer’s Association. Alzheimer’s disease facts and figures. Alzheimers. Dement. 2021, 17, 327–406. [Google Scholar]
- Wu, J.; Wei, Y.; Li, T.; Lin, L.; Yang, Z.; Ye, L. DNA methylation-mediated lowly expressed AOX1 promotes cell migration and invasion of prostate cancer. Urol. Int. 2022, 9, e522634. [Google Scholar] [CrossRef]
- Freeland, J.; Crowell, P.D.; Giafaglione, J.M.; Boutros, P.C.; Goldstein, A.S. Aging of the progenitor cells that initiate prostate cancer. Cancer Lett. 2021, 515, 28–35. [Google Scholar] [CrossRef]
- Turnell, B.R.; Kumpitsch, L.; Reinhardt, K. Production and scavenging of reactive oxygen species both affect reproductive success in male and female Drosophila melanogaster. Biogerontology 2021, 22, 379–396. [Google Scholar] [CrossRef]
- Wang, C.Y.; Shahi, P.; Huang, J.T.; Phan, N.N.; Sun, Z.; Lin, Y.C.; Lai, M.D.; Werb, Z. Systematic analysis of the achaete-scute complex-like gene signature in clinical cancer patients. Mol. Clin. Oncol. 2017, 6, 7–18. [Google Scholar] [CrossRef] [PubMed]
- Sarkozy, C.; Salles, G.; Falandry, C. The biology of aging and lymphoma: A complex interplay. Curr. Oncol. Rep. 2015, 17, 32. [Google Scholar] [CrossRef] [PubMed]
- Hu, C.; Beebe, K.; Hernandez, E.J.; Lazaro-Guevara, J.M.; Revelo, M.P.; Huang, Y.; Maschek, J.A.; Cox, J.E.; Kohan, D.E. Multiomic identification of factors associated with progression to cystic kidney disease in mice with nephron Ift88 disruption. Am. J. Physiol. Renal. Physiol. 2022, 322, F175–F192. [Google Scholar] [CrossRef]
- Lenoir, O.; Tharaux, P.L.; Huber, T.B. Autophagy in kidney disease and aging: Lessons from rodent models. Kidney Int. 2016, 90, 950–964. [Google Scholar] [CrossRef] [PubMed]
- Khan, D.; Katoch, A.; Das, A.; Sharathchandra, A.; Lal, R.; Roy, P.; Das, S.; Chattopadhyay, S.; Das, S. Reversible induction of translational isoforms of p53 in glucose deprivation. Cell. Death. Differ. 2015, 22, 1203–1218. [Google Scholar] [CrossRef] [PubMed]
- Dent, E.; Wright, O.R.L.; Woo, J.; Hoogendijk, E.O. Malnutrition in older adults. Lancet 2023. [Google Scholar] [CrossRef]
- Perhal, A.; Wolf, S.; Jamous, Y.F.; Langer, A.; Abd Alla, J.; Quitterer, U. Increased reactive oxygen species generation contributes to the atherogenic activity of the B2 bradykinin receptor. Front. Med. 2019, 6, 32. [Google Scholar] [CrossRef]
- Zha, Y.; Zhuang, W.; Yang, Y.; Zhou, Y.; Li, H.; Liang, J. Senescence in vascular smooth muscle cells and atherosclerosis. Front. Cardiovasc. Med. 2022, 9, 910580. [Google Scholar] [CrossRef]
- Yang, Y.; Wang, J.; Shi, F.; Shan, A.; Xu, S.; Lv, W. BDKRB2 is a novel EMT-related biomarker and predicts poor survival in glioma. Aging 2021, 13, 7499–7516. [Google Scholar] [CrossRef]
- Kim, M.; Ladomersky, E.; Mozny, A.; Kocherginsky, M.; O’Shea, K.; Reinstein, Z.Z.; Zhai, L.; Bell, A.; Lauing, K.L.; Bollu, L.; et al. Glioblastoma as an age-related neurological disorder in adults. Neurooncol. Adv. 2021, 3, 125. [Google Scholar] [CrossRef]
- Shcherbina, L.; Edlund, A.; Esguerra, J.L.; Abels, M.; Zhou, Y.; Ottosson-Laakso, E.; Wollheim, C.B.; Hansson, O.; Eliasson, L.; Wierup, N. Endogenous beta-cell CART regulates insulin secretion and transcription of beta-cell genes. Mol. Cell. Endocrinol. 2017, 447, 52–60. [Google Scholar] [CrossRef] [PubMed]
- Aizawa, T. Alteration of insulin secretion in the elderly. Nihon. Rinsho. 2006, 64, 34–38. [Google Scholar] [PubMed]
- Abels, M.; Riva, M.; Shcherbina, L.; Fischer, A.T.; Banke, E.; Degerman, E.; Lindqvist, A.; Wierup, N. Overexpressed beta cell CART increases insulin secretion in mouse models of insulin resistance and diabetes. Peptides 2022, 151, 170747. [Google Scholar] [CrossRef] [PubMed]
- Shemtov, S.J.; Emani, R.; Bielska, O.; Covarrubias, A.J.; Verdin, E.; Andersen, J.K.; Winer, D.A. The intestinal immune system and gut barrier function in obesity and ageing. FEBS J. 2022. [Google Scholar] [CrossRef]
- Lu, J.; Chen, A.; Ma, X.; Shang, X.; Zhang, Y.; Guo, Y.; Liu, M.; Wang, X. Generation and characterization of cytochrome P450 2J3/10 CRISPR/Cas9 knockout rat model. Drug. Metab. Dispos. 2020, 48, 1129–1136. [Google Scholar] [CrossRef]
- Evangelista, E.A.; Aliwarga, T.; Sotoodehnia, N.; Jensen, P.N.; McKnight, B.; Lemaitre, R.N.; Totah, R.A.; Gharib, S.A. CYP2J2 modulates diverse transcriptional programs in adult human cardiomyocytes. Sci. Rep. 2020, 10, 5329. [Google Scholar] [CrossRef]
- Azam, T.; Zhang, H.; Zhou, F.; Wang, X. Recent advances on drug development and emerging therapeutic agents through targeting cellular homeostasis for ageing and cardiovascular disease. Front. Aging 2022, 3, 888190. [Google Scholar] [CrossRef]
- Huang, J.; Zhao, Q.; Li, M.; Duan, Q.; Zhao, Y.; Zhang, H. The effects of endothelium-specific CYP2J2 overexpression on the attenuation of retinal ganglion cell apoptosis in a glaucoma rat model. FASEB J. 2019, 33, 11194–11209. [Google Scholar] [CrossRef]
- Stelzer, G.; Rosen, N.; Plaschkes, I.; Zimmerman, S.; Twik, M.; Fishilevich, S.; Stein, T.I.; Nudel, R.; Lieder, I.; Mazor, Y.; et al. The GeneCards suite: From gene data mining to disease genome sequence analyses. Curr. Protoc. Bioinform. 2016, 54, 1.30.1–1.30.33. [Google Scholar] [CrossRef]
- Damour, A.; Garcia, M.; Seneschal, J.; Leveque, N.; Bodet, C. Eczema herpeticum: Clinical and pathophysiological aspects. Clin. Rev. Allergy. Immunol. 2020, 59, 1–18. [Google Scholar] [CrossRef]
- Shen, Z.Y.; Liu, W.; Bao, Z.X.; Zhou, Z.T.; Wang, L.Z. Oral melanotic macule and primary oral malignant melanoma: Epidemiology, location involved, and clinical implications. Oral. Surg. Oral. Med. Oral. Pathol. Oral. Radiol. Endod. 2011, 112, e21–e25. [Google Scholar] [CrossRef] [PubMed]
- Liu, R.; Zhang, Z.; Liu, H.; Hou, P.; Lang, J.; Wang, S.; Yan, H.; Li, P.; Huang, Z. Human β-defensin 2 is a novel opener of Ca2+-activated potassium channels and induces vasodilation and hypotension in monkeys. Hypertension 2013, 62, 415–425. [Google Scholar] [CrossRef] [PubMed]
- Aykut, B.; Ochs, M.; Radhakrishnan, P.; Brill, A.; Hocker, H.; Schwarz, S.; Weissinger, D.; Kehm, R.; Kulu, Y.; Ulrich, A.; et al. EMX2 gene expression predicts liver metastasis and survival in colorectal cancer. BMC Cancer 2017, 17, 555. [Google Scholar] [CrossRef] [PubMed]
- Kim, S.E.; Paik, H.Y.; Yoon, H.; Lee, J.E.; Kim, N.; Sung, M.K. Sex- and gender-specific disparities in colorectal cancer risk. World J. Gastroenterol. 2015, 21, 5167–5175. [Google Scholar] [CrossRef]
- Feng, Z.; Yin, Y.; Liu, B.; Zheng, Y.; Shi, D.; Zhang, H.; Qin, J. Prognostic and immunological role of FAT family genes in non-small cell lung cancer. Cancer Control. 2022, 29, 10732748221076682. [Google Scholar] [CrossRef]
- Hong, H.; Wang, Q.; Li, J.; Liu, H.; Meng, X.; Zhang, H. Aging, cancer and immunity. J. Cancer 2019, 10, 3021–3027. [Google Scholar] [CrossRef]
- Willcocks, L.C.; Carr, E.J.; Niederer, H.A.; Rayner, T.F.; Williams, T.N.; Yang, W.; Scott, J.A.; Urban, B.C.; Peshu, N.; Vyse, T.J.; et al. A defunctioning polymorphism in FCGR2B is associated with protection against malaria but susceptibility to systemic lupus erythematosus. Proc. Natl. Acad. Sci. USA 2010, 107, 7881–7885. [Google Scholar] [CrossRef]
- Liao, S.; Ning, Q.; Chen, Y.; Zhao, X.; Tang, S. Interaction of aging and immunosenescence: New therapeutic targets of aging. Int. Immunopharmacol. 2022, 113, 109397. [Google Scholar] [CrossRef]
- Wang, J.; Chen, S.; Xiao, W.; Li, W.; Wang, L.; Yang, S.; Wang, W.; Xu, L.; Liao, S.; Liu, W.; et al. CAR-T cells targeting CLL-1 as an approach to treat acute myeloid leukemia. J. Hematol. Oncol. 2018, 11, 7. [Google Scholar] [CrossRef]
- Mao, Y.; Xu, J.; Xu, X.; Qiu, J.; Hu, Z.; Jiang, F.; Zhou, G. Comprehensive analysis for cellular senescence-related immunogenic characteristics and immunotherapy prediction of acute myeloid leukemia. Front. Pharmacol. 2022, 13, 987398. [Google Scholar] [CrossRef]
- Shandilya, J.; Gao, Y.; Nayak, T.K.; Roberts, S.G.; Medler, K.F. AP1 transcription factors are required to maintain the peripheral taste system. Cell Death Dis. 2016, 7, e2433. [Google Scholar] [CrossRef]
- Wei, H.; Zhen, T.; Tuo, Y.; Li, H.; Liang, J.; Chen, S.; Shi, H.; Han, A. Clinicopathologic and molecular features of vascular tumors in a series of 118 cases. Am. J. Transl. Res. 2022, 14, 2939–2951. [Google Scholar] [PubMed]
- Zhang, W.; He, X.; Yin, H.; Cao, W.; Lin, T.; Chen, W.; Diao, W.; Ding, M.; Hu, H.; Mo, W.; et al. Allosteric activation of the metabolic enzyme GPD1 inhibits bladder cancer growth via the lysoPC-PAFR-TRPV2 axis. J. Hematol. Oncol. 2022, 15, 93. [Google Scholar] [CrossRef] [PubMed]
- Richters, A.; Aben, K.K.H.; Kiemeney, L.A.L.M. The global burden of urinary bladder cancer: An update. World. J. Urol. 2020, 38, 1895–1904. [Google Scholar] [CrossRef]
- Smith, J.R.; Hayman, G.T.; Wang, S.J.; Laulederkind, S.J.F.; Hoffman, M.J.; Kaldunski, M.L.; Tutaj, M.; Thota, J.; Nalabolu, H.S.; Ellanki, S.L.R.; et al. The Year of the Rat: The Rat Genome Database at 20: A multi-species knowledgebase and analysis platform. Nucleic Acids Res. 2020, 48, D731–D742. [Google Scholar] [CrossRef] [PubMed]
- Fallahzadeh, M.K.; Borhani Haghighi, A.; Namazi, M.R.; Fallahzadeh, M.H. Beta-thalassemia trait as a protective factor against Alzheimer disease. Alzheimer Dis. Assoc. Disord. 2009, 23, 186–187. [Google Scholar] [CrossRef]
- Derakhshani, A.; Safarpour, H.; Abdoli Shadbad, M.; Hemmat, N.; Leone, P.; Asadzadeh, Z.; Pashazadeh, M.; Baradaran, B.; Racanelli, V. The role of hemoglobin subunit delta in the immunopathy of multiple sclerosis: Mitochondria matters. Front. Immunol. 2021, 12, 709173. [Google Scholar] [CrossRef]
- Louapre, C.; Papeix, C.; Lubetzki, C.; Maillart, E. Multiple sclerosis and aging. Geriatr. Psychol. Neuropsychiatr. Vieil. 2017, 15, 402–408. [Google Scholar] [CrossRef]
- Park, H.K.; Cho, A.R.; Lee, S.C.; Ban, J.Y. MPTP-induced model of Parkinson’s disease in heat shock protein 70.1 knockout mice. Mol. Med. Rep. 2012, 5, 1465–1468. [Google Scholar]
- Tatar, M.; Khazaeli, A.A.; Curtsinger, J.W. Chaperoning extended life. Nature 1997, 390, 30. [Google Scholar] [CrossRef]
- Singh, R.; Kolvraa, S.; Rattan, S.I. Genetics of human longevity with emphasis on the relevance of HSP70 as candidate genes. Front. Biosci. 2007, 12, 4504–4513. [Google Scholar] [CrossRef] [PubMed]
- Li, Y.; Wang, J.; Gao, C.; Hu, Q.; Mao, X. Integral membrane protein 2A enhances sensitivity to chemotherapy via notch signaling pathway in cervical cancer. Bioengineered 2021, 12, 10183–10193. [Google Scholar] [CrossRef] [PubMed]
- Smith, A.J.B.; Beavis, A.L.; Rositch, A.F.; Levinson, K. Disparities in diagnosis and treatment of cervical adenocarcinoma compared with squamous cell carcinoma: An analysis of the national cancer database, 2004-2017. J. Low Genit. Tract. Dis. 2023, 27, 29–34. [Google Scholar] [CrossRef] [PubMed]
- Zhou, C.; Wang, M.; Yang, J.; Xiong, H.; Wang, Y.; Tang, J. Integral membrane protein 2A inhibits cell growth in human breast cancer via enhancing autophagy induction. Cell. Commun. Signal. 2019, 17, 105. [Google Scholar] [CrossRef] [PubMed]
- Kelm-Nelson, C.A.; Gammie, S. Gene expression within the periaqueductal gray is linked to vocal behavior and early-onset parkinsonism in Pink1 knockout rats. BMC Genom. 2020, 21, 625. [Google Scholar] [CrossRef] [PubMed]
- Chesnokova, A.Y.; Ekimova, I.V.; Pastukhov, Y.F. Parkinson’s disease and aging. Adv. Gerontol. 2018, 31, 668–678. [Google Scholar]
- Cebrat, M.; Strzadala, L.; Kisielow, P. Wnt inhibitory factor-1: A candidate for a new player in tumorigenesis of intestinal epithelial cells. Cancer Lett. 2004, 20, 107–113. [Google Scholar] [CrossRef]
- Kim, M.J.; Lee, E.J.; Kim, D.S.; Lee, D.H.; Youk, E.G.; Kim, H.J. Composite intestinal adenoma-microcarcinoid in the colon and rectum: A case series and historical review. Diagn. Pathol. 2017, 12, 78. [Google Scholar] [CrossRef]
- 139. Xu, Z.; Gu, Y.; Chen, J.; Chen, X.; Song, Y.; Fan, J.; Ji, X.; Li, Y.; Zhang, W.; Zhang, R. Epigenome-wide gene-age interaction study reveals reversed effects of MORN1 DNA methylation on survival between young and elderly oral squamous cell carcinoma patients. Front. Oncol. 2022, 12, 941731. [Google Scholar] [CrossRef]
- Ikawa, H.; Tonogi, M.; Yamane, G.Y.; Yamauchi, T.; Tanaka, Y.; Sato, M.; Matsui, J.; Ando, N.; Katakura, A. Upper gastrointestinal tract cancers as double-cancers in elderly patients with oral squamous cell carcinoma. Bull. Tokyo Dent. Coll. 2012, 53, 9–16. [Google Scholar] [CrossRef]
- Banszerus, V.L.; Konig, M.; Landmesser, U.; Vetter, V.M.; Demuth, I. Epigenetic aging in patients diagnosed with coronary artery disease: Results of the LipidCardio study. Clin. Epigenetics 2023, 15, 16. [Google Scholar] [CrossRef] [PubMed]
- Kocaman, S.A.; Cetin, M.; Durakoglugil, M.E.; Erdogan, T.; Canga, A.; Cicek, Y.; Dogan, S.; Sahin, I.; Satıroglu, O.; Bostan, M. The degree of premature hair graying as an independent risk marker for coronary artery disease: A predictor of biological age rather than chronological age. Anadolu Kardiyol. Derg. 2012, 12, 457–463. [Google Scholar] [CrossRef] [PubMed]
- Rozanski, A.; Takano, A.P.; Kato, P.N.; Soares, A.G.; Lellis-Santos, C.; Campos, J.C.; Ferreira, J.C.; Barreto-Chaves, M.L.; Moriscot, A.S. M-protein is down-regulated in cardiac hypertrophy driven by thyroid hormone in rats. Mol. Endocrinol. 2013, 27, 2055–2065. [Google Scholar] [CrossRef] [PubMed]
- Ashton, K.J.; Tupicoff, A.; Williams-Pritchard, G.; Kiessling, C.J.; See Hoe, L.E.; Headrick, J.P.; Peart, J.N. Unique transcriptional profile of sustained ligand-activated preconditioning in pre- and post-ischemic myocardium. PLoS ONE 2013, 8, e72278. [Google Scholar] [CrossRef]
- Villanueva, P.; Nudel, R.; Hoischen, A.; Fernandez, M.A.; Simpson, N.H.; Gilissen, C.; Reader, R.H.; Jara, L.; Echeverry, M.M.; Francks, C.; et al. Exome sequencing in an admixed isolated population indicates NFXL1 variants confer a risk for specific language impairment. PLoS Genet. 2015, 11, e1004925. [Google Scholar] [CrossRef]
- Martinez-Nicolas, I.; Llorente, T.E.; Martinez-Sanchez, F.; Meilan, J.J.G. Ten years of research on automatic voice and speech analysis of people with alzheimer’s disease and mild cognitive impairment: A systematic review article. Front. Psychol. 2021, 12, 620251. [Google Scholar] [CrossRef]
- Park, H.J.; Kim, M.K.; Kim, Y.; Kim, H.J.; Bae, S.K.; Bae, M.K. Neuromedin B modulates phosphate-induced vascular calcification. BMB Rep. 2021, 54, 569–574. [Google Scholar] [CrossRef]
- Wu, Y.Y.; Shan, S.K.; Lin, X.; Xu, F.; Zhong, J.Y.; Wu, F.; Duan, J.Y.; Guo, B.; Li, F.X.; Wang, Y.; et al. Cellular crosstalk in the vascular wall microenvironment: The role of exosomes in vascular calcification. Front. Cardiovasc. Med. 2022, 9, 912358. [Google Scholar] [CrossRef]
- Sokolov, D.; Sechrest, E.R.; Wang, Y.; Nevin, C.; Du, J.; Kolandaivelu, S. Nuclear NAD+-biosynthetic enzyme NMNAT1 facilitates development and early survival of retinal neurons. Elife 2021, 10, e71185. [Google Scholar] [CrossRef]
- Fleckenstein, M.; Keenan, T.D.L.; Guymer, R.H.; Chakravarthy, U.; Schmitz-Valckenberg, S.; Klaver, C.C.; Wong, W.T.; Chew, E.Y. Age-related macular degeneration. Nat. Rev. Dis. Primers 2021, 7, 31. [Google Scholar] [CrossRef]
- Zhang, Y.; Guo, X.; Peng, Z.; Liu, C.; Ren, L.; Liang, J.; Wang, P. Nicotinamide mononucleotide adenylyltransferase 1 regulates cerebral ischemia-induced blood-brain barrier disruption through NAD+/SIRT1 signaling pathway. Mol. Neurobiol. 2022, 59, 4879–4891. [Google Scholar] [CrossRef] [PubMed]
- Gallego, I.; Villate-Beitia, I.; Saenz-Del-Burgo, L.; Puras, G.; Pedraz, J.L. Therapeutic opportunities and delivery strategies for brain revascularization in stroke, neurodegeneration, and aging. Pharmacol Rev. 2022, 74, 439–461. [Google Scholar] [CrossRef] [PubMed]
- Friedrich, B.; Euler, P.; Ziegler, R.; Kuhn, A.; Landwehrmeyer, B.G.; Luthi-Carter, R.; Weiller, C.; Hellwig, S.; Zucker, B. Comparative analyses of Purkinje cell gene expression profiles reveal shared molecular abnormalities in models of different polyglutamine diseases. Brain Res. 2012, 1481, 37–48. [Google Scholar] [CrossRef] [PubMed]
- Pradhan, S.; Gao, R.; Bush, K.; Zhang, N.; Wairkar, Y.P.; Sarkar, P.S. Polyglutamine expansion in huntingtin and mechanism of DNA damage repair defects in Huntington’s disease. Front. Cell. Neurosci. 2022, 16, 837576. [Google Scholar] [CrossRef] [PubMed]
- Goswami, J.; Martin, L.A.; Goldowitz, D.; Beitz, A.J.; Feddersen, R.M. Enhanced Purkinje cell survival but compromised cerebellar function in targeted anti-apoptotic protein transgenic mice. Mol. Cell. Neurosci. 2005, 29, 202–221. [Google Scholar] [CrossRef]
- Chen, T.Y.; Yang, C.Y.; Yang, M.T.; Kuo, T.F.; Chang, C.L.; Chen, C.L.; Lee, T.H.; Yang, G.; Yang, W.C.; Chiu, C.F.; et al. Protein disulfide isomerase a4 promotes lung cancer development via the Stat3 pathway in stromal cells. Clin. Transl. Med. 2022, 12, e606. [Google Scholar] [CrossRef]
- Li, H.; Liu, Q.; Xiao, K.; He, Z.; Wu, C.; Sun, J.; Chen, X.; Chen, S.; Yang, J.; Ma, Q.; et al. PDIA4 correlates with poor prognosis and is a potential biomarker in glioma. Oncol. Targets Ther. 2021, 14, 125–138. [Google Scholar] [CrossRef]
- Menard, C.; Tse, Y.C.; Cavanagh, C.; Chabot, J.G.; Herzog, H.; Schwarzer, C.; Wong, T.P.; Quirion, R. Knockdown of prodynorphin gene prevents cognitive decline, reduces anxiety, and rescues loss of group 1 metabotropic glutamate receptor function in aging. J. Neurosci. 2013, 33, 12792–12804. [Google Scholar] [CrossRef]
- Miki, Y.; Kidoguchi, Y.; Sato, M.; Taketomi, Y.; Taya, C.; Muramatsu, K.; Gelb, M.H.; Yamamoto, K.; Murakami, M. Dual roles of group iid phospholipase A2 in inflammation and cancer. J. Biol. Chem. 2016, 291, 15588–155601. [Google Scholar] [CrossRef]
- Ter Haar, E.L.M.; Thomas, S.E.; van den Reek, J.M.P.A.; Otero, M.E.; Njoo, M.D.; Ossenkoppele, P.M.; Kop, E.N.; Dodemont, S.R.P.; Korver, J.E.M.; Kuijpers, A.L.A.; et al. Drug survival, safety, and effectiveness of biologics in older patients with psoriasis: A comparison with younger patients-a BioCAPTURE registry study. Drugs Aging 2022, 39, 715–727. [Google Scholar] [CrossRef]
- Tan, J.; Xu, Y.; Han, F.; Ye, X. Genetical modification on adipose-derived stem cells facilitates facial nerve regeneration. Aging 2019, 11, 908–920. [Google Scholar] [CrossRef] [PubMed]
- Zhang, Q.; Li, J.; Weng, L. Identification and validation of aging-related genes in Alzheimer’s disease. Front. Neurosci. 2022, 16, 905722. [Google Scholar] [CrossRef] [PubMed]
- Cheng, C.W.; Chang, L.C.; Tseng, T.L.; Wu, C.C.; Lin, Y.F.; Chen, J.S. Phosphotriesterase-related protein sensed albuminuria and conferred renal tubular cell activation in membranous nephropathy. J. Biomed. Sci. 2014, 21, 32. [Google Scholar] [CrossRef] [PubMed]
- Deegens, J.K.; Wetzels, J.F. Membranous nephropathy in the older adult: Epidemiology, diagnosis and management. Drugs Aging 2007, 24, 717–732. [Google Scholar] [CrossRef]
- Wu, S.; Zhao, Z.; Liu, S.; Li, M.; Wang, T.; Wang, S.; Xu, M.; Chen, Y.; Dai, M.; Zhang, D.; et al. The association between age at diagnosis of type 2 diabetes and albuminuria in Chinese adults: A nationwide population study. J. Diabetes 2021, 13, 987–997. [Google Scholar] [CrossRef]
- Liu, Q.; Li, J.; Zhang, W.; Xiao, C.; Zhang, S.; Nian, C.; Li, J.; Su, D.; Chen, L.; Zhao, Q.; et al. Glycogen accumulation and phase separation drives liver tumor initiation. Cell 2021, 184, 5559–5576.e19. [Google Scholar] [CrossRef]
- Gusarov, I.; Nudler, E. Glycogen at the crossroad of stress resistance, energy maintenance, and pathophysiology of aging. Bioessays 2018, 40, e1800033. [Google Scholar] [CrossRef]
- Zhao, C.Y.; Hua, C.H.; Li, C.H.; Zheng, R.Z.; Li, X.Y. High PYGL expression predicts poor prognosis in human gliomas. Front. Neurol. 2021, 12, 652931. [Google Scholar] [CrossRef]
- Hafez, A.M.; Seleem, M.M.; Alattar, A.Z.; Elshorbagy, S.; Elsayed, W.S.H. RNA-binding proteins RBM-HuR, RBM3 and PODXL expression in urothelial carcinoma of the urinary bladder. prognostic and clinical implications. Contemp. Oncol. 2021, 25, 279–290. [Google Scholar] [CrossRef]
- Hamade, A.; Li, D.; Tyryshkin, K.; Xu, M.; Conseil, G.; Yolmo, P.; Hamilton, J.; Chenard, S.; Robert Siemens, D.; Koti, M. Sex differences in the aging murine urinary bladder and influence on the tumor immune microenvironment of a carcinogen-induced model of bladder cancer. Biol. Sex Differ. 2022, 13, 19. [Google Scholar] [CrossRef]
- Schupp, M.; Lefterova, M.I.; Janke, J.; Leitner, K.; Cristancho, A.G.; Mullican, S.E.; Qatanani, M.; Szwergold, N.; Steger, D.J.; Curtin, J.C.; et al. Retinol saturase promotes adipogenesis and is downregulated in obesity. Proc. Natl. Acad. Sci. USA 2009, 106, 1105–1110. [Google Scholar] [CrossRef]
- Santos, A.L.; Sinha, S. Obesity and aging: Molecular mechanisms and therapeutic approaches. Ageing Res. Rev. 2021, 67, 101268. [Google Scholar] [CrossRef]
- Jiang, X.; He, Y.; Shen, Q.; Duan, L.; Yuan, Y.; Tang, L.; Shi, Y.; Liu, B.; Zhai, H.; Shi, P.; et al. RETSAT mutation selected for hypoxia adaptation inhibits tumor growth. Front. Cell Dev. Biol. 2021, 9, 744992. [Google Scholar] [CrossRef]
- Kim, K.; Kim, Y.J. RhoBTB3 regulates proliferation and invasion of breast cancer cells via Col1a1. Mol. Cells 2022, 45, 631–639. [Google Scholar] [CrossRef]
- Yang, S.H.; Liu, W.; Peng, J.; Xu, Y.J.; Liu, Y.F.; Li, Y.; Peng, M.Y.; Ou-Yang, Z.; Chen, C.; Liu, E.Y. High expression of RhoBTB3 predicts favorable chemothrapy outcomes in non-M3 acute myeloid leukemia. J. Cancer 2021, 12, 4229–4239. [Google Scholar] [CrossRef]
- Zjablovskaja, P.; Florian, M.C. Acute myeloid leukemia: Aging and epigenetics. Cancers 2019, 12, 103. [Google Scholar] [CrossRef]
- Samuel, C.S.; Unemori, E.N.; Mookerjee, I.; Bathgate, R.A.; Layfield, S.L.; Mak, J.; Tregear, G.W.; Du, X.J. Relaxin modulates cardiac fibroblast proliferation, differentiation, and collagen production and reverses cardiac fibrosis in vivo. Endocrinology 2004, 145, 4125–4133. [Google Scholar] [CrossRef]
- Leysen, H.; Walter, D.; Clauwaert, L.; Hellemans, L.; van Gastel, J.; Vasudevan, L.; Martin, B.; Maudsley, S. The relaxin-3 receptor, RXFP3, is a modulator of aging-related disease. Int. J. Mol. Sci. 2022, 23, 4387. [Google Scholar] [CrossRef]
- Chou, C.K.; Fan, C.C.; Lin, P.S.; Liao, P.Y.; Tung, J.C.; Hsieh, C.H.; Hung, M.C.; Chen, C.H.; Chang, W.C. Sciellin mediates mesenchymal-to-epithelial transition in colorectal cancer hepatic metastasis. Oncotarget 2016, 7, 25742–25754. [Google Scholar] [CrossRef]
- Yamadera, M.; Shinto, E.; Nagata, K.; Shiraishi, T.; Kajiwara, Y.; Mochizuki, S.; Okamoto, K.; Kishi, Y.; Ueno, H. Proposal for a tumor budding predictive score derived from endoscopic biopsy samples in colorectal cancer. Int. J. Clin. Oncol. 2022, 27, 756–764. [Google Scholar] [CrossRef]
- Dekker, E.; Tanis, P.J.; Vleugels, J.L.A.; Kasi, P.M.; Wallace, M.B. Colorectal cancer. Lancet. 2019, 394, 1467–1480. [Google Scholar] [CrossRef]
- Yang, J.Y.; Deng, X.Y.; Li, Y.S.; Ma, X.C.; Feng, J.X.; Yu, B.; Chen, Y.; Luo, Y.L.; Wang, X.; Chen, M.L.; et al. Structure of Schlafen13 reveals a new class of tRNA/rRNA- targeting RNase engaged in translational control. Nat. Commun. 2018, 9, 1165. [Google Scholar] [CrossRef]
- Crouch, J.; Shvedova, M.; Thanapaul, R.J.R.S.; Botchkarev, V.; Roh, D. Epigenetic regulation of cellular senescence. Cells. 2022, 11, 672. [Google Scholar] [CrossRef]
- Wang, Q.; Zhou, D.; Wu, F.; Liang, Q.; He, Q.; Peng, M.; Yao, T.; Hu, Y.; Qian, B.; Tang, J.; et al. Immune microenvironment signatures as biomarkers to predict early recurrence of stage ia-b lung cancer. Front. Oncol. 2021, 11, 680287. [Google Scholar] [CrossRef]
- Schneider, J.L.; Rowe, J.H.; Garcia-de-Alba, C.; Kim, C.F.; Sharpe, A.H.; Haigis, M.C. The aging lung: Physiology, disease, and immunity. Cell 2021, 184, 1990–2019. [Google Scholar] [CrossRef]
- Borowicz, S.; Principe, D.R.; Dorman, M.J.; McHenry, A.J.; Sondarva, G.; Kumar, S.; Ananthanarayanan, V.; Simms, P.E.; Hess, A.; Rana, A. HAI-1 is an independent predictor of lung cancer mortality and is required for M1 macrophage polarization. PLoS ONE 2021, 16, e0252197. [Google Scholar] [CrossRef]
- Wu, Q.; Yin, G.; Luo, J.; Zhang, Y.; Ai, T.; Tian, J.; Jin, Y.; Lei, J.; Liu, S. Comprehensive analysis of the expression and prognostic value of SPINT1/2 in breast carcinoma. Front. Endocrinol. 2021, 12, 665666. [Google Scholar] [CrossRef]
- Marongiu, F.; DeGregori, J. The sculpting of somatic mutational landscapes by evolutionary forces and their impacts on aging-related disease. Mol. Oncol. 2022, 16, 3238–3258. [Google Scholar] [CrossRef]
- Wei, B.; Lu, Y.; Jin, J.P. Deficiency of slow skeletal muscle troponin T causes atrophy of type I slow fibres and decreases tolerance to fatigue. J. Physiol. 2014, 592, 1367–1380. [Google Scholar] [CrossRef]
- Angioni, D.; Virecoulon Giudici, K.; Montoya Martinez, M.; Rolland, Y.; Vellas, B.; de Souto Barreto, P. Neuroimaging markers of chronic fatigue in older people: A narrative review. Aging Clin. Exp. Res. 2021, 33, 1487–1492. [Google Scholar] [CrossRef]
- Fei, X.; Kong, L.; Shi, C.; Wang, G.; Liu, C.; Wang, C.; Liu, P.; Tan, X. Identification of prognosis-related molecular subgroups and construction of a prognostic prediction model using immune-related genes in pancreatic cancer. J. Oncol. 2022, 2022, 7117014. [Google Scholar] [CrossRef]
- Yin, M.Y.; Xi, L.T.; Liu, L.; Zhu, J.Z.; Qian, L.J.; Xu, C.F. Pancreatic cancer incidence and mortality patterns in 2006–2015 and prediction of the epidemiological trend to 2025 in China. World J. Clin. Cases 2022, 10, 4404–4413. [Google Scholar] [CrossRef]
- Saul, D.; Geisberg, L.K.; Gehle, T.; Hoffmann, D.B.; Tezval, M.; Sehmisch, S.; Komrakova, M. Changes in musculoskeletal system and metabolism in osteoporotic rats treated with urocortin. Front. Endocrinol. 2019, 10, 400. [Google Scholar] [CrossRef]
- Latchman, D.S. Urocortin. Int. J. Biochem. Cell Biol. 2002, 34, 907–910. [Google Scholar] [CrossRef]
- Laurence, H.; Kumar, S.; Owston, M.A.; Lanford, R.E.; Hubbard, G.B.; Dick, E.J., Jr. Natural mortality and cause of death analysis of the captive chimpanzee (Pan troglodytes): A 35-year review. J. Med. Primatol. 2017, 46, 106–115. [Google Scholar] [CrossRef]
- Che, J.; Jin, Z.; Yan, F.; You, J.; Xie, J.; Chen, B.; Cheng, G.; Zhu, H.; He, Q.; Hu, Y.; et al. Discovery of 5,6-Bis(4-methoxy-3-methylphenyl)pyridin-2-amine as a WSB1 degrader to inhibit cancer cell metastasis. J. Med. Chem. 2021, 64, 8621–8643. [Google Scholar] [CrossRef]
- Fane, M.; Weeraratna, A.T. Normal aging and its role in cancer metastasis. Cold Spring Harb. Perspect. Med. 2020, 10, a037341. [Google Scholar] [CrossRef]
- Kim, J.J.; Lee, S.B.; Yi, S.Y.; Han, S.A.; Kim, S.H.; Lee, J.M.; Tong, S.Y.; Yin, P.; Gao, B.; Zhang, J.; et al. WSB1 overcomes oncogene-induced senescence by targeting ATM for degradation. Cell Res. 2017, 27, 274–293. [Google Scholar] [CrossRef]
- Wang, J.; Li, Z.; Xu, L.; Yang, H.; Liu, W. Transmembrane domain dependent inhibitory function of FcγRIIB. Protein Cell 2018, 9, 1004–1012. [Google Scholar] [CrossRef]
- Morand, S.; McIntyre, K.M.; Baylis, M. Domesticated animals and human infectious diseases of zoonotic origins: Domestication time matters. Infect. Genet. Evol. 2014, 24, 76–81. [Google Scholar] [CrossRef]
- Zhang, X.; Jamwal, K.; Distl, O. Tracking footprints of artificial and natural selection signatures in breeding and non-breeding cats. Sci. Rep. 2022, 12, 18061. [Google Scholar] [CrossRef]
- Theofanopoulou, C.; Gastaldon, S.; O’Rourke, T.; Samuels, B.D.; Martins, P.T.; Delogu, F.; Alamri, S.; Boeckx, C. Self-domestication in Homo sapiens: Insights from comparative genomics. PLoS ONE 2017, 12, e0185306. [Google Scholar] [CrossRef]
- Del Savio, L.; Mameli, M. Human domestication and the roles of human agency in human evolution. Hist. Philos. Life Sci. 2020, 42, 21. [Google Scholar] [CrossRef]
- Chadaeva, I.; Ponomarenko, P.; Kozhemyakina, R.; Suslov, V.; Bogomolov, A.; Klimova, N.; Shikhevich, S.; Savinkova, L.; Oshchepkov, D.; Kolchanov, N.A.; et al. Domestication explains two-thirds of differential-gene-expression variance between domestic and wild animals; the remaining one-third reflects intraspecific and interspecific variation. Animals 2021, 11, 2667. [Google Scholar] [CrossRef]
- Albert, F.W.; Somel, M.; Carneiro, M.; Aximu-Petri, A.; Halbwax, M.; Thalmann, O.; Blanco-Aguiar, J.A.; Plyusnina, I.Z.; Trut, L.; Villafuerte, R.; et al. A comparison of brain gene expression levels in domesticated and wild animals. PLoS Genet. 2012, 8, e1002962. [Google Scholar] [CrossRef]
- Sato, D.X.; Rafati, N.; Ring, H.; Younis, S.; Feng, C.; Blanco-Aguiar, J.A.; Rubin, C.J.; Villafuerte, R.; Hallbook, F.; Carneiro, M.; et al. Brain transcriptomics of wild and domestic rabbits suggests that changes in dopamine signaling and ciliary function contributed to evolution of tameness. Genome Biol. Evol. 2020, 12, 1918–1928. [Google Scholar] [CrossRef]
- Yang, X.; Zhang, H.; Shang, J.; Liu, G.; Xia, T.; Zhao, C.; Sun, G.; Dou, H. Comparative analysis of the blood transcriptomes between wolves and dogs. Anim. Genet. 2018, 49, 291–302. [Google Scholar] [CrossRef]
- Hekman, J.P.; Johnson, J.L.; Edwards, W.; Vladimirova, A.V.; Gulevich, R.G.; Ford, A.L.; Kharlamova, A.V.; Herbeck, Y.; Acland, G.M.; Raetzman, L.T.; et al. Anterior pituitary transcriptome suggests differences in ACTH release in tame and aggressive foxes. Genes Genomes Genet. 2018, 8, 859–873. [Google Scholar] [CrossRef]
- Long, K.; Mao, K.; Che, T.; Zhang, J.; Qiu, W.; Wang, Y.; Tang, Q.; Ma, J.; Li, M.; Li, X. Transcriptome differences in frontal cortex between wild boar and domesticated pig. Anim. Sci. J. 2018, 89, 848–857. [Google Scholar] [CrossRef]
- Yang, Y.; Adeola, A.C.; Xie, H.B.; Zhang, Y.P. Genomic and transcriptomic analyses reveal selection of genes for puberty in Bama Xiang pigs. Zool. Res. 2018, 39, 424–430. [Google Scholar]
- Fallahshahroudi, A.; Lotvedt, P.; Belteky, J.; Altimiras, J.; Jensen, P. Changes in pituitary gene expression may underlie multiple domesticated traits in chickens. Hered. Edinb. 2019, 122, 195–204. [Google Scholar] [CrossRef] [PubMed]
- Samet, H. A top-down quadtree traversal algorithm. IEEE. Trans. Pattern. Anal. Mach. Intell. 1985, 7, 94–98. [Google Scholar] [CrossRef] [PubMed]
- Sun, G.-L.; Shen, W.; Wen, J.-F. Triosephosphate Isomerase Genes in Two Trophic Modes of Euglenoids (Euglenophyceae) and Their Phylogenetic Analysis. J. Eukaryot. Microbiol. 2008, 55, 170–177. [Google Scholar] [CrossRef]
- Morozova, O.V.; Alekseeva, A.E.; Sashina, T.A.; Brusnigina, N.F.; Epifanova, N.V.; Kashnikov, A.U.; Zverev, V.V.; Novikova, N.A. Phylodynamics of G4P [8] and G2P[4] strains of rotavirus A isolated in Russia in 2017 based on full-genome analyses. Virus Genes 2020, 56, 537–545. [Google Scholar] [CrossRef]
- Hakizimana, J.N.; Yona, C.; Kamana, O.; Nauwynck, H.; Misinzo, G. African Swine Fever Virus Circulation between Tanzania and Neighboring Countries: A Systematic Review and Meta-Analysis. Viruses 2021, 13, 306. [Google Scholar] [CrossRef]
- Zhang, Y.; Katoh, T.K.; Finet, C.; Izumitani, H.F.; Toda, M.J.; Watabe, H.-A.; Katoh, T. Phylogeny and evolution of mycophagy in the Zygothrica genus group (Diptera: Drosophilidae). Mol. Phylogenetics Evol. 2021, 163, 107257. [Google Scholar] [CrossRef]
- Clarke, L.E.; Liddelow, S.A.; Chakraborty, C.; Munch, A.E.; Heiman, M.; Barres, B.A. Normal aging induces A1-like astrocyte reactivity. Proc. Natl. Acad. Sci. USA 2018, 115, E1896–E1905. [Google Scholar] [CrossRef]
- Day, I.N. dbSNP in the detail and copy number complexities. Hum. Mutat. 2010, 31, 2–4. [Google Scholar] [CrossRef]
- Ponomarenko, M.; Rasskazov, D.; Arkova, O.; Ponomarenko, P.; Suslov, V.; Savinkova, L.; Kolchanov, N. How to use SNP_TATA_Comparator to find a significant change in gene expression caused by the regulatory SNP of this gene’s promoter via a change in affinity of the TATA-binding protein for this promoter. Biomed. Res. Int. 2015, 2015, 359835. [Google Scholar] [CrossRef]
- Rasskazov, D.; Chadaeva, I.; Sharypova, E.; Zolotareva, K.; Khandaev, B.; Ponomarenko, P.; Podkolodnyy, N.; Tverdokhleb, N.; Vishnevsky, O.; Bogomolov, A.; et al. Plant_SNP_TATA_Z-Tester: A Web Service that unequivocally estimates the impact of proximal promoter mutations on plant gene expression. Int. J. Mol. Sci. 2022, 23, 8684. [Google Scholar] [CrossRef]
- Korkuc, P.; Schippers, J.H.; Walther, D. Characterization and identification of cis-regulatory elements in Arabidopsis based on single-nucleotide polymorphism information. Plant Physiol. 2014, 164, 181–200. [Google Scholar] [CrossRef]
- Klimova, N.V.; Oshchepkova, E.; Chadaeva, I.; Sharypova, E.; Ponomarenko, P.; Drachkova, I.; Rasskazov, D.; Oshchepkov, D.; Ponomarenko, M.; Savinkova, L.; et al. Disruptive selection of human immunostimulatory and immunosuppressive genes both provokes and prevents rheumatoid arthritis, respectively, as a self-domestication syndrome. Front. Genet. 2021, 12, 610774. [Google Scholar] [CrossRef]
- Vasiliev, G.; Chadaeva, I.; Rasskazov, D.; Ponomarenko, P.; Sharypova, E.; Drachkova, I.; Bogomolov, A.; Savinkova, L.; Ponomarenko, M.; Kolchanov, N.; et al. A bioinformatics model of human diseases on the basis of differentially expressed genes (of domestic versus wild animals) that are orthologs of human genes associated with reproductive-potential changes. Int. J. Mol. Sci. 2021, 22, 2346. [Google Scholar] [CrossRef]
- Ponomarenko, M.P.; Chadaeva, I.V.; Ponomarenko, P.M.; Bogomolov, A.G.; Oshchepkov, D.Y.; Sharypova, E.B.; Suslov, V.V.; Osadchuk, A.V.; Osadchuk, L.V.; Matushkin, Y.G. A bioinformatic search for correspondence between differentially expressed genes of domestic versus wild animals and orthologous human genes altering reproductive potential. Vavilovskii Zhurnal Genet. Selektsii 2022, 26, 96–108. [Google Scholar] [CrossRef]
- Barrett, T.; Wilhite, S.E.; Ledoux, P.; Evangelista, C.; Kim, I.F.; Tomashevsky, M.; Marshall, K.A.; Phillippy, K.H.; Sherman, P.M.; Holko, M.; et al. NCBI GEO: Archive for functional genomics data sets-update. Nucleic Acids Res. 2013, 41, D991–D995. [Google Scholar] [CrossRef]
- Ye, Q.; Huang, Z.; Lu, W.; Yan, F.; Zeng, W.; Xie, J.; Zhong, W. Identification of the common differentially expressed genes and pathogenesis between neuropathic pain and aging. Front. Neurosci. 2022, 16, 994575. [Google Scholar] [CrossRef]
- Ivanisenko, V.A.; Demenkov, P.S.; Ivanisenko, T.V.; Mishchenko, E.L.; Saik, O.V. A new version of the ANDSystem tool for automatic extraction of knowledge from scientific publications with expanded functionality for reconstruction of associative gene networks by considering tissue-specific gene expression. BMC Bioinformatics. 2019, 20, 34. [Google Scholar] [CrossRef]
- Rappaport, N.; Twik, M.; Plaschkes, I.; Nudel, R.; Iny Stein, T.; Levitt, J.; Gershoni, M.; Morrey, C.P.; Safran, M.; Lancet, D. MalaCards: An amalgamated human disease compendium with diverse clinical and genetic annotation and structured search. Nucleic Acids Res. 2017, 45, D877–D887. [Google Scholar] [CrossRef]
- Mustafin, Z.S.; Lashin, S.A.; Matushkin, Y.G.; Gunbin, K.V.; Afonnikov, D.A. Orthoscape: A cytoscape application for grouping and visualization KEGG based gene networks by taxonomy and homology principles. BMC Bioinformatics 2017, 18, 1427. [Google Scholar] [CrossRef]
- Mustafin, Z.S.; Zamyatin, V.I.; Konstantinov, D.K.; Doroshkov, A.V.; Lashin, S.A.; Afonnikov, D.A. Phylostratigraphic analysis shows the earliest origination of the abiotic stress associated genes in A. thaliana. Genes 2019, 10, 963. [Google Scholar] [CrossRef]
- Shannon, P.; Markiel, A.; Ozier, O.; Baliga, N.S.; Wang, J.T.; Ramage, D.; Amin, N.; Schwikowski, B.; Ideker, T. Cytoscape: A software environment for integrated models of biomolecular interaction networks. Genome Res. 2003, 13, 2498–2504. [Google Scholar] [CrossRef] [PubMed]
- Altschul, S.F.; Gish, W.; Miller, W.; Myers, E.W.; Lipman, D.J. Basic local alignment search tool. J. Mol. Biol. 1990, 215, 403–410. [Google Scholar] [CrossRef] [PubMed]
- Guilliams, M.; Bruhns, P.; Saeys, Y.; Hammad, H.; Lambrecht, B.N. The function of Fcγ receptors in dendritic cells and macrophages. Nat. Rev. Immunol. 2014, 14, 94–108. [Google Scholar] [CrossRef] [PubMed]
- Okabe, Y.; Medzhitov, R. Tissue biology perspective on macrophages. Nat. Immunol. 2016, 17, 9–17. [Google Scholar] [CrossRef] [PubMed]
- Safran, M.; Rosen, N.; Twik, M.; BarShir, R.; Iny Stein, T.; Dahary, D.; Fishilevich, S.; Lancet, D. The GeneCards Suite. In Practical Guide to Life Science Databases; Abugessaisa, I., Kasukawa, T., Eds.; Springer: Singapore, 2022; pp. 27–56. [Google Scholar] [CrossRef]
- Zhang, L.; Pitcher, L.E.; Yousefzadeh, M.J.; Niedernhofer, L.J.; Robbins, P.D.; Zhu, Y. Cellular senescence: A key therapeutic target in aging and diseases. J. Clin. Investig. 2022, 132, e158450. [Google Scholar] [CrossRef] [PubMed]
- Bleve, A.; Motta, F.; Durante, B.; Pandolfo, C.; Selmi, C.; Sica, A. Immunosenescence, inflammaging, and frailty: Role of myeloid cells in age-related diseases. Clin. Rev. Allergy Immunol. 2022, 22, e8909–e9107. [Google Scholar] [CrossRef]
- Naumenko, E.; Popova, N.; Nikulina, E.; Dygalo, N.; Shishkina, G.; Borodin, P.; Markel, A. Behavior, adrenocortical activity, and brain monoamines in Norway rats selected for reduced aggressiveness towards man. Pharmacol. Biochem. Behav. 1989, 33, 85–91. [Google Scholar] [CrossRef]
- Paxinos, G.; Watson, C.R. The Rat Brain in Stereotaxic Coordinates, 7th ed.; Academic Press: London, UK, 2013; p. 472. [Google Scholar]
- Bolger, A.M.; Lohse, M.; Usadel, B. Trimmomatic: A flexible trimmer for Illumina sequence data. Bioinformatics 2014, 30, 2114–2120. [Google Scholar] [CrossRef]
- Kim, D.; Pertea, G.; Trapnell, C.; Pimentel, H.; Kelley, R.; Salzberg, S.L. TopHat2: Accurate alignment of transcriptomes in the presence of insertions, deletions and gene fusions. Genom. Biol. 2013, 14, 36. [Google Scholar] [CrossRef]
- Li, H.; Handsaker, B.; Wysoker, A.; Fennell, T.; Ruan, J.; Homer, N.; Marth, G.; Abecasis, G.; Durbin, R. The Sequence alignment/map (SAM) format and SAMtools. Bioinform. 2009, 25, 2078–2079. [Google Scholar] [CrossRef]
- Anders, S.; Pyl, P.T.; Huber, W. HTSeq—A Python framework to work with high-throughput sequencing data. Bioinformatics 2015, 31, 166–169. [Google Scholar] [CrossRef] [PubMed]
- Love, M.I.; Huber, W.; Anders, S. Moderated estimation of fold change and dispersion for RNA-seq data with DESeq2. Genome Biol. 2014, 15, 550. [Google Scholar] [CrossRef] [PubMed]
- Anders, S.; Huber, W. Differential expression analysis for sequence count data. Genom. Biol. 2010, 11, 106. [Google Scholar] [CrossRef] [PubMed]
- Ye, J.; Coulouris, G.; Zaretskaya, I.; Cutcutache, I.; Rozen, S.; Madden, T.L. Primer-BLAST: A tool to design target-specific primers for polymerase chain reaction. BMC Bioinform. 2012, 13, 134. [Google Scholar] [CrossRef]
- Zerbino, D.; Wilder, S.; Johnson, N.; Juettemann, T.; Flicek, P. The Ensembl regulatory build. Genom. Biol. 2015, 16, 56. [Google Scholar] [CrossRef]
- Haeussler, M.; Raney, B.; Hinrichs, A.; Clawson, H.; Zweig, A.; Karolchik, D.; Casper, J.; Speir, M.; Haussler, D.; Kent, W. Navigating protected genomics data with UCSC Genome Browser in a box. Bioinformatics 2015, 31, 764–766. [Google Scholar] [CrossRef]
- Stajich, J.E.; Block, D.; Boulez, K.; Brenner, S.E.; Chervitz, S.A.; Dagdigian, C.; Fuellen, G.; Gilbert, J.G.; Korf, I.; Lapp, H.; et al. The Bioperl toolkit: Perl modules for the life sciences. Genom. Res. 2002, 12, 1611–1618. [Google Scholar] [CrossRef]
- Hahn, S.; Buratowski, S.; Sharp, P.; Guarente, L. Yeast TATA-binding protein TFIID binds to TATA elements with both consensus and nonconsensus DNA sequences. Proc. Natl. Acad. Sci. USA 1989, 86, 5718–5722. [Google Scholar] [CrossRef]
- Ponomarenko, P.; Savinkova, L.; Drachkova, I.; Lysova, M.; Arshinova, T.; Ponomarenko, M.; Kolchanov, N. A step-by-step model of TBP/TATA box binding allows predicting human hereditary diseases by single nucleotide polymorphism. Dokl. Biochem. Biophys. 2008, 419, 88–92. [Google Scholar] [CrossRef]
- Bucher, P. Weight matrix descriptions of four eukaryotic RNA polymerase II promoter elements derived from 502 unrelated promoter sequences. J. Mol. Biol. 1990, 212, 563–578. [Google Scholar] [CrossRef]
- Karas, H.; Knuppel, R.; Schulz, W.; Sklenar, H.; Wingender, E. Combining structural analysis of DNA with search routines for the detection of transcription regulatory elements. Comput. Appli. Biosci. 1996, 12, 441–446. [Google Scholar] [CrossRef] [PubMed]
- Ponomarenko, M.; Ponomarenko, J.; Frolov, A.; Podkolodny, N.; Savinkova, L.; Kolchanov, N.; Overton, G. Identification of sequence-dependent features correlating to activity of DNA sites interacting with proteins. Bioinformatics 1999, 15, 687–703. [Google Scholar] [CrossRef]
- Waardenberg, A.; Basset, S.; Bouveret, R.; Harvey, R. CompGO: An R package for comparing and visualizing Gene Ontology enrichment differences between DNA binding experiments. BMC Bioinform. 2015, 16, 275. [Google Scholar] [CrossRef] [PubMed]
- Varzari, A.; Tudor, E.; Bodrug, N.; Corloteanu, A.; Axentii, E.; Deyneko, I.V. Age-specific association of CCL5 gene polymorphism with pulmonary tuberculosis: A case-control study. Genet. Test. Mol. Biomarkers 2018, 22, 281–287. [Google Scholar] [CrossRef] [PubMed]
- Coleman, R.A.; Pugh, B.F. Evidence for functional binding and stable sliding of the TATA binding protein on nonspecific DNA. J. Biol. Chem. 1995, 270, 13850–13859. [Google Scholar] [CrossRef] [PubMed]
- Berg, O.G.; von Hippel, P.H. Selection of DNA binding sites by regulatory proteins. Statistical-mechanical theory and application to operators and promoters. J. Mol. Biol. 1987, 193, 723–750. [Google Scholar] [CrossRef] [PubMed]
- Flatters, D.; Lavery, R. Sequence-dependent dynamics of TATA-box binding sites. Biophys. J. 1998, 75, 372–381. [Google Scholar] [CrossRef]
- Kim, J.L.; Nikolov, D.B.; Burley, S.K. Co-crystal structure of TBP recognizing the minor groove of a TATA element. Nature 1993, 365, 520–527. [Google Scholar] [CrossRef]
- Kim, Y.; Geiger, J.H.; Hahn, S.; Sigler, P.B. Crystal structure of a yeast TBP/TATA-box complex. Nature 1993, 365, 512–520. [Google Scholar] [CrossRef]
- Delgadillo, R.F.; Whittington, J.E.; Parkhurst, L.K.; Parkhurst, L.J. The TATA-binding protein core domain in solution variably bends TATA sequences via a three-step binding mechanism. Biochemistry 2009, 48, 1801–1809. [Google Scholar] [CrossRef]


| Group | Tame vs. Aggressive Rats |
|---|---|
| Total number of sequence reads (NCBI SRA ID: PRJNA668014) | 210,128,758 |
| Reads mapped to reference rat genome RGSC Rnor_6.0, UCSC Rn6, July 2014 (%) | 177,608,837 (84.5%) |
| Expressed genes identified | 14,039 |
| Statistically significant DEGs (PADJ < 0.05, Fisher’s Z-test with the Benjamini correction) | 39 |
| # | Rat Gene Name | Symbol | log2 | PADJ |
|---|---|---|---|---|
| 1 | Amylase α1A | Amy1a | 1.97 | <0.05 |
| 2 | Aldehyde oxidase 1 | Aox1 | 1.82 | <0.05 |
| 3 | Achaete-scute family bHLH transcription factor 3 | Ascl3 | 2.74 | <10−4 |
| 4 | BTG3-associated nuclear protein | Banp | −0.64 | <0.05 |
| 5 | Bradykinin receptor B2 | Bdkrb2 | 1.62 | <0.05 |
| 6 | Cocaine- and amphetamine-regulated transcript prepropeptide | Cartpt | 3.53 | <10−7 |
| 7 | Cytochrome P450, family 2, subfamily j, polypeptide 10 | Cyp2j10 | 1.10 | <10−2 |
| 8 | Defensin β17 | Defb17 | 6.96 | <10−2 |
| 9 | Empty spiracles homeobox 2 | Emx2 | 1.45 | <10−2 |
| 10 | FAT atypical cadherin 2 | Fat2 | −4.96 | <0.05 |
| 11 | Fc γ receptor IIb | Fcgr2b | 2.02 | <0.05 |
| 12 | AP-1 transcription factor subunit FosB proto-oncogene | Fosb | −1.85 | <10−3 |
| 13 | Glycerol-3-phosphate dehydrogenase 1 | Gpd1 | −0.99 | <0.05 |
| 14 | Hemoglobin, β adult major chain | Hbb-b1 | −5.90 | <10−5 |
| 15 | Heat shock protein family A (Hsp70) member 1B | Hspa1b | −2.14 | <10−7 |
| 16 | Integral membrane protein 2A | Itm2a | 0.76 | <10−2 |
| 17 | Keratin 2 | Krt2 | −1.85 | <10−6 |
| 18 | MORN repeat-containing 1 | Morn1 | 0.75 | <0.05 |
| 19 | Myomesin 2 | Myom2 | −1.63 | <0.05 |
| 20 | Nuclear transcription X-box-binding like 1 factor | Nfxl1 | 0.69 | <10−2 |
| 21 | Neuromedin B | Nmb | −3.27 | <10−4 |
| 22 | Nicotinamide nucleotide adenylyltransferase 1 | Nmnat1 | 0.94 | <10−4 |
| 23 | Purkinje cell protein 2 | Pcp2 | −5.91 | <10−2 |
| 24 | Protein disulfide isomerase family A member 4 | Pdia4 | −0.59 | <10−2 |
| 25 | Prodynorphin | Pdyn | −1.02 | <10−2 |
| 26 | Phospholipase A2, group IIC | Pla2g2c | −1.60 | <10−4 |
| 27 | Procollagen-lysine,2-oxoglutarate 5-dioxygenase 1 | Plod1 | −0.85 | <10−2 |
| 28 | Phosphotriesterase-related protein | Pter | 1.27 | <10−2 |
| 29 | Glycogen phosphorylase L | Pygl | −0.95 | <0.05 |
| 30 | RNA-binding motif protein 3 | Rbm3 | 1.22 | <10−4 |
| 31 | Retinol saturase | Retsat | −1.01 | <0.05 |
| 32 | Rho-related BTB domain-containing protein 3 | Rhobtb3 | 0.85 | <0.05 |
| 33 | Relaxin 3 | Rln3 | −3.73 | <10−3 |
| 34 | Sciellin | Scel | 1.24 | <0.05 |
| 35 | Schlafen family member 13 | Slfn13 | 1.33 | <0.05 |
| 36 | Serine peptidase inhibitor, Kunitz type 1 | Spint1 | −1.16 | <10−3 |
| 37 | Troponin T type 1 (skeletal, slow) | Tnnt1 | 2.80 | <0.05 |
| 38 | Urocortin | Ucn | 2.61 | <0.05 |
| 39 | WD repeat and SOCS box-containing protein 1 | Wsb1 | 0.95 | <0.05 |
| Design | Glove Test [79] and qPCR Data on Gene Expression [This Work] | |||||||||
|---|---|---|---|---|---|---|---|---|---|---|
| Rat | Set | No. 1 | 2 | 3 | 4 | 5 | 6 | 7 | 8 | |
| Glove test | A | −3.5 | −3.5 | −3.5 | −3.5 | −3.5 | −3.5 | −3.5 | −3.5 | |
| T | 3.5 | 3.5 | 3.5 | 3.5 | 3.5 | 3.5 | 3.5 | 3.5 | ||
| DEG | Set | Relative expression with respect to three reference genes, qPCR, M0 ± SEM | TOTAL | |||||||
| Ascl3 | A | 0.10 ± 0.05 | 0.26 ± 0.01 | 0.64 ± 0138 | 0.12 ± 0.03 | 0.24 ± 0.07 | 0.10 ± 0.03 | 0.13 ± 0.005 | 0.15 ± 0.02 | 0.22 ± 0.06 |
| T | 1.63 ± 0.03 | 1.66 ± 0.16 | 1.86 ± 0.15 | 4.30 ± 0.06 | 3.37 ± 0.18 | 4.91 ± 0.13 | 4.14 ± 0.90 | 4.95 ± 0.86 | 3.35 ± 0.51 | |
| Defb17 | A | 0.007 ± 0.005 | ND | ND | ND | 0.005 ± 0.005 | 0.005 ± 0.005 | 0.005 ± 0.005 | 0.005 ± 0.005 | 0.005 ± 0.005 |
| T | 3.17 ± 0.30 | 3.06 ± 0.16 | 2.91 ± 0.11 | 2.74 ± 0.22 | 1.62 ± 0.17 | 3.42 ± 0.51 | 1.67 ± 0.07 | 3.77 ± 0.07 | 2.08 ± 0.27 | |
| # | Species | ARD Susceptibility | ARD Resistance | Tissue | NDEG | Ref. |
|---|---|---|---|---|---|---|
| 1 | rat | OXYS: spurt aging, 20-day-old | Wistar, 20-day-old | hippocampus | 46 | [44] |
| 2 | rat | OXYS: spurt aging, 5-month-old | Wistar, 5-month-old | hippocampus | 28 | [44] |
| 3 | rat | OXYS: spurt aging, 18-month-old | Wistar, 18-month-old | hippocampus | 85 | [44] |
| 4 | rat | OXYS: spurt aging, 18-month-old | Wistar, 18-month-old | prefrontal cortex | 59 | [45] |
| 5 | rat | OXYS: spurt aging, 18-month-old | Wistar, 18-month-old | retina | 77 | [46] |
| 6 | rat | ISIAH (hypertensive aged vessels) | WAG (norm) | brain stem | 206 | [47] |
| 7 | rat | ISIAH (hypertensive aged vessels) | WAG (norm) | hypothalamus | 137 | [48] |
| 8 | rat | ISIAH (hypertensive aged vessels) | WAG (norm) | renal medulla | 882 | [49] |
| 9 | rat | ISIAH (hypertensive aged vessels) | WAG (norm) | renal cortex | 309 | [50] |
| 10 | rat | ISIAH (hypertensive aged vessels) | WAG (norm) | adrenal gland | 1020 | [51] |
| 11 | rat | SHR (hypertensive aged vessels) | Wistar (norm) | brain pericytes | 21 | [52] |
| 12 | rat | 20-passage-old | 5-passage-old | MSC(BM) | 9167 | [35] |
| 13 | rat | 5-passage-old | 5-passage-old, Aspirin | MSC(BM) | 1220 | [35] |
| 14 | rat | 20-passage-old | 20-passage-old, Aspirin | MSC(BM) | 446 | [35] |
| 15 | mice | 11-month-old, bone fragility | 2-month-old, norm | bone | 1011 | [55] |
| 16 | mice | 23-month-old, bone fragility | 2-month-old, norm | bone | 1151 | [55] |
| 17 | mice | 30-month-old, bone fragility | 2-month-old, norm | bone | 3725 | [55] |
| 18 | mice | 30-month-old, bone fragility | 2-month-old, norm | kidney | 43 | [56] |
| 19 | mice | 27-month-old, males, renal fibrosis | 2-month-old, males | kidney | 349 | [56] |
| 20 | mice | 27-month-old, females, renal fibrosis | 2-month-old, females | kidney | 100 | [56] |
| 21 | mice | 24-month-old, renal fibrosis | 3-month-old | kidney | 599 | [57] |
| 22 | mice | PolG D257A, cardiac disorder | wild-typed norm | heart right ventricle | 402 | [58] |
| 23 | mice | 20-month-old, parabiont, 8 weeks | 6-month-old, parabiont, 8 weeks | aortic arch | 23 | [59] |
| 24 | mice | 8 h:8 h biorhythm (autistic-like) | 12 h/12 h biorhythm norm | hippocampus | 158 | [60] |
| 25 | mice | wild-type, 20-week-old, 60% diet | wild-type, 20-week-old, ad libitum | skeletal muscle | 1178 | [61] |
| 26 | mice | wild-type, 80-week-old, 60% diet | wild-type, 80-week-old, ad libitum | skeletal muscle | 747 | [61] |
| 27 | mice | Sirt1-KO, 20-week-old, 60% diet | Sirt1-KO, 20-week-old, ad libitum | skeletal muscle | 2323 | [61] |
| 28 | mice | Sirt1-KI, 20-week-old, 60% diet | Sirt1-KI, 20-week-old, ad libitum | skeletal muscle | 1919 | [61] |
| 29 | mice | Sirt1-KO, 80-week-old, 60% diet | Sirt1-KO, 80-week-old, ad libitum | skeletal muscle | 721 | [61] |
| 30 | mice | Sirt1-KI, 80-week-old, 60% diet | Sirt1-KI, 80-week-old, ad libitum | skeletal muscle | 2641 | [61] |
| 31 | mice | Sirt1-KO, 80-week-old, ad libitum | wild-type, 80-week-old, ad libitum | skeletal muscle | 1976 | [61] |
| 32 | mice | wild-type, 80-week-old, ad libitum | Sirt1-KI, 80-week-old, ad libitum | skeletal muscle | 445 | [61] |
| 33 | mice | Sirt1-KO, 20-week-old, ad libitum | wild-type, 20-week-old, ad libitum | skeletal muscle | 1152 | [61] |
| 34 | mice | wild-type, 20-week-old, ad libitum | Sirt1-KI, 20-week-old, ad libitum | skeletal muscle | 135 | [61] |
| 35 | mice | BPH/2J, hypertensive, aged vessels | BPN/3J, norm | kidney | 883 | [62] |
| 36 | rabbit | under Goldblatt 2-kidney 1-clip | under sham-operated control | prefrontal cortex | 229 | [63] |
| 37 | chicken | 1.2% Ca diet: worst health | 0.8% Ca diet: best health | kidney | 92 | [30] |
| 38 | chicken | 1% Ca diet, health threshold | 0.8% Ca diet: best health | kidney | 83 | [30] |
| 39 | chicken | 1.2% Ca diet: worst health | 1% Ca diet, health threshold | kidney | 64 | [30] |
| 40 | chicken | 456-day-old, subfertility | 224-day-old, fertility peak | ovary | 259 | [34] |
| 41 | chicken | 469-day-old, hunger, infertility | 456-day-old, subfertility | ovary | 926 | [34] |
| 42 | chicken | 469-day-old, hunger, infertility | 527-day-old, fasting-diet, fertility | ovary | 698 | [34] |
| 43 | fruit fly | 10-day-old, Alzheimer disease-like | 0-day-old, just post-eclosion | head | 99 | [64] |
| Σ | 5 species | 43 human age-related disease models using animals | 17 tissues | 37,834 | 22 Refs |
| # | ARD Susceptibility | ARD Resistance | Tissue | NDEG | Ref. |
|---|---|---|---|---|---|
| 1 | renal medullary hypertension | norm | renal medulla | 13 | [36] |
| 2 | pulmonary arterial hypertension | norm | blood | 14 | [37] |
| 3 | pulmonary arterial hypertension | norm | lung | 118 | [38] |
| 4 | fibrosis in pulmonary hypertension | norm | lung | 3516 | [39] |
| 5 | idiopathic pulmonary hypertension | norm | lung | 5639 | [39] |
| 6 | nephrosclerosis as kidney aging | norm | kidney | 16 | [40] |
| 7 | atrial fibrillation as heart aging | norm | auricle tissue | 300 | [41] |
| 8 | myocardial ischemia as aged heart | norm | peripheral blood | 1524 | [41] |
| 9 | ALS as aged motoneurons | norm | small extracellular vesicles | 402 | [42] |
| 10 | FTD as cognitive ageing | norm | small extracellular vesicles | 164 | [42] |
| 11 | ALS as aged motor neurons | norm | large extracellular vesicles | 62 | [42] |
| 12 | FTD as cognitive ageing | norm | large extracellular vesicles | 55 | [42] |
| 13 | before exercise training | after exercise training | vastus externus | 170 | [33] |
| 14 | LPS-stimulated atherogenesis | ARID5B-KO as atheroprotection | THP1 monocytes | 2542 | [43] |
| ∑ | 14 binary models of human ARDs | 10 tissues | 14,535 | 9 Refs | |
| Rat Gene | Total Number of DEGs | Binomial Distribution | Rat Gene | Total Number of DEGs | Binomial Distribution | ||||||
|---|---|---|---|---|---|---|---|---|---|---|---|
| # | Symbol | NPC1: Matching Signs | NPC2: Opposite Signs | p | PADJ | # | Symbol | NPC1: Matching Signs | NPC2: Opposite Signs | P | PADJ |
| i | ii | iii | iv | v | vi | i | ii | iii | iv | V | vi |
| 1 | Amy1a | 7 | 3 | 0.17 | 1.00 | 21 | Nmb | 1 | 4 | 0.19 | 1.00 |
| 2 | Aox1 | 8 | 5 | 0.29 | 1.00 | 22 | Nmnat1 | 3 | 7 | 0.17 | 1.00 |
| 3 | Ascl3 | 3 | 1 | 0.31 | 1.00 | 23 | Pcp2 | 5 | 1 | 0.11 | 1.00 |
| 4 | Banp | 8 | 3 | 0.11 | 1.00 | 24 | Pdia4 | 10 | 6 | 0.23 | 1.00 |
| 5 | Bdkrb2 | 3 | 4 | 0.50 | 1.00 | 25 | Pdyn | 0 | 0 | ND | ND |
| 6 | Cartpt | 1 | 1 | 0.50 | 1.00 | 26 | Pla2g2c | 40 | 32 | 0.20 | 1.00 |
| 7 | Cyp2j10 | 6 | 5 | 0.50 | 1.00 | 27 | Plod1 | 16 | 3 | 0.002 | 0.08 |
| 8 | Defb17 | 10 | 1 | 0.006 | 0.23 | 28 | Pter | 2 | 3 | 0.50 | 1.00 |
| 9 | Emx2 | 1 | 0 | 0.50 | 1.00 | 29 | Pygl | 4 | 9 | 0.13 | 1.00 |
| 10 | Fat2 | 15 | 5 | 0.021 | 0.81 | 30 | Rbm3 | 27 | 12 | 0.012 | 0.46 |
| 11 | Fcgr2b | 17 | 1 | 0.00007 | 0.005 | 31 | Retsat | 4 | 8 | 0.19 | 1.00 |
| 12 | Fosb | 7 | 13 | 0.13 | 1.00 | 32 | Rhobtb3 | 8 | 18 | 0.038 | 1.00 |
| 13 | Gpd1 | 7 | 4 | 0.27 | 1.00 | 33 | Rln3 | 0 | 2 | 0.25 | 1.00 |
| 14 | Hbb-b1 | 10 | 18 | 0.09 | 1.00 | 34 | Scel | 2 | 3 | 0.50 | 1.00 |
| 15 | Hspa1b | 28 | 21 | 0.20 | 1.00 | 35 | Slfn13 | 16 | 7 | 0.05 | 1.00 |
| 16 | Itm2a | 4 | 17 | 0.004 | 0.14 | 36 | Spint1 | 2 | 4 | 0.34 | 1.00 |
| 17 | Krt2 | 27 | 21 | 0.24 | 1.00 | 37 | Tnnt1 | 5 | 9 | 0.21 | 1.00 |
| 18 | Morn1 | 12 | 2 | 0.006 | 0.25 | 38 | Ucn | 2 | 0 | 0.25 | 1.00 |
| 19 | Myom2 | 11 | 8 | 0.32 | 1.00 | 39 | Wsb1 | 3 | 3 | 0.65 | 1.00 |
| 20 | Nfxl1 | 3 | 5 | 0.36 | 1.00 | ||||||
| # | Species | Age-Related Disease Susceptibility | Age-Related Disease Resistance | Tissue | DEG | log2 | PADJ | Ref. |
|---|---|---|---|---|---|---|---|---|
| 1 | rat | 20-passage-old | 5-passage-old | MSC(BM) | Fcgr2b | 6.24 | 10−3 | [35] |
| 2 | rat | 20-passage-old | 5-passage-old | MSC(BM) | Fcgr2a | 3.99 | 10−80 | [35] |
| 3 | rat | 20-passage-old | 5-passage-old | MSC(BM) | Fcgr3a | 2.86 | 10−44 | [35] |
| 4 | rat | 20-passage-old | 20-passage-old, Aspirin | MSC(BM) | Fcgr2b | 1.00 | 10−6 | [35] |
| 5 | rat | ISIAH, hypertensive aged vessels | WAG (norm) | adrenal gland | Fcgr1a | 0.76 | 0.05 | [51] |
| 6 | rat | ISIAH, hypertensive aged vessels | WAG (norm) | adrenal gland | Fcgr3a | 0.67 | 0.05 | [51] |
| 7 | mice | 30-month-old, bone fragility | 2-month-old, norm | Bone | Fcgr2b | 1.11 | 10−3 | [55] |
| 8 | mice | 30-month-old, bone fragility | 2-month-old, norm | Bone | Fcgr1 | 1.12 | 10−2 | [55] |
| 9 | mice | 30-month-old, bone fragility | 2-month-old, norm | Bone | Fcgr3 | 0.92 | 10−2 | [55] |
| 10 | mice | 30-month-old, bone fragility | 2-month-old, norm | Bone | Fcgr3 | 1.39 | 0.05 | [56] |
| 11 | mice | PolG D257A, cardiac disorder | wild-type, norm | heart right ventricle | Fcgr4 | 1.91 | 10−2 | [58] |
| 12 | human | fibrosis in pulmonary hypertension | norm | Lung | FCGR1B | −1.30 | 0.05 | [39] |
| 13 | human | idiopathic pulmonary hypertension | norm | Lung | FCGR2A | 0.27 | 0.05 | [39] |
| 14 | human | idiopathic pulmonary hypertension | norm | Lung | FCGR3A | 0.22 | 0.05 | [39] |
| 15 | human | LPS-stimulated atherogenesis | ARID5B-KO as atheroprotection | THP1 monocytes | FCGR1A | 0.41 | 10−4 | [43] |
| 16 | human | LPS-stimulated atherogenesis | ARID5B-KO as atheroprotection | THP1 monocytes | FCGR1B | 0.55 | 10−4 | [43] |
| 17 | human | LPS-stimulated atherogenesis | ARID5B-KO as atheroprotection | THP1 monocytes | FCGR1C | 0.30 | 10−2 | [43] |
| 18 | human | LPS-stimulated atherogenesis | ARID5B-KO as atheroprotection | THP1 monocytes | FCGR2A | 0.49 | 10−5 | [43] |
| # | Domestic Animals | Wild Animals | Tissue | NDEG | Ref. |
|---|---|---|---|---|---|
| 1 | tame rats | aggressive rats | hypothalamus | 46 | [204] |
| 2 | tame rats | aggressive rats | hippocampus | 42 | [74] |
| 3 | tame rats | aggressive rats | midbrain tegmentum | 31 | [68] |
| 4 | tame rats | aggressive rats | frontal cortex | 20 | [205] |
| 5 | guinea pigs | cavy | frontal cortex | 883 | [205] |
| 6 | domestic rabbits | wild rabbits | frontal cortex | 17 | [205] |
| 7 | domestic rabbits | wild rabbits | parietal-temporal cortex | 216 | [206] |
| 8 | domestic rabbits | wild rabbits | amygdala | 118 | [206] |
| 9 | domestic rabbits | wild rabbits | hypothalamus | 43 | [206] |
| 10 | domestic rabbits | wild rabbits | hippocampus | 100 | [206] |
| 11 | dogs | wolves | blood | 450 | [207] |
| 12 | dogs | wolves | frontal cortex | 13 | [205] |
| 13 | tame foxes | aggressive foxes | pituitary | 327 | [208] |
| 14 | pigs | boars | frontal cortex | 30 | [205] |
| 15 | pigs | boars | frontal cortex | 34 | [209] |
| 16 | pigs | boars | pituitary | 22 | [210] |
| 17 | domestic chicken | wild chicken | pituitary | 474 | [211] |
| Σ | 7 domestic animal species | 7 wild animal species | 8 tissues | 2866 | 10 Refs |
| (a) Humans | (b) Animals | |||||||||
|---|---|---|---|---|---|---|---|---|---|---|
| Effect of changes in human FCGR2B expression on ARDs: aggravating (→) or alleviating (←) | Effect of changes in the expression of animal genes homologous to human FCGR2B | |||||||||
| deficient | effect | excessive | effect | deficient | excessive | tissue | DEG | log2 | PADJ | Refs |
| In South Asia and Africa, the human FCGR2B-deficient alleles have the most frequent occurrence as protectors against infection [117], susceptibility to which increases with age as immunosenescence [118] | ← | FCGR2B has been explored using the “C-type lectin-like molecule-1”/”Fc-domain” fusion protein as a target antigen for chemotherapy against acute myeloid leukemia [119] as a cellular-senescence-related immunogenic disease [120] | → | aggressive rat | tame rat | PAG | Fcgr2b | 2.02 | 0.05 | [this work] |
| aggressive rat | tame rat | hypothalamus | Fcrl2 | 1.12 | 0.05 | [204] | ||||
| aggressive rat | tame rat | hypothalamus | Fcgr3a | 2.06 | 10−2 | [204] | ||||
| aggressive rat | tame rat | midbrain tegmentum | Fcgr2b | 2.01 | 0.05 | [68] | ||||
| aggressive fox | tame fox | pituitary | Fcrl1 | 0.43 | 10−2 | [208] | ||||
| wild rabbit | domestic rabbit | parietal-temporal cortex | Fcgr3b | 1.35 | 10−2 | [206] | ||||
| guinea pig | cavy | frontal cortex | Fcer2 | −1.36 | 0.05 | [205] | ||||
| (a) Humans | Effect of Changes in Human FCGR2B Expression on ARDs | Pearson’s χ2 Test | Fisher’s Exact Test | |||
|---|---|---|---|---|---|---|
| (b) Animals | Alleviating (←) | Aggravating (→) | χ2 | p | ||
| Effect of changes in the expression of animal homologs to human FCGR2B | wild | 6 | 1 | 7.14 | 10−2 | 0.05 |
| domestic | 1 | 6 | ||||
| No. | Gene | Forward, 5′→3′ | Reverse, 5′→3′ |
|---|---|---|---|
| Novel DEGs Identified in the PAG of Tame versus Aggressive Adult Male Rats | |||
| 1 | Ascl3 | CCTCTGCTGCCCTTTTCCAG | ACTTGACTCGCTGCCTCTCT |
| 2 | Defb17 | TGGTAGCTTGGACTTGAGGAAAGAA | TGCAGCAGTGTGTTCCAGGTC |
| Reference genes | |||
| 3 | B2m | GTGTCTCAGTTCCACCCACC | TTACATGTCTCGGTCCCAGG |
| 4 | Hprt1 | TCCCAGCGTCGTGATTAGTGA | CCTTCATGACATCTCGAGCAAG |
| 5 | Rpl30 | CATCTTGGCGTCTGATCTTG | TCAGAGTCTGTTTGTACCCC |
Disclaimer/Publisher’s Note: The statements, opinions and data contained in all publications are solely those of the individual author(s) and contributor(s) and not of MDPI and/or the editor(s). MDPI and/or the editor(s) disclaim responsibility for any injury to people or property resulting from any ideas, methods, instructions or products referred to in the content. |
© 2023 by the authors. Licensee MDPI, Basel, Switzerland. This article is an open access article distributed under the terms and conditions of the Creative Commons Attribution (CC BY) license (https://creativecommons.org/licenses/by/4.0/).
Share and Cite
Shikhevich, S.; Chadaeva, I.; Khandaev, B.; Kozhemyakina, R.; Zolotareva, K.; Kazachek, A.; Oshchepkov, D.; Bogomolov, A.; Klimova, N.V.; Ivanisenko, V.A.; et al. Differentially Expressed Genes and Molecular Susceptibility to Human Age-Related Diseases. Int. J. Mol. Sci. 2023, 24, 3996. https://doi.org/10.3390/ijms24043996
Shikhevich S, Chadaeva I, Khandaev B, Kozhemyakina R, Zolotareva K, Kazachek A, Oshchepkov D, Bogomolov A, Klimova NV, Ivanisenko VA, et al. Differentially Expressed Genes and Molecular Susceptibility to Human Age-Related Diseases. International Journal of Molecular Sciences. 2023; 24(4):3996. https://doi.org/10.3390/ijms24043996
Chicago/Turabian StyleShikhevich, Svetlana, Irina Chadaeva, Bato Khandaev, Rimma Kozhemyakina, Karina Zolotareva, Anna Kazachek, Dmitry Oshchepkov, Anton Bogomolov, Natalya V. Klimova, Vladimir A. Ivanisenko, and et al. 2023. "Differentially Expressed Genes and Molecular Susceptibility to Human Age-Related Diseases" International Journal of Molecular Sciences 24, no. 4: 3996. https://doi.org/10.3390/ijms24043996
APA StyleShikhevich, S., Chadaeva, I., Khandaev, B., Kozhemyakina, R., Zolotareva, K., Kazachek, A., Oshchepkov, D., Bogomolov, A., Klimova, N. V., Ivanisenko, V. A., Demenkov, P., Mustafin, Z., Markel, A., Savinkova, L., Kolchanov, N. A., Kozlov, V., & Ponomarenko, M. (2023). Differentially Expressed Genes and Molecular Susceptibility to Human Age-Related Diseases. International Journal of Molecular Sciences, 24(4), 3996. https://doi.org/10.3390/ijms24043996