

Diversity of Structural, Dynamic, and Environmental Effects Explain a Distinctive Functional Role of Transmembrane Domains in the Insulin Receptor Subfamily

 , , ,
, , ,  , , , ,
  , ,
, ,  and
and 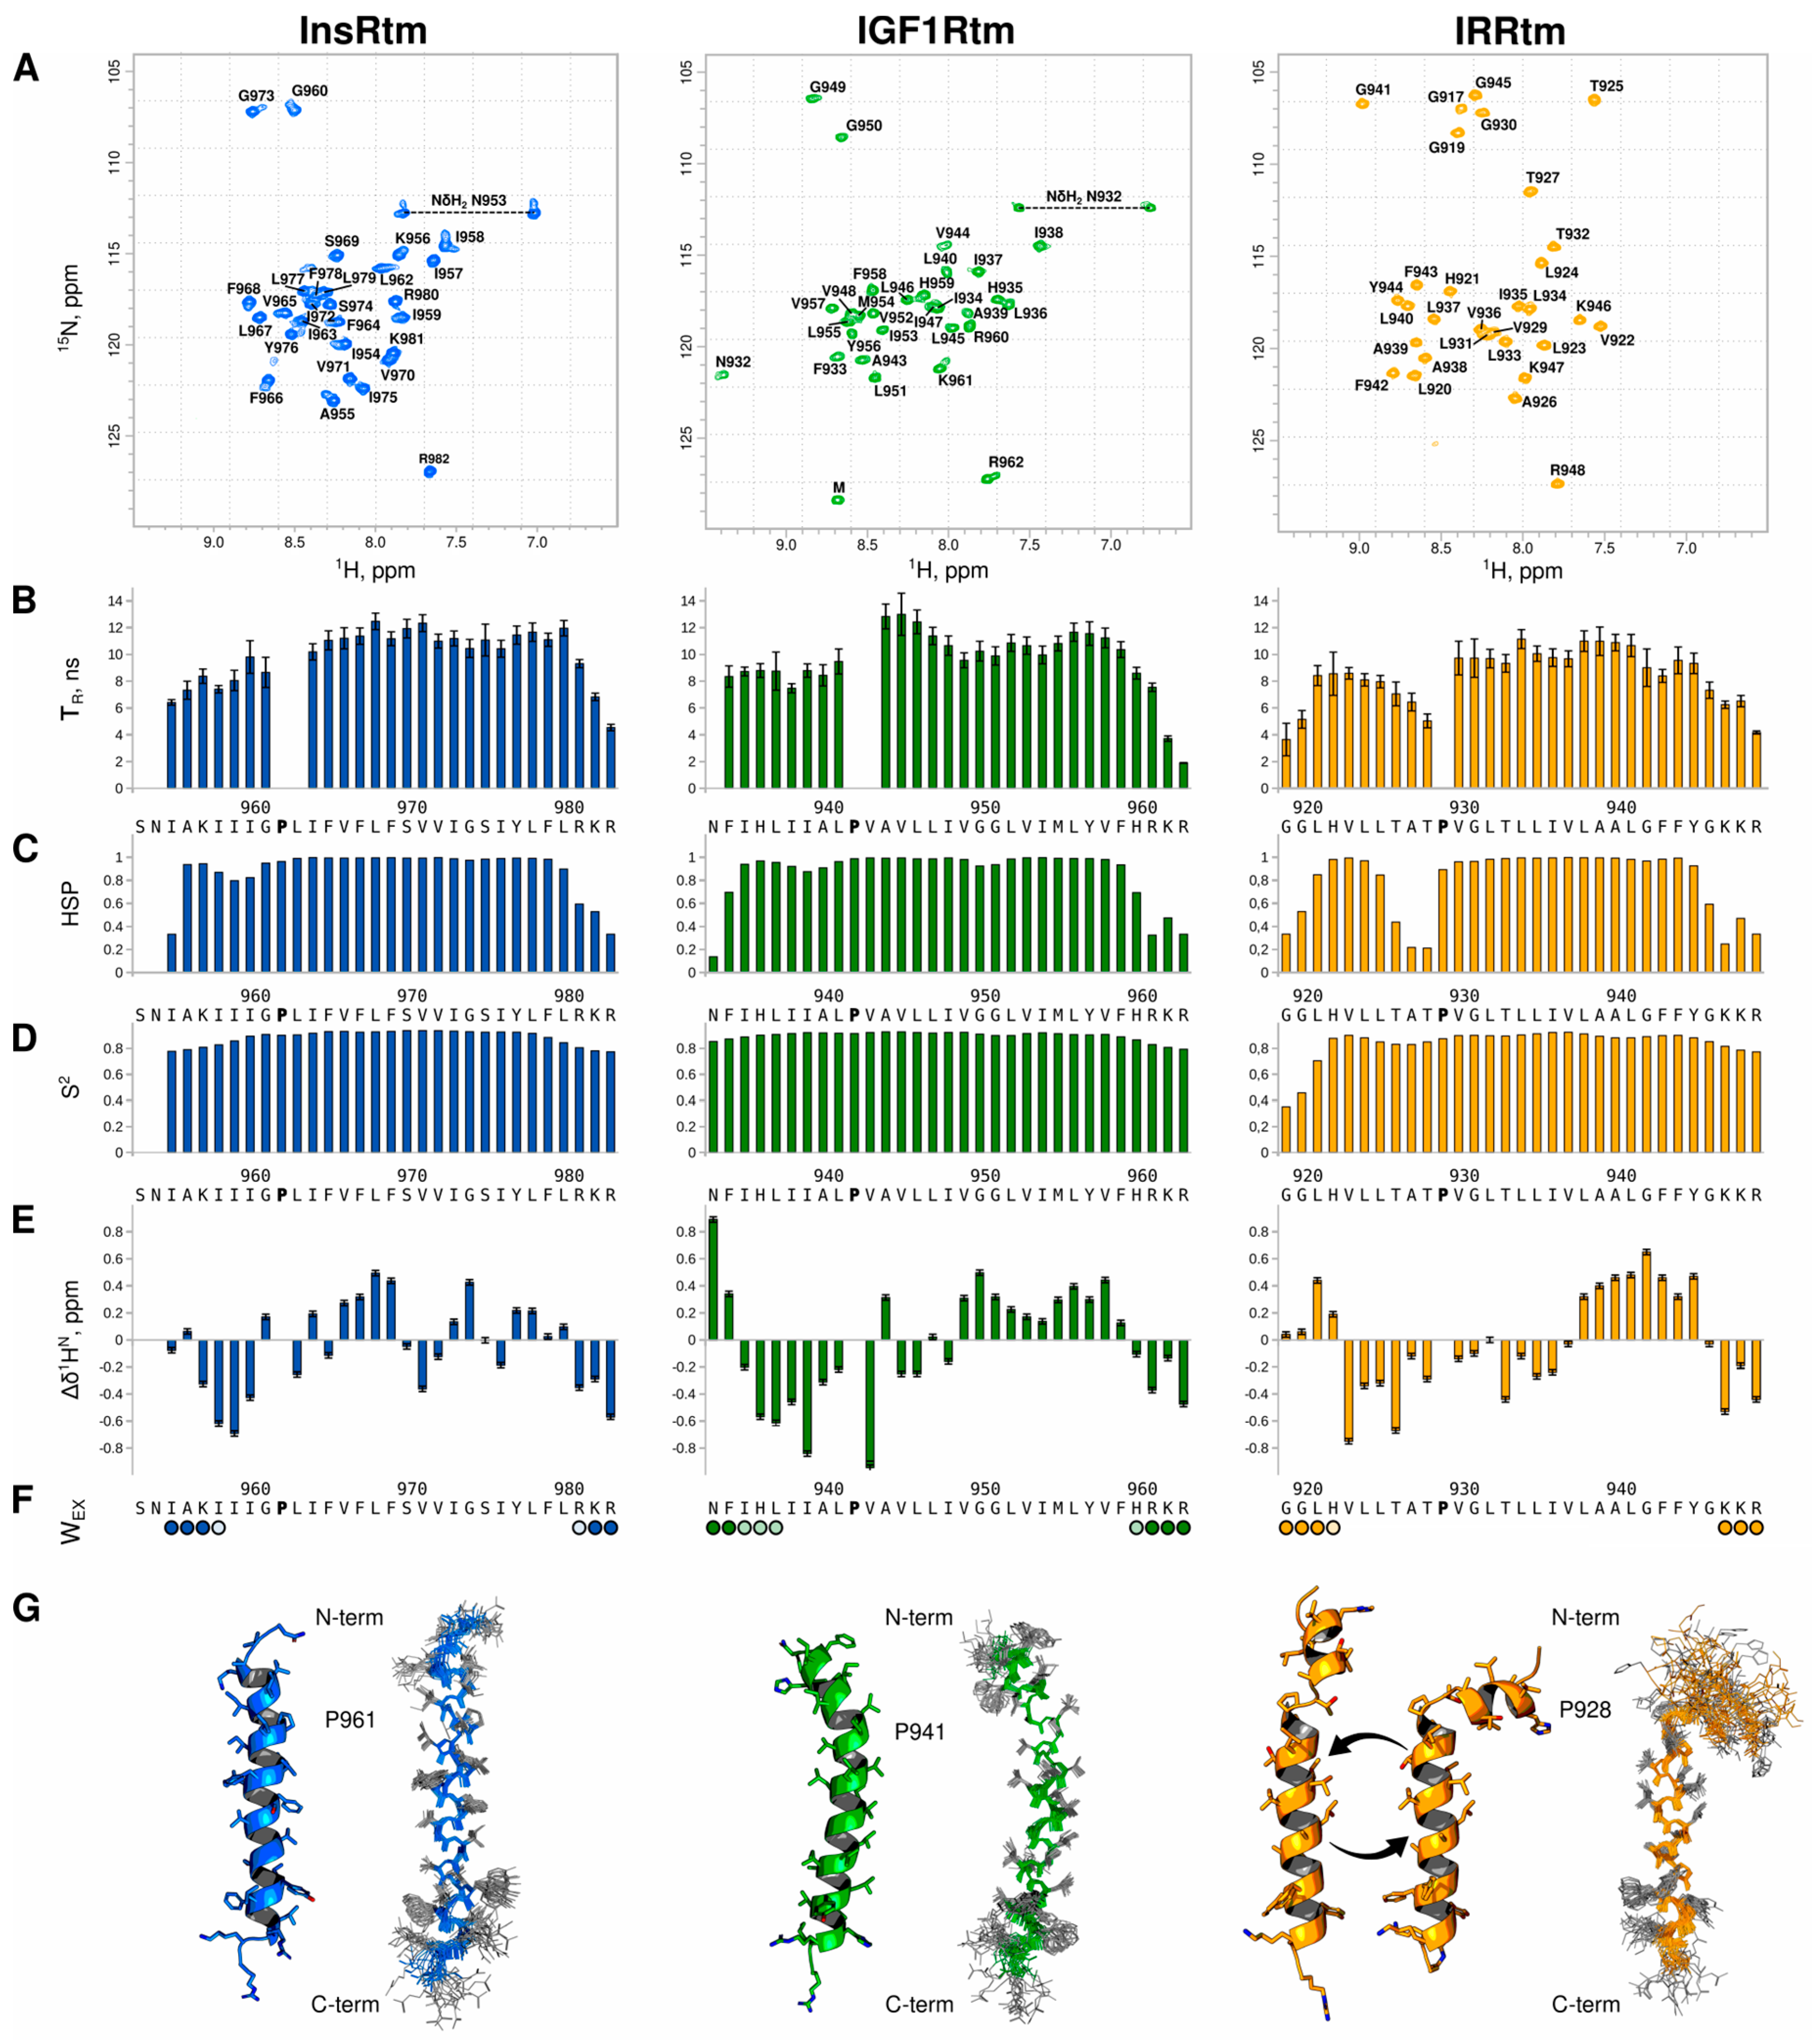
Abstract
1. Introduction
2. Results
2.1. Conformational Flexibility of TMD in IRR Differs from That in InsR and IGF1R: NMR Data
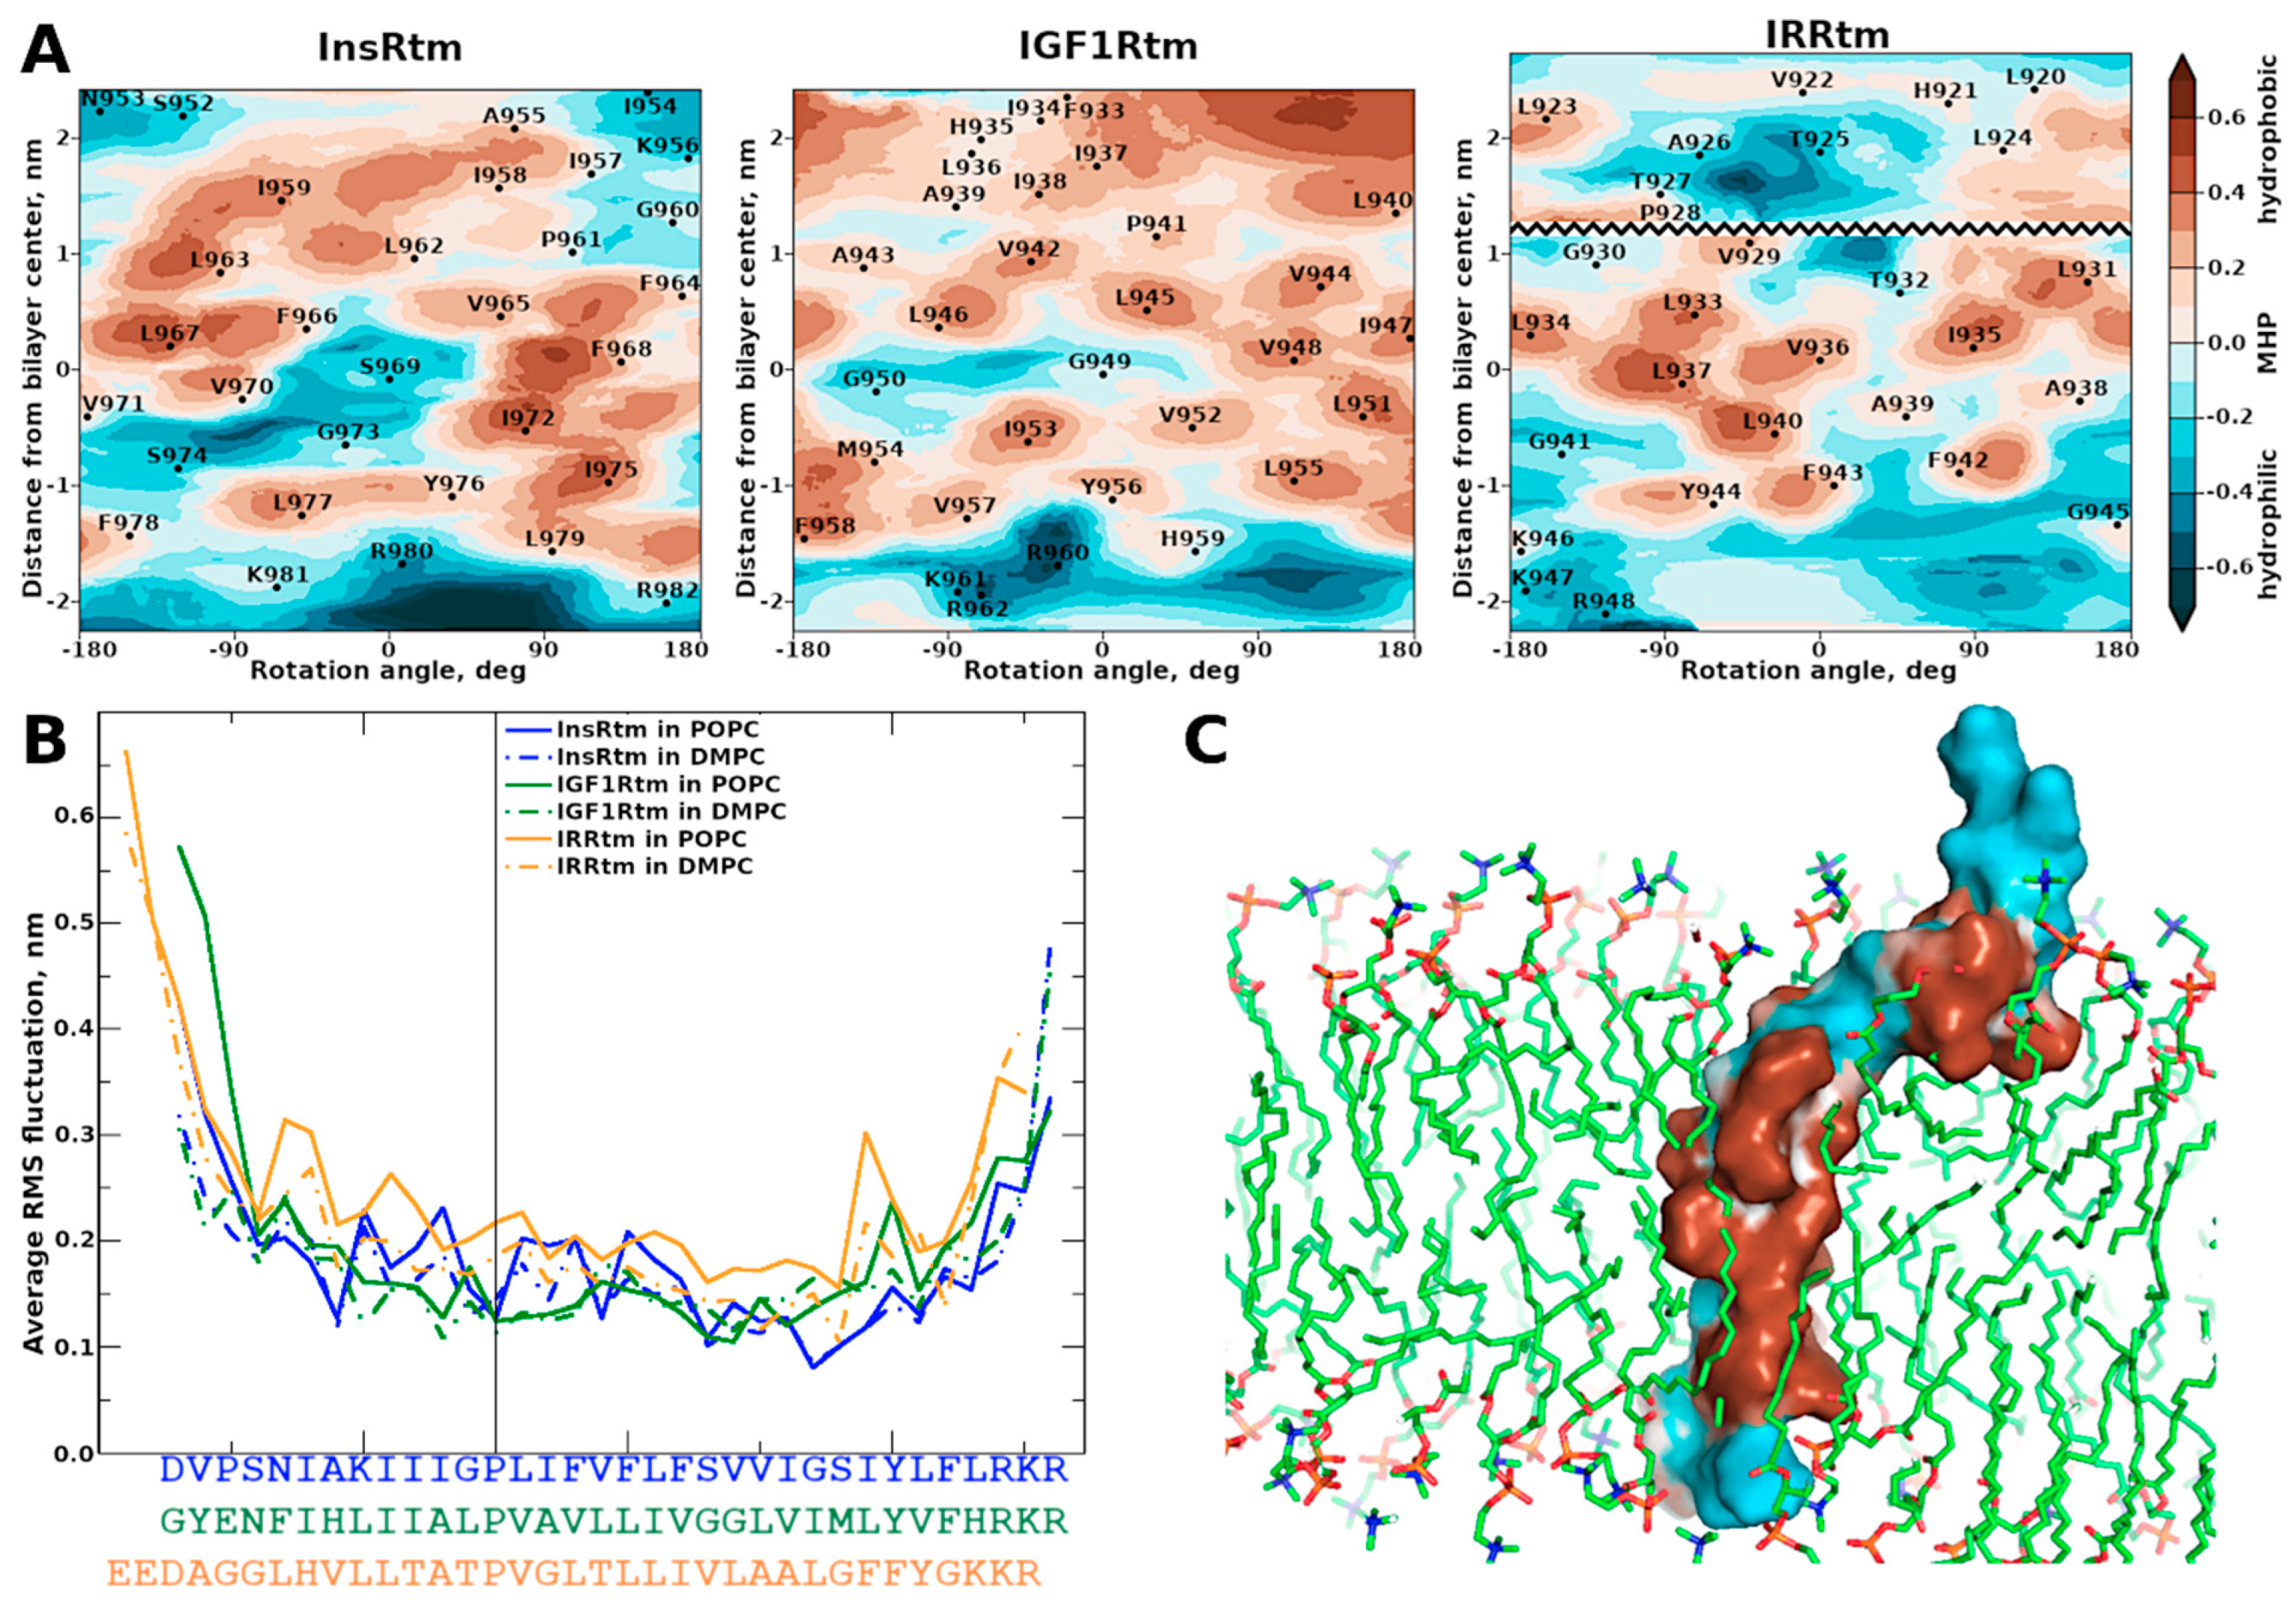
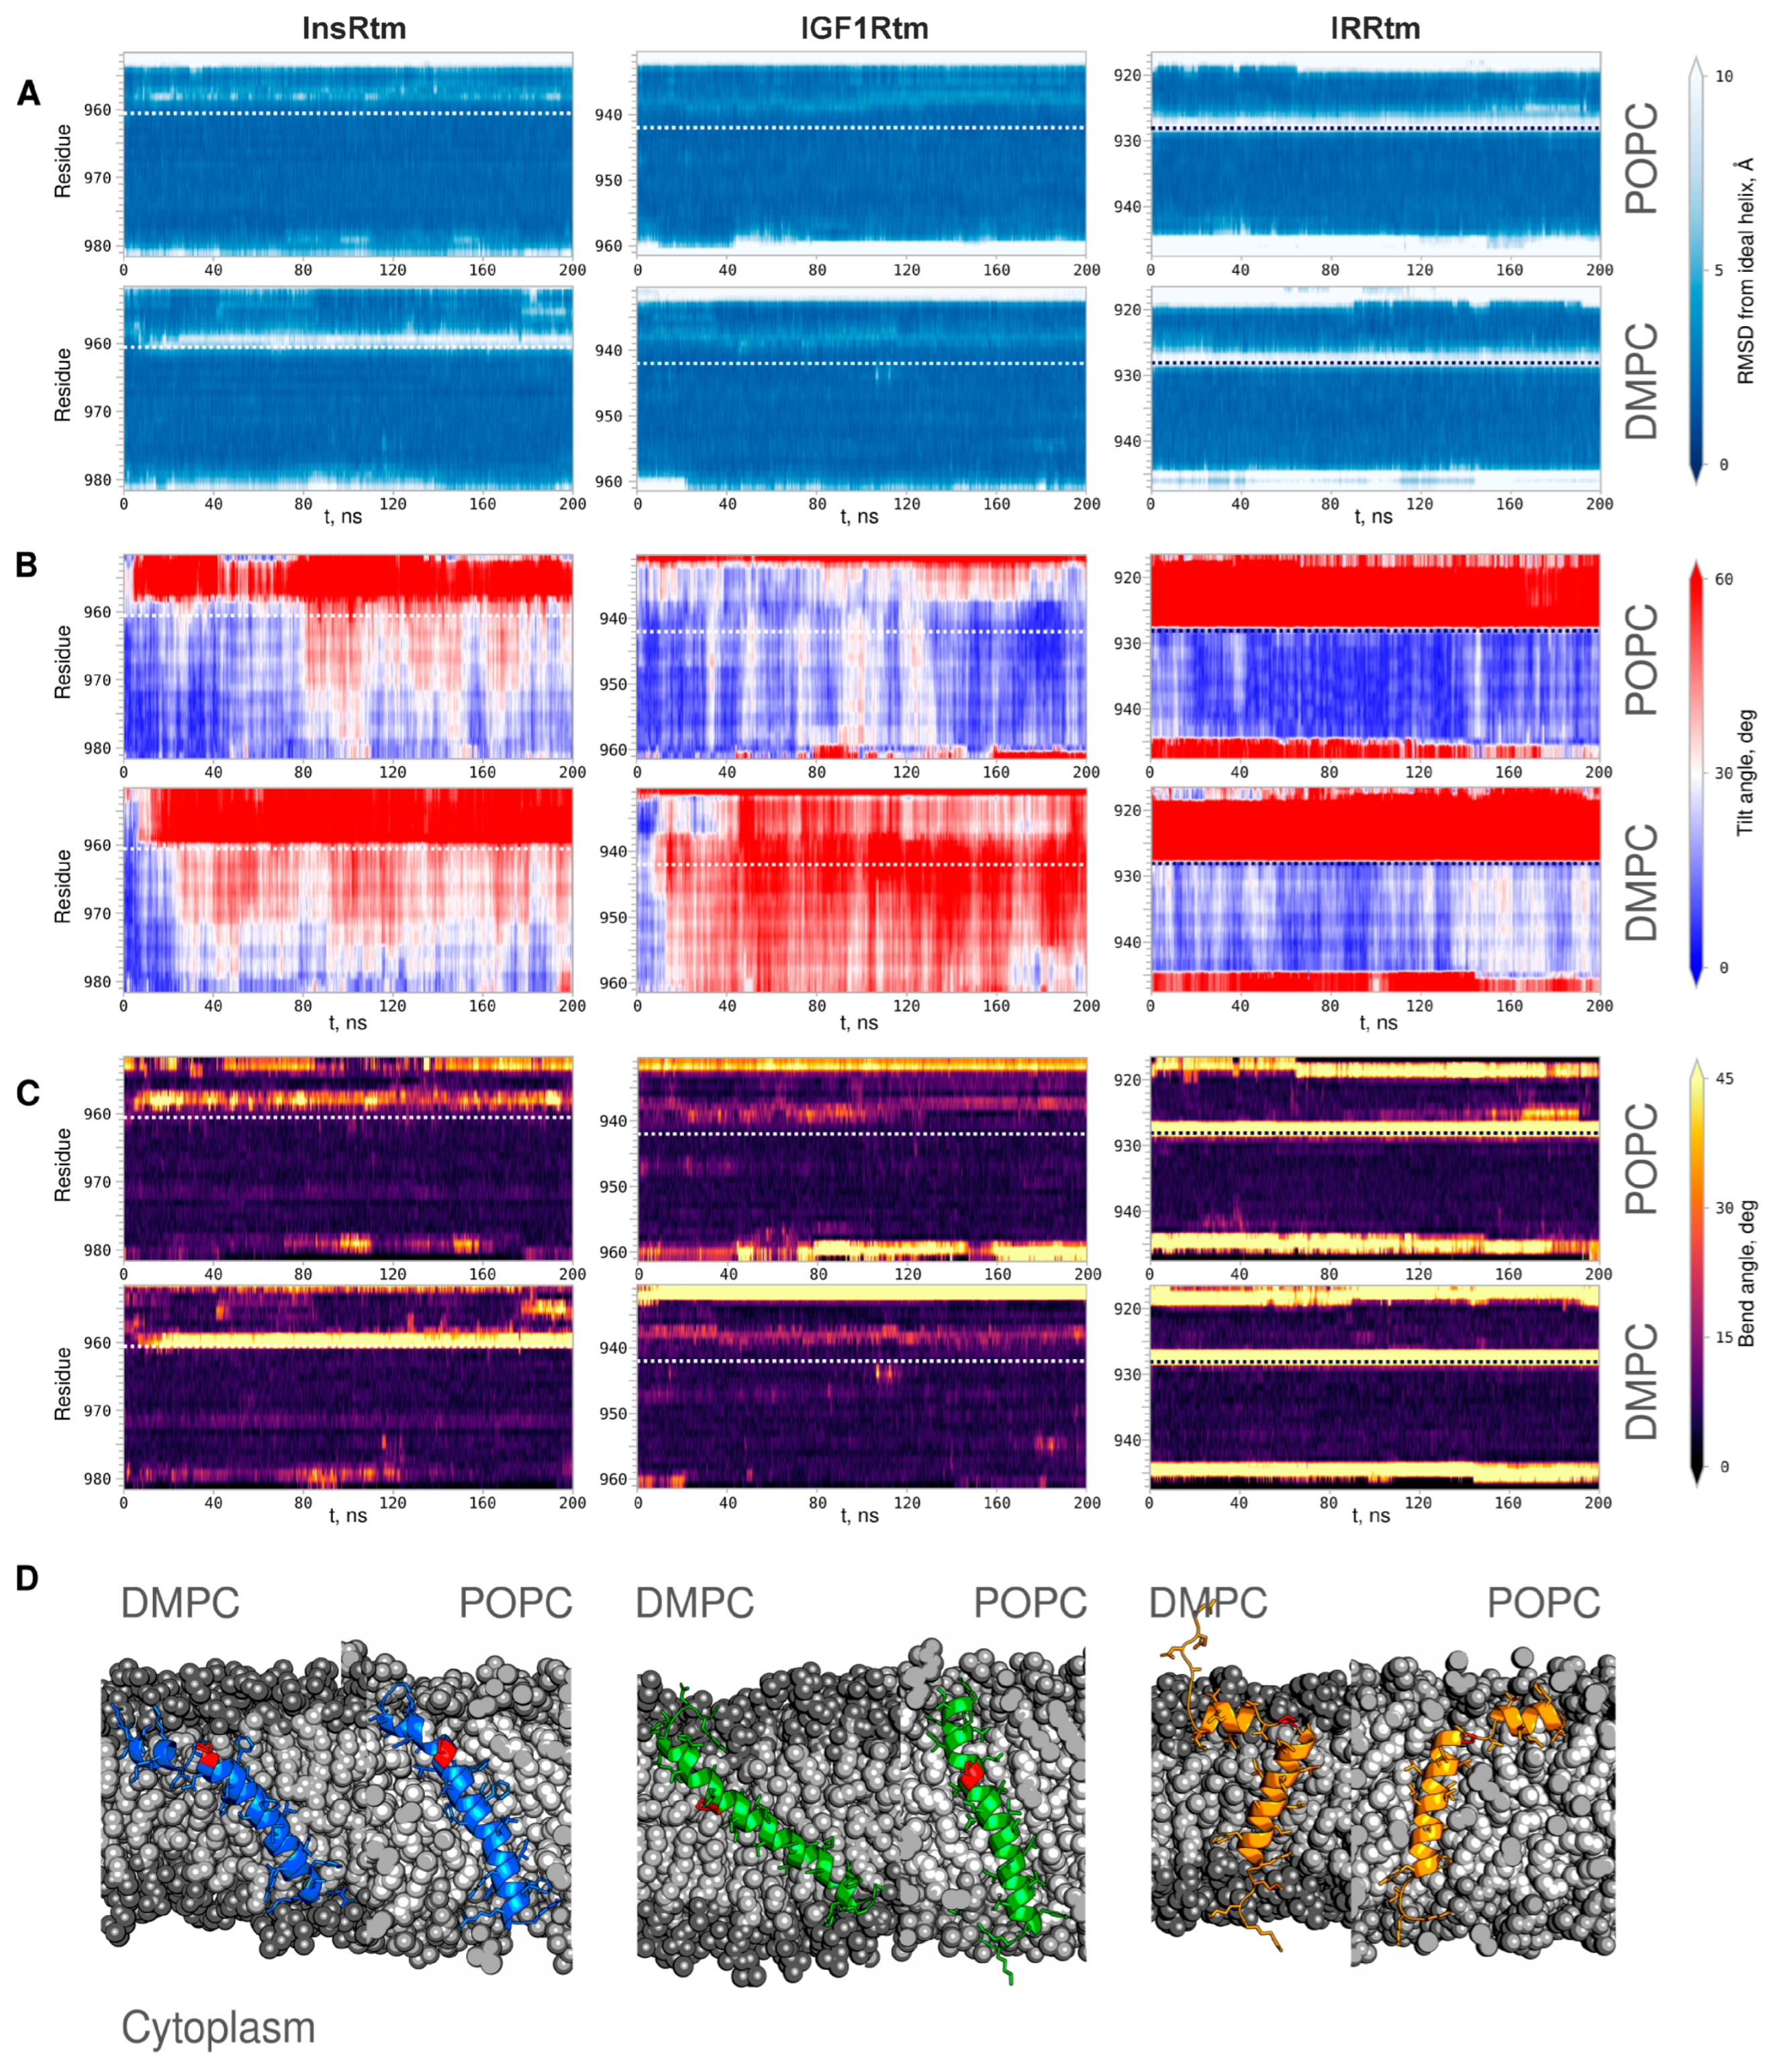
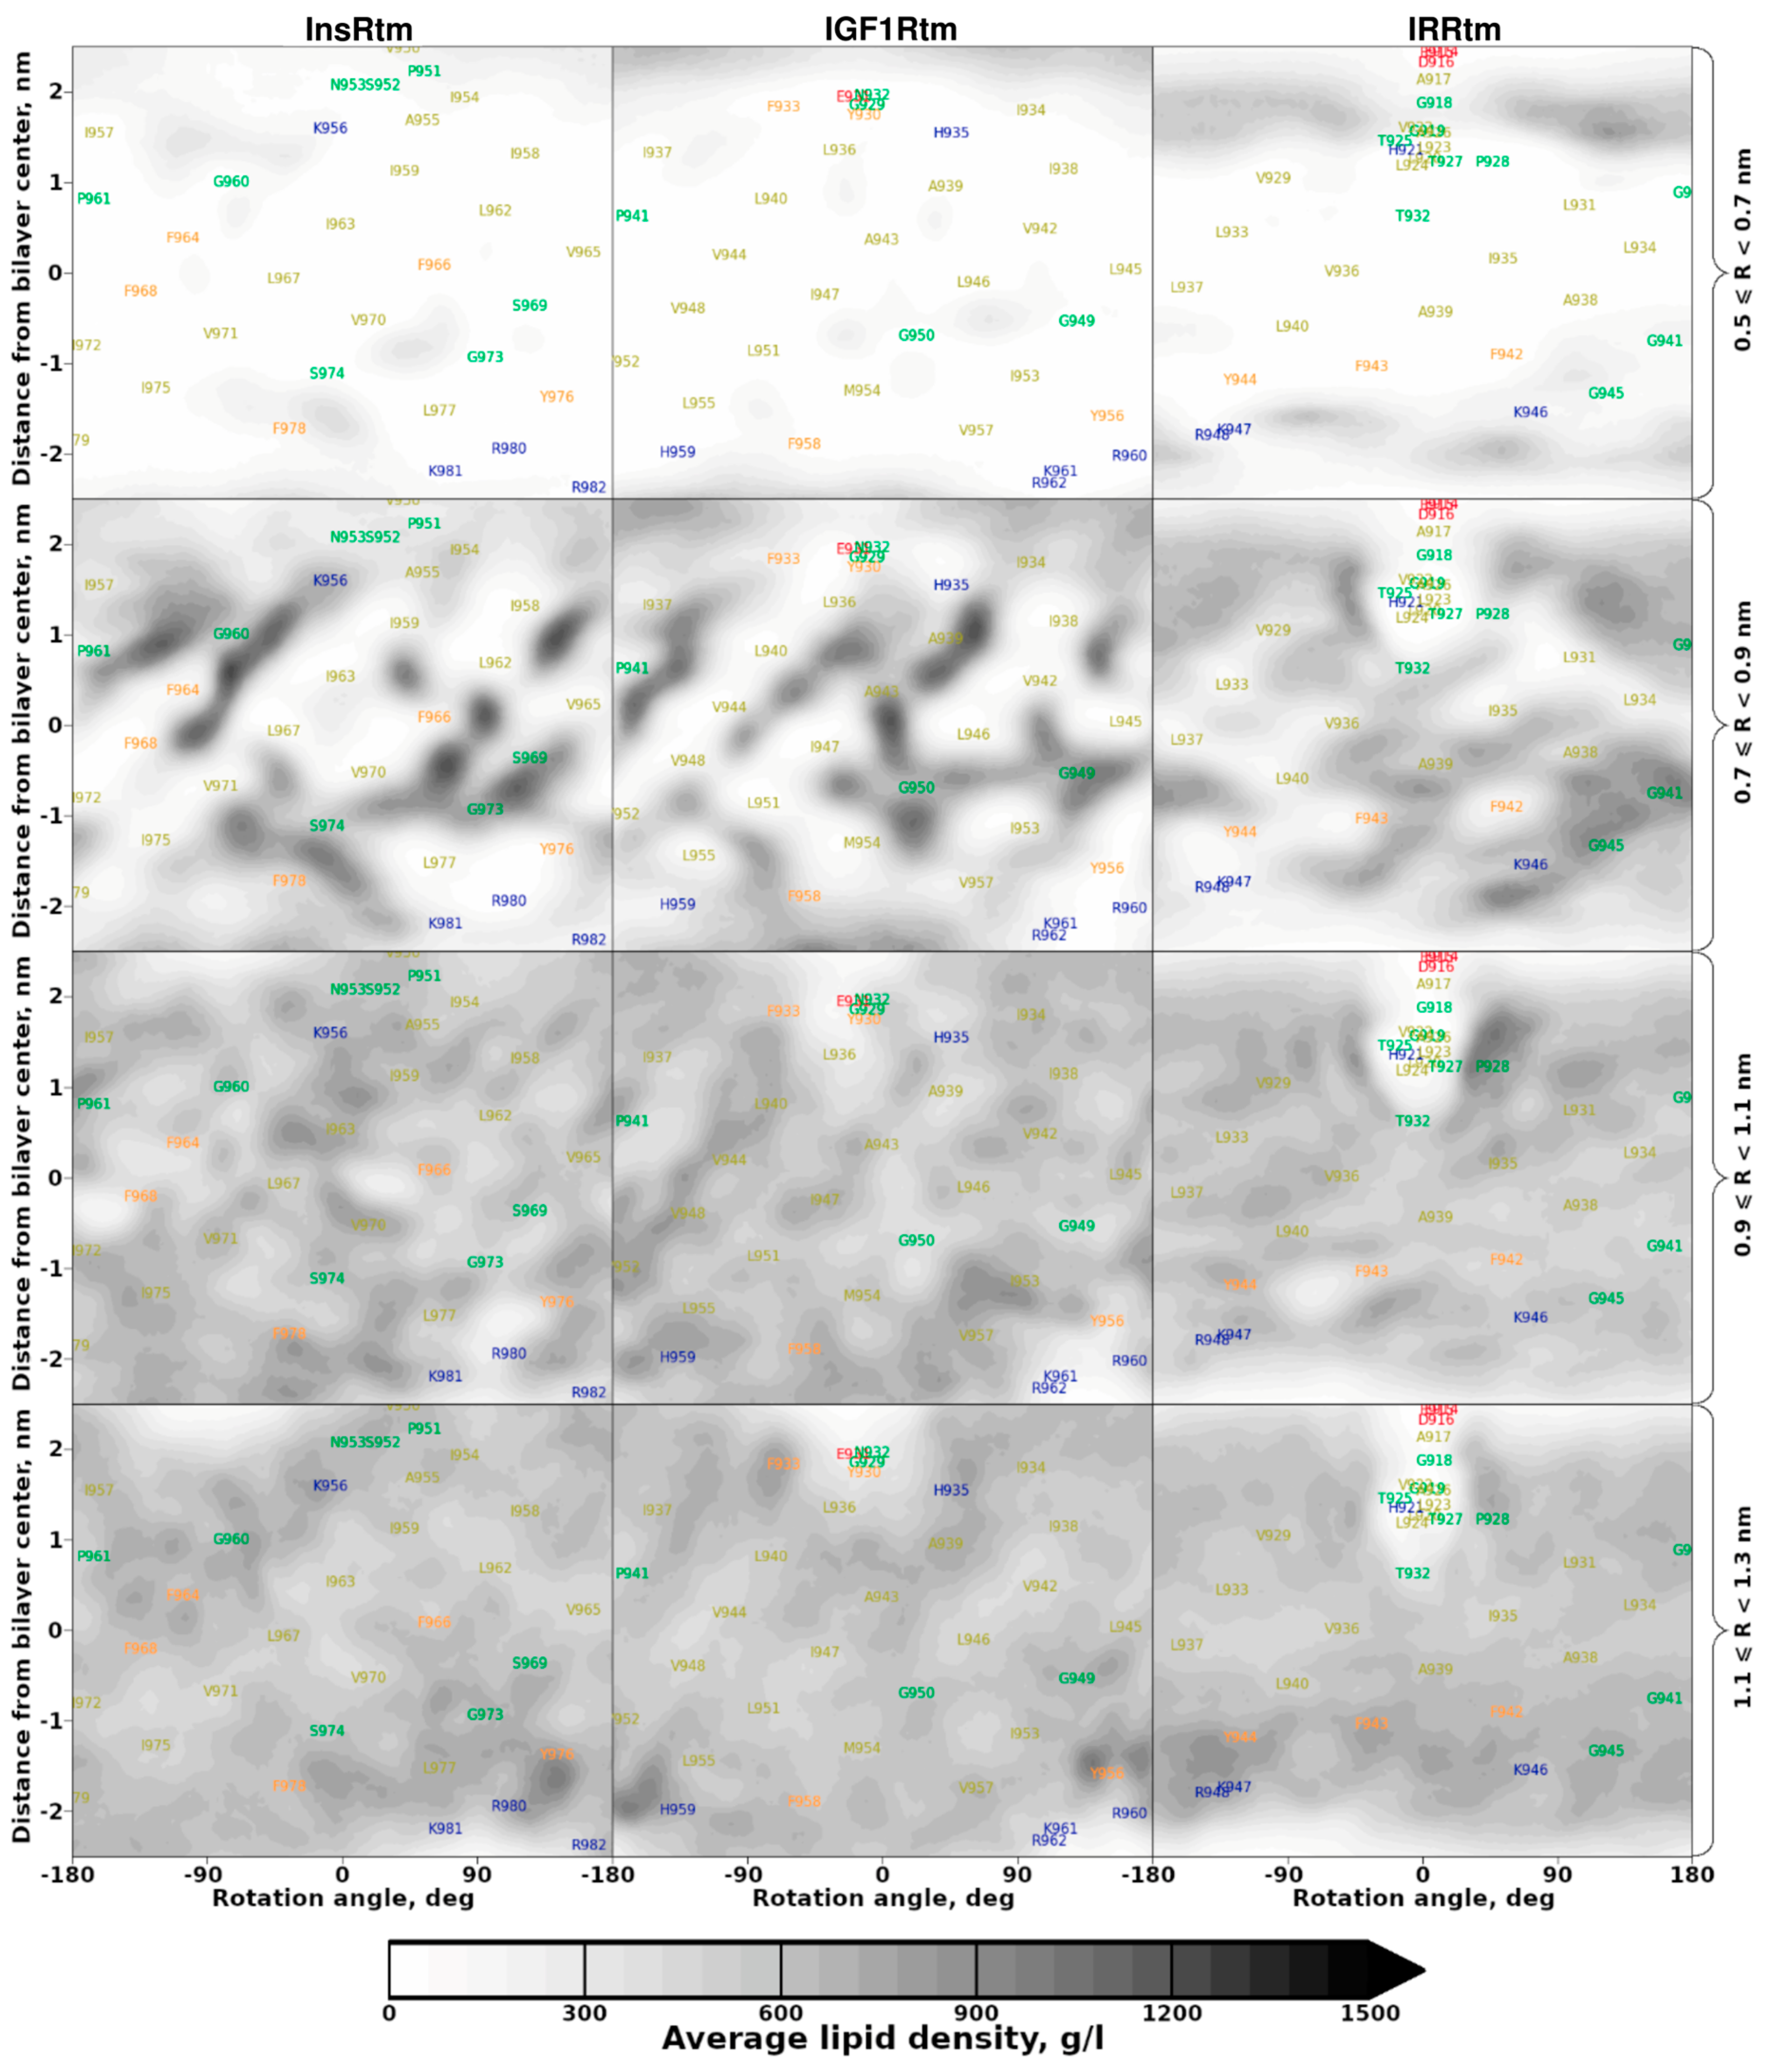
2.2. TMDs of InsR, IGF1R and IRR Dynamically Adapt to Different Lipid Bilayers: MD Simulations

3. Discussion
4. Materials and Methods
4.1. Protein Expression and Purification
4.2. NMR Spectroscopy and Structure Calculation
4.3. Molecular Dynamics in Explicit Lipid Bilayer
5. Conclusions
Supplementary Materials
Author Contributions
Funding
Institutional Review Board Statement
Informed Consent Statement
Data Availability Statement
Acknowledgments
Conflicts of Interest
References
- Lemmon, M.A.; Schlessinger, J. Cell Signaling by Receptor Tyrosine Kinases. Cell 2010, 141, 1117–1134. [Google Scholar] [CrossRef] [PubMed]
- Frasca, F.; Pandini, G.; Sciacca, L.; Pezzino, V.; Squatrito, S.; Belfiore, A.; Vigneri, R. The Role of Insulin Receptors and IGF-I Receptors in Cancer and Other Diseases. Arch. Physiol. Biochem. 2008, 114, 23–37. [Google Scholar] [CrossRef] [PubMed]
- Saltiel, A.R.; Kahn, C.R. Insulin Signalling and the Regulation of Glucose and Lipid Metabolism. Nature 2001, 414, 799–806. [Google Scholar] [CrossRef] [PubMed]
- Craft, S. Insulin Resistance and AD—Extending the Translational. Path. Nat. Rev. Neurol. 2012, 8, 360–362. [Google Scholar] [CrossRef]
- Ebina, Y.; Ellis, L.; Jarnagin, K.; Edery, M.; Graf, L.; Clauser, E.; Ou, J.; Masiarz, F.; Kan, Y.W.; Goldfine, I.D.; et al. The Human Insulin Receptor CDNA: The Structural Basis for Hormone-Activated Transmembrane Signalling. Cell 1985, 40, 747–758. [Google Scholar] [CrossRef]
- Ullrich, A.; Gray, A.; Tam, A.W.; Yang-Feng, T.; Tsubokawa, M.; Collins, C.; Henzel, W.; Bon, T.L.; Kathuria, S.; Chen, E.; et al. Insulin-like Growth Factor I Receptor Primary Structure: Comparison with Insulin Receptor Suggests Structural Determinants That Define Functional Specificity. EMBO J. 1986, 5, 2503–2512. [Google Scholar] [CrossRef]
- Tsujimoto, K.; Tsuji, N.; Ozaki, K.; Ohta, M.; Itoh, N. Insulin Receptor-Related Receptor Messenger Ribonucleic Acid in the Stomach Is Focally Expressed in the Enterochromaffin-like Cells. Endocrinology 1995, 136, 558–561. [Google Scholar] [CrossRef]
- Siddle, K. Signalling by Insulin and IGF Receptors: Supporting Acts and New Players. J. Mol. Endocrinol. 2011, 47, R1–R10. [Google Scholar] [CrossRef]
- Deyev, I.E.; Sohet, F.; Vassilenko, K.P.; Serova, O.V.; Popova, N.V.; Zozulya, S.A.; Burova, E.B.; Houillier, P.; Rzhevsky, D.I.; Berchatova, A.A.; et al. Insulin Receptor-Related Receptor as an Extracellular Alkali Sensor. Cell Metab. 2011, 13, 679–689. [Google Scholar] [CrossRef]
- Yamaoka, M.; Terabayashi, T.; Nishioka, T.; Kaibuchi, K.; Ishikawa, T.; Ishizaki, T.; Kimura, T. IRR Is Involved in Glucose-Induced Endocytosis after Insulin Secretion. J. Pharmacol. Sci. 2019, 140, 300–304. [Google Scholar] [CrossRef]
- Hedo, J.A.; Kahn, C.R.; Hayashi, M.; Yamada, K.M.; Kasuga, M. Biosynthesis and Glycosylation of the Insulin Receptor. Evidence for a Single Polypeptide Precursor of the Two Major Subunits. J. Biol. Chem. 1983, 258, 10020–10026. [Google Scholar] [CrossRef] [PubMed]
- Ullrich, A.; Bell, J.R.; Chen, E.Y.; Herrera, R.; Petruzzelli, L.M.; Dull, T.J.; Gray, A.; Coussens, L.; Liao, Y.-C.; Tsubokawa, M.; et al. Human Insulin Receptor and Its Relationship to the Tyrosine Kinase Family of Oncogenes. Nature 1985, 313, 756–761. [Google Scholar] [CrossRef] [PubMed]
- McKern, N.M.; Lawrence, M.C.; Streltsov, V.A.; Lou, M.-Z.; Adams, T.E.; Lovrecz, G.O.; Elleman, T.C.; Richards, K.M.; Bentley, J.D.; Pilling, P.A.; et al. Structure of the Insulin Receptor Ectodomain Reveals a Folded-over Conformation. Nature 2006, 443, 218–221. [Google Scholar] [CrossRef]
- Croll, T.I.; Smith, B.J.; Margetts, M.B.; Whittaker, J.; Weiss, M.A.; Ward, C.W.; Lawrence, M.C. Higher-Resolution Structure of the Human Insulin Receptor Ectodomain: Multi-Modal Inclusion of the Insert Domain. Structure 2016, 24, 3. [Google Scholar] [CrossRef] [PubMed]
- Scapin, G.; Dandey, V.P.; Zhang, Z.; Prosise, W.; Hruza, A.; Kelly, T.; Mayhood, T.; Strickland, C.; Potter, C.S.; Carragher, B. Structure of the Insulin Receptor–Insulin Complex by Single-Particle Cryo-EM Analysis. Nature 2018, 556, 122–125. [Google Scholar] [CrossRef]
- Xu, Y.; Kong, G.K.-W.; Menting, J.G.; Margetts, M.B.; Delaine, C.A.; Jenkin, L.M.; Kiselyov, V.V.; De Meyts, P.; Forbes, B.E.; Lawrence, M.C. How Ligand Binds to the Type 1 Insulin-like Growth Factor Receptor. Nat. Commun. 2018, 9, 821. [Google Scholar] [CrossRef]
- Shtykova, E.V.; Petoukhov, M.V.; Mozhaev, A.A.; Deyev, I.E.; Dadinova, L.A.; Loshkarev, N.A.; Goryashchenko, A.S.; Bocharov, E.V.; Jeffries, C.M.; Svergun, D.I.; et al. The Dimeric Ectodomain of the Alkali-Sensing Insulin Receptor–Related Receptor (EctoIRR) Has a Droplike Shape. J. Biol. Chem. 2019, 294, 17790–17798. [Google Scholar] [CrossRef]
- Li, J.; Choi, E.; Yu, H.; Bai, X. Structural Basis of the Activation of Type 1 Insulin-like Growth Factor Receptor. Nat. Commun. 2019, 10, 4567. [Google Scholar] [CrossRef]
- Gutmann, T.; Kim, K.H.; Grzybek, M.; Walz, T.; Coskun, Ü. Visualization of Ligand-Induced Transmembrane Signaling in the Full-Length Human Insulin Receptor. J. Cell Biol. 2018, 217, 1643–1649. [Google Scholar] [CrossRef]
- Uchikawa, E.; Choi, E.; Shang, G.; Yu, H.; Bai, X. Activation Mechanism of the Insulin Receptor Revealed by Cryo-EM Structure of the Fully Liganded Receptor–Ligand Complex. eLife 2019, 8, e48630. [Google Scholar] [CrossRef]
- Nielsen, J.; Brandt, J.; Boesen, T.; Hummelshøj, T.; Slaaby, R.; Schluckebier, G.; Nissen, P. Structural Investigations of Full-Length Insulin Receptor Dynamics and Signalling. J. Mol. Biol. 2022, 434, 167458. [Google Scholar] [CrossRef]
- Batishchev, O.V.; Kuzmina, N.V.; Mozhaev, A.A.; Goryashchenko, A.S.; Mileshina, E.D.; Orsa, A.N.; Bocharov, E.V.; Deyev, I.E.; Petrenko, A.G. Activity-Dependent Conformational Transitions of the Insulin Receptor–Related Receptor. J. Biol. Chem. 2021, 296, 100534. [Google Scholar] [CrossRef] [PubMed]
- Gardin, A.; Auzan, C.; Clauser, E.; Malherbe, T.; Aunis, D.; Crémel, G.; Hubert, P. Substitution of the Insulin Receptor Transmembrane Domain with That of Glycophorin A Inhibits Insulin Action. FASEB J. 1999, 13, 1347–1357. [Google Scholar] [CrossRef] [PubMed]
- Takahashi, K.; Yonezawa, K.; Nishimoto, I. Insulin-like Growth Factor I Receptor Activated by a Transmembrane Mutation. J. Biol. Chem. 1995, 270, 19041–19045. [Google Scholar] [CrossRef] [PubMed]
- Longo, N.; Shuster, R.C.; Griffin, L.D.; Langley, S.D.; Elsas, L.J. Activation of Insulin Receptor Signaling by a Single Amino Acid Substitution in the Transmembrane Domain. J. Biol. Chem. 1992, 267, 12416–12419. [Google Scholar] [CrossRef]
- Li, Q.; Wong, Y.L.; Kang, C. Solution Structure of the Transmembrane Domain of the Insulin Receptor in Detergent Micelles. Biochim. Biophys. Acta Biomembr. 2014, 1838, 1313–1321. [Google Scholar] [CrossRef]
- Mohammadiarani, H.; Vashisth, H. All-Atom Structural Models of the Transmembrane Domains of Insulin and Type 1 Insulin-Like Growth Factor Receptors. Front. Endocrinol. 2016, 7, 68. [Google Scholar] [CrossRef]
- Kuznetsov, A.S.; Zamaletdinov, M.F.; Bershatsky, Y.V.; Urban, A.S.; Bocharova, O.V.; Bennasroune, A.; Maurice, P.; Bocharov, E.V.; Efremov, R.G. Dimeric States of Transmembrane Domains of Insulin and IGF-1R Receptors: Structures and Possible Role in Activation. Biochim. Biophys. Acta Biomembr. 2020, 1862, 183417. [Google Scholar] [CrossRef]
- Kavran, J.M.; McCabe, J.M.; Byrne, P.O.; Connacher, M.K.; Wang, Z.; Ramek, A.; Sarabipour, S.; Shan, Y.; Shaw, D.E.; Hristova, K.; et al. How IGF-1 Activates Its Receptor. eLife 2014, 3, e03772. [Google Scholar] [CrossRef]
- Cavanagh, J. (Ed.) Protein NMR Spectroscopy: Principles and Practice, 2nd ed.; Academic Press: Amsterdam, The Netherlands; Boston, MA, USA, 2007; 885p, ISBN 978-0-12-164491-8. [Google Scholar]
- Sattler, M. Heteronuclear Multidimensional NMR Experiments for the Structure Determination of Proteins in Solution Employing Pulsed Field Gradients. Prog. Nucl. Magn. Reson. Spectrosc. 1999, 34, 93–158. [Google Scholar] [CrossRef]
- Mielke, S.P.; Krishnan, V.V. Characterization of Protein Secondary Structure from NMR Chemical Shifts. Prog. Nucl. Magn. Reson. Spectrosc. 2009, 54, 141–165. [Google Scholar] [PubMed]
- Güntert, P. Automated NMR Structure Calculation with CYANA. Protein NMR Techniques; Humana Press: New Jersey, NJ, USA, 2004; Volume 278, pp. 353–378. ISBN 978-1-59259-809-0. [Google Scholar]
- Chill, J.H.; Louis, J.M.; Baber, J.L.; Bax, A. Measurement of 15N Relaxation in the Detergent-Solubilized Tetrameric KcsA Potassium Channel. J. Biomol. NMR 2006, 36, 123–136. [Google Scholar] [CrossRef]
- Shen, Y.; Bax, A. Protein Backbone and Sidechain Torsion Angles Predicted from NMR Chemical Shifts Using Artificial Neural Networks. J. Biomol. NMR 2013, 56, 227–241. [Google Scholar] [CrossRef] [PubMed]
- Wagner, G.; Pardi, A.; Wuethrich, K. Hydrogen Bond Length and Proton NMR Chemical Shifts in Proteins. J. Am. Chem. Soc. 1983, 105, 5948–5949. [Google Scholar] [CrossRef]
- Hwang, T.-L.; van Zijl, P.C.M.; Mori, S. Accurate Quantitation of Water-Amide Proton Exchange Rates Using the Phase-Modulated CLEAN Chemical EXchange (CLEANEX-PM) Approach with a Fast-HSQC (FHSQC) Detection Scheme. J. Biomol. NMR 1998, 11, 221–226. [Google Scholar] [CrossRef] [PubMed]
- Cybulski, L.E.; de Mendoza, D. Bilayer Hydrophobic Thickness and Integral Membrane Protein Function. Curr. Protein Pept. Sci. 2011, 12, 760–766. [Google Scholar] [CrossRef]
- Bocharov, E.V.; Mineev, K.S.; Pavlov, K.V.; Akimov, S.A.; Kuznetsov, A.S.; Efremov, R.G.; Arseniev, A.S. Helix-Helix Interactions in Membrane Domains of Bitopic Proteins: Specificity and Role of Lipid Environment. Biochim. Biophys. Acta Biomembr. 2017, 1859, 561–576. [Google Scholar]
- Bocharov, E.V.; Sharonov, G.V.; Bocharova, O.V.; Pavlov, K.V. Conformational Transitions and Interactions Underlying the Function of Membrane Embedded Receptor Protein Kinases. Biochim. Biophys. Acta Biomembr. 2017, 1859, 1417–1429. [Google Scholar]
- Polyansky, A.A.; Chugunov, A.O.; Volynsky, P.E.; Krylov, N.A.; Nolde, D.E.; Efremov, R.G. PREDDIMER: A Web Server for Prediction of Transmembrane Helical Dimers. Bioinformatics 2014, 30, 889–890. [Google Scholar] [CrossRef]
- Efremov, R.G.; Alix, A.J.P. Environmental Characteristics of Residues in Proteins: Three-Dimensional Molecular Hydrophobicity Potential Approach. J. Biomol. Struct. Dyn. 1993, 11, 483–507. [Google Scholar] [CrossRef]
- Bugge, K.; Lindorff-Larsen, K.; Kragelund, B.B. Understanding Single-Pass Transmembrane Receptor Signaling from a Structural Viewpoint—What Are We Missing? FEBS J. 2016, 283, 4424–4451. [Google Scholar] [CrossRef] [PubMed]
- Trenker, R.; Call, M.J.; Call, M.E. Progress and Prospects for Structural Studies of Transmembrane Interactions in Single-Spanning Receptors. Curr. Opin. Struct. Biol. 2016, 39, 115–123. [Google Scholar] [PubMed]
- Polyansky, A.A.; Bocharov, E.V.; Velghe, A.I.; Kuznetsov, A.S.; Bocharova, O.V.; Urban, A.S.; Arseniev, A.S.; Zagrovic, B.; Demoulin, J.-B.; Efremov, R.G. Atomistic Mechanism of the Constitutive Activation of PDGFRA via Its Transmembrane Domain. Biochim. Biophys. Acta Gen. Subj. 2019, 1863, 82–95. [Google Scholar] [CrossRef] [PubMed]
- Bocharov, E.V.; Bragin, P.E.; Pavlov, K.V.; Bocharova, O.V.; Mineev, K.S.; Polyansky, A.A.; Volynsky, P.E.; Efremov, R.G.; Arseniev, A.S. The Conformation of the Epidermal Growth Factor Receptor Transmembrane Domain Dimer Dynamically Adapts to the Local Membrane Environment. Biochemistry 2017, 56, 1697–1705. [Google Scholar] [PubMed]
- Arkhipov, A.; Shan, Y.; Das, R.; Endres, N.F.; Eastwood, M.P.; Wemmer, D.E.; Kuriyan, J.; Shaw, D.E. Architecture and Membrane Interactions of the EGF Receptor. Cell 2013, 152, 557–569. [Google Scholar] [CrossRef]
- Volynsky, P.E.; Polyansky, A.A.; Fakhrutdinova, G.N.; Bocharov, E.V.; Efremov, R.G. Role of Dimerization Efficiency of Transmembrane Domains in Activation of Fibroblast Growth Factor Receptor 3. J. Am. Chem. Soc. 2013, 135, 8105–8108. [Google Scholar] [CrossRef]
- Martín-Segura, A.; Ahmed, T.; Casadomé-Perales, Á.; Palomares-Perez, I.; Palomer, E.; Kerstens, A.; Munck, S.; Balschun, D.; Dotti, C.G. Age-Associated Cholesterol Reduction Triggers Brain Insulin Resistance by Facilitating Ligand-Independent Receptor Activation and Pathway Desensitization. Aging Cell 2019, 18, e12932. [Google Scholar] [CrossRef]
- Delle Bovi, R.J.; Kim, J.; Suresh, P.; London, E.; Miller, W.T. Sterol Structure Dependence of Insulin Receptor and Insulin-like Growth Factor 1 Receptor Activation. Biochim. Biophys. Acta Biomembr. 2019, 1861, 819–826. [Google Scholar]
- Bocharova, O.V.; Urban, A.S.; Nadezhdin, K.D.; Bocharov, E.V.; Arseniev, A.S. Cell-Free Expression of the APP Transmembrane Fragments with Alzheimer’s Disease Mutations Using Algal Amino Acid Mixture for Structural NMR Studies. Protein Expr. Purif. 2016, 123, 105–111. [Google Scholar] [CrossRef]
- Schägger, H.; von Jagow, G. Tricine-Sodium Dodecyl Sulfate-Polyacrylamide Gel Electrophoresis for the Separation of Proteins in the Range from 1 to 100 KDa. Anal. Biochem. 1987, 166, 368–379. [Google Scholar] [CrossRef]
- Keller, R. The Computer Aided Resonance Assignment Tutorial; Cantina Verl.: Goldau, Switzerland, 2004; ISBN 978-3-85600-112-4. [Google Scholar]
- Favier, A.; Brutscher, B. Recovering Lost Magnetization: Polarization Enhancement in Biomolecular NMR. J. Biomol. NMR 2011, 49, 9–15. [Google Scholar] [PubMed]
- Kazimierczuk, K.; Orekhov, V.Y. A Comparison of Convex and Non-Convex Compressed Sensing Applied to Multidimensional NMR. A comparison of convex and non-convex compressed sensing applied to multidimensional NMR. J. Magn. Reson. 2012, 223, 1–10. [Google Scholar] [CrossRef] [PubMed]


Disclaimer/Publisher’s Note: The statements, opinions and data contained in all publications are solely those of the individual author(s) and contributor(s) and not of MDPI and/or the editor(s). MDPI and/or the editor(s) disclaim responsibility for any injury to people or property resulting from any ideas, methods, instructions or products referred to in the content. |
© 2023 by the authors. Licensee MDPI, Basel, Switzerland. This article is an open access article distributed under the terms and conditions of the Creative Commons Attribution (CC BY) license (https://creativecommons.org/licenses/by/4.0/).
Share and Cite
Bershatsky, Y.V.; Kuznetsov, A.S.; Idiatullina, A.R.; Bocharova, O.V.; Dolotova, S.M.; Gavrilenkova, A.A.; Serova, O.V.; Deyev, I.E.; Rakitina, T.V.; Zangieva, O.T.; et al. Diversity of Structural, Dynamic, and Environmental Effects Explain a Distinctive Functional Role of Transmembrane Domains in the Insulin Receptor Subfamily. Int. J. Mol. Sci. 2023, 24, 3906. https://doi.org/10.3390/ijms24043906
Bershatsky YV, Kuznetsov AS, Idiatullina AR, Bocharova OV, Dolotova SM, Gavrilenkova AA, Serova OV, Deyev IE, Rakitina TV, Zangieva OT, et al. Diversity of Structural, Dynamic, and Environmental Effects Explain a Distinctive Functional Role of Transmembrane Domains in the Insulin Receptor Subfamily. International Journal of Molecular Sciences. 2023; 24(4):3906. https://doi.org/10.3390/ijms24043906
Chicago/Turabian StyleBershatsky, Yaroslav V., Andrey S. Kuznetsov, Aisha R. Idiatullina, Olga V. Bocharova, Sofya M. Dolotova, Alina A. Gavrilenkova, Oxana V. Serova, Igor E. Deyev, Tatiana V. Rakitina, Olga T. Zangieva, and et al. 2023. "Diversity of Structural, Dynamic, and Environmental Effects Explain a Distinctive Functional Role of Transmembrane Domains in the Insulin Receptor Subfamily" International Journal of Molecular Sciences 24, no. 4: 3906. https://doi.org/10.3390/ijms24043906
APA StyleBershatsky, Y. V., Kuznetsov, A. S., Idiatullina, A. R., Bocharova, O. V., Dolotova, S. M., Gavrilenkova, A. A., Serova, O. V., Deyev, I. E., Rakitina, T. V., Zangieva, O. T., Pavlov, K. V., Batishchev, O. V., Britikov, V. V., Usanov, S. A., Arseniev, A. S., Efremov, R. G., & Bocharov, E. V. (2023). Diversity of Structural, Dynamic, and Environmental Effects Explain a Distinctive Functional Role of Transmembrane Domains in the Insulin Receptor Subfamily. International Journal of Molecular Sciences, 24(4), 3906. https://doi.org/10.3390/ijms24043906