
Application of RSM Method for Optimization of Geraniol Transformation Process in the Presence of Garnet

Abstract
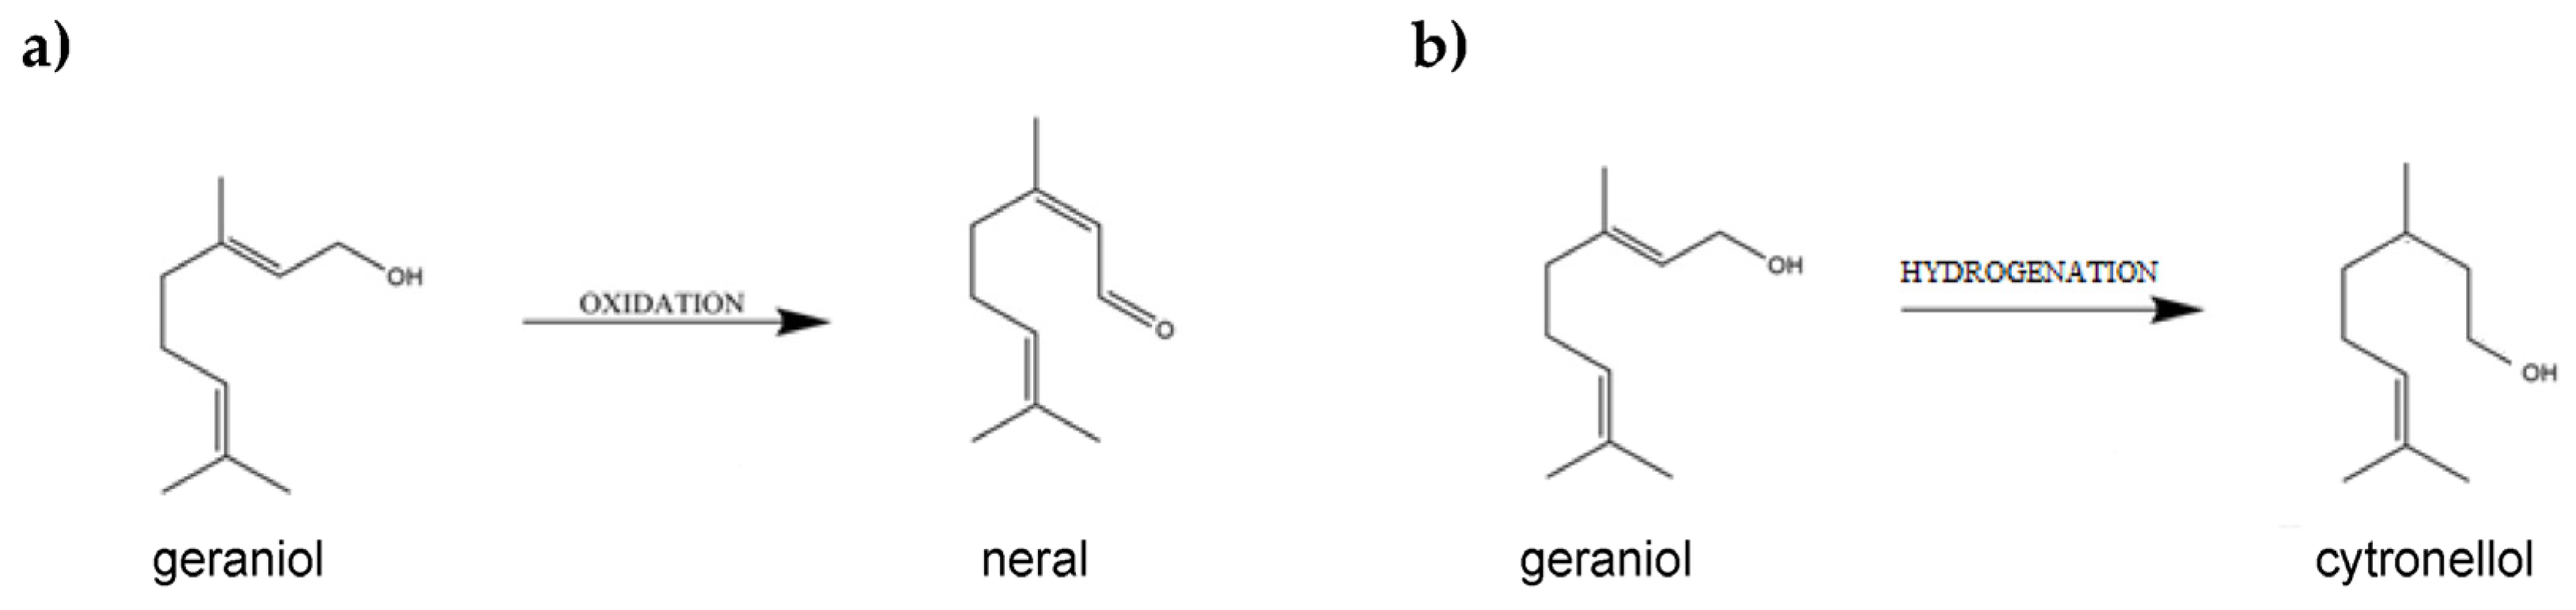
1. Introduction
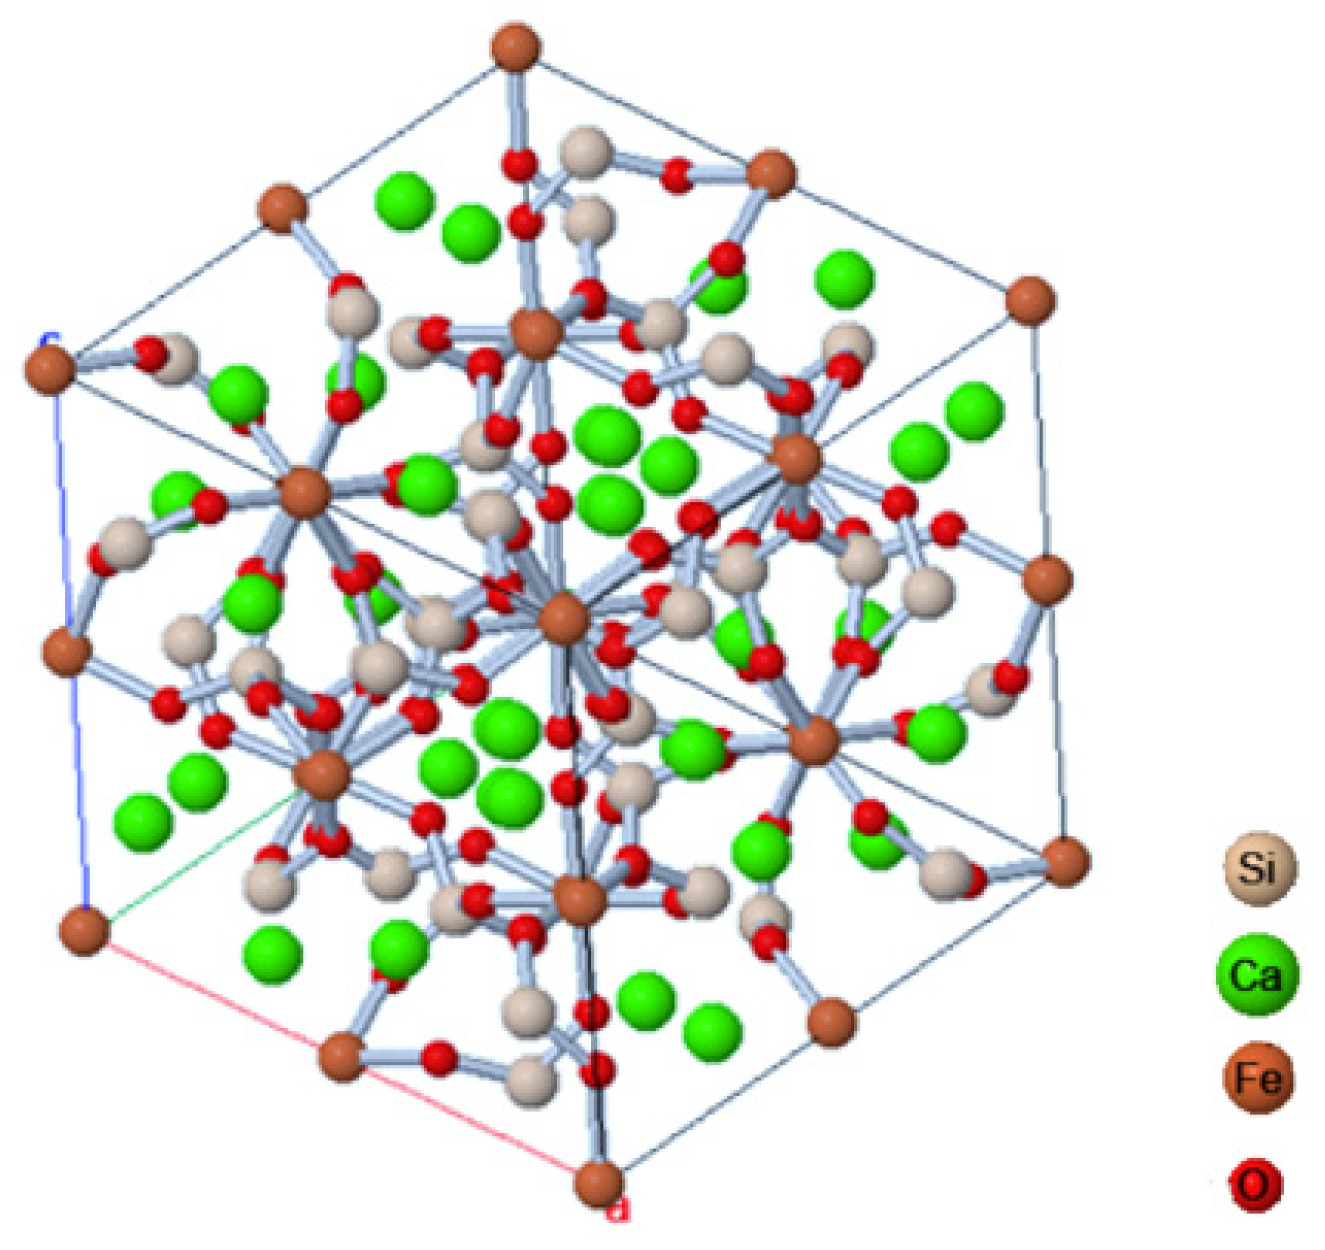
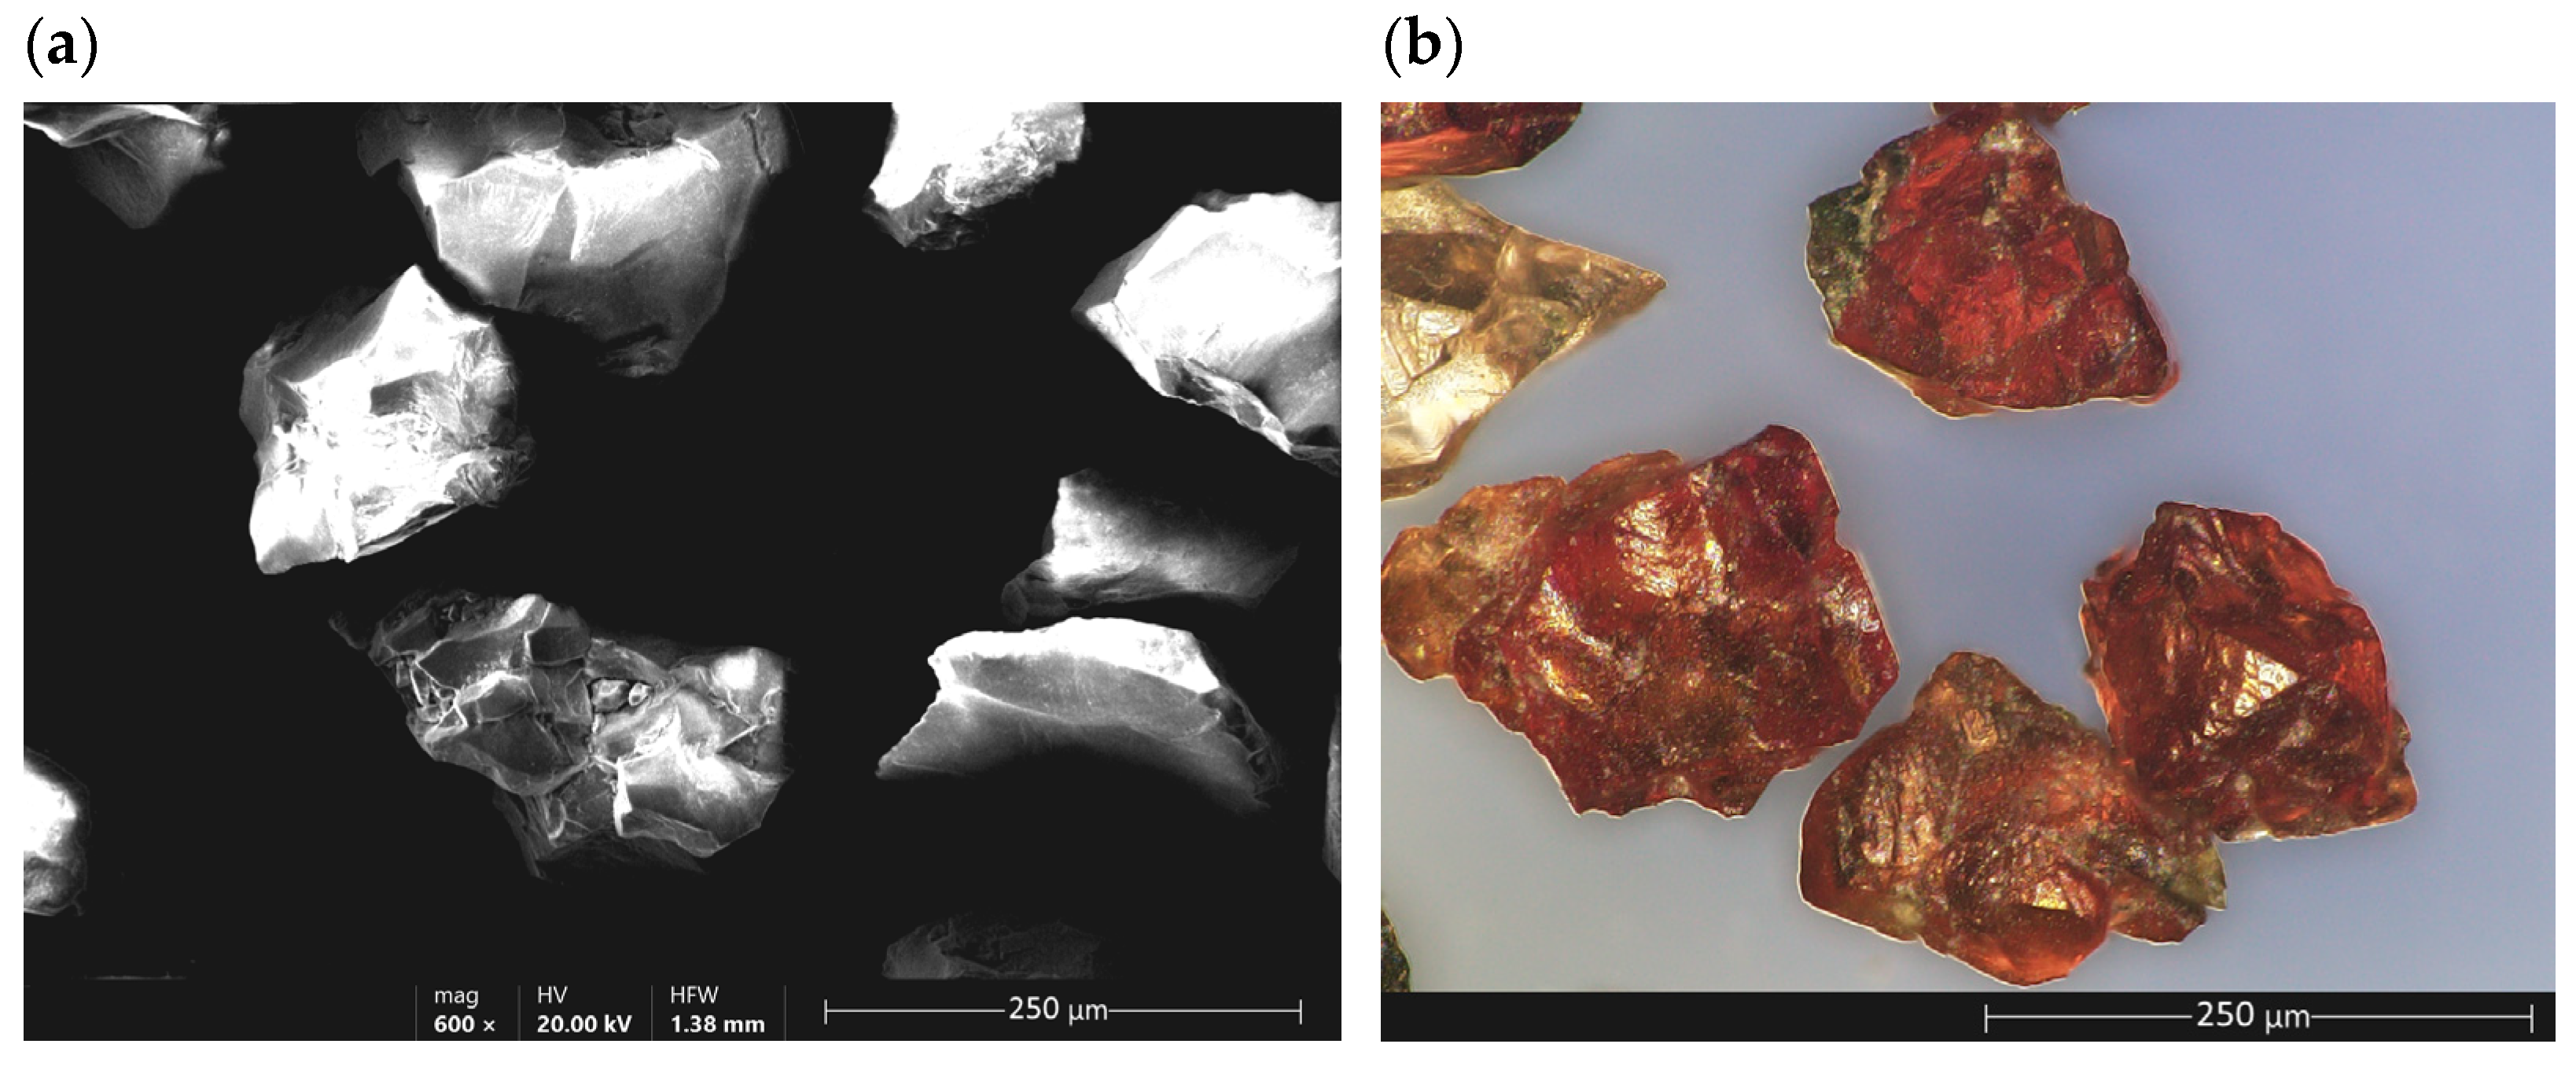
Garnet and Its Properties
2. Results and Discussion
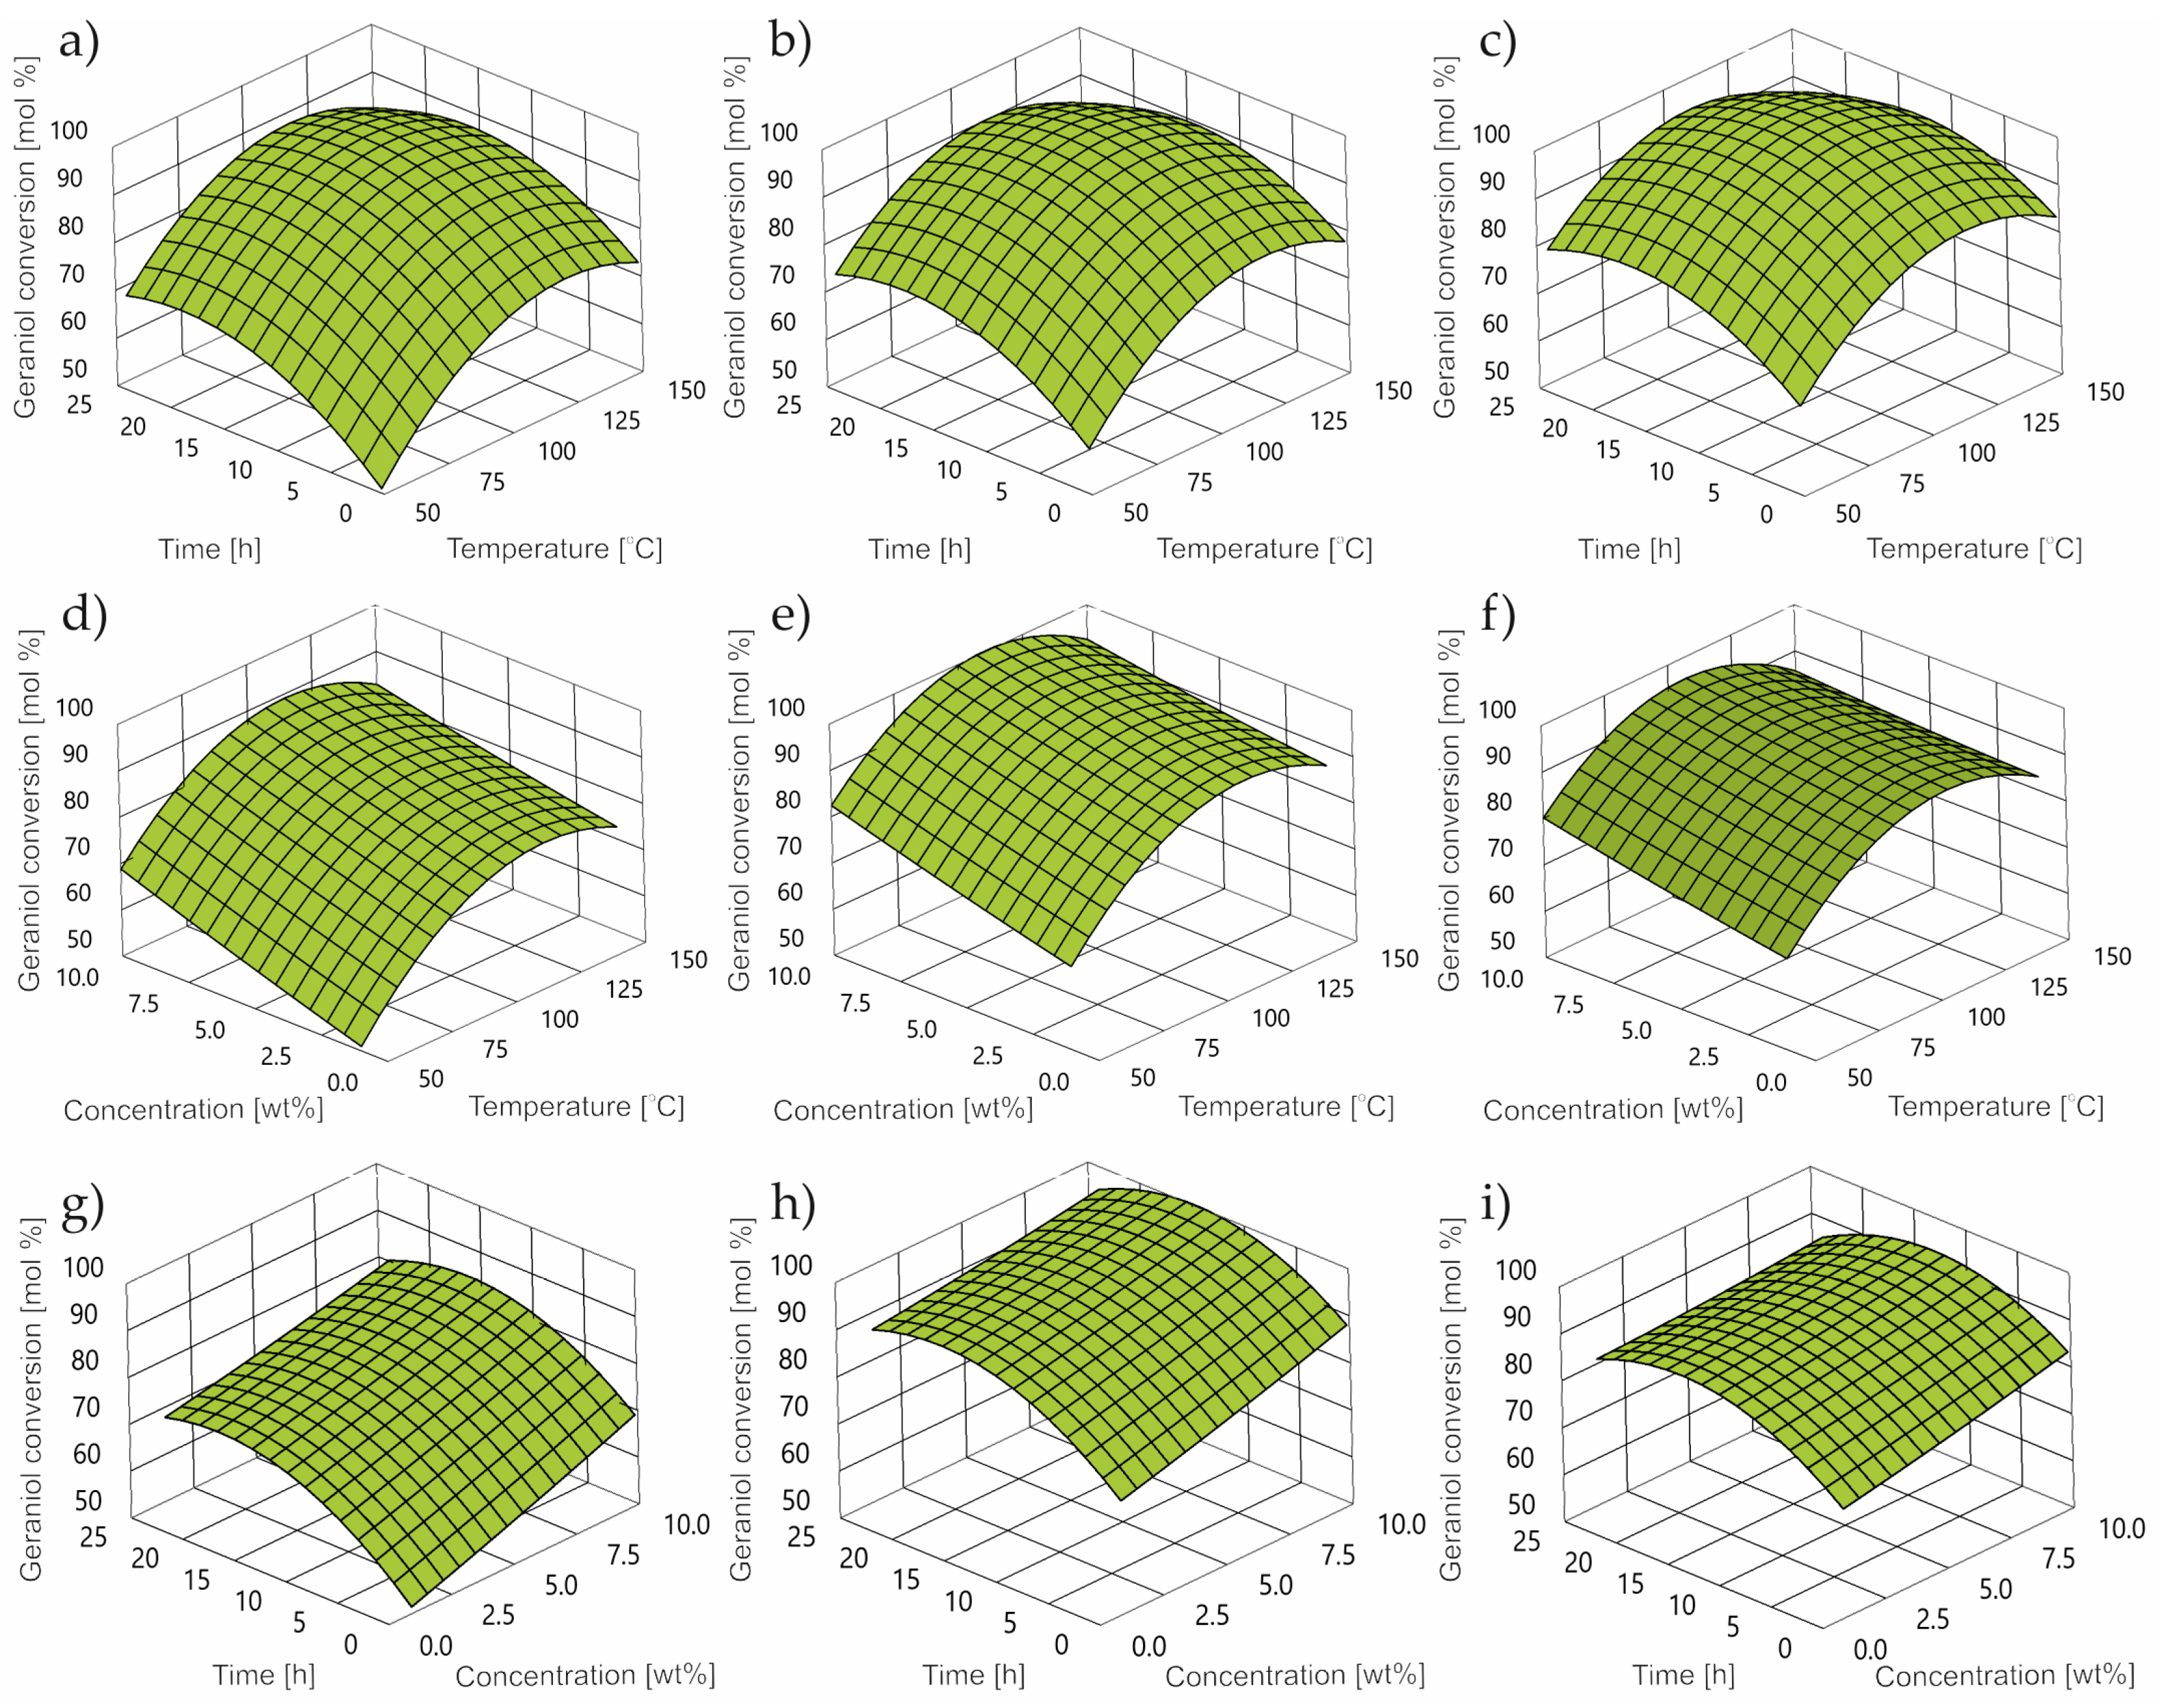
2.1. Impact of Control Factors on GA Conversion
- CG is conversion of geraniol [wt%];
- T is temperature [°C];
- C is concentration [wt%];
- τ is time [h].
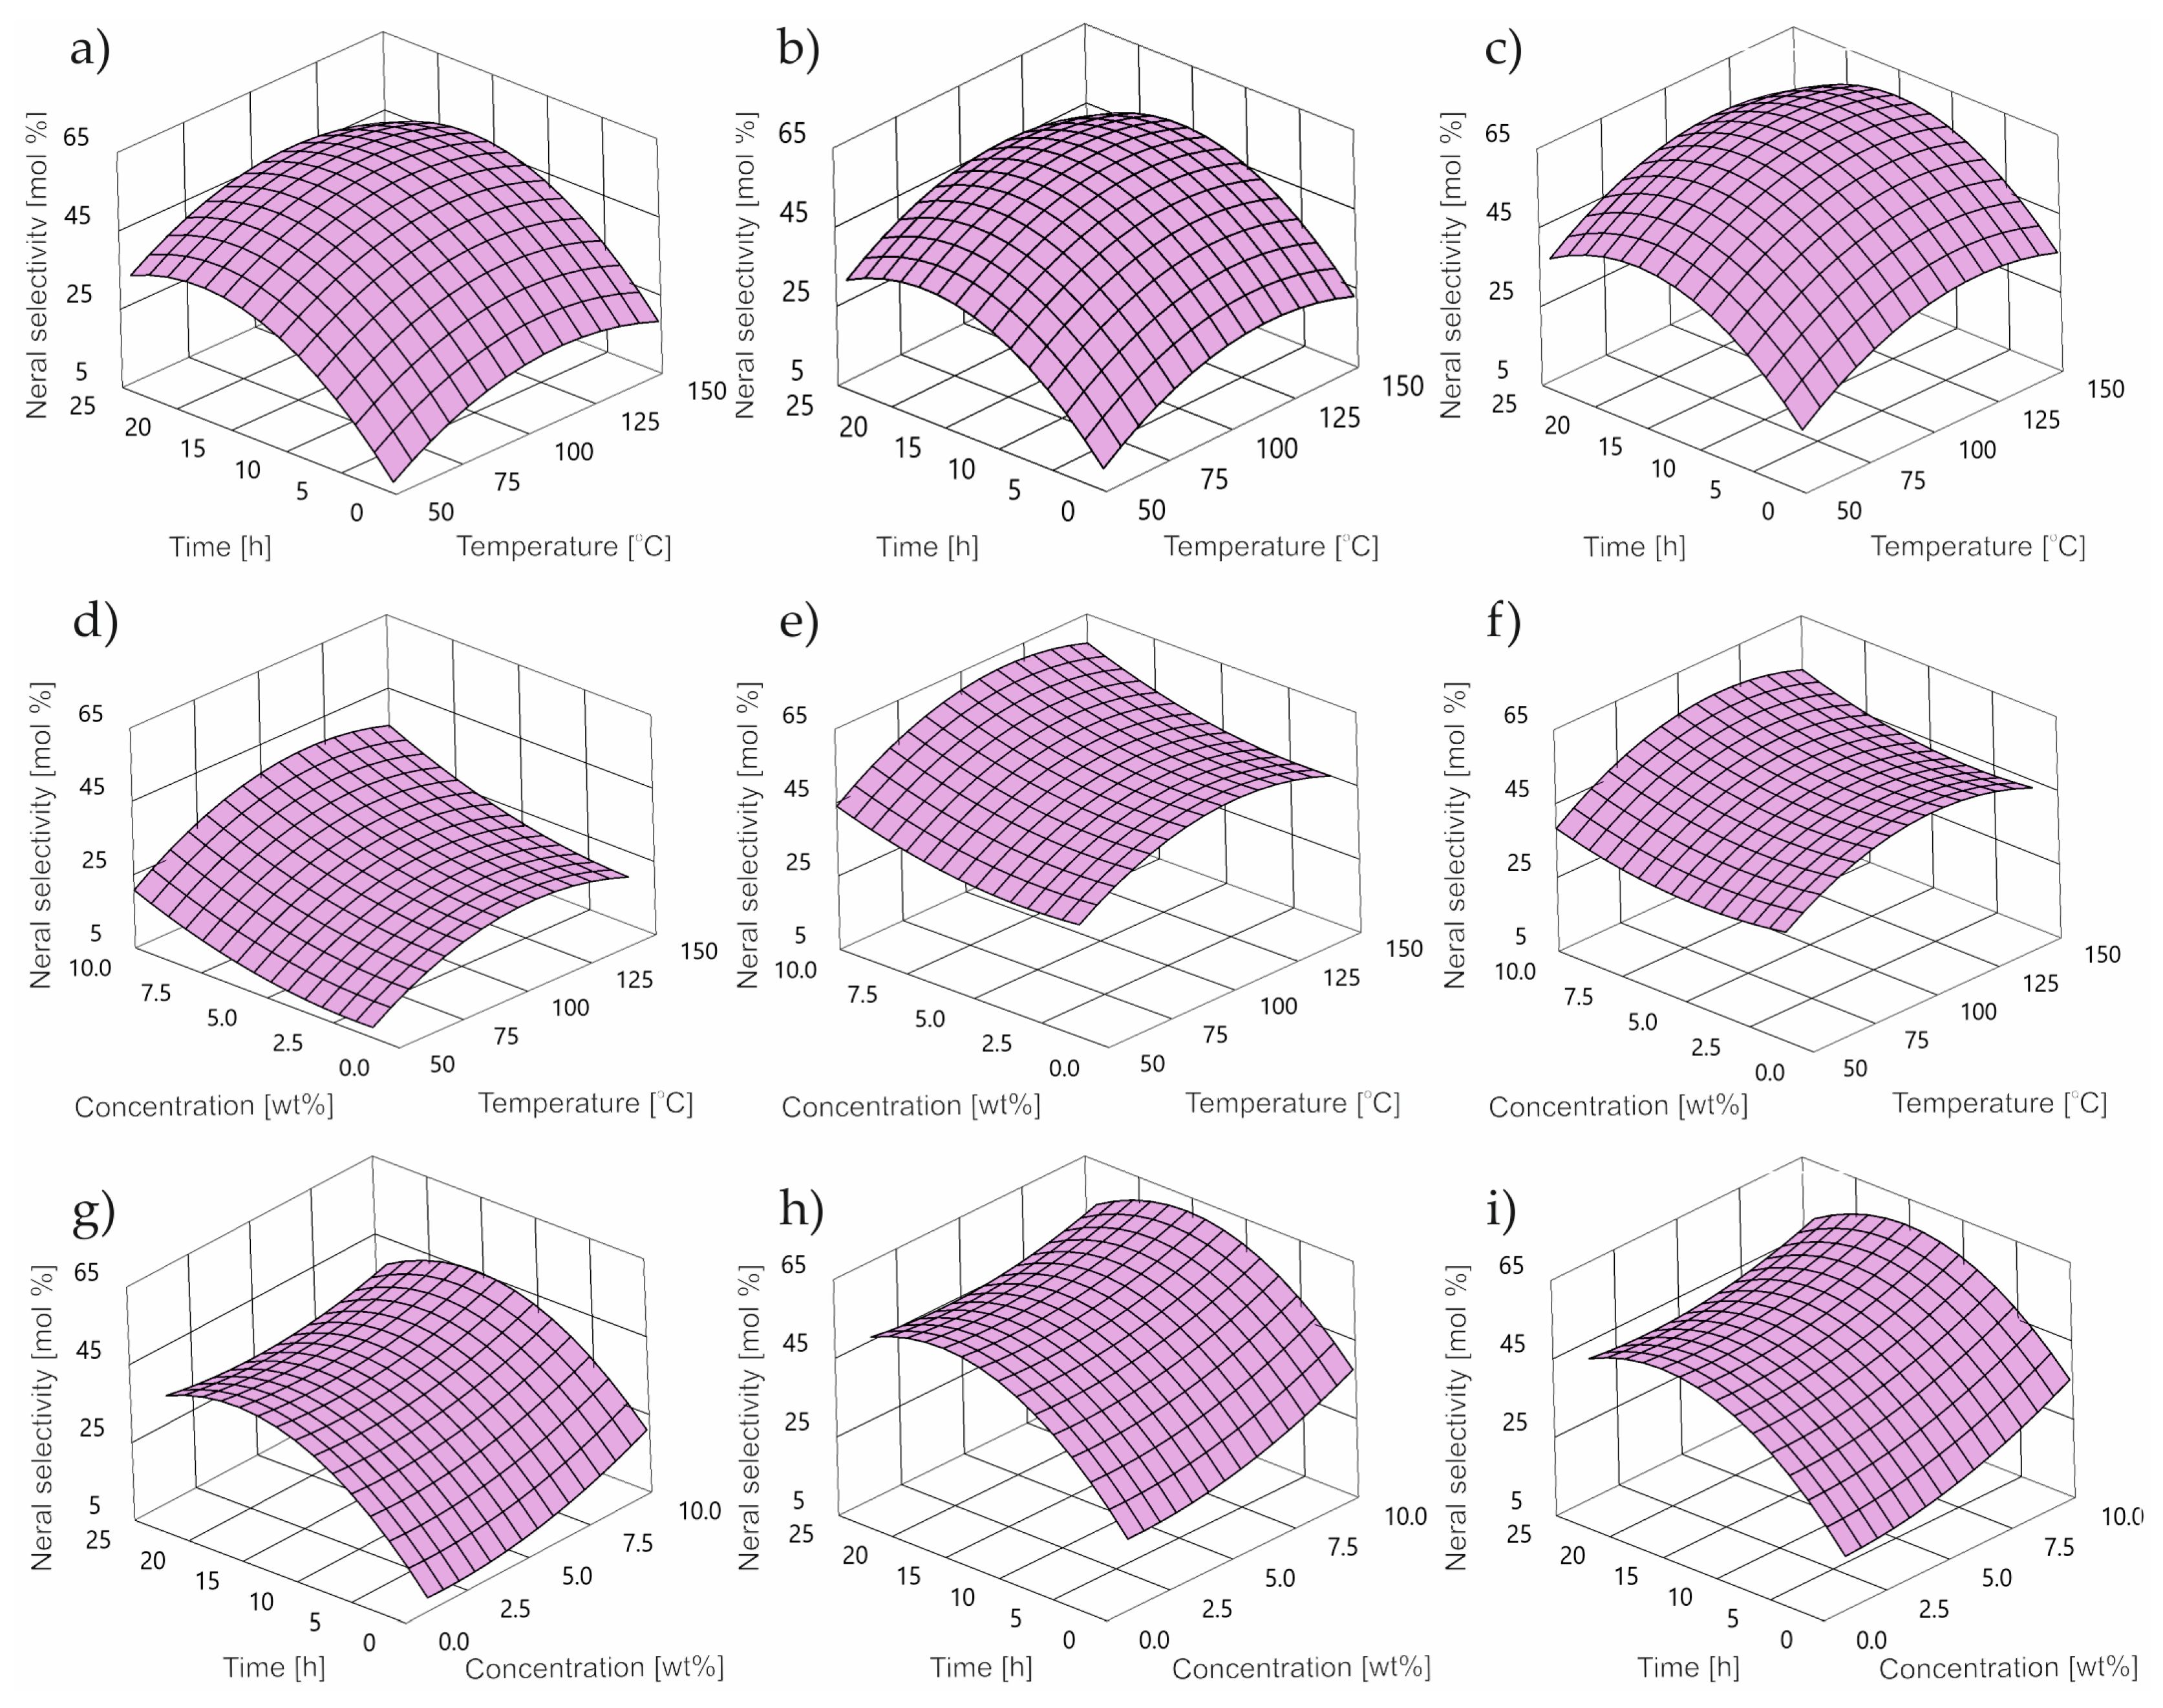
2.2. Impact of Control Factors on NE Selectivity
- DS is NE selectivity [wt%];
- T is temperature [°C];
- C is concentration [wt%];
- τ is time [h].
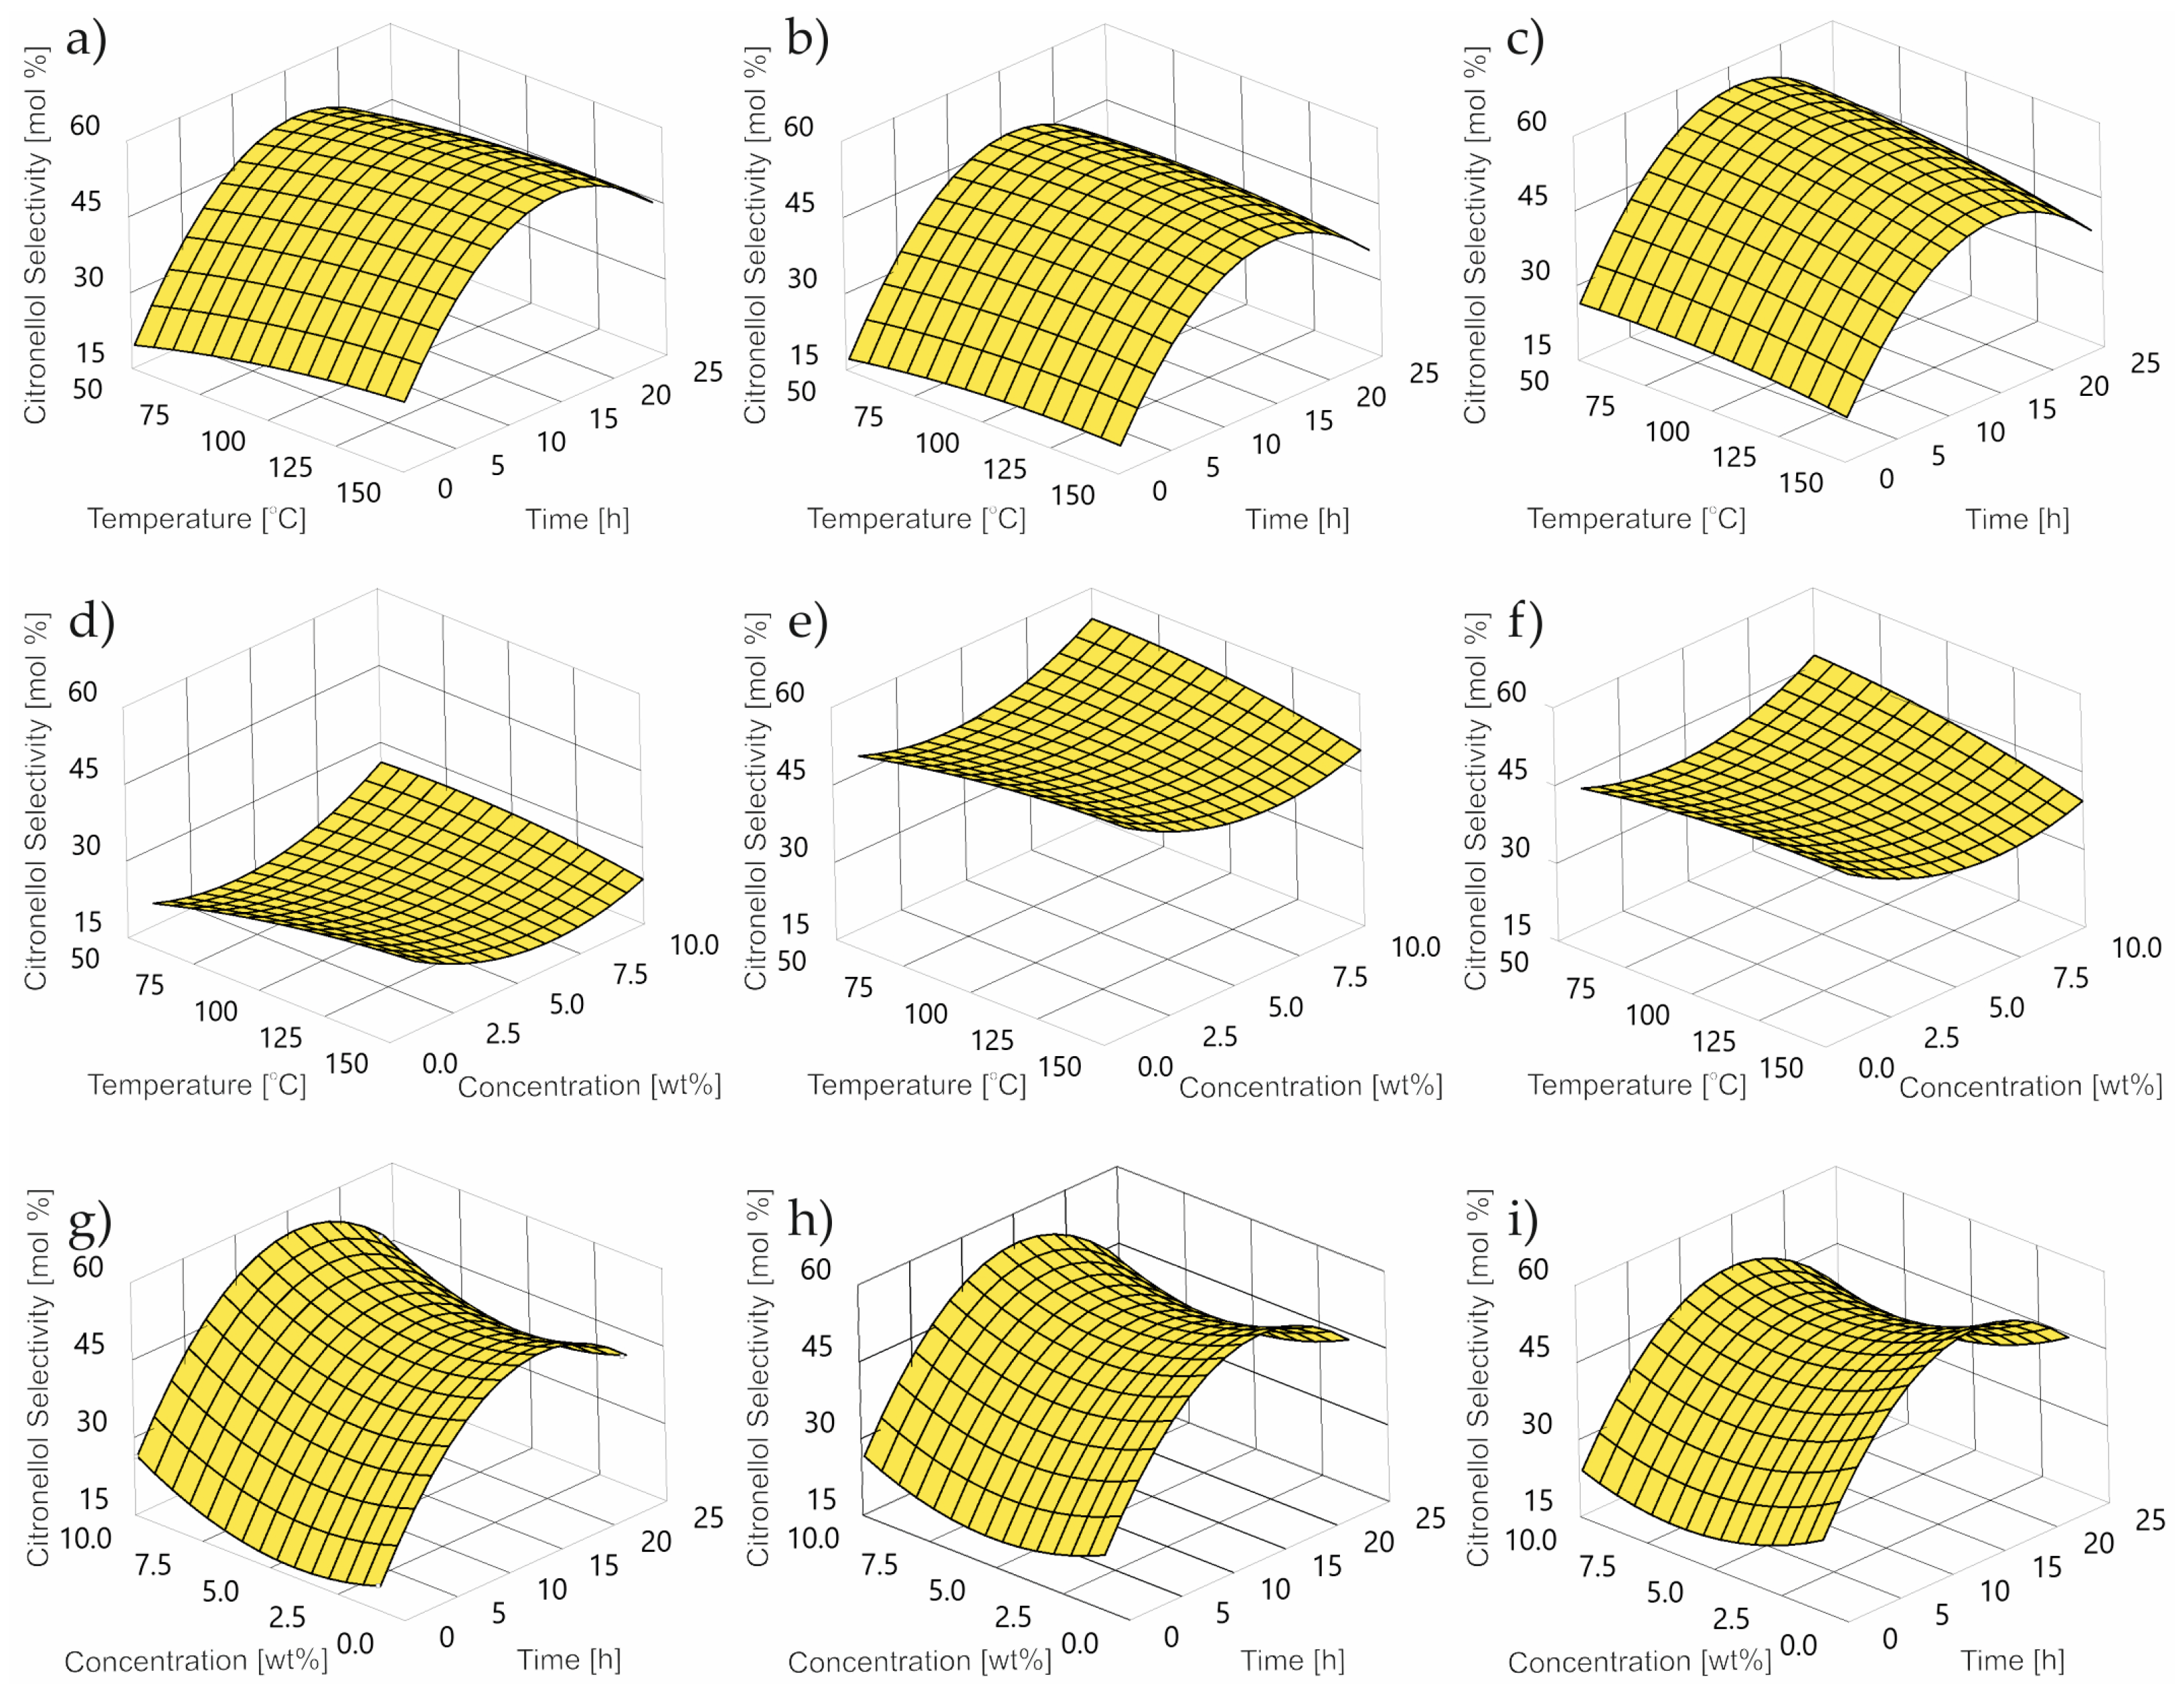
2.3. Impact of Control Factors on CL selectivity
- TS is thumbergol selectivity wt%;
- T is temperature °C;
- C is concentration wt%;
- τ is time h.
2.4. Composite Desirability Coefficient
3. Materials and Methods
- GA conversion Cgeraniol:
- 2.
- Selectivity to the key products (NE and CL) Sproduct/geraniol:
- y is the dependent variable (response);
- xi shows values of the i-th cutting parameter;
- β0, βi, βii are the factors of regressions;
- ε is the error acquiring in the cutting.
4. Conclusions
- For the GA conversion, the optimum was obtained at 94 mol% at 60 °C, a catalyst concentration of 5.0 wt% and a reaction time of 2 h.
- For NE selectivity, the optimum value was reached at 49 mol% at 60 °C, a catalyst concentration equal to 2.5 (5.0) wt% mole and a reaction time of almost 2 h.
- For CL selectivity, the optimum value of 49 mol% was obtained for control factors: a temperature equal to 20 °C, a catalyst concentration equal to 5.0 wt% and a response time equal to 2 h.
- The optimal set of control factors for all power factors is characterized by a temperature of 55 °C, a catalyst concentration of 5 wt% and a reaction time of 2 h.
Author Contributions
Funding
Institutional Review Board Statement
Informed Consent Statement
Data Availability Statement
Conflicts of Interest
References
- Erba, A.; Mahmoud, A.; Orlando, R.; Dovesi, R. Elastic properties of six silicate garnet end members from accurate ab initio simulations. Phys. Chem. Miner. 2014, 41, 151–160. [Google Scholar] [CrossRef]
- Garnet Group. Available online: https://www.mindat.org/min-10272.html (accessed on 22 January 2023).
- Perec, A.; Radomska-Zalas, A.; Fajdek-Bieda, A.; Kawecka, E. Efficiency of tool steel cutting by water jet with recycled abrasive materials. Materials 2022, 15, 3978. [Google Scholar] [CrossRef] [PubMed]
- Khormali, A.; Sharifov, A.R.; Torba, D.I. The control of asphaltene precipitation in oil wells. Pet. Sci. Technol. 2018, 36, 443–449. [Google Scholar] [CrossRef]
- Tang, C.; Aldosary, M.; Jiang, Z.; Chang, H.; Madon, B.; Chan, K.; Wu, M.; Garay, J.E.; Shi, J. Exquisite growth control and magnetic properties of yttrium iron garnet thin films. Appl. Phys. Lett. 2016, 108, 102403. [Google Scholar] [CrossRef]
- Klemme, S. Thermodynamic properties of uvarovite garnet (Ca3Cr2Si3O12). Am. Mineral. 2005, 90, 663–666. [Google Scholar] [CrossRef]
- Sharma, V.; Kuanr, B.K. Magnetic and crystallographic properties of rare-earth substituted yttrium-iron garnet. J. Alloys Compd. 2018, 748, 591–600. [Google Scholar] [CrossRef]
- Akhtar, M.N.; Bakar Sulong, A.; Khan, M.A.; Ahmad, M.; Murtaza, G.; Raza, M.R.; Raza, R.; Saleem, M.; Kashif, M. Structural and magnetic properties of yttrium iron garnet (YIG) and yttrium aluminum iron garnet (YAIG) Nanoferrites prepared by microemulsion method. J. Magn. Magn. Mater. 2016, 401, 425–431. [Google Scholar] [CrossRef]
- Perec, A. Research into the disintegration of abrasive materials in the abrasive water jet machining process. Materials 2021, 14, 3940. [Google Scholar] [CrossRef] [PubMed]
- Radomska-Zalas, A.; Perec, A.; Fajdek-Bieda, A. IT support for optimisation of abrasive water cutting process using the TOPSIS method. IOP Conf. Ser. Mater. Sci. Eng. 2019, 710, 012008. [Google Scholar] [CrossRef]
- Perec, A.; Radomska-Zalas, A.; Fajdek-Bieda, A. Experimental research into marble cutting by abrasive water jet. Facta Univ. Ser. Mech. Eng. 2022, 20, 145–156. [Google Scholar] [CrossRef]
- Hlavacek, P.; Zlamal, T.; Sitek, L. Abrasive water jet drilling of cooling holes in aeroengines: Preliminary experimental study. MM Sci. J. 2018, 2018, 2218–2222. [Google Scholar] [CrossRef]
- Tirone, M.; Ganguly, J.; Dohmen, R.; Langenhorst, F.; Hervig, R.; Becker, H.-W. Rare earth diffusion kinetics in garnet: Experimental studies and applications. Geochim. Cosmochim. Acta 2005, 69, 2385–2398. [Google Scholar] [CrossRef]
- Defnet, P.A.; Wise, M.A.; Harmon, R.S.; Hark, R.R.; Hilferding, K. Analysis of garnet by laser-induced breakdown spectroscopy—Two practical applications. Minerals 2021, 11, 705. [Google Scholar] [CrossRef]
- Poon, J.; Madden, D.C.; Wood, M.H.; van Tol, R.; Sonke, H.; Clarke, S.M. Surface chemistry of almandine garnet. J. Phys. Chem. C 2020, 124, 5099–5117. [Google Scholar] [CrossRef]
- Subasinghe, J.L.; Ganeshalingam, S.; Kuganathan, N. Computational study of crystallography, defects, ion migration and dopants in almandine garnet. Physchem 2022, 2, 43–51. [Google Scholar] [CrossRef]
- Mittal, R.; Chaplot, S.L.; Choudhury, N.; Loong, C.-K. Inelastic neutron scattering and lattice-dynamics studies of almandine Fe3Al2Si3O12. Phys. Rev. B 2000, 61, 3983–3988. [Google Scholar] [CrossRef]
- De Oliveira, J.C.P.; da Costa, M.I.; Schreiner, W.H.; Vasquez, A. magnetic properties of the natural pyrope-almandine garnets. J. Magn. Magn. Mater. 1989, 79, 1–7. [Google Scholar] [CrossRef]
- Kumar, K.K.; Balaram, V.; Sirdeshmukh, L. Characterization and dielectric properties of almandine-pyrope garnet. Bull. Mater. Sci. 1992, 15, 279–284. [Google Scholar] [CrossRef]
- Fijan, S.; Škerget, M.; Knez, Ž.; Šostar-Turk, S.; Neral, B. Determining the disinfection of textiles in compressed carbon dioxide using various indicator microbes: Determining the disinfection of textiles in compressed CO2. J. Appl. Microbiol. 2012, 112, 475–484. [Google Scholar] [CrossRef]
- Bhavaniramya, S.; Vishnupriya, S.; Al-Aboody, M.S.; Vijayakumar, R.; Baskaran, D. Role of essential oils in food safety: Antimicrobial and antioxidant applications. Grain Oil Sci. Technol. 2019, 2, 49–55. [Google Scholar] [CrossRef]
- Oberhofer, B.; Nikiforov, A.; Buchbauer, G.; Jirovetz, L.; Bicchi, C. Investigation of the alteration of the composition of various essential oils used in aroma lamp applications. Flavour Fragr. J. 1999, 14, 293–299. [Google Scholar] [CrossRef]
- Nichol, J.L.; Allcock, H.R. Polyphosphazenes with amino acid citronellol ester side groups for biomedical applications. Eur. Polym. J. 2015, 62, 214–221. [Google Scholar] [CrossRef]
- Jia, Y.; Wang, Q.; Qiao, J.; Feng, B.; Zhou, X.; Jin, L.; Feng, Y.; Yang, D.; Lu, C.; Ying, X. Cascading old yellow enzyme, alcohol dehydrogenase and glucose dehydrogenase for selective reduction of (E/Z)-citral to (S)-citronellol. Catalysts 2021, 11, 931. [Google Scholar] [CrossRef]
- Ahmadi, S.; Khormali, A.; Meerovich Khoutoriansky, F. Optimization of the demulsification of water-in-heavy crude oil emulsions using response surface methodology. Fuel 2022, 323, 124270. [Google Scholar] [CrossRef]
- Perec, A.; Radomska-Zalas, A.; Fajdek-Bieda, A.; Pude, F. Process optimization by applying the response surface methodology (RSM) to the abrasive suspension water jet cutting of phenolic composites. Facta Univ. Ser. Mech. Eng. 2022. Available online: http://casopisi.junis.ni.ac.rs/index.php/FUMechEng/article/view/10193 (accessed on 22 January 2023). [CrossRef]
- Jozić, S.; Bajić, D.; Dumanić, I.; Bagavac, Ž. Optimization for an efficient and highly productive turning process. Rep. Mech. Eng. 2021, 2, 212–221. [Google Scholar] [CrossRef]
- Lehocká, D.; Klich, J.; Botko, F.; Foldyna, J.; Hloch, S.; Kepič, J.; Kovaľ, K.; Krejči, L.; Storkan, Z. Pulsating water jet erosion effect on a brass flat solid surface. Int. J. Adv. Manuf. Technol. 2018, 97, 1099–1112. [Google Scholar] [CrossRef]
- Mlynarczuk, M.; Skiba, M.; Sitek, L.; Hlaváček, P.; Kozusnikova, A. The research into the quality of rock surfaces obtained by abrasive water jet cutting. Arch. Min. Sci. 2014, 59, 925–940. [Google Scholar] [CrossRef]


| S | R2 | R2(adj) | R2(pred) |
|---|---|---|---|
| 1.96809 | 97.64% | 96.39% | 93.37% |
| Source | DF | Adj SS | Adj MS | F-Value | p-Value |
|---|---|---|---|---|---|
| Model | 9 | 2722.82 | 302.535 | 78.11 | 0.000 |
| Linear | 3 | 1662.14 | 554.047 | 143.04 | 0.000 |
| Temperature [°C] | 1 | 776.45 | 776.449 | 200.46 | 0.000 |
| Catalyst concentration [wt%] | 1 | 432.38 | 432.376 | 111.63 | 0.000 |
| Time [h] | 1 | 517.47 | 517.470 | 133.60 | 0.000 |
| Square | 3 | 665.65 | 221.882 | 57.28 | 0.000 |
| Temperature [°C]*Temperature [°C] | 1 | 605.61 | 605.615 | 156.35 | 0.000 |
| Catalyst concentr. [wt%]*Catalyst concentr. [wt%] | 1 | 0.71 | 0.714 | 0.18 | 0.673 |
| Time [h]*Time [h] | 1 | 59.32 | 59.317 | 15.31 | 0.001 |
| Two-Way Interaction | 3 | 165.49 | 55.162 | 14.24 | 0.000 |
| Temperature [°C]*Catalyst concentration [wt%] | 1 | 45.44 | 45.439 | 11.73 | 0.003 |
| Temperature [°C]*Time [h] | 1 | 69.46 | 69.465 | 17.93 | 0.001 |
| Catalyst concentration [wt%]*Time [h] | 1 | 50.58 | 50.582 | 13.06 | 0.002 |
| Error | 17 | 65.85 | 3.873 | ||
| Total | 26 | 2788.67 |
| S | R2 | R2(adj) | R2(pred) |
|---|---|---|---|
| 3.74216 | 93.89% | 90.65% | 83.95% |
| Source | DF | Adj SS | Adj MS | F-Value | p-Value |
|---|---|---|---|---|---|
| Model | 9 | 3657.94 | 406.44 | 29.02 | 0.000 |
| Linear | 3 | 2825.31 | 941.77 | 67.25 | 0.000 |
| Temperature [°C] | 1 | 518.48 | 518.48 | 37.02 | 0.000 |
| Catalyst concentration [wt%] | 1 | 419.92 | 419.92 | 29.99 | 0.000 |
| Time [h] | 1 | 1986.79 | 1986.79 | 141.88 | 0.000 |
| Square | 3 | 618.42 | 206.14 | 14.72 | 0.000 |
| Temperature [°C]*Temperature [°C] | 1 | 358.51 | 358.51 | 25.60 | 0.000 |
| Catalyst concentr. [wt%]*Catalyst concentr. [wt%] | 1 | 82.51 | 82.51 | 5.89 | 0.027 |
| Time [h]*Time [h] | 1 | 177.40 | 177.40 | 12.67 | 0.002 |
| Two-Way Interaction | 3 | 95.49 | 31.83 | 2.27 | 0.117 |
| Temperature [°C]*Catalyst concentration [wt%] | 1 | 11.97 | 11.97 | 0.85 | 0.368 |
| Temperature [°C]*Time [h] | 1 | 3.61 | 3.61 | 0.26 | 0.618 |
| Catalyst concentration [wt%]*Time [h] | 1 | 79.91 | 79.91 | 5.71 | 0.029 |
| Error | 17 | 238.06 | 14.00 | ||
| Total | 26 | 3896.00 |
| S | R2 | R2(adj) | R2(pred) |
|---|---|---|---|
| 2.09472 | 96.54% | 94.71% | 91.22% |
| Source | DF | Adj SS | Adj MS | F-Value | p-Value |
|---|---|---|---|---|---|
| Model | 9 | 2083.41 | 231.49 | 52.76 | 0.000 |
| Linear | 3 | 1616.44 | 538.81 | 122.80 | 0.000 |
| Temperature [°C] | 1 | 2.48 | 2.48 | 0.57 | 0.462 |
| Catalyst concentration [wt%] | 1 | 0.00 | 0.00 | 0.00 | 0.990 |
| Time [h] | 1 | 1616.21 | 1616.21 | 368.34 | 0.000 |
| Square | 3 | 465.68 | 155.23 | 35.38 | 0.000 |
| Temperature [°C]*Temperature [°C] | 1 | 7.75 | 7.75 | 1.77 | 0.201 |
| Catalyst concentr. [wt%]*Catalyst concentr. [wt%] | 1 | 199.48 | 199.48 | 45.46 | 0.000 |
| Time [h]*Time [h] | 1 | 258.45 | 258.45 | 58.90 | 0.000 |
| Two-Way Interaction | 3 | 136.52 | 45.51 | 10.37 | 0.000 |
| Temperature [°C]*Catalyst concentration [wt%] | 1 | 106.70 | 106.70 | 24.32 | 0.000 |
| Temperature [°C]*Time [h] | 1 | 26.64 | 26.64 | 6.07 | 0.025 |
| Catalyst concentration [wt%]*Time [h] | 1 | 3.18 | 3.18 | 0.72 | 0.406 |
| Error | 17 | 74.59 | 4.39 | ||
| Total | 26 | 2158.00 |
| Test nr. | Temp | Catalysts Concentration | Time | GA Conversion | NE Selectivity | CL Selectivity |
|---|---|---|---|---|---|---|
| - | [°C] | [wt%] | [h] | [mol%] | [mol%] | [mol%] |
| 1 | 20 | 1.0 | 0.25 | 40 | 7 | 13 |
| 2 | 20 | 1.0 | 1.00 | 51 | 20 | 31 |
| 3 | 20 | 1.0 | 2.00 | 73 | 38 | 41 |
| 4 | 20 | 2.5 | 0.25 | 60 | 12 | 13 |
| 5 | 20 | 2.5 | 1.00 | 68 | 19 | 29 |
| 6 | 20 | 2.5 | 2.00 | 80 | 28 | 37 |
| 7 | 20 | 5.0 | 0.25 | 73 | 19 | 27 |
| 8 | 20 | 5.0 | 1.00 | 78 | 26 | 36 |
| 9 | 20 | 5.0 | 2.00 | 85 | 39 | 49 |
| 10 | 60 | 1.0 | 0.25 | 73 | 14 | 23 |
| 11 | 60 | 1.0 | 1.00 | 80 | 29 | 33 |
| 12 | 60 | 1.0 | 2.00 | 87 | 41 | 46 |
| 13 | 60 | 2.5 | 0.25 | 79 | 20 | 20 |
| 14 | 60 | 2.5 | 1.00 | 84 | 28 | 30 |
| 15 | 60 | 2.5 | 2.00 | 85 | 49 | 40 |
| 16 | 60 | 5.0 | 0.25 | 86 | 37 | 27 |
| 17 | 60 | 5.0 | 1.00 | 91 | 43 | 33 |
| 18 | 60 | 5.0 | 2.00 | 94 | 49 | 40 |
| 19 | 110 | 1.0 | 0.25 | 78 | 22 | 31 |
| 20 | 110 | 1.0 | 1.00 | 79 | 28 | 32 |
| 21 | 110 | 1.0 | 2.00 | 88 | 40 | 45 |
| 22 | 110 | 2.5 | 0.25 | 80 | 19 | 19 |
| 23 | 110 | 2.5 | 1.00 | 85 | 27 | 29 |
| 24 | 110 | 2.5 | 2.00 | 86 | 48 | 39 |
| 25 | 110 | 5.0 | 0.25 | 87 | 36 | 26 |
| 26 | 110 | 5.0 | 1.00 | 91 | 42 | 32 |
| 27 | 110 | 5.0 | 2.00 | 92 | 48 | 39 |
Disclaimer/Publisher’s Note: The statements, opinions and data contained in all publications are solely those of the individual author(s) and contributor(s) and not of MDPI and/or the editor(s). MDPI and/or the editor(s) disclaim responsibility for any injury to people or property resulting from any ideas, methods, instructions or products referred to in the content. |
© 2023 by the authors. Licensee MDPI, Basel, Switzerland. This article is an open access article distributed under the terms and conditions of the Creative Commons Attribution (CC BY) license (https://creativecommons.org/licenses/by/4.0/).
Share and Cite
Fajdek-Bieda, A.; Perec, A.; Radomska-Zalas, A. Application of RSM Method for Optimization of Geraniol Transformation Process in the Presence of Garnet. Int. J. Mol. Sci. 2023, 24, 2689. https://doi.org/10.3390/ijms24032689
Fajdek-Bieda A, Perec A, Radomska-Zalas A. Application of RSM Method for Optimization of Geraniol Transformation Process in the Presence of Garnet. International Journal of Molecular Sciences. 2023; 24(3):2689. https://doi.org/10.3390/ijms24032689
Chicago/Turabian StyleFajdek-Bieda, Anna, Andrzej Perec, and Aleksandra Radomska-Zalas. 2023. "Application of RSM Method for Optimization of Geraniol Transformation Process in the Presence of Garnet" International Journal of Molecular Sciences 24, no. 3: 2689. https://doi.org/10.3390/ijms24032689
APA StyleFajdek-Bieda, A., Perec, A., & Radomska-Zalas, A. (2023). Application of RSM Method for Optimization of Geraniol Transformation Process in the Presence of Garnet. International Journal of Molecular Sciences, 24(3), 2689. https://doi.org/10.3390/ijms24032689