Article

Molecular Dynamics Approach to the Physical Mixture of In2O3 and ZrO2: Defect Formation and Ionic Diffusion

by
Lorenzo E. Fornasari
1,
Bruna J. da S. Bronsato
1,
Lucia G. Appel
2 and
Roberto R. de Avillez
1,*
1
Departamento de Engenharia Química e de Materiais, Pontifícia Universidade Católica do Rio de Janeiro, PUC-Rio, Rua Marquês de São Vicente, 225, Gávea, Rio de Janeiro 22451-900, Brazil
2
Divisão de Catálise e Processos Químicos, Instituto Nacional de Tecnologia, INT, Av. Venezuela 82/518, Rio de Janeiro 21081-312, Brazil
*
Author to whom correspondence should be addressed.
Int. J. Mol. Sci. 2023, 24(3), 2426; https://doi.org/10.3390/ijms24032426
Submission received: 29 December 2022 / Revised: 23 January 2023 / Accepted: 23 January 2023 / Published: 26 January 2023

Abstract

:
Recent research on the use of physical mixtures In2O3-ZrO2 has raised interesting questions as to how their combination enhances catalytic activity and selectivity. Specifically, the relationship between oxygen diffusion and defect formation and the epitaxial tension in the mixture should be further investigated. In this study, we aim to clarify some of these relationships through a molecular dynamics approach. Various potentials for the two oxides are compared and selected to describe the physical mixture of In2O3 and ZrO2. Different configurations of each single crystal and their physical mixture are simulated, and oxygen defect formation and diffusion are measured and compared. Significant oxygen defect formation is found in both crystals. In2O3 seems to be stabilized by the mixture, while ZrO2 is destabilized. Similar results were found for the ZrO2 doping with In and ln2O3 doping with Zr. The results explain the high activity and selectivity catalyst activity of the mixture for the production of isobutylene from ethanol.

1. Introduction

Indium oxide is a versatile material that arouses interest in several applications, such as optoelectronics [1] and catalysis [2,3]. Recent researches have shown that the interest in this material for catalysis is due partially to the strong capacity of the cubic phase of In2O3 to form oxygen vacancies, especially in the presence of monoclinic ZrO2 [4,5,6,7]. The causes of this phenomenon are still not well understood and have been the target of theoretical and experimental studies for its elucidation. These materials seem to form an epitaxial alignment that favor defects’ formation, such as. oxygen vacancies, providing an interesting catalytic behavior [6,7].
Further, the oxygen dynamics of ZrO2 and In2O3 favor some reactions of industrial interest, like the syntheses of isobutene and acetone from ethanol [5,6] and also methanol and methane from CO2 [8,9]. These reactions depend on the oxygen lattice mobility, according to the Mars Van Krevelen mechanism [10].
The optimization and development of new In2O3 catalysts depend on understanding the phenomenon of point defects formation and mobility. In this sense, computer simulations help predict the behavior and properties of these materials. [11] Some authors have used Density Functional Theory (DFT) to investigate the morphology and stability of different faces of cubic In2O3 [12,13]. Walsh et al. [14] found that the stability of In2O3 surfaces can be described in the following order: (111) > (110) > (100). In addition, Zhang et al. [13] verified that the face (111) of In2O3 presents greater stability under oxidizing conditions, while the face (100) is more stable under oxygen-lean conditions. Through theoretical and experimental study, Ziemba et al. [15] used DFT calculations to simulate experimental Raman results and investigate the oxygen dynamics for cubic In2O3 under oxidizing and reducing conditions. From the calculations, they determined that the energy of formation of an oxygen vacancy in the bulk of an In2O3 unit cell was 3.40 eV, consistent with the values found in the literature [1,16]. In this study, the authors found that, under reducing conditions at temperatures above 120 °C, oxygen migrates from the bulk to the surface until it reaches an equilibrium condition, which is more favorable than maintaining oxygen vacancies on the surface of the oxide [15]. Nørskov et al. [17] calculated the energy of formation of oxygen vacancies on the surface (111) of In2O3 considering a supported catalyst model represented by In2O3 (111) layers on ZrO2 (111). The thickness of the In2O3 layer was varied (from 5 to 2 layers) to simulate different conditions of dispersion of In2O3 on the support. They found that reducing the In2O3 layer thickness increased the formation energy for oxygen vacancies, suggesting that increasing this oxide dispersion makes defect formation more difficult. For the more dispersed model (2 layers), the vacancy formation energy was 0 eV, while for the 5-layer model, the calculated value was −0.1 eV. The small vacancy formation energies show a relative stabilization of the In2O3 lattice in the physical mixture, resulting in a minor defect formation and a higher oxygen diffusion activation energy.
Molecular dynamics also contributed to the understanding and better description of materials but used empirical interatomic potentials to describe the structure of pure cubic In2O3 [1] or doped with elements as Sn [18,19]. Such potentials have often been used in molecular dynamics simulations to investigate the formation of defects as vacancies, Frenkel and Schottky [16,19,20], and to assess the stability of different faces of cubic In2O3 [14]. Warschkow et al. [18] proposed a Buckingham potential for In2O3, based on studies by Bush et al. [21]. Although this potential could provide adequate values for the structural properties of cubic In2O3, it barely fitted the dielectric parameters. Walsh et al. [1] reported a more accurate potential that simulates both the structural and physical properties of the material. Furthermore, such potential proved adequate for studies of intrinsic defects such as vacancies, Schottky, and Frenkel in this oxide.
Recently, Hou et al. [19] developed a set of paired interatomic potentials, combining Buckingham, Lennard-Jones, Polynomial, Polynomial Harmonic Potentials, and Shell models. This new potential proved accurate to simulate structural and physical properties and understand the properties resulting from the formation of defects in the oxide.
For ZrO2, most reported interatomic potentials are more appropriate for cubic or tetragonal phases and may present some deviations when used for simulations involving the monoclinic phase. Schelling et al. [22] developed a Buckingham potential to investigate the phenomenon of transition from cubic and tetragonal phases to cubic yttria-stabilized zirconia (YSZ). Kilo et al. [23] investigated oxygen diffusion in the same material over a finite temperature range, modifying the literature’s potentials. Lau & Dunlap [24] used diluted concentrations of Y2O3 in ZrO2 and described a suitable potential for the temperature range of 300–1400 K, using the rigid ion model approximation. Through a different line of study, Duin et al. [25] developed a ReaxFF reactive force field to search into the intergranular diffusion of perovskites like Y-doped BaZrO3 (BYZ).
Despite these studies, there is not enough literature describing the interaction of In2O3 with ZrO2 based on molecular dynamics. Therefore, some questions are raised: would it be possible to use these potentials to describe the behavior of In2O3 and ZrO2 catalysts? Furthermore, how the presence of ZrO2 could affect the stability and oxygen mobility of In2O3?
This work uses molecular dynamics and empirical potentials to evaluate the interaction between In2O3 and ZrO2 oxides in proximity, the defect formation in the In2O3 oxide, and the diffusion of ionic species in mixtures of these oxides. The present results are discussed considering the known catalytic properties of the In2O3/ZrO2 system and its effectiveness in catalyzing the isobutylene synthesis from ethanol.

2. Methodology

The used interatomic potentials are a sum of a Coulomb term describing electrostatic interactions; and a Buckingham potential, which empirically describes the quantum interactions of the Pauli repulsion and the van der Waals attraction [26].
V ( r ) = A e x p ( r i j ρ ) C r i j 6 + ( q i q j r i j )
where rij is the distance between atoms i and j, qi and qj are their charges. The parameters A, ρ, and C were empirically derived.
The simulations were performed using the LAMMPS software, version 3 march 2020 [27] with the metal style. The cutoff radius was 10 Å for the Buckingham and 25 Å for the Coulomb interactions [1]. The long-range interactions were calculated using Ewald summations and long-range corrections were not used. The potentials’ parameters are presented in Table 1 with their respective references. These potentials presented the best match for oxygen-oxygen interactions and thus were best suited for combination. Further analysis on potential selection is presented in other sections of this work.

2.1. In2O3 Model Verification and Selection

This oxide’s crystal structure is described by a unitary cell containing 80 atoms and pertains to the Ia-3 spatial group [1]. The input files with the atomic positions for the rigid ion framework were obtained through a Python code using the Atomic Simulation Environment (ASE) library [28]. A simple Python algorithm produced the input files with the atomic positions for the core-shell framework from the rigid ion files.
Preliminary experiments were conducted on two existing potentials to determine which better describes the crystal. Furthermore, for each potential, a rigid ion and a core-shell case were investigated to check for a significant variation.
These experiments consisted of building a lattice parameter versus energy graph for each potential choice using a 4 × 4 × 4 In2O3 supercell. Runs for different lattice parameters were performed in NVT ensembles at room temperature for 4 ps using 0.2 fs time steps. The resultant medium potential energy per atom was registered (Figure S1). After that, a third-degree polynomial equation was fitted to the simulated points to help identify the local minimum which corresponds to the equilibrium lattice parameter. The bulk modulus, B, was extracted from the fitted polynomial through the following equation [29,30]:
B = V P V T = N 9 a 0   2 E a 2
V is the volume at constant temperature, P is the pressure, N is the number of atoms in the unit cell, a0 is the equilibrium lattice parameter, a is the lattice parameter, and E is the potential energy described by the fitted third-degree polynomial equation.
For the linear expansion coefficient calculation, an NVT run with 4 ps of equilibration plus 0.2 ps steps of measurement was performed for different temperatures using a time step of 0.2 fs. The lattice parameter for each temperature was obtained and used to build a graph of elongation versus the difference in temperature to determine the linear expansion coefficient (Figure S2).
The results were compared with experimental data and the original calculated values by their authors [1,18]. The adequate potential and case—core-shell or rigid ion—were chosen.

2.2. Defect Energy

The energies of various defects on the In2O3 crystal and its lattice energy were calculated and compared with Walsh et al. [1]. The rigid ion and the core-shell models were used, measured, and compared. Two different supercell sizes were considered: 3 × 3 × 3 and 4 × 4 × 4.
For each model and each supercell size, input files were crafted depicting the following cases: crystal with no defects; 8b indium atom vacancy; 24d indium atom vacancy; 48e oxygen atom vacancy; 8a interstitial indium atom; 16c interstitial indium atom; 24d interstitial indium atom; 16c interstitial oxygen atom; 24d interstitial oxygen atom; and 8a interstitial oxygen atom. The letters correspond to the Wyckoff positions [31,32]. Ten different input files with randomly positioned defects were generated for each defect type and interatomic potential. A minimization run was executed for each file, and the total energy average was calculated for each defect type. These values were subtracted from the total energy of the defect-free lattice with the same ion model and supercell size.
For the Frenkel and Schottky defect energies, a calculation using the lower energy vacancies and interstitial atoms energies [1] was performed:
E S c h o t t k y = 1 5   ( 2 E   [ V I n ] + 3 E [ V O ] ) + E [ I n 2 O 3 ] )
E F r e n k e l = 1 2   ( E   [ V I n ] + E [ I n i ] )
E   [ I n 2 O 3 ] = t o t a l   p o t e n t i a l   e n e r g y N × 5
For the lattice energies, the total potential energy of the In2O3 crystal without defects was divided by the number of atoms, then multiplied by 5, the number of atoms in the In2O3 formula.

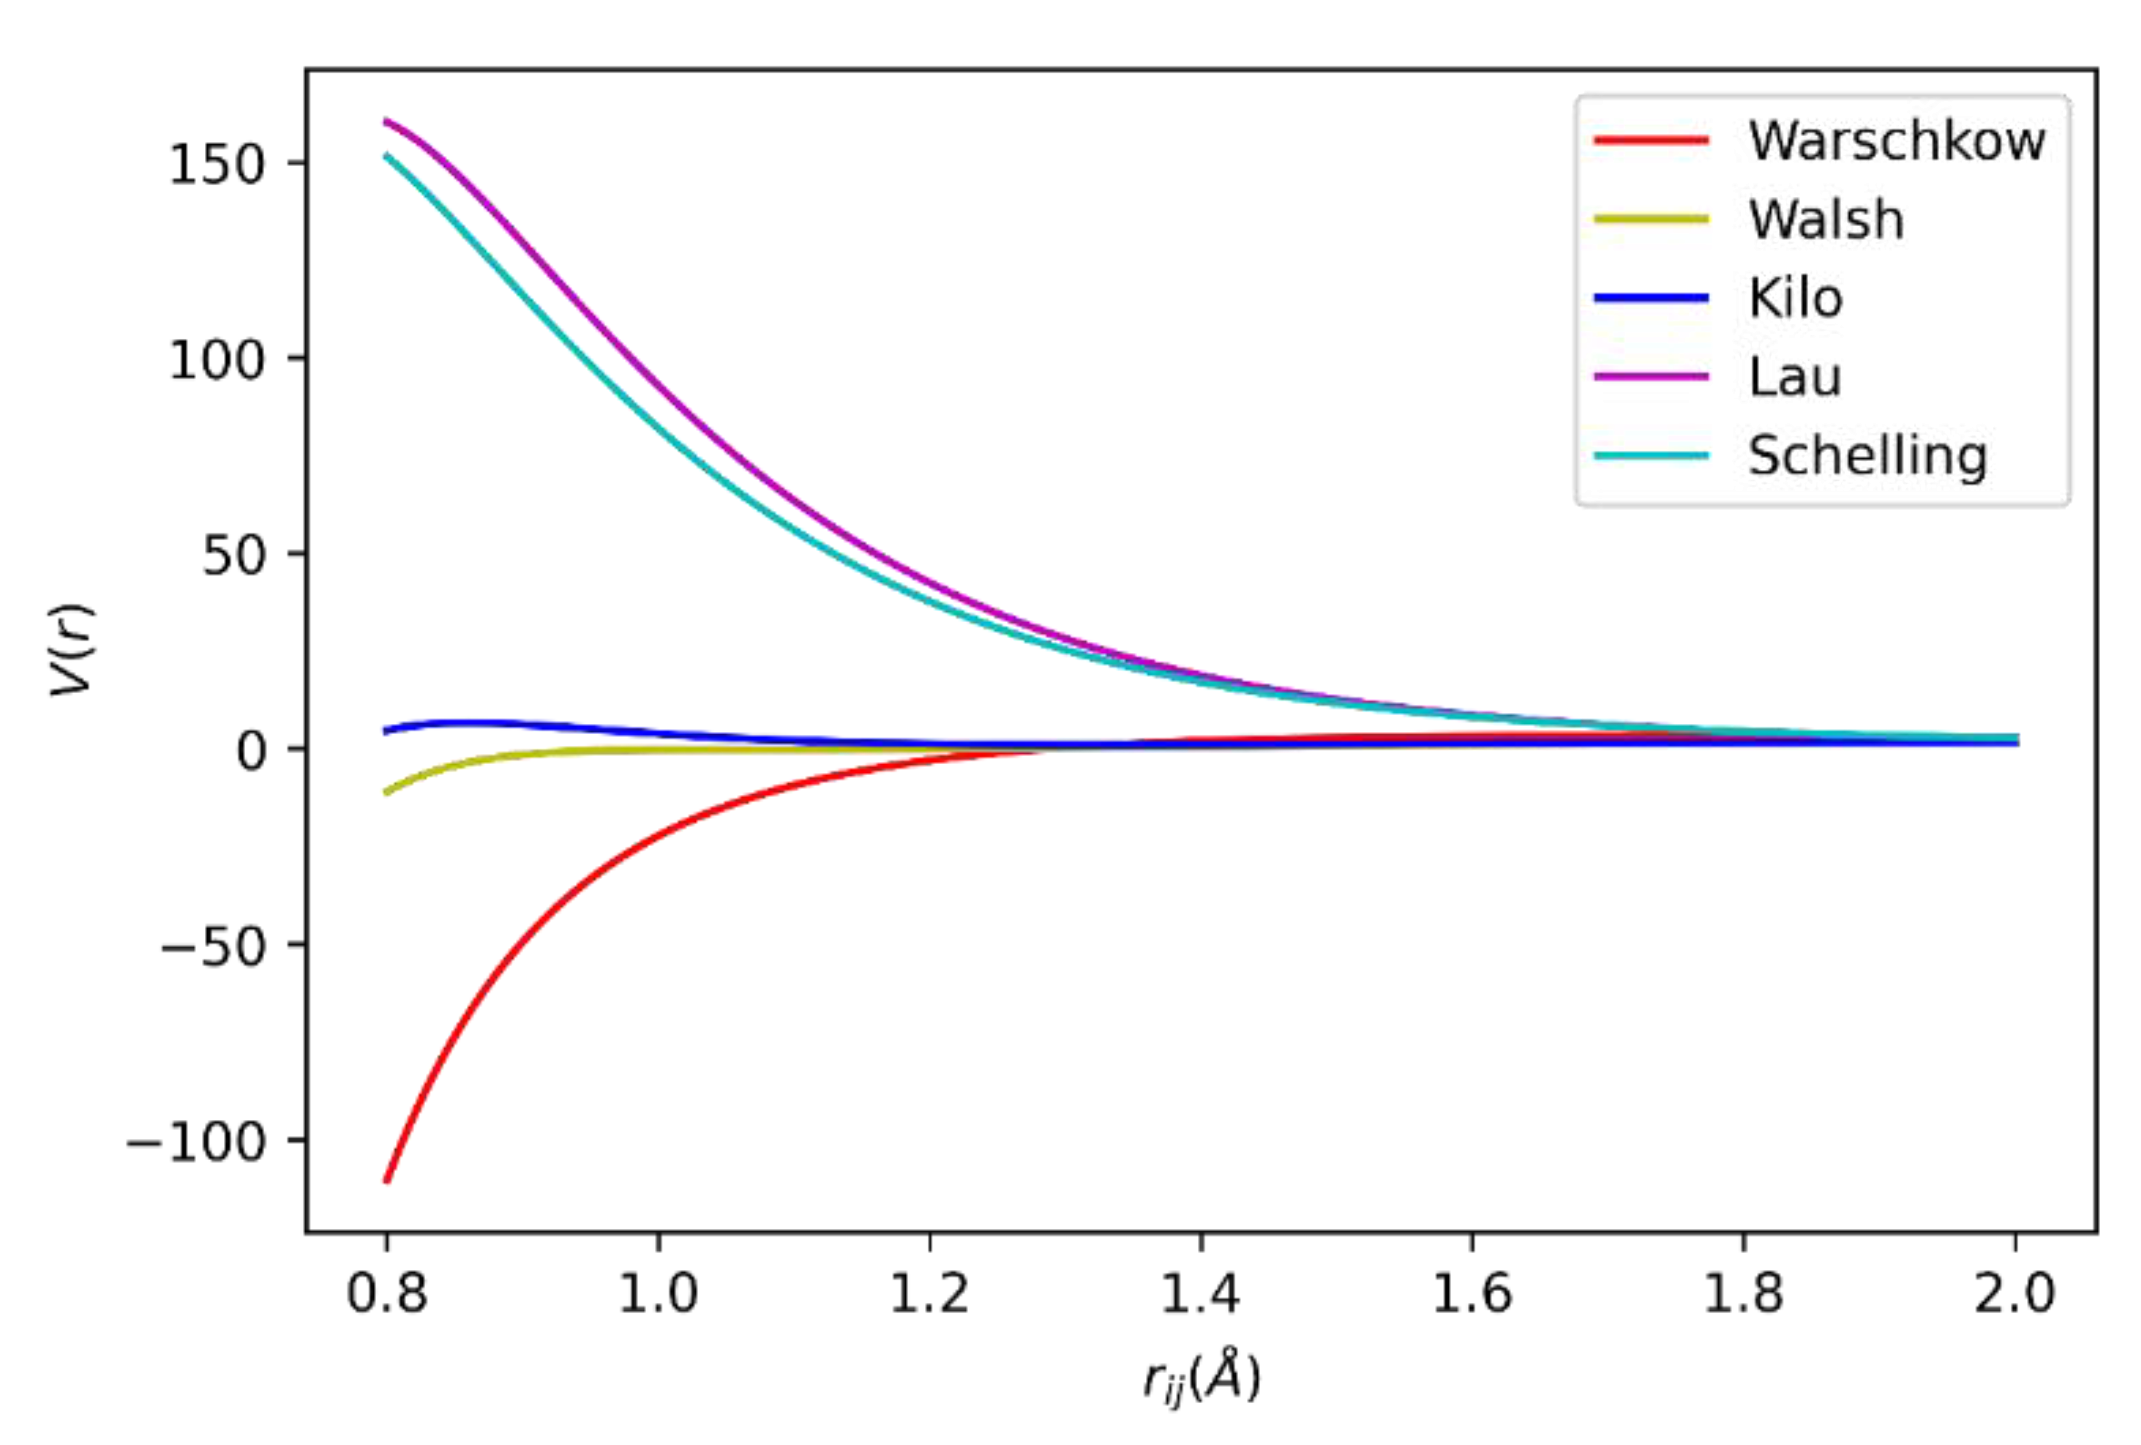
2.3. ZrO2 Model Selection

Bandura et al. compared different interatomic potentials to describe zirconia cubic, monoclinic and tetragonal phases [33]. Three interatomic potentials using the Buckingham potential were chosen for further analysis to allow compatibility with Walsh’s potential for In2O3, especially regarding the O−2-O−2 interaction, since the crystals were expected to exchange O−2 ions.
These candidate potentials did not have the monoclinic phase as their most stable. Instead presented an artificial rutile-like structure as their most stable phase. Stability tests were performed for these 3 potentials using 4 × 4 × 4 ZrO2 supercells, and NPT runs for 80 ps with 1fs time steps for stabilization plus 60 ps of measurement. The radial distribution functions of their zirconium atoms present in the stabilized phase were calculated and compared to the RDFs of other ZrO2 phases: artificial rutile-like, monoclinic and tetragonal. The cubic structure was not considered for it was the least stable phase for all 3 candidate potentials.
To further investigate compatibility between ZrO2 and In2O3 potentials, a graph of potential energy versus distance between oxygen ions was determined and compared.

2.4. Defective In2O3 and ZrO2

For the defective In2O3 experiments, 4 types of defects were investigated: Schottky defects, oxygen Frenkel defects, oxygen vacancies, and substitutional defects with Zr atoms occupying In sites. For defective ZrO2 experiments, Schottky defects, Frenkel defects, oxygen vacancies, and substitutional defects with In atoms occupying Zr sites. For each defect, input files representing different initial conditions were prepared using the ASE library.
A 3 × 3 × 3 supercell was used to investigate defects in In2O3. 13 Schottky defects were created by adding 26 In vacancies and 39 O vacancies to the base supercell. For Frenkel defects, 65 oxygen Frenkel defects were added to the supercell. Sixty-five oxygen atoms were eliminated from the supercell for pure oxygen vacancy defects. So the total number of vacancies was always 65, which is 3% of the total number of atoms in the perfect crystal.
The effect of Zr doping in the In2O3 crystal was investigated with two different files containing Zr doped In2O3. One had 78 Zr atoms, and another had 195 Zr atoms, substituted at random 8a In positions, as this is the indium atom site with the lowest vacancy formation energy. Vacancies for indium atoms were generated to equilibrate the crystals’ charge. Thus, the files with 78 Zr atoms contained the same number of In vacancies of the Schottky defect file, 26; and the files with 195 Zr atoms contained the same number of total vacancies of the Schottky defect file 65.
Similar files were generated to investigate defects on ZrO2 using a 5 × 5 × 5 base supercell. So to create 15 Schottky defects, 15 Zr vacancies and 30 O vacancies were created in the base supercell. For Frenkel defects, 45 oxygen Frenkel defects were added to the supercell. For pure oxygen vacancies, 45 oxygen atoms were taken from the supercell. So for each defect type, the total number of vacancies was 45, that is, 3% of the total number of atoms in the perfect crystal.
The effect of In doping in the ZrO2 crystal was investigated with two different files containing In using the 5 × 5 × 5 base supercell. One had 60 In atoms, and another had 90 In atoms, substituted at random Zr positions, as this crystal only possesses one type of site for Zr atoms. Vacancies for oxygen atoms were generated to equilibrate the crystals’ charge. Thus, the files with 60 In atoms contained the same number of oxygen vacancies of the Schottky defect file, 30; and the files with 90 In atoms contained the same number of total vacancies of the Schottky defect file, 45.
The defective crystals were built using the rigid model allowing an easier integration between different potentials. They were subject to a cg style hydrostatic pressure minimization at zero pressure, followed by a 50 ps equilibration hydrostatic NPT run at 1.01325 bar and a 1000 ps hydrostatic pressure NPT measuring run at various temperatures and 1.01325 bar. The simulation time and the time step of 1 fs were chosen to be similar to values used to simulate oxygen diffusion in Kilo et al. [23]. The temperatures were 850, 900, 950, and 1000 °C. The O−2-O−2 potential used for the doping simulations was that of the host crystal instead of Walsh’s potential for all O−2-O−2 interactions employed in the description of the physical mixtures. The mean square displacement of each atom type was computed during these experiments.

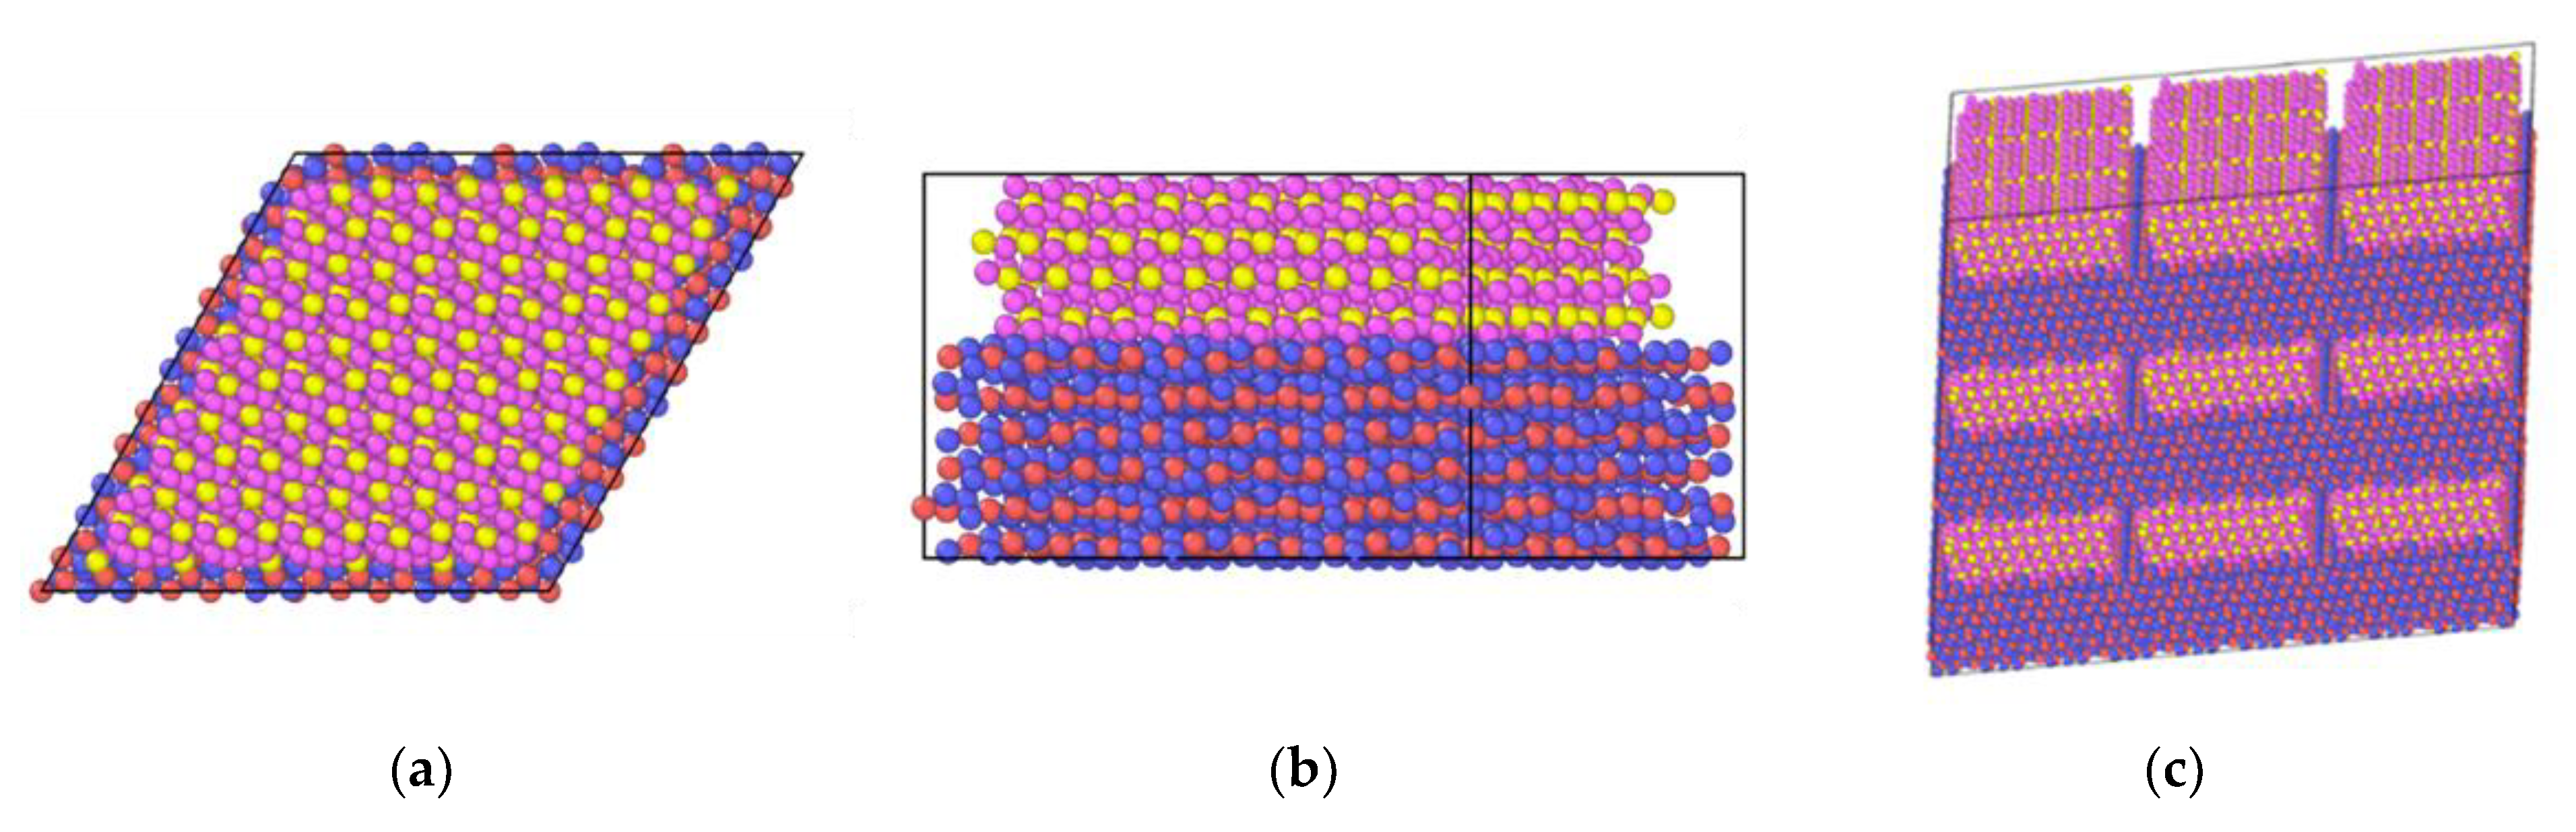
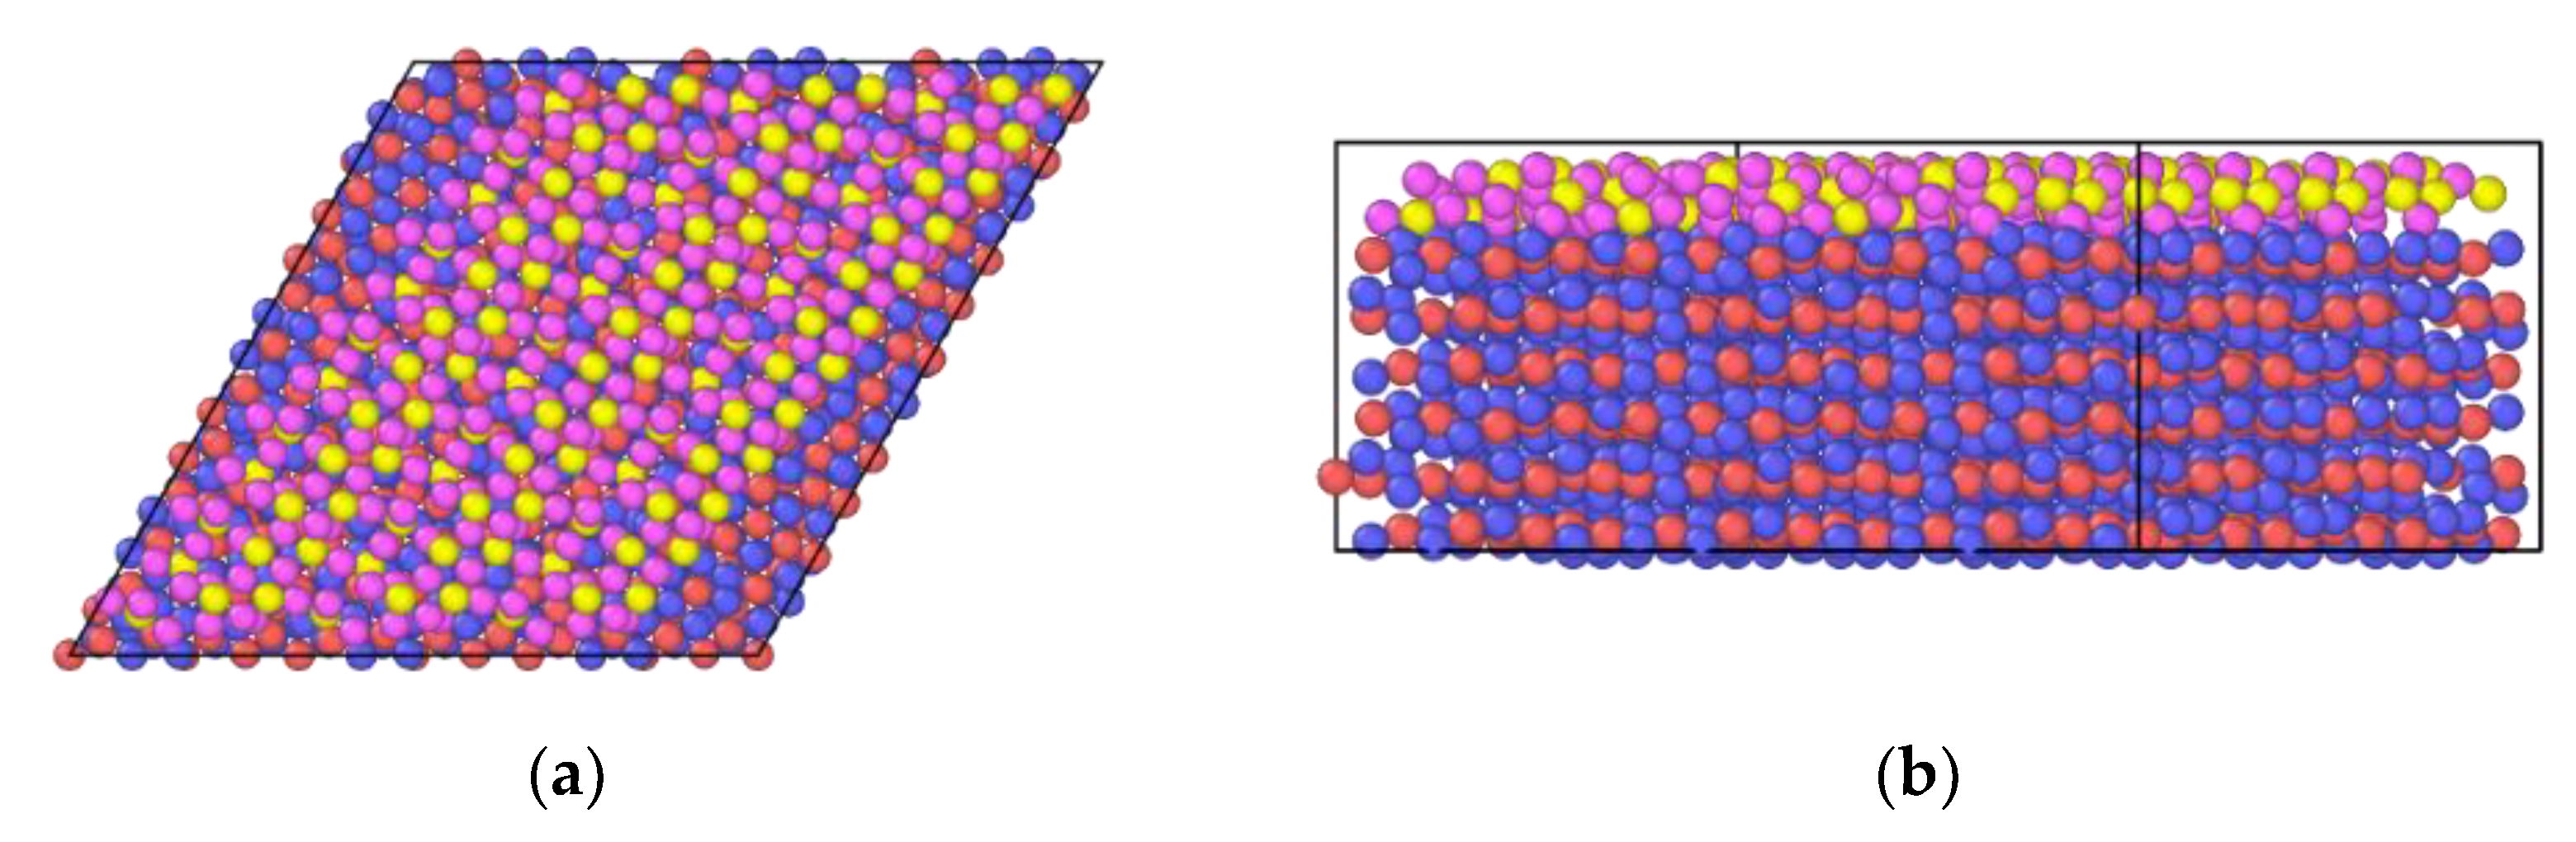
2.5. In2O3-ZrO2 Physical Mixture

Input files describing physical mixtures arrangements of layers of In2O3 and ZrO2 were crafted using the ASE library to generate slabs of each crystal in different planes and then processing these slabs with Python scripts to appropriately position the ZrO2 slabs on top of a larger In2O3 slab. As the ASE code outputted diamond-shaped slabs, this shape was conserved for the input data files. The used slabs were 3 × 3 × 3 In2O3(111), 5 × 5 × 4 ZrO2(111), 3 × 7 × 5 ZrO2(102), and 3 × 6 × 6 ZrO2(211). The 3 × 3 × 3 In2O3(111) slab dimensions were taken as a starting point to accommodate the ZrO2 chosen surface, and the ZrO2 slabs dimensions for the three different planes were chosen to cover most of the In2O3(111) slab surface; their length and width not being larger than the In2O3(111) slab surface; and the similarity in area and number of atoms between them. This last item is important because it allows a reasonable comparison between the different studied interfaces. The dimensions and number of atoms of the ZrO2 slabs are as follows: 5 × 5 × 4 ZrO2(111)—1,180,372 A2 and 1200 atoms; 3 × 7 × 5 ZrO2(102)—1266,318 A2 and 1260 atoms; 3 × 6 × 6 ZrO2(211)—1210,655 A and 1296 atoms. Figure 1a,b shows an example of the initial file used to simulate the physical mixture system with an In2O3 base. It is important to note that the generated input files have the In2O3 crystal touching the lateral edges of the periodic box, while this does not happen for the ZrO2 crystal present in these files. As this study uses periodic boundaries, which mirror the crystal structure in all directions, this leads to the formation of a continuous layer of the base crystal, leading to it experiencing a higher stabilization. Figure 1c shows the same system with the periodic structure replicated to show the formation of a continuous layer for the base oxide.
For each In2O3/ZrO2 combination, a twin file containing approximately 3% vacancies due to Schottky defects in each crystal was also crafted.
This file was manipulated into a rectangular box to fit LAMMPS limitations on simulation box angle and could not accept the box angle of the ZrO2 base used.
For comparison’s sake, a 6 × 6 × 5 ZrO2(111) slab was crafted as the base with its laterals touching the periodic boundary, and the 3 × 3 × 2 In2O3(111) slab placed on its top. If there are no significant differences between this slab’s arrangement and the previous, then the periodic boundary effect to stabilize the base crystal is insignificant. This setup file was manipulated into a rectangular box to fit LAMMPS limitations on simulation box angle and could not accept the box angle of the ZrO2 base used.
All files described were built using the rigid ion model. They were subject to a cg style triclinic minimization at 1.01325 bar, followed by a 50 ps equilibration triclinic NPT run at 1.01325 bar and a 1000 ps measuring triclinic NPT run at 850, 900, 950, 1000, and 1050 °C, and 1.01325 bar. The simulation time and the time step of 1 fs were chosen to be similar to values used to simulate oxygen diffusion in Kilo et al. [25]. During these experiments, the following information was acquired: the potential energy of each atom; the mean square displacement of each atom type, distinguishing the ZrO2 and In2O3 oxygen atoms; and the radial distribution function of each atom type.

2.6. In2O3-ZrO2 Interface

Lewis [34] estimated the changes in cation coordination number on the repulsive term of the pair potential. They showed that the ionic radii for the tetrahedral site are about 0.94 the ionic radii for the octahedral site. This difference results in a reduction of 14% of the parameter A in Equation (1). The In2O3 and ZrO2 structures used in the present calculation have the same coordination number, so the same Zr+4-O−2 and In+3-O−2 pair potentials may be used inside the In2O3 and ZrO2 structures. Concerning the metallic ions at the interface region, one expects that the coordination number stays mostly the same since the oxygen ions must keep the electric neutrality of the crystal. Therefore, the same Zr+4 -O−2 and In+3-O−2 pair potentials were used for both crystals and the interface. Following Lewis [34], the O−2 -O−2 interaction is the same throughout the mixture, and the cation-cation interaction is purely Coulombic.
Before the mixture simulations, the chosen In2O3 and ZrO2 interfaces were placed at a short distance from each other, and the system was allowed to relax in all directions at 1.01325 bar (1 atm) and the desired temperature with a maximum volume change of 0.001 in any one direction at each interaction. After the equilibration, the timestep was reset, and an initial equilibration was run for 50,000 steps before the final simulation was run for 1,000,000 steps.

2.7. In2O3-ZrO2 Physical Mixture—ZrO2 Monolayer

ZrO2 was also simulated as a monolayer over the In2O3 crystal. Three different surface planes over an In2O3 crystal were crafted. The In2O3 dimensions were the same as before but the ZrO2 height corresponded to a unit cell perpendicular to the chosen plane. The number of atoms for each monolayer is ZrO2(111)—300 atoms; ZrO2(102)—252 atoms; and ZrO2(211)—324 atoms.
For each In2O3/ZrO2(monolayer) combination, a twin file containing approximately 3% vacancies due to Schottky defects in each crystal was also crafted. Figure 2 shows an example of the In2O3/ZrO2(monolayer) combination.
All of the files were built using the rigid ion model. The files for the monolayers were subjected to the same simulation script used on the bulk physical mixtures.

2.8. MSD and Diffusion

The diffusion coefficient was computed from the atomic mean square displacement (MSD) determined every 100 timesteps for each group of atoms. The MSD shows a transient region that was not considered, and the stationary region was fitted with a linear function. The slope was used to calculate the diffusivity as a function of temperature, according to the following equations [35]:
M S D = r i 2 ( t ) = 1 N   i = 1 N ( r i ( t ) r i ( 0 ) ) 2 = 6 D t ( t   )
where ri(t) is the position of the atom i at the time t, D is the diffusion coefficient, t is the time.
The diffusivity, D, and the activation energy, EA, were obtained according to the following equations:
D = D 0 e x p ( E A R T )
l n ( D ) = l n ( D 0 ) E A R T
Due to the relatively small equilibration run and low temperatures studied, many MSD curves only stabilized to a linear-like shape at some later point during the measurement run. Thus, the function for determining diffusivity was only fitted during this interval. For all other MSD curves that presented a linear shape from the beginning of the measurement run, the diffusivity function was fitted from steps 200 thousand to 1 million.

2.9. Defect Formation

The total number of interstitial oxygen atoms was also studied in the simulation runs of defective In2O3, defective ZrO2, and all physical mixtures at the lowest measured temperature, 850 °C. Because many studied cases already contained vacancies from the beginning of the simulation, only oxygen interstitials were measured to determine the oxygen vacancy formation through Frenkel defects in each system in a comparable manner. The time series and time averaging functions of the visualization software OVITO [36] were used to average the number of interstitial atoms over the total number of state ‘snapshots’ (LAMMPS dumps) taken after the stabilization of the system. The average interstitial count was divided by the total number of oxygen sites in the perfect crystal of the corresponding In2O3 or ZrO2 slab to normalize the different crystal sizes.
As with the MSD function fitting, the average of interstitial oxygen atoms was taken from step 200 thousand to one million as a rule of thumb. For systems in which MSD stabilized only later in the measurement run, this average was taken in the same interval used for the diffusivity function fitting.

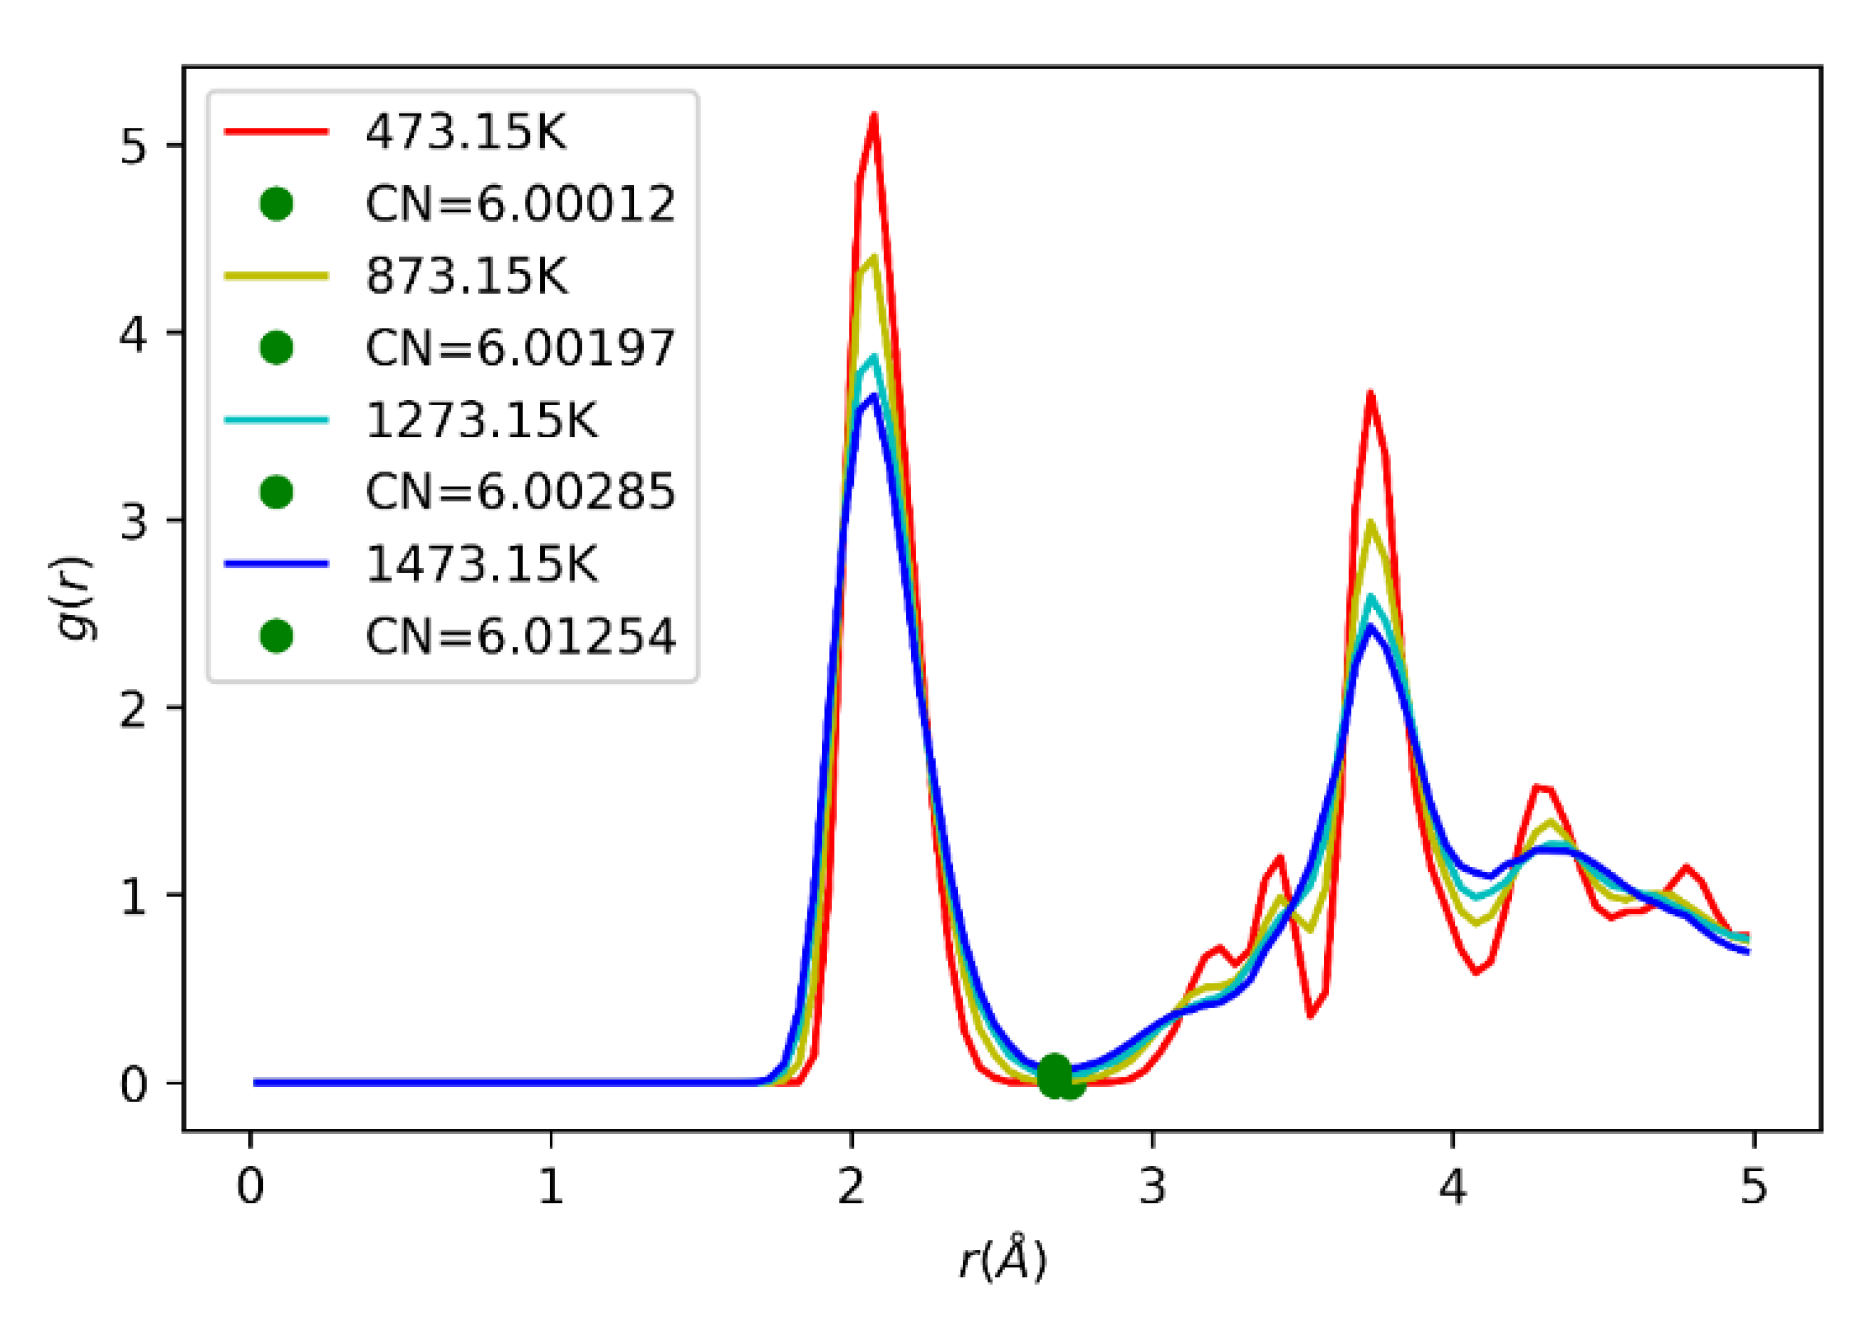
2.10. Radial Distribution Function (RDF)

In some simulation runs where the coordination of atoms was measured, radial distribution function (RDF) measures were computed for that atom group through a LAMMPS compute every 200 timesteps. These measurements were then outputted every 20 thousand steps and analyzed through a Python script, producing graphs of RDF vs distance from the atom. The first undulation represents the first coordination shell of the atom, the first neighbors. The area under this first coordination shell is the atom’s coordination number. The coordination number of the first coordination shell was taken directly from the LAMMPS compute.

3. Results and Discussion

3.1. In2O3 Model Verification and Selection

The rigid ion model with Walsh’s potential provided the best description for the lattice parameter and the linear expansion coefficient experimental values, as evidenced in Table 2. So it was chosen for the present calculations. Lau & Dunlap [24] had already argued in their work that this approach is appropriate in MD simulations when no electric field is applied to the solid. The choice of the rigid ion model simplifies the integration between different Buckingham potentials. Table 3 shows all considered potential parameters for each crystal.

3.2. In2O3 Defect Energy

Table 4 shows that for both the 3 × 3 × 3 and the 4 × 4 × 4 supercell, the rigid ion model was overall more accurate when compared to the data presented by Walsh. The small differences between our simulations and Walsh’s results indicate that the supercell method used by us and the Mott-Littleton approach used by Walsh are comparable, which further validates the proposed rigid ion model.

3.3. ZrO2 Model Selection

The results presented in the literature for the various ZrO2 potentials [33] were organized to represent only those potentials capable of accurately modeling the ZrO2 crystal through the rigid-ion model. Table 5 compares candidate potentials for describing the ZrO2 crystal. The properties evaluated are the lattice parameters a, b, and c; the unit cell angle β; and the bulk modulus. This analysis concluded that the best three candidate potentials were Schelling’s, Lau’s, and Kilo’s.
It was found that indeed none of them presents the monoclinic phase under the proposed simulated conditions. In the temperature range 473.15 K to 1273.15 K, both Lau’s and Kilo’s potential presented a zirconium coordination number of 6, as shown in Figure 3, while Schelling’s coordination number for zirconium was 8. Thus, it can be concluded that Lau’s and Kilo’s potentials developed an orthorhombic, rutile-like cell structure, while Schelling’s potential presented a tetragonal structure. Kilo’s potential was chosen to describe the ZrO2 compound. It results in an orthorhombic structure with a small deviation from the true monoclinic structure (less than 10 degrees in beta) and has an O−2–O−2 potential that resembles Walsh’s potential used to describe the In2O3 crystal, as shown in Figure 4. The similarity of the O−2–O−2 potentials suggests the use of only one potential description for both In2O3 and ZrO2 phases. When comparing the potential energy for oxygen ions interaction for the three best ZrO2 potentials and the two In2O3 potentials, it is clear that the potentials of Walsh and Kilo show great compatibility. So, Walsh’s potential was chosen to describe anionic interactions in the physical mixtures, as noted in Table 1.

3.4. Defective In2O3 and ZrO2

Table 6 shows the activation energy for oxygen diffusion considering different defects in both crystals. First, oxygen exhibits higher diffusion activation energy in ZrO2 for all intrinsic defects, probably due to the smaller interstitial size in this crystal. It is also observed that the diffusion activation energy increases following the same sequence of intrinsic defects for both the zirconia and indium oxide. Schottky has the lowest energy, followed by Frenkel and oxygen vacancies. To understand this phenomenon, OVITO was used. It was found that oxygen vacancies tended to distribute themselves symmetrically due to their effective repelling charges, which seem to stabilize the lattice and prevent diffusion to an extent. For Frenkel defects, it was observed that interstitial atoms tended to recombine with vacancies during the equilibration run. This way, by the time the measurement was done, there were significantly fewer Frenkel defects, and the crystal was almost perfect, thus making diffusion more difficult.
Doped ZrO2 exhibits the lowest diffusion activation energy for the substitutional defects, while doped In2O3 oxygen exhibits the highest, which may be attributed to the type of defect sites generated by the doping and their effective charges. In doped ZrO2 generates oxygen vacancies and substitutional indium sites. Oxygen vacancies are more susceptible to aid in diffusion than cationic vacancies due to their effective positive charge and their matching size with the oxygen atom. Also, the effective negative charge of the substitutional indium atoms repels oxygen, avoiding trapping the anions in this way. Figure 5 shows the path of some interstitial oxygen atoms compared with the substitutional indium atoms position, showing that these cations tend to be avoided by diffusing anions. These phenomena help lower the diffusion activation energy for oxygen in zirconia. However, Zr doped In2O3 creates indium vacancies and substitutional zirconium sites, making oxygen diffusion more energetically costly. The created indium vacancies are larger than oxygen atoms and have an effective charge of −3, making them repel oxygen atoms, thus not favoring their diffusion. Further, substitutional zirconium atoms have an effective charge of +1, attracting and trapping oxygen atoms in their vicinity, and slowing their diffusion. Figure 6 shows the trapping effect of Zr substitutional atoms on oxygen diffusion.
I n 2 O 3   2 I n Z r + 3 O O x + V O
3 Z r O 2   3 Z r I n + 6 O O x + V I n
The data for oxygen defect formation in Table 7 does not show many interesting patterns. The ZrO2 crystal showed higher overall defect formation. Also, as mentioned before, the recombination of interstitials and vacancies during the equilibration step reduces the number of Frenkel defects by the time of the measurement run. No obvious correlation between diffusion activation energy and defect formation was identified.

3.5. In2O3-ZrO2 Physical Mixture

Table 8 shows the oxygen diffusion activation energy with positive values for all attempted combinations. The mean square displacement of cations was very low, and for this reason, their diffusion activation energies were not calculated (Figure S3). It should also be noted that some calculations have near-zero or even negative oxygen diffusion activation energies due to the very low diffusivity (Figures S4 and S5). It is believed that the computation time was too short or the temperature too low.
Table 8 presents interesting trends. In all physical mixtures, the activation energy for oxygen diffusion in no-defects indium oxide was greater than the value observed for the 3% Schottky non-mixture In2O3 crystal (Table 6). The physical mixture shows the same qualitative effect on oxygen diffusion activation energy as the doping of these oxides with one another—ZrO2 elevates oxygen activation energy in In2O3, and In2O3 lowers the oxygen activation energy in ZrO2. The activation energy for oxygen diffusion in no-defect zirconia in the physical mixture was lower than for all intrinsic defects in non-mixture ZrO2. However, the lowest energy for all ZrO2 oxygens was still found for the case of substitutional indium defects in a non-mixture ZrO2 crystal, which points to an important result.
The mechanical, physical mixtures with the associate epitaxial piling of the ZrO2 and In2O3 nanocrystals affect oxygen diffusion equivalent to a doping process. It results from either small doping at the two materials interface or, most probably, the lattice tensions caused by the epitaxy between the two crystals. Yamamoto et al. [41] observed from DFT calculations that compressive stress caused a reduction in the oxygen diffusion coefficient in monoclinic and tetragonal ZrO2. These lattice tensions are illustrated in Figure 7 and Figure 8, which show how the interaction between crystals creates patterns of potential energies. For the In2O3 crystal, it seems these tensions stabilize oxygen atoms, inhibiting their diffusion even more than doping with zirconium, which agrees with the calculations from Nørskov et al. [17], that showed that oxygen vacancy formation energy is elevated in In2O3 by its contact with ZrO2. For ZrO2, the effect seems to be destabilization of the atom, although doping with indium still stimulates diffusion more significantly.
For the ZrO2 oxygens present in bulk ZrO2 over In2O3 and for In2O3 oxygens present in In2O3 over ZrO2, another interesting pattern is the lower diffusion activation energy of the setups without intrinsic defects in comparison to those with them. This behavior also points to the great influence of lattice tensions on oxygen diffusion in the studied physical mixtures. It is argued that for crystals with intrinsic defects, there is more room for lattice tensions to be dissipated through lattice distortion, while in perfect crystals there is not an easy outlet for this accumulated energy apart from atoms jumping lattice sites.
Lastly, activation energies for ZrO2 oxygens diffusion varied little between physical mixtures, presenting values between 0.51 and 0.88 eV, which is likely due to the stronger attraction oxygen atoms have towards zirconium atoms.
The results for defect formation in physical mixtures in Table 9 do not show any obvious correlation between defect formation and diffusion activation energy. Nevertheless, some general statements can be made about them. For all cases, physical mixtures had higher defect formation than their respective crystals with Schottky defects. So the mixture promotes defect formation in both crystals. These results strengthen earlier rationalizations in catalysis, which linked the physical mixture’s catalytic activity to increased oxygen vacancies in the In2O3 lattice [5,6,7,9,17]. Beyond that, physical mixtures with Schottky defects exhibited higher Frenkel defect formation percentages when compared to their non-defective counterpart. For In2O3 as the substrate, a monolayer of ZrO2 increases defects formation in both crystals, although this effect is more pronounced in the crystal which forms the monolayer.
Moreover, the ZrO2 crystal tended to form more Frenkel defects, just as in the defective crystal cases, except when it was the base crystal with edges touching the periodic boundary. It suggests that whether or not a crystal’s edges touch the periodic boundary does have significant implications for the systems studied. It should also be noted that defect formation was disproportionately higher in ZrO2 in the cases where it was not the substrate crystal compared to In2O3 when it was not the substrate crystal. So, even if the stabilization effect of the periodic boundary is important, the interaction between ZrO2 and In2O3 plays a major role in promoting or limiting defect formation. More specifically, the interaction promotes more oxygen vacancies for the ZrO2 lattice more than for the In2O3. These results are in contrast to experimental evidence [5,7]. Nonetheless, the studies that yielded this experimental evidence used a much smaller weight ratio of indium to zirconium oxide when preparing their catalysts than the weight ratio of the simulated physical mixtures.
Although the diffusion of cations was not high enough to allow calculation of its activation energies, it was high enough to be detected by a simple visual inspection in OVITO, as shown in Figure 9. So Zr atoms in In2O3 have been found to stabilize it, thus limiting excessive vacancy formation on its surface [13]. Furthermore, the diffused cations would form a very diluted solution in the other crystal, with a concentration of approximately one in thousands in the receiving crystal, but this could have important implications for catalysis. Catalysts of ZrO2 doped by Zn in similar concentrations have already been found effective in catalyzing isobutylene synthesis from ethanol [42].
Though they do not constitute conclusive evidence, these observations about the zirconia crystal all point in the direction that it may have a more important role in the catalysis of ethanol to isobutylene than previously proposed when in a physical mixture with In2O3. Sun et al. [43] demonstrated in their theoretical DFT and experimental studies that the presence of ZrO2 played a key role in stabilizing the surface oxygen atoms of In2O3 in In2O3/ZrO2-based catalysts in the hydrogenation of CO2 to methanol. Our study provides complementary results, that ZrO2 may likewise play an important role in the reaction to obtain isobutene. Increased oxygen diffusivity and defect formation within the crystal are good indicators of its higher ability to contribute to the acetone generation via Mars Van Krevelen mechanism one important intermediate of the isobutene synthesis [10]. Besides that, the diffusion of indium atoms to the ZrO2 lattice is significant as the use of doped ZrO2 with another low valence dopant [42,44,45], Zn, has already been proved effective for the isobutylene synthesis from ethanol by acting on the rate-limiting step of the generation of acetone, intermediate of this olefin synthesis, from ethanol) [44,45]. Thus a complete understanding of this cascade reaction could involve both In2O3 and ZrO2 acting on different steps along its way. Nonetheless, the ZrO2-In2O3 system seems to follow the moderation principle suggested by McFarland [46] which states that the oxygen must not be easily removed from the catalyst surface since it would be difficult to have it back and close the Mars Van Krevelen mechanism.

4. Conclusions

The results regarding oxygen diffusion pointed out a distinct pattern whereby the physical mixture of one oxide on another had the same qualitative effect as their doping—the activation energy for oxygen diffusion was lowered in ZrO2 and became higher in In2O3. This behavior is most likely due to the lattice tensions generated by the epitaxy between the crystals.
Further, the modified physical mixture promotes oxygen Frenkel defect formation in both crystals at higher concentrations in the case of the ZrO2 crystal, which confirms the observations from past studies that oxygen vacancies formation is promoted in In2O3 by the presence of ZrO2.
The present calculations also indicate the presence of very small cation diffusion between both crystals in the physical mixture, which will change the defect concentration in the indium and zirconium oxides.
For the In2O3 crystal in the physical mixture, the present results matched well the vacancy formation, oxygen stabilization, and higher diffusion activation energy. In contrast, for the ZrO2 crystal in the modified physical mixture, higher overall oxygen vacancy formation, the lower activation energy for oxygen diffusion, and the diffusion of indium cations into its structure all pointed to a role not previously considered in the literature for this catalytic system. Furthermore, the changes observed for ZrO2 in our computational analyzes contrasted with some experimental data obtained previously. Indeed, published previous investigations show higher concentrations of ZrO2 than those of this work. Considering that the techniques usually employed in catalyst characterization do not show lateral resolution, it was not possible to observe these ZrO2 changes.
Thus, the physical mixture’s role as a catalyst is due to the role of two modified materials and the interactions resulting from the interdiffusion of In2O3 and ZrO2 crystals.

Supplementary Materials

The following supporting information can be downloaded at: https://www.mdpi.com/article/10.3390/ijms24032426/s1, Figure S1: – average potential energy per atom vs lattice parameter graph for In2O3 described by Walsh’s rigid ion model; Figure S2: elongation vs difference in temperature for In2O3 described by Walsh’s rigid ion model; Figure S3: MSD over time for indium atoms in the ZrO2(111) over In2O3(111) physical mixture with no initial defects; Figure S4: MSD over time for In2O3 oxygen atoms in the ZrO2(211) over In2O3(111) physical mixture with no initial defects; Figure S5: ln(D) over T-1 for In2O3 oxygen atoms in the ZrO2(211) over In2O3(111) physical mixture with no initial defects.

Author Contributions

L.E.F.: methodology, investigation, validation, formal analysis, writing—original; B.J.d.S.B.: methodology, investigation, validation, formal analysis, visualization, writing—review & editing; L.G.A.: conceptualization, writing—review & editing; R.R.d.A.: conceptualization, supervision, funding acquisition, methodology, writing-review & editing. All authors have read and agreed to the published version of the manuscript.

Funding

This study was financed in part by the Coordenação de Aperfeiçoamento de Pessoal de Nível Superior—Brasil, (CAPES)—Finance Code 001, and Conselho Nacional de Desenvolvimento Científico e Tecnológico—CNPq, Brazil, CNPq 315081/2021-0 e 304015/2019-9.

Institutional Review Board Statement

Not applicable.

Informed Consent Statement

Not applicable.

Data Availability Statement

The LAMMPS and PYTHON codes are available upon request.

Conflicts of Interest

The authors declare that they have no known competing financial interests or personal relationships that could have appeared to influence the work reported in this paper.

References

  1. Walsh, A.; Catlow, C.R.A.; Sokol, A.A.; Woodley, S.M. Physical Properties, Intrinsic Defects, and Phase Stability of Indium Sesquioxide. Chem. Mater. 2009, 21, 4962–4969. [Google Scholar] [CrossRef]
  2. Wang, J.; Zhang, G.; Zhu, J.; Zhang, X.; Ding, F.; Zhang, A.; Guo, X.; Song, C. CO2 Hydrogenation to Methanol over In2O3-Based Catalysts: From Mechanism to Catalyst Development. ACS Catal. 2021, 11, 1406–1423. [Google Scholar] [CrossRef]
  3. Wang, J.; Liu, C.Y.; Senftle, T.P.; Zhu, J.; Zhang, G.; Guo, X.; Song, C. Variation in the In2O3 Crystal Phase Alters Catalytic Performance toward the Reverse Water Gas Shift Reaction. ACS Catal. 2020, 10, 3264–3273. [Google Scholar] [CrossRef]
  4. Martin, O.; Martín, A.J.; Mondelli, C.; Mitchell, S.; Segawa, T.F.; Hauert, R.; Drouilly, C.; Curulla-Ferré, D.; Pérez-Ramírez, J. Indium Oxide as a Superior Catalyst for Methanol Synthesis by CO2 Hydrogenation. Angew. Chemie Int. Ed. 2016, 55, 6261–6265. [Google Scholar] [CrossRef] [PubMed]
  5. Zonetti, P.C.; Bridi, V.L.; Gonzalez, G.G.; Moreira, C.R.; Alves, O.C.; de Avillez, R.R.; Appel, L.G. Isobutene from Ethanol: Describing the Synergy between In2O3 and m-ZrO2. ChemCatChem 2019, 11, 4011–4020. [Google Scholar] [CrossRef] [Green Version]
  6. Bronsato, B.J.d.S.; Zonetti, P.C.; Moreira, C.R.; Mendoza, C.D.; Maia da Costa, M.E.H.; Alves, O.C.; de Avillez, R.R.; Appel, L.G. How the Interaction between In2O3-ZrO2 Promotes the Isobutene Synthesis from Ethanol? Catal. Today 2020, 381, 224–233. [Google Scholar] [CrossRef]
  7. Frei, M.S.; Mondelli, C.; Cesarini, A.; Krumeich, F.; Hauert, R.; Stewart, J.A.; Curulla Ferré, D.; Pérez-Ramírez, J. Role of Zirconia in Indium Oxide-Catalyzed CO2 Hydrogenation to Methanol. ACS Catal. 2020, 10, 1133–1145. [Google Scholar] [CrossRef]
  8. Chen, Y.; Zhai, Z.; Liu, J.; Zhang, J.; Geng, Z.; Lyu, H. The Synergistic Effects of Cu Clusters and In2O3 on Ethanol Synthesis from Acetic Acid Hydrogenation. Phys. Chem. Chem. Phys. 2019, 21, 23906–23915. [Google Scholar] [CrossRef]
  9. Chen, Y.; Li, G.; Zhang, M.; Jiang, H.; Lyu, H.; Liu, J. Effect of Surface Oxygen Vacancy Sites on Ethanol Synthesis from Acetic Acid Hydrogenation on a Defective In2O3 (110) Surface. Phys. Chem. Chem. Phys. 2018, 20, 7156–7166. [Google Scholar]
  10. Doornkamp, C.; Ponec, V. The Universal Character of the Mars and Van Krevelen Mechanism. J. Mol. Catal. A Chem. 2000, 162, 19–32. [Google Scholar] [CrossRef]
  11. Chen, B.W.J.; Xu, L.; Mavrikakis, M. Computational Methods in Heterogeneous Catalysis. Chem. Rev. 2021, 121, 1007–1048. [Google Scholar] [CrossRef]
  12. Dou, M.; Zhang, M.; Chen, Y.; Yu, Y. Mechanistic Insight into the Modification of the Surface Stability of In2O3 Catalyst Through Metal Oxide Doping. Catal. Lett. 2018, 148, 3723–3731. [Google Scholar] [CrossRef]
  13. Zhang, M.; Wang, W.; Chen, Y. Insight of DFT and Ab Initio Atomistic Thermodynamics on the Surface Stability and Morphology of In2O3. Appl. Surf. Sci. 2018, 434, 1344–1352. [Google Scholar] [CrossRef]
  14. Walsh, A.; Catlow, C.R.A. Structure, Stability and Work Functions of the Low Index Surfaces of Pure Indium Oxide and Sn-Doped Indium Oxide (ITO) from Density Functional Theory. J. Mater. Chem. 2010, 20, 10438–10444. [Google Scholar] [CrossRef]
  15. Ziemba, M.; Schumacher, L.; Hess, C. Reduction Behavior of Cubic In2O3 Nanoparticles by Combined Multiple in Situ Spectroscopy and DFT. J. Phys. Chem. Lett. 2021, 12, 3749–3754. [Google Scholar] [CrossRef]
  16. Walsh, A.; Sokol, A.A.; Catlow, C.R.A. Free Energy of Defect Formation: Thermodynamics of Anion Frenkel Pairs in Indium Oxide. Phys. Rev. B-Condens. Matter Mater. Phys. 2011, 83, 224105. [Google Scholar] [CrossRef] [Green Version]
  17. Nørskov, J.K.; Cao, A.; Wang, Z.; Li, H. Relations between Surface Oxygen Vacancies and Activity of Methanol Formation from CO2 Hydrogenation over In2O3 Surfaces. ACS Catal. 2021, 11, 1780–1786. [Google Scholar] [CrossRef]
  18. Warschkow, O.; Ellis, D.E.; González, G.B.; Mason, T.O. Defect Structures of Tin-Doped Indium Oxide. J. Am. Ceram. Soc. 2003, 86, 1700–1706. [Google Scholar] [CrossRef]
  19. Hou, Q.; Buckeridge, J.; Lazauskas, T.; Mora-Fonz, D.; Sokol, A.A.; Woodley, S.M.; Catlow, C.R.A. Defect Formation in In2O3 and SnO2: A New Atomistic Approach Based on Accurate Lattice Energies. J. Mater. Chem. C 2018, 6, 12386–12395. [Google Scholar] [CrossRef] [Green Version]
  20. Walsh, A.; Woodley, S.M.; Catlow, C.R.A.; Sokol, A.A. Potential Energy Landscapes for Anion Frenkel-Pair Formation in Ceria and India. Solid State Ion. 2011, 184, 52–56. [Google Scholar] [CrossRef]
  21. Bush, T.S.; Gale, J.D.; Catlow, C.R.A.; Battle, P.D. Self-Consistent Interatomic Potentials for the Simulation of Binary and Ternary Oxides. J. Mater. Chem. 1994, 4, 831–837. [Google Scholar] [CrossRef]
  22. Schelling, P.K.; Phillpot, S.R. Mechanism of Thermal Transport in Zirconia and Yttria-Stabilized Zirconia by Molecular-Dynamics Simulation. J. Am. Ceram. Soc. 2001, 84, 2997–3007. [Google Scholar] [CrossRef]
  23. Kilo, M.; Argirusis, C.; Borchardt, G.; Jackson, R.A. Oxygen Diffusion in Yttria Stabilised Zirconia—Experimental Results and Molecular Dynamics Calculations. Phys. Chem. Chem. Phys. 2003, 5, 2219–2224. [Google Scholar] [CrossRef]
  24. Lau, K.C.; Dunlap, B.I. Molecular Dynamics Simulation of Yttria-Stabilized Zirconia (YSZ) Crystalline and Amorphous Solids. J. Phys. Condens. Matter 2011, 23, 035401. [Google Scholar] [CrossRef]
  25. Van Duin, A.C.T.; Merinov, B.V.; Han, S.S.; Dorso, C.O.; Goddard, W.A. ReaxFF Reactive Force Field for the Y-Doped BaZrO3 Proton Conductor with Applications to Diffusion Rates for Multigranular Systems. J. Phys. Chem. A 2008, 112, 11414–11422. [Google Scholar] [CrossRef] [PubMed] [Green Version]
  26. Buckingham, R.A. The Classical Equation of State of Gaseous Helium, Neon and Argon. Proc. R. Soc. London Ser. A. Math. Phys. Sci. 1938, 168, 264–283. [Google Scholar]
  27. Thompson, A.P.; Aktulga, H.M.; Berger, R.; Bolintineanu, D.S.; Brown, W.M.; Crozier, P.S.; in’t Veld Pieter, J.; Kohlmeyer, A.; Moore, S.G.; Nguyen, T.D.; et al. LAMMPS- a flexible simulation tool for particle-based materials modeling at the atomic, meso, and continuum scales. Comput. Phys. Commun. 2022, 271, 108171. [Google Scholar] [CrossRef]
  28. Larsen, A.H.; Mortensen, J.J.; Blomqvist, J.; Castelli, I.E.; Christensen, R.; Dułak, M.; Friis, J.; Groves, M.N.; Hammer, B.; Hargus, C.; et al. The Atomic Simulation Environment—A Python Library for Working with Atoms. J. Phys. Energy 2017, 29, 273002. [Google Scholar]
  29. Daoud, S.; Loucif, K.; Bioud, N.; Lebgaa, N. First-Principles Study of Structural, Elastic and Mechanical Properties of Zinc-Blende Boron Nitride (B3-BN). Acta Phys. Pol. A 2012, 122, 109–115. [Google Scholar] [CrossRef]
  30. Murnaghan, F.D. The Compressibility of Media Under Extreme Pressures. Proc. Natl. Acad. Sci. USA 1944, 30, 244–247. [Google Scholar] [CrossRef] [Green Version]
  31. Aroyo, M.I.; Perez-Mato, J.M.; Capillas, C.; Kroumova, E.; Ivantchev, S.; Madariaga, G.; Kirov, A.; Wondratschek, H. Bilbao Crystallographic Server: I. Databases and Crystallographic Computing Programs. Zeitschrift fur Krist. 2006, 221, 15–27. [Google Scholar] [CrossRef]
  32. Wyckoff Positions. Available online: https://www.cryst.ehu.es/cryst/get_wp.html (accessed on 3 December 2021).
  33. Bandura, A.V.; Lukyanov, S.I.; Evarestov, R.A. Atom–Atom Force Field for Simulation of Zirconia Bulk, Nanosheets and Nanotubes. Mol. Simul. 2017, 43, 886–899. [Google Scholar] [CrossRef]
  34. Lewis, G.V.; Catlow, C.R.A. Potential models for ionic oxides. J. Phys. C Solid State Phys. 1985, 18, 1149–1161. [Google Scholar] [CrossRef]
  35. Lee, J.G. Computational Materials Science: An Introduction, 2nd ed.; CRC Press: Boca Raton, FL, USA, 2017; p. 43. [Google Scholar]
  36. Stukowski, A. Visualization and Analysis of Atomistic Simulation Data with OVITO-the Open Visualization Tool. Model. Simul. Mater. Sci. Eng. 2010, 18, 015012. [Google Scholar] [CrossRef]
  37. Marezio, M. Refinement of the Crystal Structure of In2O3 at Two Wavelengths. Acta Crystallogr. 1966, 20, 723–728. [Google Scholar] [CrossRef]
  38. Liu, D.; Lei, W.W.; Zou, B.; Yu, S.D.; Hao, J.; Wang, K.; Liu, B.B.; Cui, Q.L.; Zou, G.T. High-Pressure x-Ray Diffraction and Raman Spectra Study of Indium Oxide. J. Appl. Phys. 2008, 104, 083506. [Google Scholar] [CrossRef] [Green Version]
  39. Weiher, R.L.; Ley, R.P. Thermal Expansion of Indium Oxide. J. Appl. Phys. 1963, 34, 1833–1834. [Google Scholar] [CrossRef]
  40. Kundra, K.D.; S. Z. Ali. Thermal Expansion of In2O3. J. Appl. Cryst. 1970, 543–545. [Google Scholar] [CrossRef]
  41. Yamamoto, Y.; Morishita, K.; Iwakiri, H.; Kaneta, Y. Stress Dependence of Oxygen Diffusion in ZrO2 Film. Nucl. Instrum. Methods Phys. Res. Sect. B Beam Interact. Mater. Atoms 2013, 303, 42–45. [Google Scholar] [CrossRef]
  42. Liu, C.; Sun, J.; Smith, C.; Wang, Y. A Study of ZnxZryOz Mixed Oxides for Direct Conversion of Ethanol to Isobutene. Appl. Catal. A Gen. 2013, 467, 91–97. [Google Scholar] [CrossRef]
  43. Sun, K.; Shen, C.; Zou, R.; Liu, C.J. Highly active Pt/In2O3-ZrO2 catalyst for CO2 hydrogenation to methanol with enhanced CO tolerance: The effects of ZrO2. Appl. Catal. B: Environ. 2023, 320, 122018. [Google Scholar] [CrossRef]
  44. Silva-Calpa, L.D.; Zonetti, P.C.; de Oliveira, D.C.; de Avillez, R.R.; Appel, L.G. Acetone from Ethanol Employing ZnxZr1−xO2−y. Catal. Today 2017, 289, 264–272. [Google Scholar] [CrossRef]
  45. Sun, J.; Baylon, R.A.L.; Liu, C.; Mei, D.; Martin, K.J.; Venkitasubramanian, P.; Wang, Y. Key Roles of Lewis Acid-Base Pairs on ZnxZryOz in Direct Ethanol/Acetone to Isobutene Conversion. J. Am. Chem. Soc. 2016, 138, 507–517. [Google Scholar] [CrossRef] [PubMed]
  46. McFarland, E.W.; Metiu, H. Catalysis by Doped Oxides. Chem. Rev. 2013, 113, 4391–4427. [Google Scholar] [CrossRef]
Figure 1. ZrO2(111) over In2O3(111): (a) top view, (b) front view, (c) ZrO2(111) over In2O3(111) with periodic structure replicated three times in each direction. Red is reserved for the In cations, with blue for oxygen in In2O3 structure; pink is oxygen, with yellow for Zr cation in ZrO2 slab.
Ijms 24 02426 g001
Figure 2. ZrO2(211) monolayer over In2O3(111): (a) top view, (b) front view.
Ijms 24 02426 g002
Figure 3. Zirconium radial distribution function as modeled by Kilo’s potential.
Ijms 24 02426 g003
Figure 4. Oxygen-oxygen ion potential by analyzed models.
Ijms 24 02426 g004
Figure 5. Substitutional indium atoms in red, interstitial oxygen atoms in the last data dump of the simulation in blue, and the diffusion paths of those oxygen atoms in green. (a) 60 substitutional In (b) 90 substitutional In.
Ijms 24 02426 g005
Figure 6. In2O3 doped with 22% percent zirconium. (a) Substitutional zirconium atoms in yellow, interstitial oxygen atoms in the last data dump of the simulation in blue, (b) the diffusion paths of those oxygen atoms in green.
Ijms 24 02426 g006
Figure 7. ZrO2(111) over In2O3(111) physical mixture. In2O3 oxygen atoms potential energy at the interface (eV).
Ijms 24 02426 g007
Figure 8. In2O3(111) over ZrO2(111) physical mixture. ZrO2 oxygen atoms potential energy at the interface (eV).
Ijms 24 02426 g008
Figure 9. Indium (red) and zirconium (green) diffusion paths in defective ZrO2(102) over In2O3(111) physical mixture.
Ijms 24 02426 g009
Table 1. Buckingham interatomic pair potential parameters for the In2O3 and ZrO2 physical mixture.
A (eV)ρ (Å)C (eV Å6)Reference
In+3—O−21498.6510.340533.2[1]
Zr+4—O−21024.6000.37600.0[23]
O−2—O−222,764.0000.149032.0[1]
Table 2. Comparison of the different In2O3 interatomic potentials and experimental data.
Walsh’s PotentialWarschkow’s Potential
PropertiesExperimentReference [1]Core-Shell Model
Results
Rigid Ion Model
Results
ReferenceCore-Shell Model
Results
Rigid Ion Model
Results
Lattice parameter (Å)[37] 10.11710.121010.050210.118810.120010.418610.1182
Bulk Modulus (GPa)[38] 194.24193.7700204.9747196.8721222.7900179.8271226.5402
Linear expansion coefficient, α (°C−1)[39] 6.15 × 10⁻⁶NA5.25 × 10−66.14 × 10⁻⁶NA1.25 × 10−57.22 × 10⁻⁶
[40] 7.5 × 10⁻⁶
Table 3. Interatomic potentials used for the present calculations.
A (eV)ρ (Å)C (eV Å6)Reference
In2O3 crystal
In+3—O−21498.6510.34050033.2000[1]
O−2—O−222,764.0000.14900032.0000[1]
In+3—O−22719.7700.2917000.0000[18]
O−2—O−225.4100.69370032.3200[18]
ZrO2 crystal
Zr+4—O−21024.6000.3760000.0000[23]
O−2—O−222,764.0000.14900027.8900[23]
Zr+4—O−21292.8500.35838819.3646[24]
O−2—O−213,098.9000.21967049.2998[24]
Zr+4—O−21502.1100.34505.1000[22]
O−2—O−29547.9600.224032.0000[22]
Table 4. In2O3 defect energies in eV.
3 × 3 × 3 Supercell4 × 4 × 4 Supercell
ReferenceCore-Shell ModelRigid Ion ModelCore-Shell ModelRigid Ion Model
Defect TypeWalsh
et al., 2009 [1]
Simulated ValuesDifference from ReferenceSimulated ValuesDifference from ReferenceSimulated ValuesDifference from ReferenceSimulated ValuesDifference from Reference
Lattice energy−140.60−141.400.6%−140.570.0%−141.400.6%−140.570.0%
In vacancy (8b)49.9249.820.2%50.080.3%50.210.6%50.310.8%
In vacancy (24d)50.0550.420.7%50.991.9%50.721.3%51.222.3%
O vacancy20.9921.713.4%21.130.7%21.894.3%21.231.1%
In intersticial (8a)−33.57−34.713.4%−33.991.3%−34.382.4%−33.760.6%
In intersticial (16c)−36.21−35.751.3%−35.482.0%−35.412.2%−35.272.6%
In intersticial (24d)−34.89−34.092.3%−33.414.2%−33.743.3%−33.085.2%
O intersticial (8a)−13.29−14.206.8%−13.131.2%−14.035.6%−13.032.0%
O intersticial (16c)−14.61−15.435.6%−14.540.5%−15.254.4%−14.441.2%
O intersticial (24d)−12.08−13.037.9%−11.703.1%−12.846.3%−11.604.0%
cation Frenkel pair6.857.042.8%7.408.0%7.408.0%6.485.4%
anion Frenkel pair3.193.141.6%3.303.4%3.324.1%3.437.5%
Schottky defect.4.444.675.2%4.583.2%4.9411.3%4.716.1%
Differences mean 3.2% 2.3% 4.2% 3.0%
Table 5. Comparison of the different ZrO2 interatomic potentials and experimental data.
SchellingKiloLewis-CatlowLau-Dunlap
PropertiesExperimental Values for
monoclinic ZrO2
Simulated ValuesDifference from ExperimentSimulated ValuesDifference from ExperimentSimulated ValuesDifference from ExperimentSimulated ValuesDifference from Experiment
a (Å)5.1495.2341.7%5.2912.8%4.9543.8%5.2011.0%
b (Å)5.2084.9045.8%4.9734.5%4.9544.9%4.8716.5%
c (Å)5.3165.5744.9%5.6245.8%4.9546.8%5.5644.7%
β (°)99.2390.009.3%89.999.3%90.009.3%90.009.3%
Bulk modulus (Gpa)20123516.9%1962.5%32762.7%23617.4%
Mean difference 7.7% 5.0% 17.5% 7.8%
Table 6. Oxygen diffusion activation energy (eV) in defective crystals. * Indicates that not all temperatures were used due to negative diffusivity being calculated in one of them.
DefectsPseudo-Monoclinic ZrO2Cubic In2O3
3% Schottky1.04660.3626
Frenkel1.5041 *0.4065
Oxygen vacancies2.48010.5114
12% substitutional In0.3093
18% substitutional In0.4974
9% substitutional Zr 1.3753
22% substitutional Zr 1.2548
Table 7. Anion Frenkel defects formation percentage at 850 °C in defective crystals.
DefectsPseudo-Monoclinic ZrO2Cubic In2O3
3% Schottky0.87%0.00%
Frenkel0.42%0.51%
Oxygen vacancies1.19%0.00%
12% substitutional In0.54%
18% substitutional In0.45%
9% substitutional Zr 0.67%
22% substitutional Zr 1.90%
Table 8. Oxygen diffusion activation energy (eV) in physical mixtures.
In2O3 OxygenZrO2 Oxygen
Physical MixtureNo Defects3% SchottkyNo Defects3% Schottky
Pseudo-monoclinic ZrO2(111) over cubic In2O3(111)2.02240.43310.51010.8796
Pseudo-monoclinic ZrO2(102) over cubic In2O3(111)0.98510.46000.61610.7661
ZrO2(211) monolayer
over cubic In2O3(111)
1.04640.95550.79710.6970
Cubic In2O3(111) over
pseudo-monoclinic ZrO2(111)
0.42620.81950.84330.8307
Table 9. Anion Frenkel defects formation percentage at 850 °C in physical mixtures.
In2O3 OxygenZrO2 Oxygen
Physical MixtureNo Defects3% SchottkyNo Defects3% Schottky
Pseudo-monoclinic ZrO2(111) over cubic In2O3(111)1.02%1.61%11.55%13.17%
Pseudo-monoclinic ZrO2(102) over cubic In2O3(111)1.49%2.08%12.27%14.87%
ZrO2(211) monolayer
over cubic In2O3(111)
1.86%2.46%20.72%22.73%
Cubic In2O3(111) over
pseudo-monoclinic ZrO2(111)
5.89%7.52%3.19%4.12%
Disclaimer/Publisher’s Note: The statements, opinions and data contained in all publications are solely those of the individual author(s) and contributor(s) and not of MDPI and/or the editor(s). MDPI and/or the editor(s) disclaim responsibility for any injury to people or property resulting from any ideas, methods, instructions or products referred to in the content.

