

Dietary Habits and Nutrient Deficiencies in a Cohort of European Crohn’s Disease Adult Patients


 ,
,  ,
,  ,
,
Abstract
1. Introduction
2. Results
2.1. Macronutrient Intake and Dietary Patterns
2.2. Vitamin Intake
2.3. Mineral Intake
2.4. Lipids
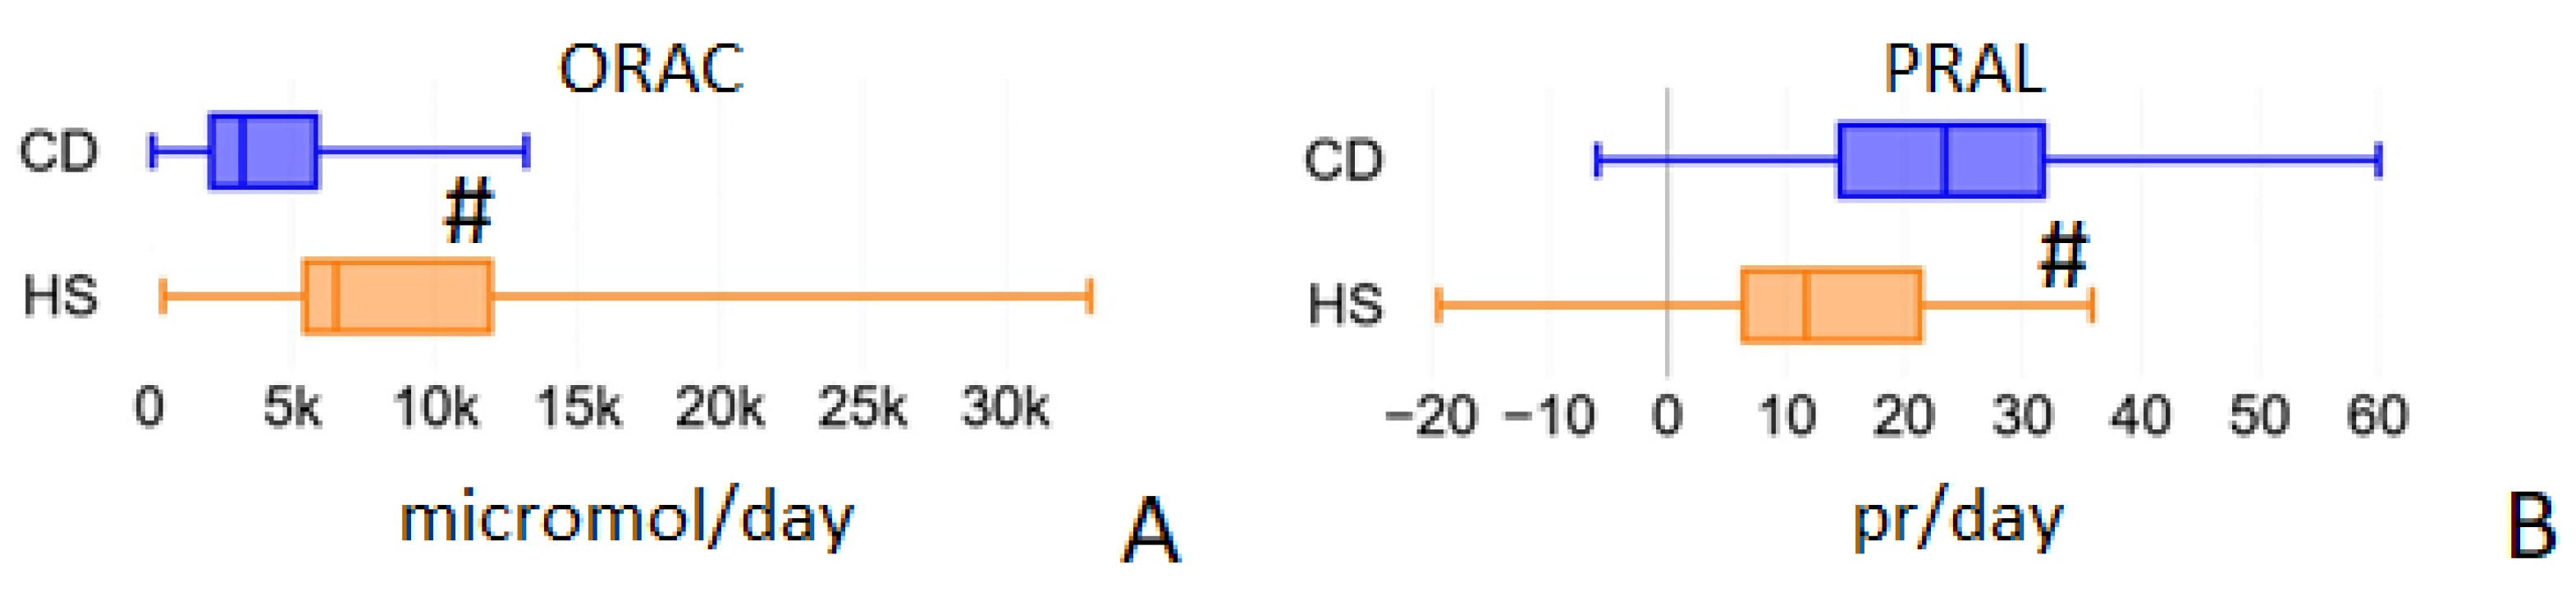
2.5. ORAC and PRAL
2.6. Nutrient Blood Values
3. Discussion
4. Materials and Methods
4.1. Study Population
4.2. Study Design
4.2.1. Inclusion Criteria
4.2.2. Exclusion Criteria
4.3. Study Procedures
4.4. Food Questionnaires Analysis
4.5. Statistical Analysis
5. Conclusions
Supplementary Materials
Author Contributions
Funding
Institutional Review Board Statement
Informed Consent Statement
Data Availability Statement
Conflicts of Interest
References
- Ananthakrishnan, A.N. Environmental Risk Factors for Inflammatory Bowel Diseases: A Review. Dig. Dis. Sci. 2015, 60, 290–298. [Google Scholar] [CrossRef] [PubMed]
- Malik, T. Inflammatory Bowel Disease: Historical Perspective, Epidemiology, and Risk Factors. Surg. Clin. N. Am. 2015, 95, 1105–1122. [Google Scholar] [CrossRef]
- Rizzello, F.; Spisni, E.; Giovanardi, E.; Imbesi, V.; Salice, M.; Alvisi, P.; Valerii, M.C.; Gionchetti, P. Implications of the Westernized Diet in the Onset and Progression of IBD. Nutrients 2019, 11, 1033. [Google Scholar] [CrossRef] [PubMed]
- Molodecky, N.A.; Soon, I.S.; Rabi, D.M.; Ghali, W.A.; Ferris, M.; Chernoff, G.; Benchimol, E.I.; Panaccione, R.; Ghosh, S.; Barkema, H.W.; et al. Increasing incidence and prevalence of the inflammatory bowel diseases with time, based on systematic review. Gastroenterolgy 2012, 142, 46–54. [Google Scholar] [CrossRef]
- Khalili, H.; Chan, S.S.M.; Lochhead, P.; Ananthakrishnan, A.N.; Hart, A.R.; Chan, A.T. The role of diet in the aetiopathogenesis of inflammatory bowel disease. Nat. Rev. Gastroenterol. Hepatol. 2018, 15, 525–535. [Google Scholar] [CrossRef] [PubMed]
- Schreiner, P.; Martinho-Grueber, M.; Struderus, D.; Vavricka, S.R.; Tilg, H.; Biedermann, L. Nutrition in Inflammatory Bowel Disease. Digestion 2019, 101, 120–135. [Google Scholar] [CrossRef]
- Lamb, C.A.; Kennedy, N.A.; Raine, T.; Hendy, P.A.; Smith, P.J.; Limdi, J.K.; Hayee, B.; Lomer, M.C.E.; Parkes, G.C.; Selinger, C.; et al. British society of gastroenterology consensus guidelines on the management of inflammatory bowel disease in adults. Gut 2019, 68, s1–s106. [Google Scholar] [CrossRef]
- Palacio, F.; de Souza, L.; Moreira, J.; Luiz, R.R.; de Souza, H.; Zaltman, C. Hospitalization and surgery rates in patients with inflammatory bowel disease in Brazil: A time-trend analysis. BMC Gastroenterol. 2021, 21, 192. [Google Scholar] [CrossRef]
- Khor, B.; Gardet, A.; Xavier, R.J. Genetics and pathogenesis of inflammatory bowel disease. Nature 2011, 474, 307–317. [Google Scholar] [CrossRef]
- Goh, J.; O’Morain, C.A. Review article: Nutrition and adult inflammatory bowel disease. Aliment. Pharmacol. Ther. 2003, 17, 307–320. [Google Scholar] [CrossRef]
- World Health Organization: Malnutrition. Available online: https://www.who.int/news-room/fact-sheets/detail/malnutrition (accessed on 9 June 2021).
- Cederholm, T.; Barazzoni, R.; Austin, P.; Ballmer, P.M.; Biolo, G.; Bischoff, S.C.; Compher, C.; Correia, I.; Higashiguchi, T.; Holst, M.; et al. ESPEN guidelines on definitions and terminology of clinical nutrition. Clin Nutr. 2017, 36, 49–64. [Google Scholar] [CrossRef] [PubMed]
- Labriola, F.; Marcato, C.; Zarbo, C.; Betti, L.; Catelli, A.; Valerii, M.C.; Spisni, E.; Alvisi, P. Dietary habits of a group of children with Crohn’s disease compared to healthy subjects: Assessment of risk of dutritional Deficiencies through a bromatological analysis. Nutrients 2022, 14, 499. [Google Scholar] [CrossRef] [PubMed]
- Weisshof, R.; Chermesh, I. Micronutrient deficiencies in inflammatory bowel disease. Curr. Opin. Clin. Nutr. Metab. Care 2015, 18, 576–581. [Google Scholar] [CrossRef] [PubMed]
- Hwang, C.; Hong, K. Other micronutrient deficiencies in inflammatory bowel disease: From A to Zinc. In Nutritional Management of Inflammatory Bowel Diseases; Ananthakrishnan, A., Ed.; Springer International Publishing: Cham, Switzerland, 2016; pp. 65–101. [Google Scholar]
- Armstrong, H.; Mander, I.; Zhang, Z.; Armstrong, D.; Wine, E. Not all fibers are born equal; variable response to dietary fiber subtypes in IBD. Front Pediatr. 2021, 8, 620189. [Google Scholar] [CrossRef]
- Kikut, J.; Skonieczna-Żydecka, K.; Sochaczewska, D.; Kordek, A.; Szczuko, M. Differences in dietary patterns of adolescent patients with IBD. Nutrients 2021, 13, 3119. [Google Scholar] [CrossRef]
- Llewellyn, S.R.; Britton, G.J.; Contijoch, E.J.; Vennaro, O.H.; Mortha, A.; Colombel, J.F.; Grinspan, A.; Clemente, J.C.; Merad, M.; Faith, J.J. Interactions between diet and the intestinal microbiota alter intestinal permeability and colitis severity in mice. Gastroenterology 2018, 154, 1037–1046.e2. [Google Scholar] [CrossRef]
- Campmans-Kuijpers, M.J.E.; Dijkstra, G. Food and food groups in inflammatory bowel disease (IBD): The design of the groningen anti-Inflammatory diet (GrAID). Nutrients 2021, 13, 1067. [Google Scholar] [CrossRef]
- Gordon, B.L.; Galati, J.S.; Yang, S.; Longman, R.S.; Lukin, D.; Scherl, E.J.; Battat, R. Prevalence and factors associated with vitamin C deficiency in inflammatory bowel disease. World J. Gastroenterol. 2022, 28, 4834–4845. [Google Scholar] [CrossRef]
- Liu, K.Y.; Nakatsu, C.H.; Jones-Hall, Y.; Kozik, A.; Jiang, Q. Vitamin E alpha- and gamma-tocopherol mitigate colitis, protect intestinal barrier function and modulate the gut microbiota in mice. Free Radic. Biol. Med. 2021, 163, 180–189. [Google Scholar] [CrossRef]
- Barbalho, S.M.; Goulart, R.A.; Batista, G.L.D.S.A. Vitamin A and inflammatory bowel diseases: From cellular studies and animal models to human disease. Expert Rev. Gastroenterol. Hepatol. 2019, 13, 25–35. [Google Scholar] [CrossRef]
- Karban, A.; Feldman, T.; Waterman, M.; Leiba, R.; Efrati, E. The association of the MTHFR C677T polymorphism with inflammatory bowel diseases in the Israeli Jewish population: An example of genetic heterogeneity. Medicine 2016, 95, e5611. [Google Scholar] [CrossRef] [PubMed]
- Moktan, V.P.; Daoud, N.D.; Tremaine, W.J.; Loftus, E.V., Jr.; Kane, S.V.; Hochwald, A.P.; Hodge, D.O.; Hashash, J.G.; Faubion, S.S.; Farraye, F.A. A cohort study of the age at menopause in female patients with and without inflammatory bowel disease. Crohns Colitis 360 2022, 4, otac027. [Google Scholar] [CrossRef] [PubMed]
- Piotrowska, M.; Binienda, A.; Fichna, J. The role of fatty acids in Crohn’s disease pathophysiology-An overview. Mol. Cell Endocrinol. 2021, 538, 111448. [Google Scholar] [CrossRef]
- Basson, A.R.; Chen, C.; Sagl, F.; Trotter, A.; Bederman, I.; Gomez-Nguyen, A.; Sundrud, M.S.; Ilic, S.; Cominelli, F.; Rodriguez-Palacios, A. Regulation of Intestinal Inflammation by Dietary Fats. Front Immunol. 2021, 11, 604989. [Google Scholar] [CrossRef] [PubMed]
- Kikut, J.; Drozd, A.; Mokrzycka, M.; Grzybowska-Chlebowczyk, U.; Ziętek, M.; Szczuko, M. Are EPA and DHA Derivatives Involved in IBD Remission? J. Clin. Med. 2022, 11, 2388. [Google Scholar] [CrossRef] [PubMed]
- Bian, D.; Liu, X.; Wang, C.; Jiang, Y.; Gu, Y.; Zhong, J.; Shi, Y. Association between dietary inflammatory index and sarcopenia in Crohn’s disease patients. Nutrients 2022, 14, 901. [Google Scholar] [CrossRef]
- Zhuang, Z.; Li, N.; Wang, J.; Yang, R.; Wang, W.; Liu, Z.; Huang, T. GWAS-associated bacteria and their metabolites appear to be causally related to the development of inflammatory bowel disease. Eur. J. Clin. Nutr. 2022, 76, 1024–1030. [Google Scholar] [CrossRef]
- Li, J.Y.; Guo, Y.C.; Zhou, H.F.; Yue, T.T.; Wang, F.X.; Sun, F.; Wang, W.Z. Arginine metabolism regulates the pathogenesis of inflammatory bowel disease. Nutr. Rev. 2022, 30, nuac070. [Google Scholar] [CrossRef]
- Gnagnarella, P.; Parpinel, M.; Salvini, S.; Franceschi, S.; Palli, D.; Boyle, P. The update of the Italian Food Composition Database. J. Food Compos. Anal. 2004, 17, 509–522. [Google Scholar] [CrossRef]


| CD (g/Day) Median (IQR) n = 54 | HS (g/Day) Median (IQR) n = 30 | p | |
|---|---|---|---|
| Soluble fibers | 2.3 (1.5–2.9) | 2.65 (2.2–3.7) | 0.016 * |
| Insoluble fibers | 3.8 (2.7–5.9) | 7.3 (4.4–9.6) | <0.0001 # |
| Dairy products | 47.9 (20.0–80.0) | 86.4 (48.6–114.3) | 0.0046 # |
| Fish | 11.4 (0–41.43) | 28.6 (11.4–71.4) | 0.0116 * |
| White meat | 24.3 (0.0–48.6) | 21.4 (0.0–34.3) | 0.5228 |
| Red meat | 58.6 (22.9–87.1) | 37.9 (11.4–62.9) | 0.0494 * |
| Processed meat | 41.4 (20.0–61.4) | 31.4 (11.4–52.9) | 0.3624 |
| Eggs | 0.0 (0.0–17.1) | 8.6 (0.0–17.1) | 0.2219 |
| Starchy foods (with gluten) | 252.9 (167.1–301.4) | 245.7 (181.4–306.4) | 0.7187 |
| Fruit | 74.3 (28.6–128.6) | 85.7 (50.0–194.3) | 0.3351 |
| Vegetables | 65.7 (28.6–152.1) | 236.4 (164.3–298.6) | <0.0001 # |
| INTAKE | CD (g/Day) Median (IQR) | HS (g/Day) Median (IQR) | p |
|---|---|---|---|
| Cholesterol | 0.249 (0.145–0.319) | 0.245 (0.176–0.317) | 0.7088 |
| Saturated | 20.11 (15.06–28.55) | 25.18 (16.35–28.88) | 0.3677 |
| Unsaturated | 31.38 (22.86–43.16) | 33.06 (28.93–42.92) | 0.3045 |
| Polyunsaturated | 7.50 (5.57–9.90) | 8.94 (7.00–11.54) | 0.0833 |
| Monounsaturated | 24.05 (17.08–33.98) | 25.41(20.90–32.96) | 0.3853 |
| C4:0-C10:0 capric acid | 0.22 (0.04–0.41) | 0.45 (0.17–0.74) | 0.0079 # |
| C12:0 lauric acid | 0.09 (0.02–0.20) | 0.19 (0.08–0.33) | 0.0183 * |
| C14:0 myristic acid | 0.42 (0.22–0.77) | 0.70 (0.37–1.15) | 0.0135 * |
| C16:0 palmitic acid | 3.58 (2.36–5.25) | 4.81 (3.37–6.65) | 0.0505 |
| C18:0 stearic acid | 1.60 (0.91–2.56) | 2.15 (1.33–3.03) | 0.0833 |
| C20:0 arachidic acid | 0.06 (0.03–0.13) | 0.10 (0.06–0.14) | 0.0594 |
| C14:1 myristoleic acid | 0.02 (0.01–0.05) | 0.03 (0.01–0.06) | 0.6033 |
| C16:1 palmitoleic acid | 0.36 (0.21–0.60) | 0.42 (0.30–0.63) | 0.2431 |
| C18:1 oleic acid | 12.79 (7.70–17.75) | 14.13 (11.18–17.57) | 0.1628 |
| C20:1 eicosanoic acid | 0.12 (0.08–0.18) | 0.13 (0.08–0.24) | 0.3695 |
| C22:1 erucic acid | 0.01 (0.00–0.02) | 0.02 (0.00–0.05) | 0.0795 |
| C18:2 linoleic acid | 3.50 (2.25–5.26) | 3.85 (2.58–5.43) | 0.1773 |
| C18:3 α-linolenic acid | 0.35 (0.23–0.57) | 0.41 (0.33–0.66) | 0.1292 |
| C20:4 arachidonic acid | 0.13 (0.07–0.20) | 0.13 (0.07–0.22) | 0.8554 |
| C20:5 EPA | 0.01 (0.00–0.03) | 0.03 (0.00–0.12) | 0.3220 |
| C22:6 DHA | 0.01 (0.00–0.02) | 0.03 (0.00–0.11) | 0.0176 * |
| Total ω3 | 0.37 (0.23–0.62) | 0.47 (0–0.89) | 0.0743 |
| Total ω6 | 3.63 (2.32–5.46) | 3.98 (2.65–5.65) | 0.1197 |
| ω3/ω6 | 0.10 (0.04–0.27) | 0.12 (0.02–0.34) | 0.09541 |
| BLOOD LEVELS (mmol/L) | INTAKE (mg/Day) | |||||
|---|---|---|---|---|---|---|
| CD Median (IQR) | HS Median (IQR) | p | CD Median (IQR) | HS Median (IQR) | p | |
| TAU | 78.0 (62.0–96.0) | 93.0 (82.0–101.0) | <0.001 # | |||
| ASP | 3.0 (3.0–4.0) | 2.8 (2.0–3.0) | 0.0337 * | 3456.8 (2336.6–4453.1) | 3535.7 (2794.3–4302.2) | 0.4897 |
| THR | 109.0 (89.0–140.0) | 143.0 (113.0–163.0) | 0.0012 # | 1689.1 (1157.0–2264.6) | 1713.2 (1392.1–2090.2) | 0.6744 |
| SER | 103.0 (86.0–117.0) | 115.5 (100.0–133.0) | 0.0213 * | 2042.1 (1423.4–2770.5) | 2116.9 (1633.5–2723.7) | 0.5882 |
| GLU | 651.0 (583.0–768.0) | 775.0 (690.0–887.0) | 0.0015 # | 8681.8 (6533.3–12266.6) | 9189.1 (6967.8–11936.8) | 0.6208 |
| PRO | 191.5 (153.0–247.0) | 222.5 (166.0–263.0) | 0.1685 | 3006.2 (2222.5–4155.8) | 3402.6 (2232.4–4093.2) | 0.5256 |
| GLY | 232.5 (191.0–275.0) | 227.5 (195.0–298.0) | 0.5316 | 1797.2 (1191.7–2362.2) | 1706.8 (1355.8–2156.4) | 0.896 |
| ALA | 301.5 (243.0–367.0) | 378.5 (300.0–417.0) | 0.0126 * | 2098.4 (1363.9–2792.9) | 1951.1 (1643.8–2492.0) | 0.9256 |
| VAL | 198.0 (168.0–219.0) | 229.0 (197.0–305.0) | <0.001 # | 2335.1 (1535.9–2970.9) | 2435.7 (1954.5–3010.2) | 0.5015 |
| CYS | 38.0 (34.0–48.0) | 48.5 (41.0–56.0) | 0.0017 # | 639.6 (459.6–903.8) | 662.7 (523.0–853.4) | 0.5627 |
| MET | 21.0 (17.0–25.0) | 25.0 (21.0–29.0) | 0.0016 # | 1049.8 (707.8–1335.6) | 1116.8 (829.0–1324.6) | 0.6208 |
| ILE | 61.5 (50.0–72.0) | 65.0 (51.0–78.0) | 0.2507 | 2037.9 (1323.9–2599.1) | 2044.8 (1633.0–2525.2) | 0.695 |
| LEU | 129.5 (106.0–149.0) | 147.0 (111.0–175.0) | 0.0483 * | 3496.6 (2385.5–4690.3) | 3687.2 (2720.9–4568.7) | 0.6608 |
| TYR | 58.5 (48.0–73.0) | 64.0 (58.0–72.0) | 0.0866 | 1878.7 (1065.1–3199.5) | 2030.5 (1411.7–2334.0) | 0.5754 |
| PHE | 57.0 (48.0–67.0) | 59.5 (53.0–66.0) | 0.3674 | 1958.7 (1380.3–2679.3) | 2178.3 (1586.4–2657.3) | 0.4608 |
| ORN | 90.5 (69.0–108.0) | 81.0 (65.0–104.0) | 0.3153 | |||
| HIS | 69.5 (57.0–80.0) | 81.0 (73.0–87.0) | <0.001 # | 1327.8 (897.9–1752.3) | 1389.2 (1045.5–1689.7) | 0.6881 |
| ARG | 41.5 (33.0–62.0) | 61.5 (45.0–72.0) | 0.0072 # | 2295.8 (1521.2–3061.8) | 2265.4 (1792.8–2786.5) | 0.758 |
| LYS | 173.5 (140.0–195.0) | 181.0 (161.0–201.0) | 0.1975 | 2843.0 (1875.8–3658.9) | 2905.2 (2394.0–3674.6) | 0.634 |
| CIT | 31.0 (25.0–37.0) | 37.0 (31.0–48.0) | 0.0057 # | |||
| CD N (%) or Median (IQR) n = 54 | HS N (%) or Median (IQR) n = 30 | |
|---|---|---|
| Gender: | ||
| Female | 35.2% | 40.0% |
| Male | 64.8% | 60.0% |
| Age: | ||
| Female | 38.8 (20.0–58.0) | 35.1 (19.0–52.0) |
| Male | 35.3 (20.0–58.0) | 42.5 (19.0–52.0) |
| BMI: | ||
| Female | 22.3 (18.0–26.0) | 21.6 (18.0–27.0) |
| Male | 22.8 (18.0–26.0) | 23.8 (18.0–27.0) |
| CD’s Disease Localization | SES-CD Score | |||
|---|---|---|---|---|
| 0–2 | 3–6 | 7–15 | >15 | |
| Ileum | 0 | 2 | 0 | 0 |
| Ileocolonic | 0 | 10 | 22 | 8 |
| Colon | 0 | 0 | 11 | 1 |
Disclaimer/Publisher’s Note: The statements, opinions and data contained in all publications are solely those of the individual author(s) and contributor(s) and not of MDPI and/or the editor(s). MDPI and/or the editor(s) disclaim responsibility for any injury to people or property resulting from any ideas, methods, instructions or products referred to in the content. |
© 2023 by the authors. Licensee MDPI, Basel, Switzerland. This article is an open access article distributed under the terms and conditions of the Creative Commons Attribution (CC BY) license (https://creativecommons.org/licenses/by/4.0/).
Share and Cite
Rizzello, F.; Gionchetti, P.; Spisni, E.; Saracino, I.M.; Bellocchio, I.; Spigarelli, R.; Collini, N.; Imbesi, V.; Dervieux, T.; Alvisi, P.; et al. Dietary Habits and Nutrient Deficiencies in a Cohort of European Crohn’s Disease Adult Patients. Int. J. Mol. Sci. 2023, 24, 1494. https://doi.org/10.3390/ijms24021494
Rizzello F, Gionchetti P, Spisni E, Saracino IM, Bellocchio I, Spigarelli R, Collini N, Imbesi V, Dervieux T, Alvisi P, et al. Dietary Habits and Nutrient Deficiencies in a Cohort of European Crohn’s Disease Adult Patients. International Journal of Molecular Sciences. 2023; 24(2):1494. https://doi.org/10.3390/ijms24021494
Chicago/Turabian StyleRizzello, Fernando, Paolo Gionchetti, Enzo Spisni, Ilaria Maria Saracino, Irene Bellocchio, Renato Spigarelli, Noemi Collini, Veronica Imbesi, Thierry Dervieux, Patrizia Alvisi, and et al. 2023. "Dietary Habits and Nutrient Deficiencies in a Cohort of European Crohn’s Disease Adult Patients" International Journal of Molecular Sciences 24, no. 2: 1494. https://doi.org/10.3390/ijms24021494
APA StyleRizzello, F., Gionchetti, P., Spisni, E., Saracino, I. M., Bellocchio, I., Spigarelli, R., Collini, N., Imbesi, V., Dervieux, T., Alvisi, P., & Valerii, M. C. (2023). Dietary Habits and Nutrient Deficiencies in a Cohort of European Crohn’s Disease Adult Patients. International Journal of Molecular Sciences, 24(2), 1494. https://doi.org/10.3390/ijms24021494