Article

Single–Molecule Study of DNAzyme Reveals Its Intrinsic Conformational Dynamics

1
Wenzhou Institute, University of Chinese Academy of Sciences, Wenzhou 325001, China
2
Wenzhou–Kean University, Wenzhou 325060, China
3
Northeastern University, Shenyang 110819, China
4
Jinan Microecological Biomedicine Shandong Laboratory, Shounuo City Light West Block, Qingdao Road 3716#, Huaiyin District, Jinan 250117, China
5
National Laboratory of Solid–State Microstructure, Department of Physics, Nanjing University, Nanjing 210093, China
*
Author to whom correspondence should be addressed.
Int. J. Mol. Sci. 2023, 24(2), 1212; https://doi.org/10.3390/ijms24021212
Submission received: 14 November 2022 / Revised: 28 December 2022 / Accepted: 29 December 2022 / Published: 7 January 2023
(This article belongs to the Collection Feature Papers in Molecular Biophysics)

Abstract

:
DNAzyme is a class of DNA molecules that can perform catalytic functions with high selectivity towards specific metal ions. Due to its potential applications for biosensors and medical therapeutics, DNAzyme has been extensively studied to characterize the relationships between its biochemical properties and functions. Similar to protein enzymes and ribozymes, DNAzymes have been found to undergo conformational changes in a metal–ion–dependent manner for catalysis. Despite the important role the conformation plays in the catalysis process, such structural and dynamic information might not be revealed by conventional approaches. Here, by using the single–molecule fluorescence resonance energy transfer (smFRET) technique, we were able to investigate the detailed conformational dynamics of a uranyl–specific DNAzyme 39E. We observed conformation switches of 39E to a folded state with the addition of Mg2+ and to an extended state with the addition of UO22+. Furthermore, 39E can switch to a more compact configuration with or without divalent metal ions. Our findings reveal that 39E can undergo conformational changes spontaneously between different configurations.

1. Introduction

Deoxyribozymes, also known as DNAzymes, DNA enzymes, or catalytic DNA, have been established as biological catalysts acting similarly to other protein enzymes and ribozymes [1]. Their sequences are selected through in vitro selection methods [2,3,4,5]. Because of their stability in physiological conditions, high sensitivity, and selectivity, DNAzymes are widely applied in practices [6], such as heavy metal ion detectors [7,8], biosensors [9,10,11], cellular imaging [12,13,14] and diagnostics [15,16].
As a cofactor, metal ions are critical for ribozyme and DNAzyme activities. Both previous bulk and single–molecule studies of DNAzyme have tried to better understand the significance of metal ions in catalysis [17,18,19,20,21,22,23,24]. Studies of 8–17 DNAzyme discussed two different pathways of 8–17 DNAzyme to activate in the presence of Zn2+ (or Mg2+) and Pb2+ [17,22]. In particular, the specific metal–ion–dependent activities of 8–17 DNAzyme can be listed in the following orders: Pb2+ >> Zn2+ >> Mg2+. With the presence of Zn2+ or Mg2+, 8–17 DNAzyme undergoes a global folding conformation, whereas no folding occurs in the presence of Pb2+ [22]. This might be due to the prearrangement of 8–17 DNAzyme for the quick binding of Pb2+ without any conformational changes needed to activate the cleavage function.
A recent study introduced another in vitro selected DNAzyme, 39E, specific to UO22+ ions [25,26]. Like other DNAzymes, 39E is composed of an enzyme strand and a substrate strand forming a three–way junction formation (Figure 1A). The two arm stems (stem I and III) are constructed by the enzyme strand and the substrate strand through complementary pairing. The additional 30 nucleotides in the enzyme strand form stem II, containing a catalytic core in the bulge loop. Fluorescence studies reported that 39E has a detection limit down to 45pM with remarkably high selectivity (only to Th2+ and UO22+) [25]. Bulk fluorescence resonance energy transfer (FRET) experiments also investigated the metal–ion–dependent global folding of 39E in the presence of different metal ions [27]. Although 39E has no cleavage activities with Mg2+ or Zn2+, it showed a folding behavior of stem I and stem II while Mg2+ or Zn2+ was present. However, no folding between stem I and stem II was observed with UO22+ alone, which is similar to the case of 8–17 DNAzyme. In contrast, stem I and III underwent a modest folding with UO22+ presence. Researchers have additionally demonstrated that, with a lower Na+ concentration, UO22+ or Pb2+ could prompt a slight unfolding of 39E. This indicates that with different ionic strengths, 39E may go through different activation pathways. However, the structural configurations of DNAzymes may not be optimized since they are products of in vitro selections. There might be several local energy minimums that can trap the molecules into a specific configuration. A recent study revealed the crystal structure of DNAzyme 8–17 and proposed three catalytic forms of 8–17 DNAzyme [28]. Another study showed that the insertion of a C3 spacer in the catalytic core did not corrupt 39E activity but enhanced about 10–fold UO22+–sensitivity [29]. Some simulation works also investigated the effects of pH values and monovalent metal ions on the activities of DNAzymes [26,27,30,31]. These suggest that DNAzymes might adopt much more complicated configuration arrangements toward the catalytic functions. Nevertheless, such crucial information might not be distinctly characterized through bulk experiments considering the limited accessibilities. Over the last two decades, single–molecule techniques have become very powerful methods for studying protein folding/unfolding [32,33], intra/inter–molecular interactions [34], and biomolecule conformational changes [35,36]. It can be used to probe much more detailed structural information than conventional bulk methods, which could provide insightful inspirations for the design of novel biomaterials [37].
Herein, we applied the single–molecule FRET (smFRET) technique [38] to further probe the conformational changes of 39E. The bulk experiments have reported that there were not many FRET signal changes between stem I and stem III. Thus, we labeled the enzyme strand of 39E with biotin at the 3′ end, an acceptor (Cy5) at the middle of stem II, and the substrate strand of 39E with a donor (Cy3) at the 5′ end in stem I (Figure 1A). Through this labeling strategy, we were able to monitor the distance changes between stem I and stem II. Since the chemical properties and the overall UO22+–dependent cleavage activity of 39E have been characterized well in the previous reports, we were only interested in the conformational changes of 39E in this study. Therefore, we replaced the cleavage site ribonucleotide adenine (rA) with a deoxynucleotide adenine (A) to keep the substrates intact during the process. We observed a global folding of DNAzyme 39E by adding Mg2+ ion in the solution and detected an extending behavior in the presence of UO22+, which is consistent with the results from previous bulk experiments. Intriguingly, 39E can undergo conformational changes spontaneously to a more compact state or an extended state with or without divalent metal ions. Our results revealed the intrinsic conformational dynamics of 39E.

2. Results and Discussion

2.1. Metal–Ion–Dependent Folding Induced by Mg2+ and Extending by UO22+

Metal ions are involved in many critical biological processes, such as signal transduction and enzymatic activity. It is been found that metal–ions–dependent conformational changes play a critical role in the activities of proteins, DNA (DNAzymes [26,27] and Holliday junctions [39,40]), and RNA (ribozymes [41] and riboswitches [42]). The in vitro selected DNAzyme 39E has been isolated to have specificity to UO22+. A previous report showed its global folding behavior upon interaction with Mg2+ [27]. To obtain a deeper insight into the 39E working mechanism, we applied smFRET to investigate the detailed conformational changes induced by metal ions. The DNA construct was labeled with donor fluorophore Cy3 at the 3′ end of the substrate strand and acceptor fluorophore Cy5 in the middle of the enzyme strand (Figure 1A). The annealed 39E DNA molecules were immobilized on the biotin–PEGlyated glass surface through streptavidin–biotin interaction. The reaction was triggered by a flow containing 30 mM Mg2+ in the imaging buffer using a syringe pump 13 s after the recording started. Most traces (62%, n = 752 out of 1213) were similar to the one represented in Figure 1B. Before injecting Mg2+ in the flow cell, 39E was in a native state (N) with FRET efficiency (EFRET) of 0.25. After adding 30 mM Mg2+, EFRET increased to 0.47 immediately (Figure 1D), indicating an intact folded formation (F) of 39E in which the donor and acceptor became closer, which is consistent with the bulk FRET measurements.
Since 39E is a uranyl–specific DNAzyme, we also applied 10 μM UO22+ to the reaction buffer. Interestingly, although non–cleavable substrates were used, we were still able to observe traces (47%, n = 286 out of 609) with decreased EFRET (from 0.24 to 0.11) presenting an extended state (E) of 39E upon binding UO22+ (Figure 1C,E). This is different from Pb2+–specific DNAzyme 8–17, of which Pb2+ has no effect on EFRET with non–cleavable substrates. Among the traces showing extension induced by UO22+, 46% of them (n = 131 out of 286) exhibited some delays of change in EFRET after adding UO22+ (Figure S1). Compared to 8–17 DNAzyme, a shorter lifetime of the delay was observed, suggesting a faster conformational rearrangement of 39E to the extended state.

2.2. Conformational Switches with Mg2+ Presence

As mentioned above, 62% of the traces showed folding activities of 39E with 30 mM Mg2+ in the solution. Unexpectedly, the remaining 38% of the traces (461 out of 1213) showed conformation dynamics of 39E when Mg2+ was present.
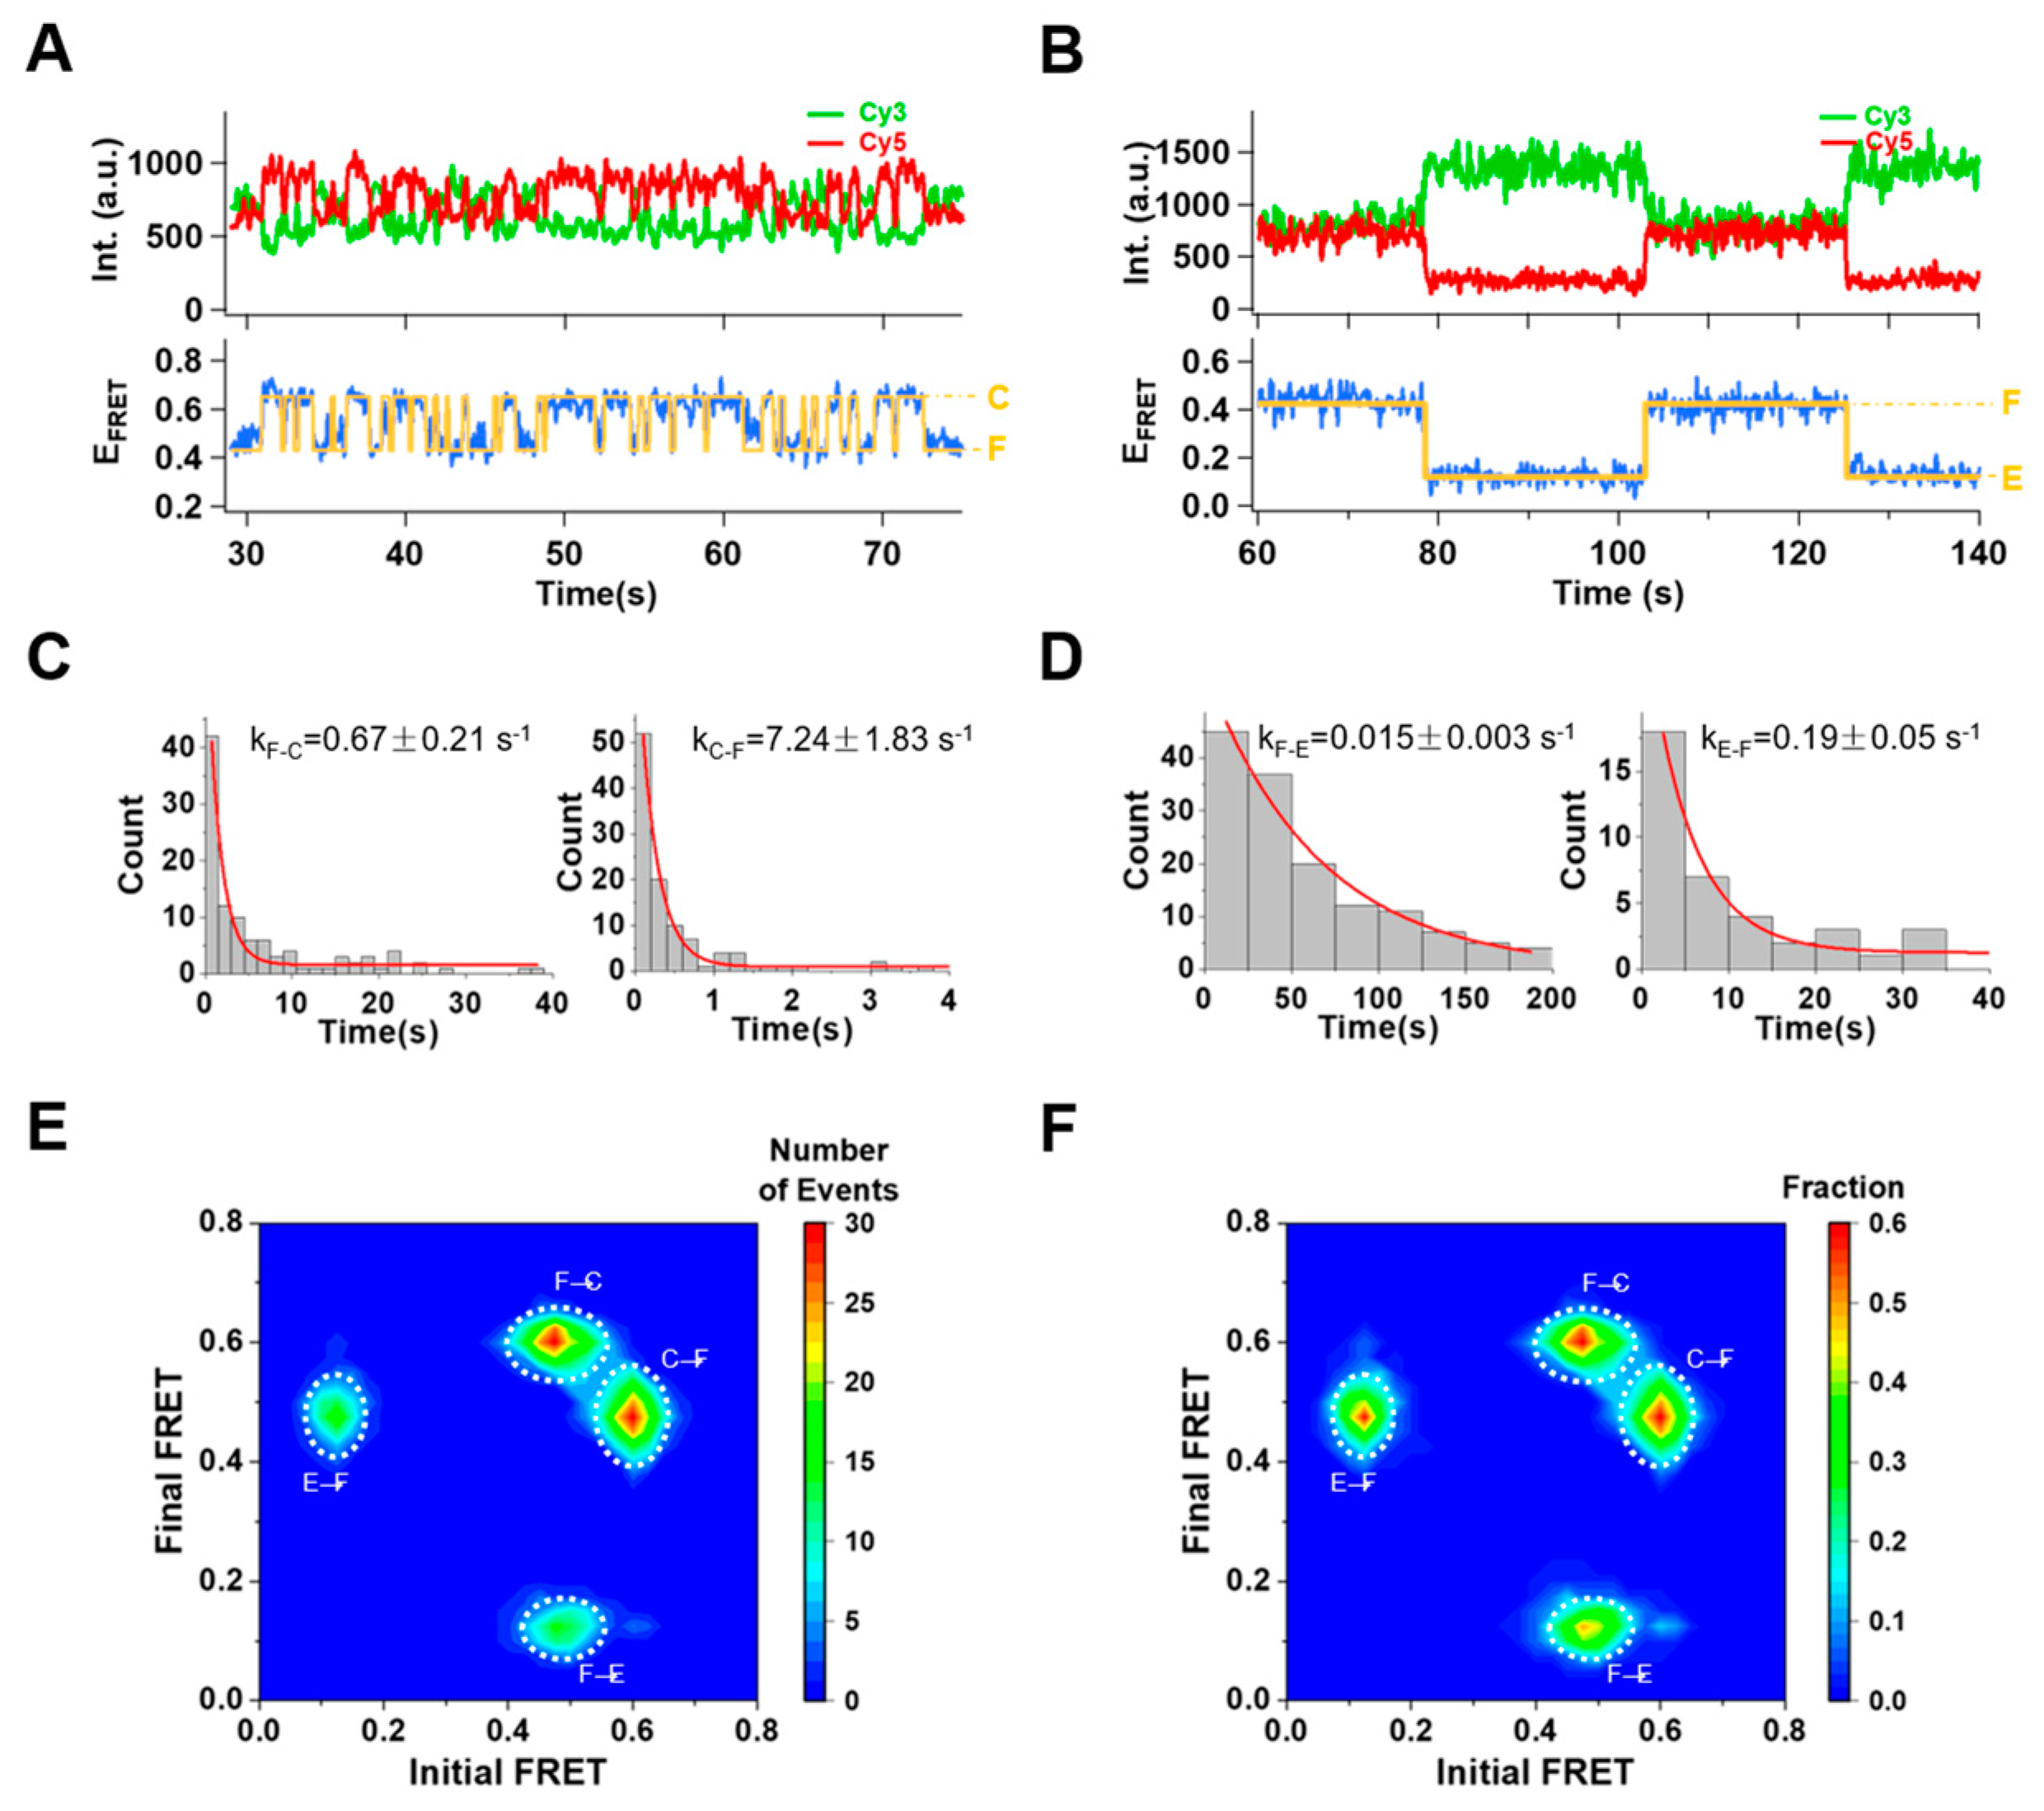
A representative trace is demonstrated in Figure 2A. After adding 30mM Mg2+, 39E stayed in the folded state (0.48) for a while, then turned into the extended state (0.12) (Figure 2A,B), similar to what happened with UO22+. We verified the presence of acceptor molecules through the direct excitation of Cy5 using a 640 nm laser at the end of recordings to ensure this decline of EFRET was not the byproduct of Cy5 photobleaching. Moreover, an even higher FRET (0.58) state was observed when Mg2+ was in solution (Figure 2C,D), indicating a more compact conformational state (C) of 39E. In addition, to collect more data, we recorded movies for a more extended period of time after injecting Mg2+. Traces showing the dynamics of 39E switching between different conformational states were captured (Figure 3). Not only can 39E switch between F and C states (Figure 3A) but also between F and E states (Figure 3B). We categorized the events that occurred during these switches into six possibilities: (i) stay at F then switch to C; (ii) stay at C then switch to F; (iii) stay at F then switch to E; (iv) stay at U then switch to F; (v) stay at C then switch to E and (vi) stay at E then switch to C. Using a hidden Markov model, we derived the dwell time of 39E staying at each state. Since only 18 traces showed the transition from C state to E state, and 3 traces showed the transition from E state to C state, these two data sets were excluded in the analysis. The rate of each state transition was obtained with a single exponential fitting: kF–C = 0.67 s−1, kC–F = 7.24 s−1, kF–E = 0.015 s−1, and kE–F = 0.19 s−1 (Figure 3C,D). It follows that 39E is more likely to stay in the folded state (F) when Mg2+ ions are present. Occasionally, it can switch to a more compact state (C) in which stem I and stem II are closer, or to the extended state like in the condition interacting with UO22+. The observed FRET transitions are compiled into a transition density plot (TDP, Figure 3E) [43], revealing two distinct species of F↔C and F↔E transitions. Though 39E switched to the compact state more often, the life time of the C state is much shorter than the E state. In order to clearly show the transition probability, we also made a transition occupancy density plot (TODP) scaled by the fraction of molecules in F↔C transition (Figure 3F) [44]. It shows a roughly equal possibility of transition F↔C (59%, 336 molecules) and F↔E (52%, 296 molecules) with Mg2+ in solution.
To evaluate the effect of Mg2+ ions on the DNAzyme conformational dynamics, we also conducted experiments introducing different concentrations of Mg2+. Dwell time histograms of these states at each concentration are arranged in Figures S2 and S3. The lifetimes of individual states are closely comparable under diverse conditions (Figure S4). According to bulk experiments, the binding affinity of Mg2+ to 39E is approximately 5 mM [26,27]. The resemblance of behaviors of 39E switching between different states at 10 mM and 100 mM Mg2+ conditions imply that those state transitions may not be the outcome of the binding and dissociation of Mg2+ ions to the DNAzyme.

2.3. Conformational Changes without Divalent Metal Ions

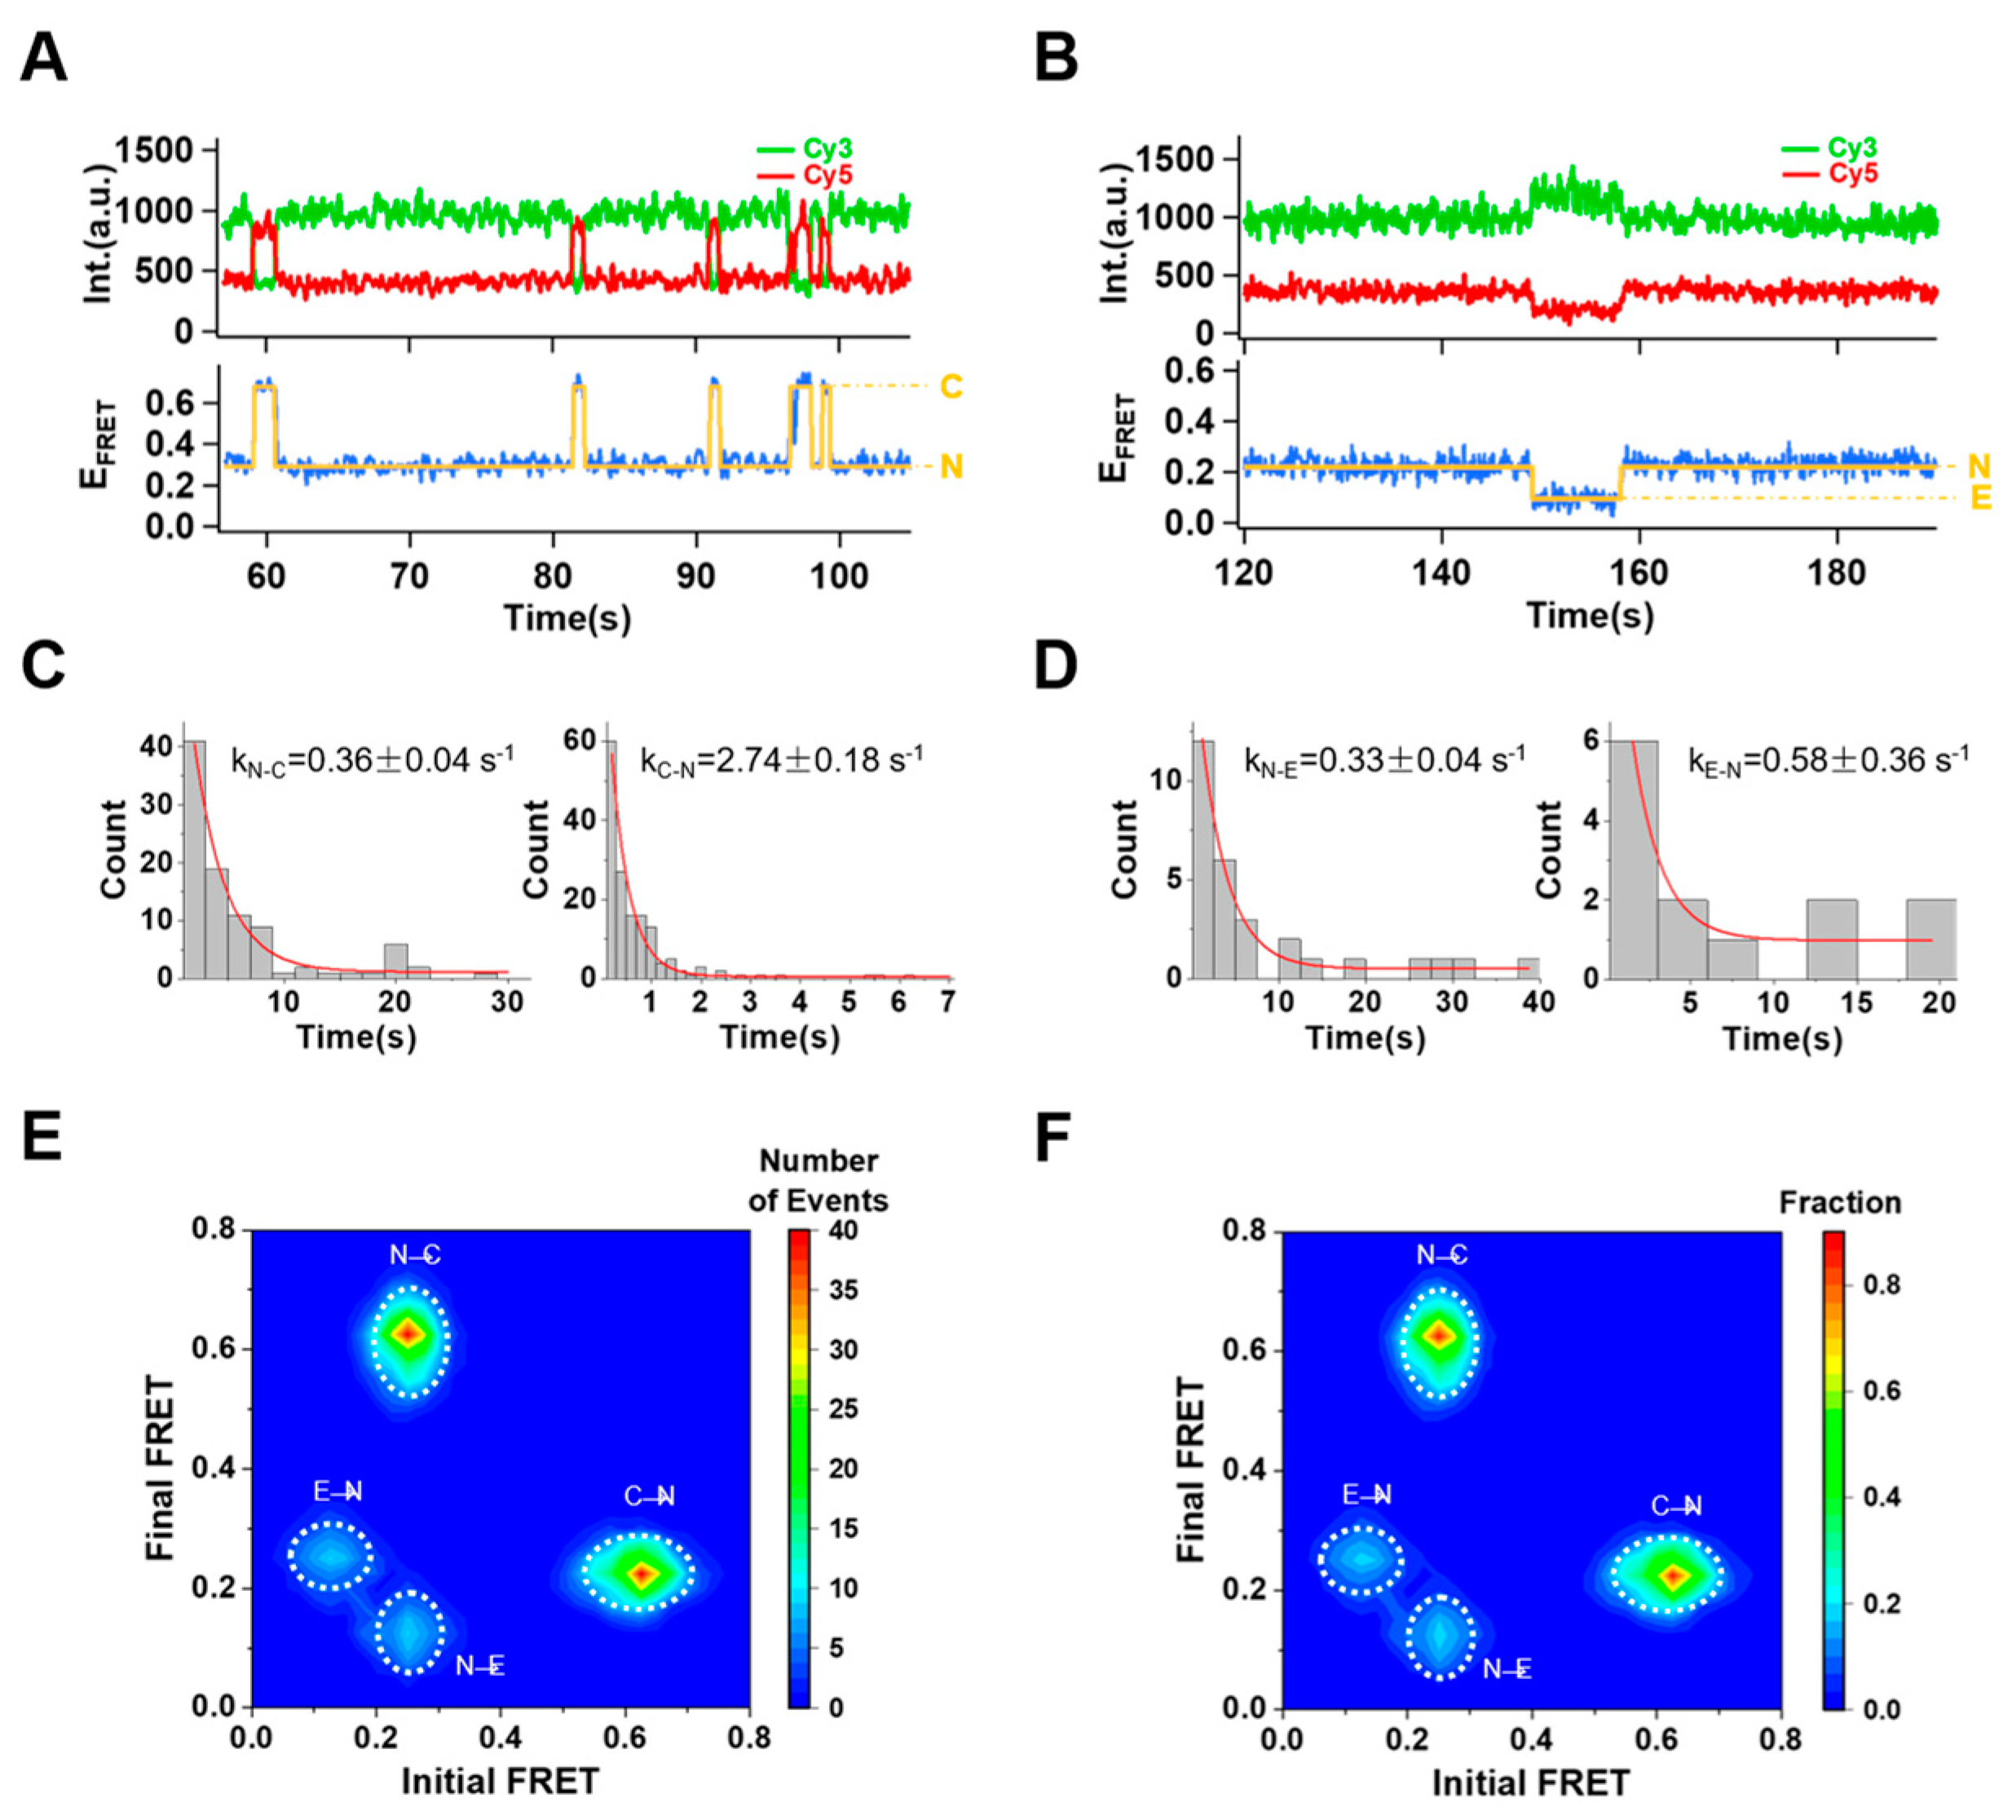
Since varied Mg2+ concentrations suggested no particular tendency towards conformational dynamics of 39E, it is more likely that 39E has an intrinsic conformational frustration due to the local free energy minimum. To test this hypothesis, we recorded the movies under the conditions without any divalent metal ions in the imaging buffers. Overall, about 34% of the traces (n = 632 out of 1875) exhibited EFRET changes between the native state (N) and the compact state (C) or the native state (N) and the extended state (E) (Figure 4A,B). However, neither C–E transitions nor other transitions towards the folded state (F) were observed without Mg2+. Fitting the dwell time histograms, we acquired the switching rates for individual transitions: native–to–compact state transition, kN–C = 0.36 s−1 and kC–N = 2.74 s−1; native–to–extended state transition, kN–E = 0.33 s−1 and kE–N = 0.58 s−1, respectively (Figure 4C,D). Unlike the condition with Mg2+ presence, 39E shows a favorable transition towards N↔C (87%, 549 molecules) compared to N↔E (19%, 122 molecules) transitions (Figure 4E,F). Though 39E can spontaneously switch to the E state similar to when UO22+ is present, it shows no cleavage activity without divalent metal ions from bulk experiments, implying this kind of structural configuration might be the co–condition for DNAzyme’s function. Compared to the transition rates when Mg2+ ions were present, the stable conformational state of 39E shifted from the native state to the folded state. In the meanwhile, the transition rate between the stable state and the extended state (kN–E = 0.33 s−1 for N to E transition and kF–E = 0.015 s−1 for F to E transition with 30mM Mg2+) decreased dramatically by the binding of Mg2+, indicating 39E has been stabilized in the folded state (F), which would prevent the substrate strand from being cleaved.

2.4. Free Energy Landscapes of 39E Conformation Dynamics with and without Divalent Metal Ions

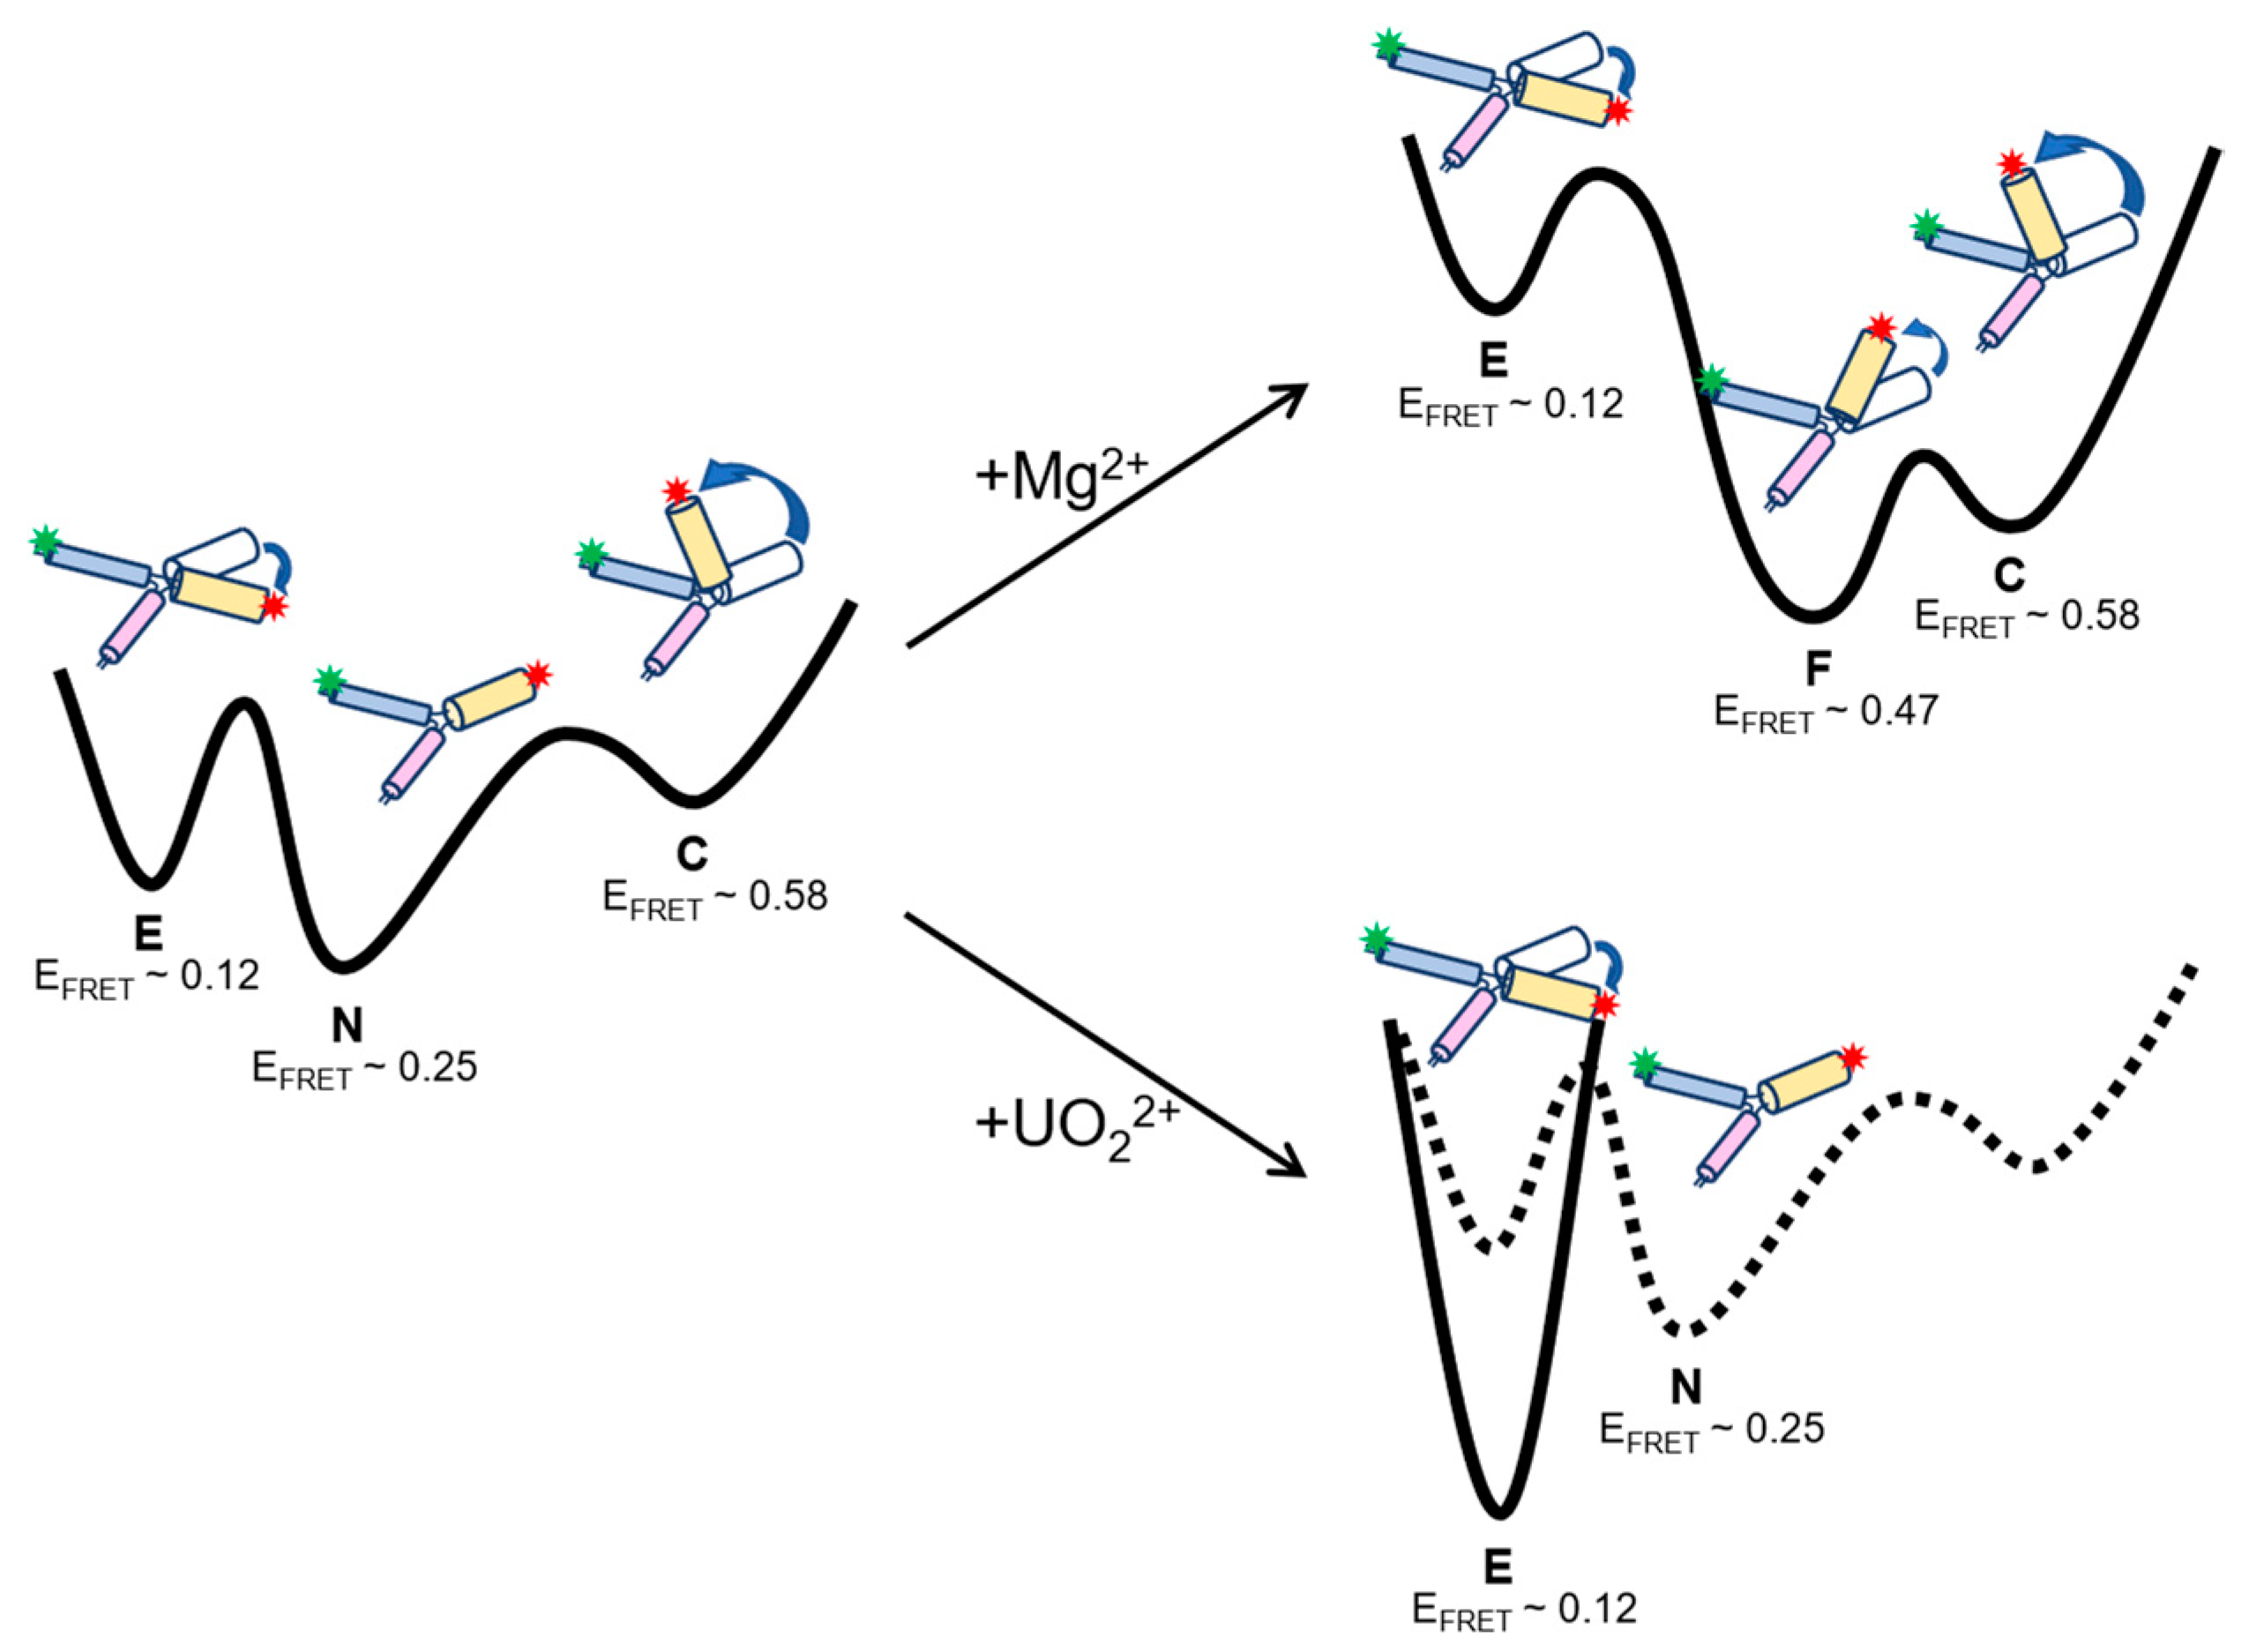
Based on the donor–acceptor distances calculated from the average FRET efficiency for each state of 39E, we proposed the secondary configurations of 39E stem I–II as shown in Figure S5. With the transition rate analysis under conditions with or without divalent metal ions, we were able to draw the energy landscape of 39E along the reaction path when introducing different metal ions (Figure 5). Without any divalent metal ions, 39E is stable at the native state (N). However, it can still transform into a compact state (C) or an extended state (E). A lower energy barrier of the C–N transition than that of the E–N transition marks 39E’s instability in the C state. After introducing Mg2+ in the system, 39E can swiftly switch to the folded state (F). Then, the barrier from the F state to the E state was dramatically raised (the quantitative energy of each transition is listed in Figure S6). This elevation might have happened by binding Mg2+ to the bulge loop region of the active site, which prevents cleavage activity. With the presence of UO22+, 39E cannot form a compact formation because of the relatively larger ionic radii of UO22+. Under such conditions, 39E tends to be stable in the extended state. Overall, 39E undergoes conformational switches with or without the divalent metal ions. It might facilitate 39E cleavage activity by the prearrangement of the extended configuration with the presence of UO22+ and protect the substrate from being cleaved by trapping the 39E into the folded or compact configuration when Mg2+ is present.

3. Materials and Methods

3.1. Chemicals

The sequence of the DNAzyme 39E used in this study was adapted from [25], with some minor revisions. DNA was synthesized by GenScript, Nanjing, China. In particular, the substrate oligos (3′–GTGCAGGTAGAGAAGGATATCACTCA–5′) were labeled with Cy3 at the 5′ end, and the enzyme oligos (3′–TTTTTGTTGAGTGATACAGACTTCCAGCCAAATTGATGGGCTGACGTCTCTACCTGCAC–5′) were labeled with Cy5 in the middle and biotin at the 3′ end. The annealing process was conducted on a PCR machine heated up to 85 °C, then slowly cooled down to 20 °C over 4 h. Products of a final concentration of 2 μM were used without further purification.
Glucose, glucose oxidase, catalase and Trolox (6–hydroxy–2,5,7,8–tetramethylchromane–2–carboxylic acid) were commercially available from Sigma-Aldrich, St. Louis, MO, USA. Streptavidin was a product of Pierce, Thermo Fisher, Waltham, MA, USA. Other chemicals used in the experiments were of reagent grade. All buffers were filtered with 0.22 μm filters before use.

3.2. smFRET Experiment

Single–molecule measurements were carried out on an Olympus IX–71–based objective–type total internal reflection fluorescence (TIRF) microscope equipped with an oil immersion UAPON 100XOTIRF objective lens (N.A. = 1.49, Olympus).
All experiments were performed in an imaging buffer containing 50 mM MES (pH~6.5) and 50 mM NaCl with an oxygen scavenging system (0.8% w/v glucose, 1mg/mL glucose oxidase, 0.04 mg/mL catalase and 2 mM Trolox). The annealed DNAzyme sample was immobilized on a passivated glass surface through biotin–streptavidin interaction as previously described [45]. A 30 μL imaging buffer containing certain concentration of MgCl2 or UO2(OAc)2 (uranyl acetate) was injected into the flow cell to initiate the reaction at a particular time (between 10 s and 40 s after the recording started). For the experiments without divalent metal ions, EDTA was added in the imaging buffer to a final concentration of 0.5 mM as a chelator. Cy3 and Cy5 were excited by a 532 nm and a 640 nm laser. To exclude the possibility that the vanishment of the acceptor signals was due to Cy5 photobleaching, a direct excitation of Cy5 using a 640 nm laser was briefly executed (~2 s) within or at the end of the recording windows. The emissions were split into two channels by a dichroic mirror (FF640–FDi01, Semrock, St. West Henrietta, NY, USA) with two band–pass filters for the donor channel (FF01–580/40, Semrock) and the acceptor channel (FF01–675/67, Semrock), respectively. Signals were collected by an EMCCD (iXon 897, Andor Technology, Belfast, UK) with a temporal resolution of 50 ms. The FRET efficiency was calculated by the equation EFRET = IA/(IA + ID) [46].

3.3. Free Energy Estimation

Free energy calculation is based on Arrhenius equation k = A·exp(-Ea/RT), where k is the reaction rate, A is the pre–exponential factor; Ea is the activation energy; R = 8.31 J/K·mol is the gas constant, and T = 297 K is the room temperature in Kelvin. Therefore, the energy of each transition can be calculated as Ea = RT·(lnA-lnk) (J/mol). The pre–exponential factor A is estimated as 103 s−1 in our case, and the rate constant k of each transition is derived from smFRET data.

4. Conclusions

In summary, we used the smFRET technique to investigate the metal–ion–dependent folding and extending behaviors of DNAzyme 39E. In contrast to bulk experiments, a higher FRET state was observed, suggesting that 39E can form a more compacted configuration than the folded state. More interestingly, 39E can switch to the extended and compact state spontaneously in the absence of any divalent metal ions, indicating an intrinsic conformational dynamics of 39E DNAzyme. Compared to another smFRET study of 8–17 DNAzyme, 39E undergoes an extending configuration even with an uncleavable substrate strand. Though Mg2+ or Zn2+ induces a global folding of 8–17, the 8–17 DNAzyme still needs to go through an unfolding path to activate its cleavage function. Different from this mechanism, the folded state of 39E stabilized by Mg2+ might be a protective state that prevents the substrate strand from being cleaved by the enzyme strand. The transitions between the stable states (N or F state) and the compact state or the extended state imply that the catalytic function of 39E is not simply triggered only by the allosteric arrangement but also by the interaction with UO22+ ions. Future work will be performed to test the effects of different mutations in the catalytic core on the conformational dynamics of 39E. In order to obtain a deeper insight into the correlations of the structure and function of 39E DNAzyme, the three–color FRET method will be needed to investigate the configurations of three stems at the same time.

Supplementary Materials

The following supporting information can be downloaded at: https://www.mdpi.com/article/10.3390/ijms24021212/s1.

Author Contributions

Conceptualization, Y.C. and H.P.; methodology, Y.Z., H.P.; validation, Y.C. and H.P.; formal analysis, Y.Z. and H.P.; investigation, Y.Z., Z.J., H.P.; resources, Z.J., X.W.; data curation, Y.Z., H.P.; writing—original draft preparation, Y.Z., H.P.; writing—review and editing, Y.C. and H.P.; visualization, Y.Z., X.W. and H.P.; supervision, Y.C. and H.P.; project administration, H.P.; funding acquisition, Y.C. and H.P. All authors have read and agreed to the published version of the manuscript.

Funding

This research was funded by start–up funding from Wenzhou Institute, University of Chinese Academy of Sciences (WIUCASQD2021007, WIUCASQD2022003), and Research Project of Jinan Microecological Biomedicine Shandong Laboratory (JNL202204A, JNL202219B).

Institutional Review Board Statement

Not applicable.

Informed Consent Statement

Not applicable.

Data Availability Statement

All data are available in the main text or the Supplementary Materials.

Conflicts of Interest

The authors declare no conflict of interest.

References

  1. Breaker, R.R.; Joyce, G.F. A DNA enzyme that cleaves RNA. Chem. Biol. 1994, 1, 223–229. [Google Scholar] [CrossRef]
  2. Breaker, R.R. In Vitro Selection of Catalytic Polynucleotides. Chem. Rev. 1997, 97, 371–390. [Google Scholar] [CrossRef]
  3. Wilson, D.S.; Szostak, J.W. In vitro selection of functional nucleic acids. Annu. Rev. Biochem. 1999, 68, 611–647. [Google Scholar] [CrossRef] [Green Version]
  4. Joyce, G.F. Directed evolution of nucleic acid enzymes. Annu. Rev. Biochem. 2004, 73, 791–836. [Google Scholar] [CrossRef] [PubMed] [Green Version]
  5. Lu, Y. New transition-metal-dependent DNAzymes as efficient endonucleases and as selective metal biosensors. Chemistry 2002, 8, 4588–4596. [Google Scholar] [CrossRef] [PubMed]
  6. Liu, J.; Cao, Z.; Lu, Y. Functional nucleic acid sensors. Chem. Rev. 2009, 109, 1948–1998. [Google Scholar] [CrossRef] [PubMed] [Green Version]
  7. Lu, Y.; Liu, J.; Li, J.; Bruesehoff, P.J.; Pavot, C.M.; Brown, A.K. New highly sensitive and selective catalytic DNA biosensors for metal ions. Biosens. Bioelectron. 2003, 18, 529–540. [Google Scholar] [CrossRef]
  8. Liu, J.; Lu, Y. Rational design of “turn-on” allosteric DNAzyme catalytic beacons for aqueous mercury ions with ultrahigh sensitivity and selectivity. Angew. Chem. Int. Ed. Engl. 2007, 46, 7587–7590. [Google Scholar] [CrossRef]
  9. Shimron, S.; Elbaz, J.; Henning, A.; Willner, I. Ion-induced DNAzyme switches. Chem. Commun. 2010, 46, 3250–3252. [Google Scholar] [CrossRef] [Green Version]
  10. Endo, M.; Takeuchi, Y.; Suzuki, Y.; Emura, T.; Hidaka, K.; Wang, F.; Willner, I.; Sugiyama, H. Single-Molecule Visualization of the Activity of a Zn(2+)-Dependent DNAzyme. Angew. Chem. Int. Ed. Engl. 2015, 54, 10550–10554. [Google Scholar] [CrossRef]
  11. Xiang, Y.; Lu, Y. DNA as sensors and imaging agents for metal ions. Inorg. Chem. 2014, 53, 1925–1942. [Google Scholar] [CrossRef] [PubMed] [Green Version]
  12. Wu, P.; Hwang, K.; Lan, T.; Lu, Y. A DNAzyme-gold nanoparticle probe for uranyl ion in living cells. J. Am. Chem. Soc. 2013, 135, 5254–5257. [Google Scholar] [CrossRef] [Green Version]
  13. Li, L.; Feng, J.; Fan, Y.; Tang, B. Simultaneous imaging of Zn(2+) and Cu(2+) in living cells based on DNAzyme modified gold nanoparticle. Anal. Chem. 2015, 87, 4829–4835. [Google Scholar] [CrossRef]
  14. Hwang, K.; Wu, P.; Kim, T.; Lei, L.; Tian, S.; Wang, Y.; Lu, Y. Photocaged DNAzymes as a general method for sensing metal ions in living cells. Angew. Chem. Int. Ed. Engl. 2014, 53, 13798–13802. [Google Scholar] [CrossRef] [PubMed]
  15. Xiong, Y.; Zhang, J.; Yang, Z.; Mou, Q.; Ma, Y.; Xiong, Y.; Lu, Y. Functional DNA Regulated CRISPR-Cas12a Sensors for Point-of-Care Diagnostics of Non-Nucleic-Acid Targets. J. Am. Chem. Soc. 2020, 142, 207–213. [Google Scholar] [CrossRef]
  16. Gao, H.; Feng, M.; Li, F.; Zhang, K.; Zhang, T.; Zhang, Z.; Yang, C.; Deng, R.; Zhang, J.; Jiang, P. G-Quadruplex DNAzyme-Substrated CRISPR/Cas12 Assay for Label-Free Detection of Single-Celled Parasitic Infection. ACS Sens. 2022, 7, 2968–2977. [Google Scholar] [CrossRef] [PubMed]
  17. Brown, A.K.; Li, J.; Pavot, C.M.; Lu, Y. A lead-dependent DNAzyme with a two-step mechanism. Biochemistry 2003, 42, 7152–7161. [Google Scholar] [CrossRef] [PubMed]
  18. Bonaccio, M.; Credali, A.; Peracchi, A. Kinetic and thermodynamic characterization of the RNA-cleaving 8-17 deoxyribozyme. Nucleic Acids Res. 2004, 32, 916–925. [Google Scholar] [CrossRef] [Green Version]
  19. Liu, J.; Lu, Y. FRET study of a trifluorophore-labeled DNAzyme. J. Am. Chem. Soc. 2002, 124, 15208–15216. [Google Scholar] [CrossRef]
  20. Kim, H.K.; Liu, J.; Li, J.; Nagraj, N.; Li, M.; Pavot, C.M.; Lu, Y. Metal-dependent global folding and activity of the 8-17 DNAzyme studied by fluorescence resonance energy transfer. J. Am. Chem. Soc. 2007, 129, 6896–6902. [Google Scholar] [CrossRef]
  21. Lee, N.K.; Koh, H.R.; Han, K.Y.; Kim, S.K. Folding of 8-17 deoxyribozyme studied by three-color alternating-laser excitation of single molecules. J. Am. Chem. Soc. 2007, 129, 15526–15534. [Google Scholar] [CrossRef] [PubMed]
  22. Kim, H.K.; Rasnik, I.; Liu, J.; Ha, T.; Lu, Y. Dissecting metal ion-dependent folding and catalysis of a single DNAzyme. Nat. Chem. Biol. 2007, 3, 763–768. [Google Scholar] [CrossRef] [PubMed]
  23. Saran, R.; Yao, L.; Hoang, P.; Liu, J. Folding of the silver aptamer in a DNAzyme probed by 2-aminopurine fluorescence. Biochimie 2018, 145, 145–150. [Google Scholar] [CrossRef] [PubMed]
  24. Kiy, M.M.; Jacobi, Z.E.; Liu, J. Metal-induced specific and nonspecific oligonucleotide folding studied by FRET and related biophysical and bioanalytical implications. Chemistry 2012, 18, 1202–1208. [Google Scholar] [CrossRef] [Green Version]
  25. Liu, J.; Brown, A.K.; Meng, X.; Cropek, D.M.; Istok, J.D.; Watson, D.B.; Lu, Y. A catalytic beacon sensor for uranium with parts-per-trillion sensitivity and millionfold selectivity. Proc. Natl. Acad. Sci. USA 2007, 104, 2056–2061. [Google Scholar] [CrossRef] [Green Version]
  26. Brown, A.K.; Liu, J.; He, Y.; Lu, Y. Biochemical characterization of a uranyl ion-specific DNAzyme. Chembiochem 2009, 10, 486–492. [Google Scholar] [CrossRef]
  27. He, Y.; Lu, Y. Metal-ion-dependent folding of a uranyl-specific DNAzyme: Insight into function from fluorescence resonance energy transfer studies. Chemistry 2011, 17, 13732–13742. [Google Scholar] [CrossRef] [Green Version]
  28. Liu, H.; Yu, X.; Chen, Y.; Zhang, J.; Wu, B.; Zheng, L.; Haruehanroengra, P.; Wang, R.; Li, S.; Lin, J.; et al. Crystal structure of an RNA-cleaving DNAzyme. Nat. Commun. 2017, 8, 2006. [Google Scholar] [CrossRef] [Green Version]
  29. Feng, M.; Gu, C.; Sun, Y.; Zhang, S.; Tong, A.; Xiang, Y. Enhancing Catalytic Activity of Uranyl-Dependent DNAzyme by Flexible Linker Insertion for More Sensitive Detection of Uranyl Ion. Anal. Chem. 2019, 91, 6608–6615. [Google Scholar] [CrossRef]
  30. Parra-Meneses, V.; Rojas-Hernandez, F.; Cepeda-Plaza, M. The role of Na(+) in catalysis by the 8-17 DNAzyme. Org. Biomol. Chem. 2022, 20, 6356–6362. [Google Scholar] [CrossRef]
  31. Cortes-Guajardo, C.; Rojas-Hernandez, F.; Paillao-Bustos, R.; Cepeda-Plaza, M. Hydrated metal ion as a general acid in the catalytic mechanism of the 8-17 DNAzyme. Org. Biomol. Chem. 2021, 19, 5395–5402. [Google Scholar] [CrossRef] [PubMed]
  32. Guo, Z.; Hong, H.; Yuan, G.; Qian, H.; Li, B.; Cao, Y.; Wang, W.; Wu, C.X.; Chen, H. Hidden Intermediate State and Second Pathway Determining Folding and Unfolding Dynamics of GB1 Protein at Low Forces. Phys. Rev. Lett. 2020, 125, 198101. [Google Scholar] [CrossRef] [PubMed]
  33. Bustamante, C.; Alexander, L.; Maciuba, K.; Kaiser, C.M. Single-Molecule Studies of Protein Folding with Optical Tweezers. Annu. Rev. Biochem. 2020, 89, 443–470. [Google Scholar] [CrossRef]
  34. Zhang, J.L.H.; Qin, M.; Wang, W.; Cao, Y. Quantifying cation-π interactions in marine adhesive proteins using single-molecule force spectroscopy. Supramol. Mater. 2022, 1, 100005. [Google Scholar] [CrossRef]
  35. Ha, T. Single-molecule fluorescence resonance energy transfer. Methods 2001, 25, 78–86. [Google Scholar] [CrossRef] [PubMed] [Green Version]
  36. Lerner, E.; Cordes, T.; Ingargiola, A.; Alhadid, Y.; Chung, S.; Michalet, X.; Weiss, S. Toward dynamic structural biology: Two decades of single-molecule Forster resonance energy transfer. Science 2018, 359, eaan1133. [Google Scholar] [CrossRef] [Green Version]
  37. Lehn, J. Supramolecular materials: Dynamic, responsive, adaptive. Supramol. Mater. 2022, 1, 100007. [Google Scholar] [CrossRef]
  38. Ha, T.; Enderle, T.; Ogletree, D.F.; Chemla, D.S.; Selvin, P.R.; Weiss, S. Probing the interaction between two single molecules: Fluorescence resonance energy transfer between a single donor and a single acceptor. Proc. Natl. Acad. Sci. USA 1996, 93, 6264–6268. [Google Scholar] [CrossRef] [Green Version]
  39. Leveille, M.P.; Tran, T.; Dingillo, G.; Cannon, B. Detection of Mg(2+)-dependent, coaxial stacking rearrangements in a bulged three-way DNA junction by single-molecule FRET. Biophys. Chem. 2019, 245, 25–33. [Google Scholar] [CrossRef]
  40. McKinney, S.A.; Declais, A.C.; Lilley, D.M.; Ha, T. Structural dynamics of individual Holliday junctions. Nat. Struct. Biol. 2003, 10, 93–97. [Google Scholar] [CrossRef]
  41. Steiner, M.; Karunatilaka, K.S.; Sigel, R.K.; Rueda, D. Single-molecule studies of group II intron ribozymes. Proc. Natl. Acad. Sci. USA 2008, 105, 13853–13858. [Google Scholar] [CrossRef] [PubMed] [Green Version]
  42. Suddala, K.C.; Wang, J.; Hou, Q.; Walter, N.G. Mg(2+) shifts ligand-mediated folding of a riboswitch from induced-fit to conformational selection. J. Am. Chem. Soc. 2015, 137, 14075–14083. [Google Scholar] [CrossRef] [PubMed] [Green Version]
  43. McKinney, S.A.; Joo, C.; Ha, T. Analysis of single-molecule FRET trajectories using hidden Markov modeling. Biophys. J. 2006, 91, 1941–1951. [Google Scholar] [CrossRef] [Green Version]
  44. Blanco, M.; Walter, N.G. Analysis of complex single-molecule FRET time trajectories. Methods Enzymol. 2010, 472, 153–178. [Google Scholar] [CrossRef] [Green Version]
  45. Pan, H.; Xia, Y.; Qin, M.; Cao, Y.; Wang, W. A simple procedure to improve the surface passivation for single molecule fluorescence studies. Phys. Biol. 2015, 12, 045006. [Google Scholar] [CrossRef]
  46. Roy, R.; Hohng, S.; Ha, T. A practical guide to single-molecule FRET. Nat. Methods 2008, 5, 507–516. [Google Scholar] [CrossRef] [PubMed]
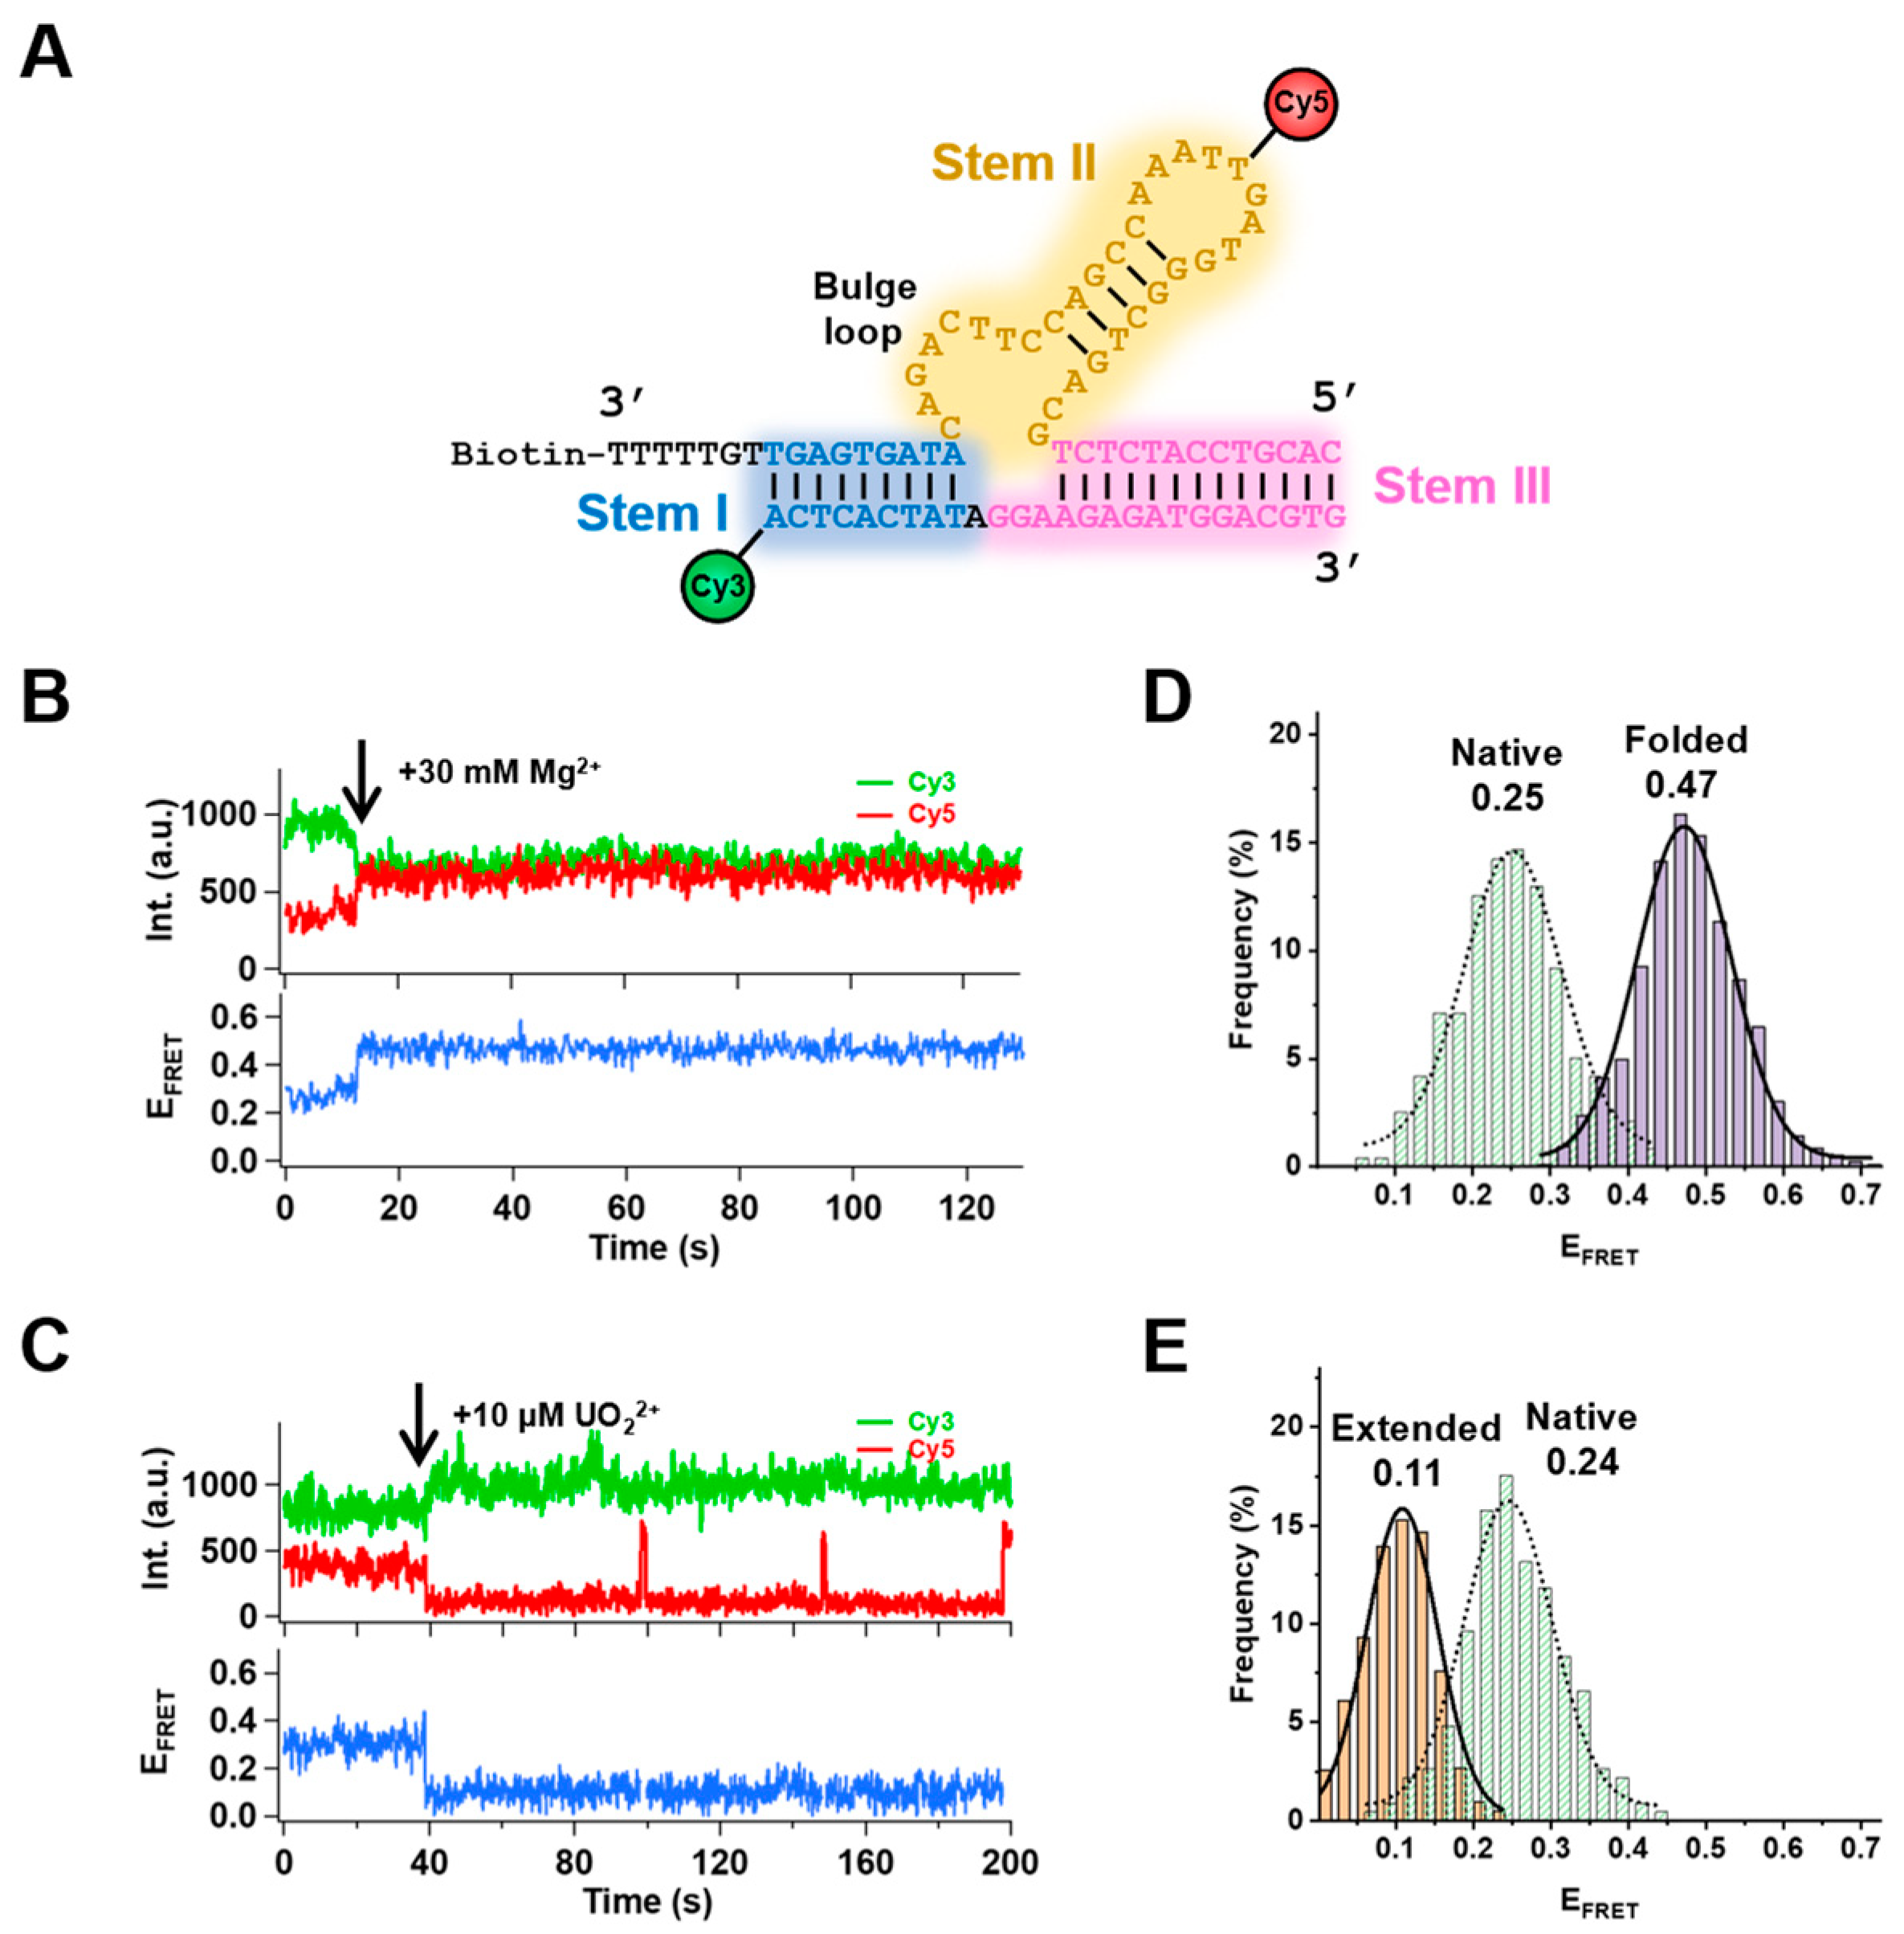
Figure 1. 39E DNAzyme structure and the conformational changes with the injections of Mg2+ or UO22+ in solution. (A) The secondary structure of 39E DNAzyme. The substrate strand was modified with the fluorescent dye Cy3 at the 5′ end, and the original cleavage site rA was replaced with a deoxynucleotide adenine (black “A”). The enzyme strand was labeled with biotin at the 3′ end and a fluorescent dye group Cy5 on the distal loop. (B) Time traces of Cy3 and Cy5 signals and FRET changes. The arrow denotes the addition of 30 mM Mg2+ at 13 s. (C) Fluorophore signals and EFRET time trace with the addition of 10 μM UO22+ at 38 s, the acceptor’s presence was checked by direct excitation of Cy5 fluorophore using a 640 nm laser. Histograms of different FRET states with Mg2+ (752 traces, EFRET~0.25 for native state and EFRET~0.47 for the folded state) (D) and with UO22+ (286 traces, EFRET~0.24 for native state and EFRET~0.11 for the extended state) (E) in the solutions.
Ijms 24 01212 g001
Figure 2. Mg2+–dependent conformational switches of 39E DNAzyme. (A) The time trace of fluorescence of donor and acceptor and sequential photobleaching of Cy3 (dashed line). (B) With the presence of 30 mM Mg2+, three different levels of FRET histograms from individual FRET time trajectories (312 traces) were obtained. EFRET~0.25 for the native state (N) before adding Mg2+ solution and EFRET~0.48 for the folded state (F) after injecting Mg2+, and EFRET~0.12 for the extended state (E). (C) In the time between the addition of Mg2+ and photobleaching of the donor fluorophore (dashed line), 39E DNAzymes undergo four conformational changes. (D) The histograms of four different FRET levels obtained from individual FRET traces (219 traces). EFRET~0.26 for native state (N) before adding Mg2+ solution and EFRET~0.45 for the folded state (F) after injecting Mg2+, EFRET~0.12 for extended state (E) and an additional EFRET~0.58 for a compact state (C).
Ijms 24 01212 g002
Figure 3. Conformation switches between different conformational states in presence of 30 mM Mg2+ in solution. (A) The time trace of fluorescence shows that the 39E DNAzymes switched between the folded (F) and the compact (C) state and (B) between the folded (F) and the extended (E) state. The orange lines present the hidden Markov model fittings. Dwell time histogram by single exponential fittings give the rate of each transition is kF–C = 0.67 s−1, kC–F = 7.24 s−1 (C), and kF–E = 0.015 s−1, kE–F = 0.19 s−1 (D). (E) The transition density plot (TDP) of F↔C (761 transitions) and F↔E (418 transitions) switches. (F) Transition occupancy density plot (TODP) of F↔C (336 molecules) and F↔E (296 molecules) transitions scaled by the fraction of molecules in F↔C transition.
Ijms 24 01212 g003
Figure 4. Intensity trajectories of 39E DNAzyme showing conformational dynamics without Mg2+. 39E DNAzymes switched back and forth between N state and C state (A) and between N state and E state (B). The transition rates derived from dwell time analysis are given in (C) and (D): kN–C = 0.36 s−1, kC–N = 2.74 s−1 and kN–E = 0.33 s−1, kE–N = 0.58 s−1. (E) The transition density plot (TDP) of the traces showing different transition populations of N↔C (1046 transitions) and N↔E (163 transitions). (F) Transition occupancy density plot (TODP) of N↔C (549 molecules) and N↔E (122 molecules) transitions scaled by the fraction of molecules in N↔C transition.
Ijms 24 01212 g004
Figure 5. Free energy diagram based on the transition rates derived from smFRET experiments. E, N, F, and C represent the extended state, the native state, the folded state, and the compact state, respectively.
Ijms 24 01212 g005
Disclaimer/Publisher’s Note: The statements, opinions and data contained in all publications are solely those of the individual author(s) and contributor(s) and not of MDPI and/or the editor(s). MDPI and/or the editor(s) disclaim responsibility for any injury to people or property resulting from any ideas, methods, instructions or products referred to in the content.