
Structural Similarities and Overlapping Activities among Dihydroflavonol 4-Reductase, Flavanone 4-Reductase, and Anthocyanidin Reductase Offer Metabolic Flexibility in the Flavonoid Pathway
 , , , , and
Abstract
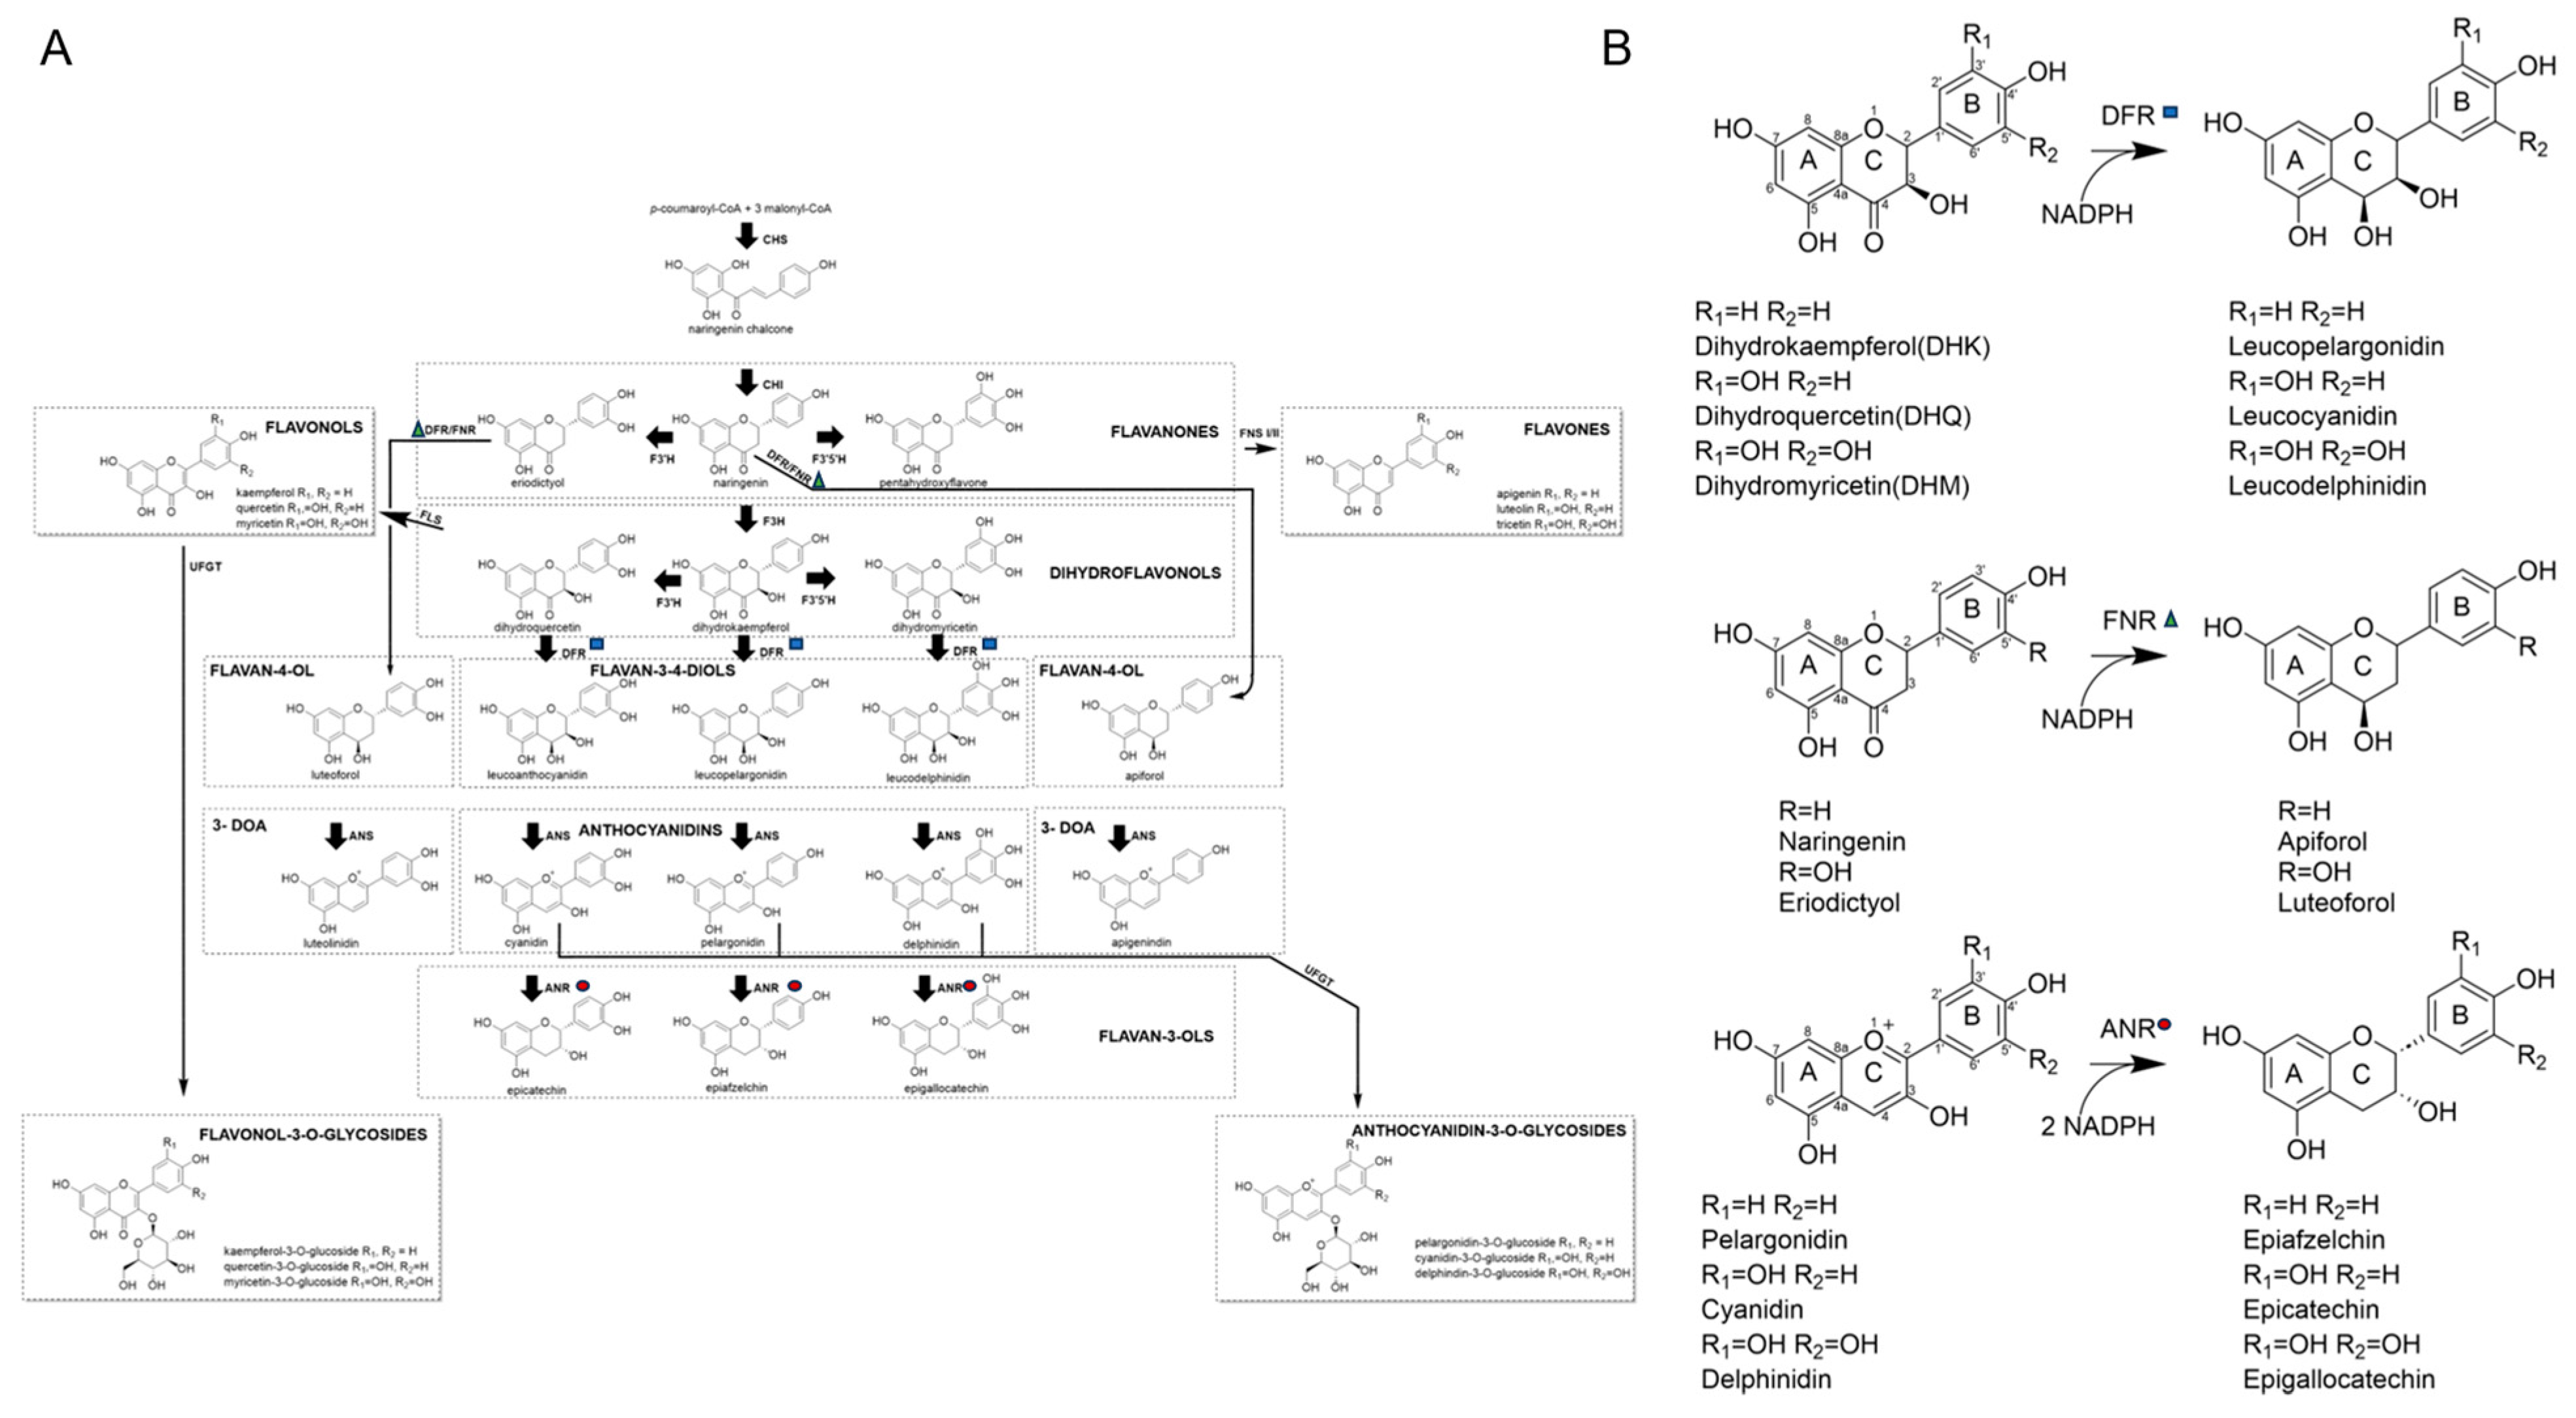
:1. Introduction
2. Results
2.1. Determination of the Structure of DFR, FNR and ANR
2.1.1. PvDFRa
2.1.2. SbFNR1 and SbFNR2
2.1.3. SbDFR3 and SbANR
2.2. Detailed Analysis of the Cofactor-Binding Pocket
2.2.1. DHQ in PvDFRa (PDBID: 8FEN)
2.2.2. Naringenin/DHQ in SbFNR1 (PDBID: 8FEU, 8FEV)
2.2.3. Naringenin in SbFNR2 (PDBID: 8FIO)
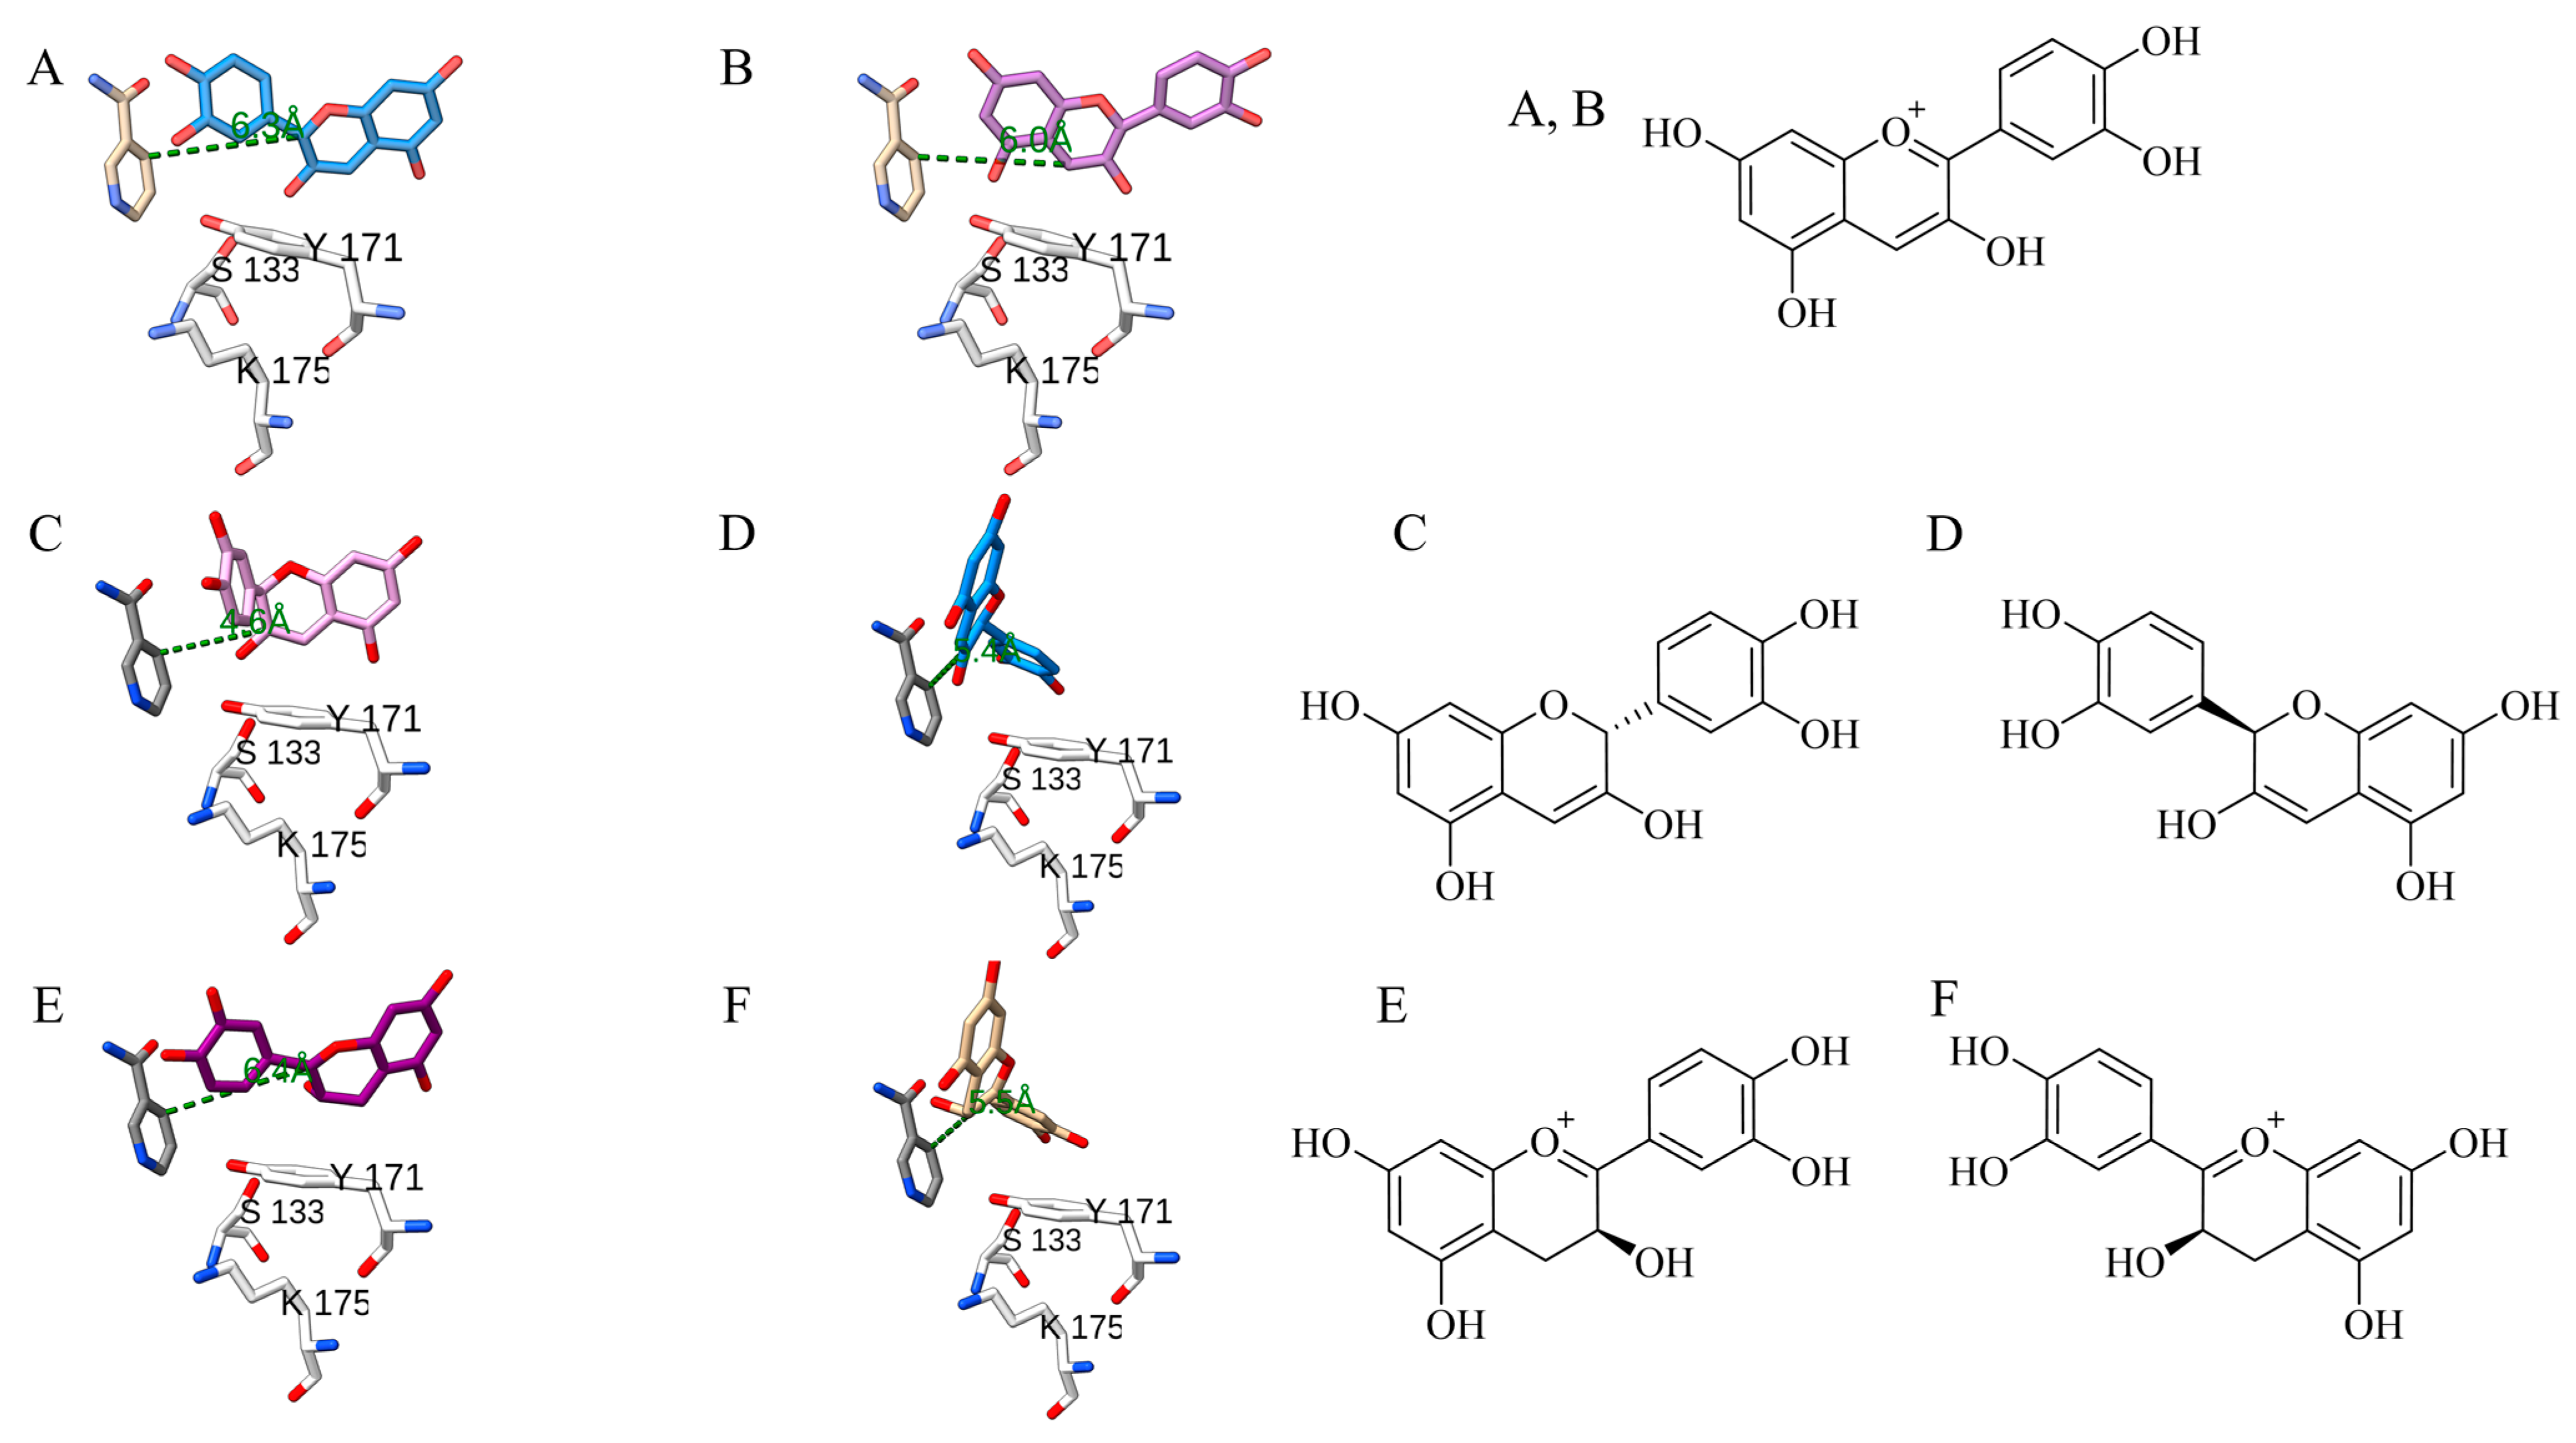
2.3. Molecular Docking to Investigate the Interactions between PvDFRa and Substrates
2.4. Enzyme Activity Assays of PvDFRa, SbDFR3, SbFNR1, SbFNR2 and SbANR
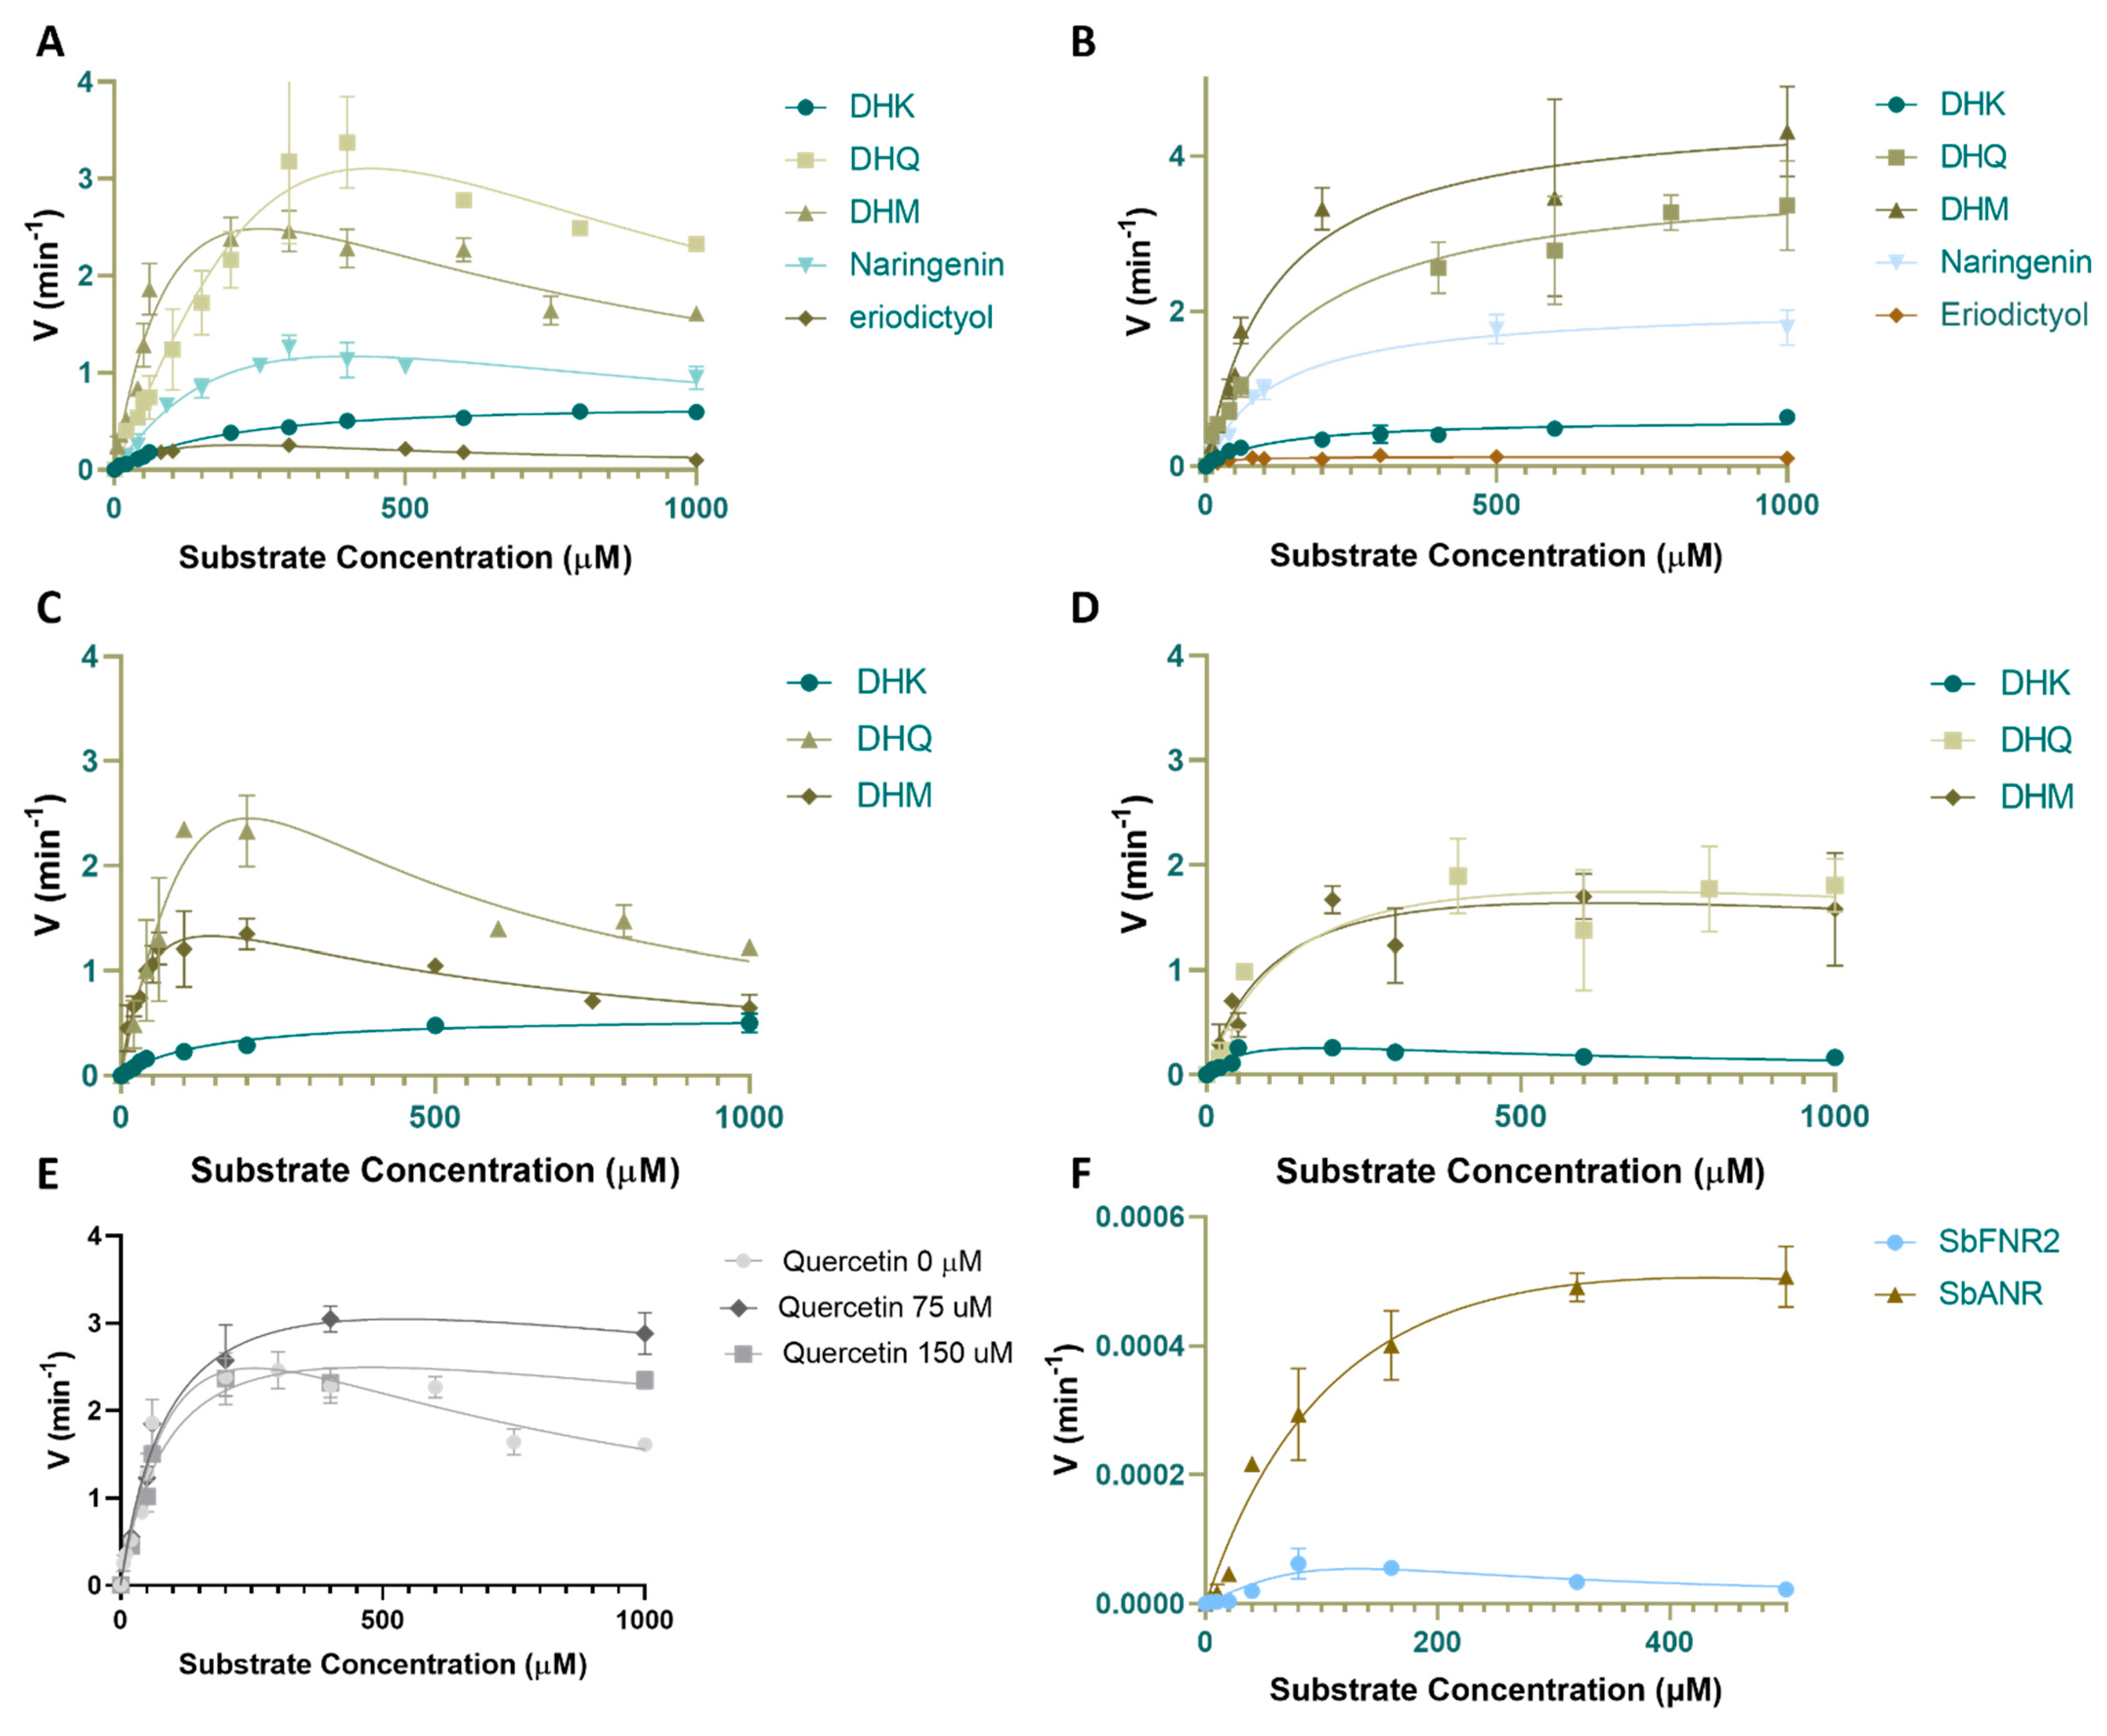
2.4.1. Activity against Dihydroflavonol (DHQ, DHM and DHK)
2.4.2. Activity against Flavanones (Eriodictyol and Naringenin)
2.4.3. Activity against Anthocyanidins (Cyanidin, Pelargonidin and Delphinidin)
2.5. Inhibition by Quercetin
2.6. Isothermal Titration Calorimetry
3. Discussion
3.1. Significance of Overlapping Substrate-Specificity among FNR, DFR and ANR
3.2. Broad Substrate-Specificity and Key Residues of DFR
3.3. Inhibition by NADP+, Anthocyanidins and Quercetin
3.4. Catalytic Mechanism of DFR, FNR and ANR
3.5. FNR Activity
3.6. ANR Activity
3.7. Stress and Overexpression
4. Materials and Methods
Crystallization and Structure Determination
5. Conclusions
Supplementary Materials
Author Contributions
Funding
Institutional Review Board Statement
Informed Consent Statement
Data Availability Statement
Acknowledgments
Conflicts of Interest
References
- Poloni, A.; Schirawski, J. Red Card for Pathogens: Phytoalexins in Sorghum and Maize. Molecules 2014, 19, 9114–9133. [Google Scholar] [CrossRef] [PubMed]
- Liu, W.; Feng, Y.; Yu, S.; Fan, Z.; Li, X.; Li, J.; Yin, H. The Flavonoid Biosynthesis Network in Plants. Int. J. Mol. Sci. 2021, 22, 12824. [Google Scholar] [CrossRef] [PubMed]
- Del Río, J.C.; Rencoret, J.; Prinsen, P.; Martínez, Á.T.; Ralph, J.; Gutiérrez, A. Structural Characterization of Wheat Straw Lignin as Revealed by Analytical Pyrolysis, 2D-NMR, and Reductive Cleavage Methods. J. Agric. Food Chem. 2012, 60, 5922–5935. [Google Scholar] [CrossRef] [PubMed]
- Lan, W.; Morreel, K.; Lu, F.; Rencoret, J.; Carlos del Río, J.; Voorend, W.; Vermerris, W.; Boerjan, W.; Ralph, J. Maize Tricin-Oligolignol Metabolites and Their Implications for Monocot Lignification. Plant Physiol. 2016, 171, 810–820. [Google Scholar] [CrossRef]
- Tetreault, H.M.; Gries, T.; Liu, S.; Toy, J.; Xin, Z.; Vermerris, W.; Ralph, J.; Funnell-Harris, D.L.; Sattler, S.E. The Sorghum (Sorghum bicolor) Brown Midrib 30 Gene Encodes a Chalcone Isomerase Required for Cell Wall Lignification. Front. Plant Sci. 2021, 12, 732307. [Google Scholar] [CrossRef] [PubMed]
- Mahon, E.L.; de Vries, L.; Jang, S.-K.; Middar, S.; Kim, H.; Unda, F.; Ralph, J.; Mansfield, S.D. Exogenous Chalcone Synthase Expression in Developing Poplar Xylem Incorporates Naringenin into Lignins. Plant Physiol. 2022, 188, 984–996. [Google Scholar] [CrossRef]
- Koga, T.; Meydani, M. Effect of Plasma Metabolites of (+)-Catechin and Quercetin on Monocyte Adhesion to Human Aortic Endothelial Cells1,2,3,4. Am. J. Clin. Nutr. 2001, 73, 941–948. [Google Scholar] [CrossRef]
- Overman, A.; Chuang, C.-C.; McIntosh, M. Quercetin Attenuates Inflammation in Human Macrophages and Adipocytes Exposed to Macrophage-Conditioned Media. Int. J. Obes. 2011, 35, 1165–1172. [Google Scholar] [CrossRef]
- Scarano, A.; Chieppa, M.; Santino, A. Looking at Flavonoid Biodiversity in Horticultural Crops: A Colored Mine with Nutritional Benefits. Plants 2018, 7, 98. [Google Scholar] [CrossRef]
- Ballard, C.R.; Maróstica, M.R. Chapter 10—Health Benefits of Flavonoids. In Bioactive Compounds; Campos, M.R.S., Ed.; Woodhead Publishing: Cambridge, UK, 2019; pp. 185–201. ISBN 978-0-12-814774-0. [Google Scholar]
- Septembre-Malaterre, A.; Boumendjel, A.; Seteyen, A.-L.S.; Boina, C.; Gasque, P.; Guiraud, P.; Sélambarom, J. Focus on the High Therapeutic Potentials of Quercetin and Its Derivatives. Phytomedicine Plus 2022, 2, 100220. [Google Scholar] [CrossRef]
- Yi, T.; Chen, H.-B.; Zhao, Z.-Z.; Yu, Z.-L.; Jiang, Z.-H. Comparison of the Chemical Profiles and Anti-Platelet Aggregation Effects of Two “Dragon’s Blood” Drugs Used in Traditional Chinese Medicine. J. Ethnopharmacol. 2011, 133, 796–802. [Google Scholar] [CrossRef]
- Yi, T.; Tang, Y.; Zhang, J.; Zhao, Z.; Yang, Z.; Chen, H. Characterization and Determination of Six Flavonoids in the Ethnomedicine “Dragon’s Blood” by UPLC-PAD-MS. Chem. Cent. J. 2012, 6, 116. [Google Scholar] [CrossRef]
- Fan, L.-L.; Yi, T.; Xu, F.; Zhang, Y.-Z.; Zhang, J.-Y.; Li, D.-P.; Xie, Y.-J.; Qin, S.-D.; Chen, H.-B. Characterization of Flavonoids in the Ethomedicine Fordiae Cauliflorae Radix and Its Adulterant Millettiae Pulchrae Radix by HPLC-DAD-ESI-IT-TOF-MSn. Molecules 2013, 18, 15134–15152. [Google Scholar] [CrossRef]
- Sun, W.; Meng, X.; Liang, L.; Jiang, W.; Huang, Y.; He, J.; Hu, H.; Almqvist, J.; Gao, X.; Wang, L. Molecular and Biochemical Analysis of Chalcone Synthase from Freesia Hybrid in Flavonoid Biosynthetic Pathway. PLoS ONE 2015, 10, e0119054. [Google Scholar] [CrossRef]
- Lo, S.-C.C.; Nicholson, R.L. Reduction of Light-Induced Anthocyanin Accumulation in Inoculated Sorghum Mesocotyls1: Implications for a Compensatory Role in the Defense Response. Plant Physiol. 1998, 116, 979–989. [Google Scholar] [CrossRef] [PubMed]
- Tanaka, Y.; Sasaki, N.; Ohmiya, A. Biosynthesis of Plant Pigments: Anthocyanins, Betalains and Carotenoids. Plant J. 2008, 54, 733–749. [Google Scholar] [CrossRef] [PubMed]
- Tsuda, T. Dietary Anthocyanin-Rich Plants: Biochemical Basis and Recent Progress in Health Benefits Studies. Mol. Nutr. Food Res. 2012, 56, 159–170. [Google Scholar] [CrossRef] [PubMed]
- Fukuchi-Mizutani, M.; Okuhara, H.; Fukui, Y.; Nakao, M.; Katsumoto, Y.; Yonekura-Sakakibara, K.; Kusumi, T.; Hase, T.; Tanaka, Y. Biochemical and Molecular Characterization of a Novel UDP-Glucose:Anthocyanin 3′-O-Glucosyltransferase, a Key Enzyme for Blue Anthocyanin Biosynthesis, from Gentian. Plant Physiol. 2003, 132, 1652–1663. [Google Scholar] [CrossRef]
- Xiong, Y.; Zhang, P.; Warner, R.D.; Fang, Z. 3-Deoxyanthocyanidin Colorant: Nature, Health, Synthesis, and Food Applications. Compr. Rev. Food Sci. Food Saf. 2019, 18, 1533–1549. [Google Scholar] [CrossRef]
- Snyder, B.A.; Nicholson, R.L. Synthesis of Phytoalexins in Sorghum as a Site-Specific Response to Fungal Ingress. Science 1990, 248, 1637–1639. [Google Scholar] [CrossRef]
- Dykes, L. Sorghum Phytochemicals and Their Potential Impact on Human Health. In Sorghum: Methods and Protocols; Zhao, Z.-Y., Dahlberg, J., Eds.; Methods in Molecular Biology; Springer: New York, NY, USA, 2019; pp. 121–140. ISBN 978-1-4939-9039-9. [Google Scholar]
- Lam, P.Y.; Lui, A.C.W.; Wang, L.; Liu, H.; Umezawa, T.; Tobimatsu, Y.; Lo, C. Tricin Biosynthesis and Bioengineering. Front. Plant Sci. 2021, 12, 1773. [Google Scholar] [CrossRef]
- Xie, D.-Y.; Jackson, L.A.; Cooper, J.D.; Ferreira, D.; Paiva, N.L. Molecular and Biochemical Analysis of Two CDNA Clones Encoding Dihydroflavonol-4-Reductase from Medicago truncatula. Plant Physiol. 2004, 134, 979–994. [Google Scholar] [CrossRef] [PubMed]
- Davies, K.M.; Schwinn, K.E.; Deroles, S.C.; Manson, D.G.; Bloor, S.J.; Bradley, J.M. Enhancing Anthocyanin Production by Altering Competition for Substrate between Flavonol Synthase and Dihydroflavonol 4-Reductase. Euphytica 2003, 131, 259–268. [Google Scholar] [CrossRef]
- Meyer, P.; Heidmann, I.; Forkmann, G.; Saedler, H. A New Petunia Flower Colour Generated by Transformation of a Mutant with a Maize Gene. Nature 1987, 330, 677–678. [Google Scholar] [CrossRef] [PubMed]
- Johnson, E.T.; Ryu, S.; Yi, H.; Shin, B.; Cheong, H.; Choi, G. Alteration of a Single Amino Acid Changes the Substrate Specificity of Dihydroflavonol 4-Reductase. Plant J. 2001, 25, 325–333. [Google Scholar] [CrossRef]
- Hayashi, M.; Takahashi, H.; Tamura, K.; Huang, J.; Yu, L.-H.; Kawai-Yamada, M.; Tezuka, T.; Uchimiya, H. Enhanced Dihydroflavonol-4-Reductase Activity and NAD Homeostasis Leading to Cell Death Tolerance in Transgenic Rice. Proc. Natl. Acad. Sci. USA 2005, 102, 7020–7025. [Google Scholar] [CrossRef]
- Petit, P.; Granier, T.; d’Estaintot, B.L.; Manigand, C.; Bathany, K.; Schmitter, J.-M.; Lauvergeat, V.; Hamdi, S.; Gallois, B. Crystal Structure of Grape Dihydroflavonol 4-Reductase, a Key Enzyme in Flavonoid Biosynthesis. J. Mol. Biol. 2007, 368, 1345–1357. [Google Scholar] [CrossRef]
- Gargouri, M.; Manigand, C.; Maugé, C.; Granier, T.; Langlois d’Estaintot, B.; Cala, O.; Pianet, I.; Bathany, K.; Chaudière, J.; Gallois, B. Structure and Epimerase Activity of Anthocyanidin Reductase from Vitis Vinifera. Acta Crystallogr. D Biol. Crystallogr. 2009, 65, 989–1000. [Google Scholar] [CrossRef]
- Filling, C.; Berndt, K.D.; Benach, J.; Knapp, S.; Prozorovski, T.; Nordling, E.; Ladenstein, R.; Jörnvall, H.; Oppermann, U. Critical Residues for Structure and Catalysis in Short-Chain Dehydrogenases/Reductases. J. Biol. Chem. 2002, 277, 25677–25684. [Google Scholar] [CrossRef]
- Kawahigashi, H.; Kasuga, S.; Sawada, Y.; Yonemaru, J.; Ando, T.; Kanamori, H.; Wu, J.; Mizuno, H.; Momma, M.; Fujimoto, Z.; et al. The Sorghum Gene for Leaf Color Changes upon Wounding (P) Encodes a Flavanone 4-Reductase in the 3-Deoxyanthocyanidin Biosynthesis Pathway. G3 GenesGenomesGenetics 2016, 6, 1439–1447. [Google Scholar] [CrossRef]
- Leonard, E.; Yan, Y.; Chemler, J.; Matern, U.; Martens, S.; Koffas, M.A.G. Characterization of Dihydroflavonol 4-Reductases for Recombinant Plant Pigment Biosynthesis Applications. Biocatal. Biotransformation 2008, 26, 243–251. [Google Scholar] [CrossRef]
- Fischer, T.C.; Halbwirth, H.; Meisel, B.; Stich, K.; Forkmann, G. Molecular Cloning, Substrate Specificity of the Functionally Expressed Dihydroflavonol 4-Reductases from Malus domestica and Pyrus communis Cultivars and the Consequences for Flavonoid Metabolism. Arch. Biochem. Biophys. 2003, 412, 223–230. [Google Scholar] [CrossRef]
- Tian, J.; Han, Z.; Zhang, J.; Hu, Y.; Song, T.; Yao, Y. The Balance of Expression of Dihydroflavonol 4-Reductase and Flavonol Synthase Regulates Flavonoid Biosynthesis and Red Foliage Coloration in Crabapples. Sci. Rep. 2015, 5, 12228. [Google Scholar] [CrossRef]
- Trabelsi, N.; Petit, P.; Manigand, C.; Langlois d’Estaintot, B.; Granier, T.; Chaudière, J.; Gallois, B. Structural Evidence for the Inhibition of Grape Dihydroflavonol 4-Reductase by Flavonols. Acta Crystallogr. D Biol. Crystallogr. 2008, 64, 883–891. [Google Scholar] [CrossRef] [PubMed]
- Stracke, R.; Ishihara, H.; Huep, G.; Barsch, A.; Mehrtens, F.; Niehaus, K.; Weisshaar, B. Differential Regulation of Closely Related R2R3-MYB Transcription Factors Controls Flavonol Accumulation in Different Parts of the Arabidopsis thaliana Seedling. Plant J. 2007, 50, 660–677. [Google Scholar] [CrossRef]
- Liu, H.; Du, Y.; Chu, H.; Shih, C.H.; Wong, Y.W.; Wang, M.; Chu, I.K.; Tao, Y.; Lo, C. Molecular Dissection of the Pathogen-Inducible 3-Deoxyanthocyanidin Biosynthesis Pathway in Sorghum. Plant Cell Physiol. 2010, 51, 1173–1185. [Google Scholar] [CrossRef]
- Krissinel, E.; Henrick, K. Inference of Macromolecular Assemblies from Crystalline State. J. Mol. Biol. 2007, 372, 774–797. [Google Scholar] [CrossRef] [PubMed]
- Holm, L. Using Dali for Protein Structure Comparison. In Structural Bioinformatics: Methods and Protocols; Gáspári, Z., Ed.; Methods in Molecular Biology; Springer: New York, NY, USA, 2020; pp. 29–42. ISBN 978-1-07-160270-6. [Google Scholar]
- Pan, H.; Zhou, R.; Louie, G.V.; Mühlemann, J.K.; Bomati, E.K.; Bowman, M.E.; Dudareva, N.; Dixon, R.A.; Noel, J.P.; Wang, X. Structural Studies of Cinnamoyl-CoA Reductase and Cinnamyl-Alcohol Dehydrogenase, Key Enzymes of Monolignol Biosynthesis. Plant Cell 2014, 26, 3709–3727. [Google Scholar] [CrossRef]
- Waterhouse, A.; Bertoni, M.; Bienert, S.; Studer, G.; Tauriello, G.; Gumienny, R.; Heer, F.T.; de Beer, T.A.P.; Rempfer, C.; Bordoli, L.; et al. SWISS-MODEL: Homology Modelling of Protein Structures and Complexes. Nucleic Acids Res. 2018, 46, W296–W303. [Google Scholar] [CrossRef] [PubMed]
- Kavanagh, K.L.; Jörnvall, H.; Persson, B.; Oppermann, U. Medium- and Short-Chain Dehydrogenase/Reductase Gene and Protein Families. Cell. Mol. Life Sci. 2008, 65, 3895–3906. [Google Scholar] [CrossRef]
- Kallberg, Y.; Oppermann, U.; Jörnvall, H.; Persson, B. Short-Chain Dehydrogenases/Reductases (SDRs). Eur. J. Biochem. 2002, 269, 4409–4417. [Google Scholar] [CrossRef] [PubMed]
- Trott, O.; Olson, A.J. AutoDock Vina: Improving the Speed and Accuracy of Docking with a New Scoring Function, Efficient Optimization and Multithreading. J. Comput. Chem. 2010, 31, 455–461. [Google Scholar] [CrossRef] [PubMed]
- Eberhardt, J.; Santos-Martins, D.; Tillack, A.F.; Forli, S. AutoDock Vina 1.2.0: New Docking Methods, Expanded Force Field, and Python Bindings. J. Chem. Inf. Model. 2021, 61, 3891–3898. [Google Scholar] [CrossRef]
- Ruan, H.; Shi, X.; Gao, L.; Rashid, A.; Li, Y.; Lei, T.; Dai, X.; Xia, T.; Wang, Y. Functional Analysis of the Dihydroflavonol 4-Reductase Family of Camellia Sinensis: Exploiting Key Amino Acids to Reconstruct Reduction Activity. Hortic. Res. 2022, 9, uhac098. [Google Scholar] [CrossRef] [PubMed]
- Xie, D.-Y.; Sharma, S.B.; Dixon, R.A. Anthocyanidin Reductases from Medicago truncatula and Arabidopsis thaliana. Arch. Biochem. Biophys. 2004, 422, 91–102. [Google Scholar] [CrossRef] [PubMed]
- Jun, J.H.; Lu, N.; Docampo-Palacios, M.; Wang, X.; Dixon, R.A. Dual Activity of Anthocyanidin Reductase Supports the Dominant Plant Proanthocyanidin Extension Unit Pathway. Sci. Adv. 2021, 7, eabg4682. [Google Scholar] [CrossRef]
- Aiguo, Z.; Ruiwen, D.; Cheng, W.; Cheng, C.; Dongmei, W. Insights into the Catalytic and Regulatory Mechanisms of Dihydroflavonol 4-Reductase, a Key Enzyme of Anthocyanin Synthesis in Zanthoxylum bungeanum. Tree Physiol. 2023, 43, 169–184. [Google Scholar] [CrossRef]
- Moummou, H.; Kallberg, Y.; Tonfack, L.B.; Persson, B.; van der Rest, B. The Plant Short-Chain Dehydrogenase (SDR) Superfamily: Genome-Wide Inventory and Diversification Patterns. BMC Plant Biol. 2012, 12, 219. [Google Scholar] [CrossRef]
- Jones, D.T.; Taylor, W.R.; Thornton, J.M. The Rapid Generation of Mutation Data Matrices from Protein Sequences. Comput. Appl. Biosci. CABIOS 1992, 8, 275–282. [Google Scholar] [CrossRef]
- Sharma, R.; Vijay, M.P.; Rao, V.P.; Thakur, R.P. Biochemical Characterization of Recently Identified Grain Mold Resistant Sorghum Lines. Indian J. Plant Prot. 2009, 37, 192–195. [Google Scholar]
- Tanaka, Y.; Tsuda, S.; Kusumi, T. Metabolic Engineering to Modify Flower Color. Plant Cell Physiol. 1998, 39, 1119–1126. [Google Scholar] [CrossRef]
- Nadia, T.; d’Estaintot, B.L.; Gilles, S.; Bernard, G.; Jean, C. Kinetic and Binding Equilibrium Studies of Dihydroflavonol 4-Reductase from Vitis vinifera and Its Unusually Strong Substrate Inhibition. J. Biophys. Chem. 2011, 2, 332–344. [Google Scholar] [CrossRef]
- Stafford, H.A. Flavonoid Metabolism; CRC Press: Boca Raton, FL, USA, 1990; ISBN 978-0-8493-6085-5. [Google Scholar]
- Falcone Ferreyra, M.L.; Rius, S.; Emiliani, J.; Pourcel, L.; Feller, A.; Morohashi, K.; Casati, P.; Grotewold, E. Cloning and Characterization of a UV-B-Inducible Maize Flavonol Synthase. Plant J. 2010, 62, 77–91. [Google Scholar] [CrossRef]
- Wang, H.; Fan, W.; Li, H.; Yang, J.; Huang, J.; Zhang, P. Functional Characterization of Dihydroflavonol-4-Reductase in Anthocyanin Biosynthesis of Purple Sweet Potato Underlies the Direct Evidence of Anthocyanins Function against Abiotic Stresses. PLoS ONE 2013, 8, e78484. [Google Scholar] [CrossRef]
- Jun, S.-Y.; Walker, A.M.; Kim, H.; Ralph, J.; Vermerris, W.; Sattler, S.E.; Kang, C. The Enzyme Activity and Substrate Specificity of Two Major Cinnamyl Alcohol Dehydrogenases in Sorghum (Sorghum Bicolor), SbCAD2 and SbCAD4. Plant Physiol. 2017, 174, 2128–2145. [Google Scholar] [CrossRef]
- Sattler, S.A.; Walker, A.M.; Vermerris, W.; Sattler, S.E.; Kang, C. Structural and Biochemical Characterization of Cinnamoyl-CoA Reductases. Plant Physiol. 2017, 173, 1031–1044. [Google Scholar] [CrossRef]
- Hwang, C.-C.; Chang, Y.-H.; Hsu, C.-N.; Hsu, H.-H.; Li, C.-W.; Pon, H.-I. Mechanistic Roles of Ser-114, Tyr-155, and Lys-159 in 3α-Hydroxysteroid Dehydrogenase/Carbonyl Reductase from Comamonas testosteroni. J. Biol. Chem. 2005, 280, 3522–3528. [Google Scholar] [CrossRef]
- Andersen-Civil, A.I.S.; Leppä, M.M.; Thamsborg, S.M.; Salminen, J.-P.; Williams, A.R. Structure-Function Analysis of Purified Proanthocyanidins Reveals a Role for Polymer Size in Suppressing Inflammatory Responses. Commun. Biol. 2021, 4, 896. [Google Scholar] [CrossRef]
- He, D.; Singh, S.K.; Peng, L.; Kaushal, R.; Vílchez, J.I.; Shao, C.; Wu, X.; Zheng, S.; Morcillo, R.J.L.; Paré, P.W.; et al. Flavonoid-Attracted Aeromonas Sp. from the Arabidopsis Root Microbiome Enhances Plant Dehydration Resistance. ISME J. 2022, 16, 2622–2632. [Google Scholar] [CrossRef]
- Shomali, A.; Das, S.; Arif, N.; Sarraf, M.; Zahra, N.; Yadav, V.; Aliniaeifard, S.; Chauhan, D.K.; Hasanuzzaman, M. Diverse Physiological Roles of Flavonoids in Plant Environmental Stress Responses and Tolerance. Plants 2022, 11, 3158. [Google Scholar] [CrossRef]
- Scully, E.D.; Gries, T.; Sarath, G.; Palmer, N.A.; Baird, L.; Serapiglia, M.J.; Dien, B.S.; Boateng, A.A.; Ge, Z.; Funnell-Harris, D.L.; et al. Overexpression of SbMyb60 Impacts Phenylpropanoid Biosynthesis and Alters Secondary Cell Wall Composition in Sorghum Bicolor. Plant J. 2016, 85, 378–395. [Google Scholar] [CrossRef]
- Donze-Reiner, T.; Palmer, N.A.; Scully, E.D.; Prochaska, T.J.; Koch, K.G.; Heng-Moss, T.; Bradshaw, J.D.; Twigg, P.; Amundsen, K.; Sattler, S.E.; et al. Transcriptional Analysis of Defense Mechanisms in Upland Tetraploid Switchgrass to Greenbugs. BMC Plant Biol. 2017, 17, 46. [Google Scholar] [CrossRef] [PubMed]
- Tetreault, H.M.; Scully, E.D.; Gries, T.; Palmer, N.A.; Funnell-Harris, D.L.; Baird, L.; Seravalli, J.; Dien, B.S.; Sarath, G.; Clemente, T.E.; et al. Overexpression of the Sorghum Bicolor SbCCoAOMT Alters Cell Wall Associated Hydroxycinnamoyl Groups. PLoS ONE 2018, 13, e0204153. [Google Scholar] [CrossRef] [PubMed]
- Palmer, N.A.; Basu, S.; Heng-Moss, T.; Bradshaw, J.D.; Sarath, G.; Louis, J. Fall Armyworm (Spodoptera Frugiperda Smith) Feeding Elicits Differential Defense Responses in Upland and Lowland Switchgrass. PLoS ONE 2019, 14, e0218352. [Google Scholar] [CrossRef] [PubMed]
- Tetreault, H.M.; Grover, S.; Scully, E.D.; Gries, T.; Palmer, N.A.; Sarath, G.; Louis, J.; Sattler, S.E. Global Responses of Resistant and Susceptible Sorghum (Sorghum bicolor) to Sugarcane Aphid (Melanaphis sacchari). Front. Plant Sci. 2019, 10, 145. [Google Scholar] [CrossRef] [PubMed]
- Koch, K.G.; Palmer, N.A.; Donze-Reiner, T.; Scully, E.D.; Seravalli, J.; Amundsen, K.; Twigg, P.; Louis, J.; Bradshaw, J.D.; Heng-Moss, T.M.; et al. Aphid-Responsive Defense Networks in Hybrid Switchgrass. Front. Plant Sci. 2020, 11, 1145. [Google Scholar] [CrossRef] [PubMed]
- Waki, T.; Mameda, R.; Nakano, T.; Yamada, S.; Terashita, M.; Ito, K.; Tenma, N.; Li, Y.; Fujino, N.; Uno, K.; et al. A Conserved Strategy of Chalcone Isomerase-like Protein to Rectify Promiscuous Chalcone Synthase Specificity. Nat. Commun. 2020, 11, 870. [Google Scholar] [CrossRef] [PubMed]
- Otwinowski, Z.; Minor, W. Processing of X-ray Diffraction Data Collected in Oscillation Mode. Methods Enzymol. 1997, 276, 307–326. [Google Scholar]
- Adams, P.D.; Afonine, P.V.; Bunkóczi, G.; Chen, V.B.; Davis, I.W.; Echols, N.; Headd, J.J.; Hung, L.-W.; Kapral, G.J.; Grosse-Kunstleve, R.W.; et al. PHENIX: A Comprehensive Python-Based System for Macromolecular Structure Solution. Acta Crystallogr. D Biol. Crystallogr. 2010, 66, 213–221. [Google Scholar] [CrossRef]
- Emsley, P.; Lohkamp, B.; Scott, W.G.; Cowtan, K. Features and Development of Coot. Acta Crystallogr. D Biol. Crystallogr. 2010, 66, 486–501. [Google Scholar] [CrossRef]
- Shih, C.-H.; Siu; Ng, R.; Wong, E.; Chiu, L.C.M.; Chu, I.K.; Lo, C. Quantitative Analysis of Anticancer 3-Deoxyanthocyanidins in Infected Sorghum Seedlings. J. Agric. Food Chem. 2007, 55, 254–259. [Google Scholar] [CrossRef] [PubMed]
- Tamura, K.; Stecher, G.; Kumar, S. MEGA11: Molecular Evolutionary Genetics Analysis Version 11. Mol. Biol. Evol. 2021, 38, 3022–3027. [Google Scholar] [CrossRef] [PubMed]
- Larkin, M.A.; Blackshields, G.; Brown, N.P.; Chenna, R.; McGettigan, P.A.; McWilliam, H.; Valentin, F.; Wallace, I.M.; Wilm, A.; Lopez, R.; et al. Clustal W and Clustal X Version 2.0. Bioinformatics 2007, 23, 2947–2948. [Google Scholar] [CrossRef] [PubMed]


| PvDFRa (NADP+ Complex) | PvDFRa (NADP+/DHQ Complex) | SbFNR1 (NADP+ Complex) | SbFNR1 (Naringenin Complex) | SbFNR1 (NADP(H)/Naringenin Complex) | SbFNR1 (NADP+/DHQ Complex) | SbFNR2 (NADP(H)/Naringenin Complex) | SbFNR2 (NADP+ Complex) | |
|---|---|---|---|---|---|---|---|---|
| PDB ID | 8FEM | 8FEN | 8FET | 8FEW | 8FEU | 8FEV | 8FIO | 8FIP |
| Data collection | ALS 5.0.1 | ALS 8.2.2 | ALS 5.0.1 | ALS 5.0.3 | ALS 5.0.1 | ALS 8.2.2 | ALS 5.0.1 | ALS 5.0.1 |
| Space group | P 42 21 2 | P 42 21 2 | I 41 2 2 | I 41 2 2 | I 41 2 2 | I 41 2 2 | P 21 21 21 | P 2 21 21 |
| Cell dimensions | ||||||||
| a, b, c (Å) | 119.177 119.177 56.906 | 119.177 119.177 56.907 | 163.203 163.203 206.566 | 165.069 165.069 208.599 | 165.180 165.180 207.655 | 165.012 165.012 209.116 | 59.089 112.787 122.808 | 86.628 90.219 103.76 |
| Resolution (Å) | 42.14–2.34 (2.42–2.34) | 33.86–2.55 (2.64–2.55) | 47.14–2.20 (2.28–2.20) | 46.68–2.02 (2.09–2.02) | 47.44–2.12 (2.19–2.12) | 47.71–2.21 (2.28–2.21) | 42.58–1.97 (2.04–1.97) | 66.5–1.7 (1.76–1.7) |
| Rsym or Rmerge | 0.1825 (1.547) | 0.2406 (0.9742) | 0.105 (1.756) | 0.02699 (0.754) | 0.0334 (0.7037) | 0.05134 (0.8971) | 0.0888 (0.8098) | 0.06585 (0.4378) |
| I/σI | 14.36 (1.26) | 9.14 (1.75) | 13.96 (1.77) | 20.32 (0.96) | 17.62 (1.16) | 12.10 (0.90) | 8.25 (0.83) | 19.49 (2.51) |
| Completeness (%) | 98.63 (96.84) | 99.31 (98.60) | 99.34 (98.61) | 99.88 (99.92) | 99.97 (99.96) | 99.95 (99.86) | 93.84 (61.70) | 99.98 (99.99) |
| Redundancy | 13.6 (9.2) | 6.3 (4.8) | 13.1 (12.7) | 2.0 (2.0) | 2.0 (2.0) | 2.0 (2.0) | 1.9 (1.6) | 6.6 (6.7) |
| Refinement | ||||||||
| Resolution (Å) | 2.34 | 2.55 | 2.20 | 2.02 | 2.12 | 2.21 | 1.97 | 1.70 |
| No. reflections | 241,446 | 87,359 | 70,362 | 93,749 | 80,982 | 71,968 | 55,196 | 596,143 |
| Rwork Rfree | 0.2059 0.2353 | 0.2375 0.2491 | 0.2067 0.2318 | 0.2120 0.2279 | 0.1991 0.2270 | 0.2018 0.2371 | 0.1928 0.2277 | 0.1726 0.1974 |
| No. atoms | 2688 | 2629 | 5581 | 5606 | 5727 | 5710 | 5904 | 6118 |
| Protein | 2523 | 2515 | 5170 | 5170 | 5170 | 5170 | 5144 | 5172 |
| Ligand/ion | 73 | 70 | 146 | 89 | 230 | 239 | 210 | 146 |
| Water | 97 | 44 | 315 | 371 | 401 | 375 | 624 | 850 |
| B-factors | 49.33 | 50.32 | 53.92 | 54.26 | 48.74 | 49.87 | 28.16 | 24.20 |
| Protein | 49.46 | 50.39 | 53.81 | 54.02 | 48.33 | 49.23 | 27.63 | 22.76 |
| Ligand/ion | 44.56 | 52.58 | 54.80 | 60.33 | 54.44 | 62.22 | 21.34 | 16.48 |
| Water | 48.24 | 42.68 | 55.34 | 56.55 | 51.73 | 53.21 | 33.98 | 33.83 |
| r.m.s.d. | ||||||||
| Bond lengths (Å) | 0.005 | 0.005 | 0.006 | 0.008 | 0.008 | 0.007 | 0.005 | 0.008 |
| Bond angles (°) | 0.65 | 0.59 | 0.80 | 0.94 | 0.85 | 0.93 | 0.72 | 0.90 |
| ENZYME | SUBSTRATE | KD (µM) | ∆H (kcal mol−1) | ∆S (Cal mol−1 K−1) |
|---|---|---|---|---|
| PvDFRa | NADP+ | 0.18 ± 0.06 | −9.41 ± 0.15 | −0.226 |
| DHQ | 16.87 ± 4.35 | −10.77 ± 0.18 | −13.7 | |
| DHM | 21.23 ± 3.26 | −9.10 ± 2.45 | −9.14 | |
| DHK | 26.42 ± 2.26 | −6.19 ± 5.54 | 0.854 | |
| Eriodictyol | 64.94 ± 11.84 | −6.23 ± 0.28 | −1.74 | |
| Naringenin | 176.9 ± 25.3 | −4.82 ± 0.39 | 0.986 | |
| SbFNR1 | NADP+ | 13.91 ± 2.72 | −1.12 ± 0.72 | −15.4 |
| PvDFRa WT | PvDFRa T143S | PvDFRa Q242A | SbDFR3 | |||||||||
|---|---|---|---|---|---|---|---|---|---|---|---|---|
| Km (µM) | kcat (min−1) | kcat*/Km (µM−1 min−1) | Km (µM) | kcat (min−1) | kcat*/Km (µM−1 min−1) | Km (µM) | kcat (min−1) | kcat*/Km (µM−1 min−1) | Km (µM) | kcat (min−1) | kcat*/Km (µM−1 min−1) | |
| DHQ | 128.6 ± 14.3 | 3.357 ± 0.4065 | 0.02610 | 19.04 ± 11.21 | 1.759 ± 0.2979 | 0.09230 | 156.8 ± 121.41 | 2.571 ± 0.481 | 0.01640 | 166.4 ± 28.8 | 3.795 ± 0.172 | 0.02281 |
| DHM | 150.0 ± 56.9 | 2.261 ± 1.382 | 0.01507 | 7.409 ± 0.2465 | 1.057 ± 0.1153 | 0.1426 | 119.2 ± 87.86 | 2.273 ± 0.134 | 0.01907 | 118.5 ± 0.2885 | 4.640 ± 0.289 | 0.03916 |
| DHK | 191.2 ± 31.4 | 0.7253 ± 0.06364 | 0.003790 | 137.7 ± 36.00 | 0.5737 ± 0.062 | 0.004160 | 74.59 ± 62.70 | 0.4701 ± 0.2679 | 0.006302 | 117.6 ± 22.61 | 0.608 ± 0.511 | 0.00517 |
| Eriodictyol | 246.5 ± 224.1 | 0.8481 ± 0.559 | 0.003441 | 40.73 ± 31.89 | 0.1236 ± 0.011 | 0.00303 | ||||||
| Naringenin | 407.6 ± 223.6 | 3.549 ± 1.444 | 0.008707 | 118.2 ± 14.92 | 2.084 ± 0.087 | 0.01763 | ||||||
Disclaimer/Publisher’s Note: The statements, opinions and data contained in all publications are solely those of the individual author(s) and contributor(s) and not of MDPI and/or the editor(s). MDPI and/or the editor(s) disclaim responsibility for any injury to people or property resulting from any ideas, methods, instructions or products referred to in the content. |
© 2023 by the authors. Licensee MDPI, Basel, Switzerland. This article is an open access article distributed under the terms and conditions of the Creative Commons Attribution (CC BY) license (https://creativecommons.org/licenses/by/4.0/).
Share and Cite
Lewis, J.A.; Zhang, B.; Harza, R.; Palmer, N.; Sarath, G.; Sattler, S.E.; Twigg, P.; Vermerris, W.; Kang, C. Structural Similarities and Overlapping Activities among Dihydroflavonol 4-Reductase, Flavanone 4-Reductase, and Anthocyanidin Reductase Offer Metabolic Flexibility in the Flavonoid Pathway. Int. J. Mol. Sci. 2023, 24, 13901. https://doi.org/10.3390/ijms241813901
Lewis JA, Zhang B, Harza R, Palmer N, Sarath G, Sattler SE, Twigg P, Vermerris W, Kang C. Structural Similarities and Overlapping Activities among Dihydroflavonol 4-Reductase, Flavanone 4-Reductase, and Anthocyanidin Reductase Offer Metabolic Flexibility in the Flavonoid Pathway. International Journal of Molecular Sciences. 2023; 24(18):13901. https://doi.org/10.3390/ijms241813901
Chicago/Turabian StyleLewis, Jacob A., Bixia Zhang, Rishi Harza, Nathan Palmer, Gautam Sarath, Scott E. Sattler, Paul Twigg, Wilfred Vermerris, and ChulHee Kang. 2023. "Structural Similarities and Overlapping Activities among Dihydroflavonol 4-Reductase, Flavanone 4-Reductase, and Anthocyanidin Reductase Offer Metabolic Flexibility in the Flavonoid Pathway" International Journal of Molecular Sciences 24, no. 18: 13901. https://doi.org/10.3390/ijms241813901
APA StyleLewis, J. A., Zhang, B., Harza, R., Palmer, N., Sarath, G., Sattler, S. E., Twigg, P., Vermerris, W., & Kang, C. (2023). Structural Similarities and Overlapping Activities among Dihydroflavonol 4-Reductase, Flavanone 4-Reductase, and Anthocyanidin Reductase Offer Metabolic Flexibility in the Flavonoid Pathway. International Journal of Molecular Sciences, 24(18), 13901. https://doi.org/10.3390/ijms241813901