
Acute Glycemic Control in Prediabetes Individuals Favorably Alters Serum NLRP3 Inflammasome and Related Interleukins

 , , , ,
  and
and 
Abstract
:1. Introduction
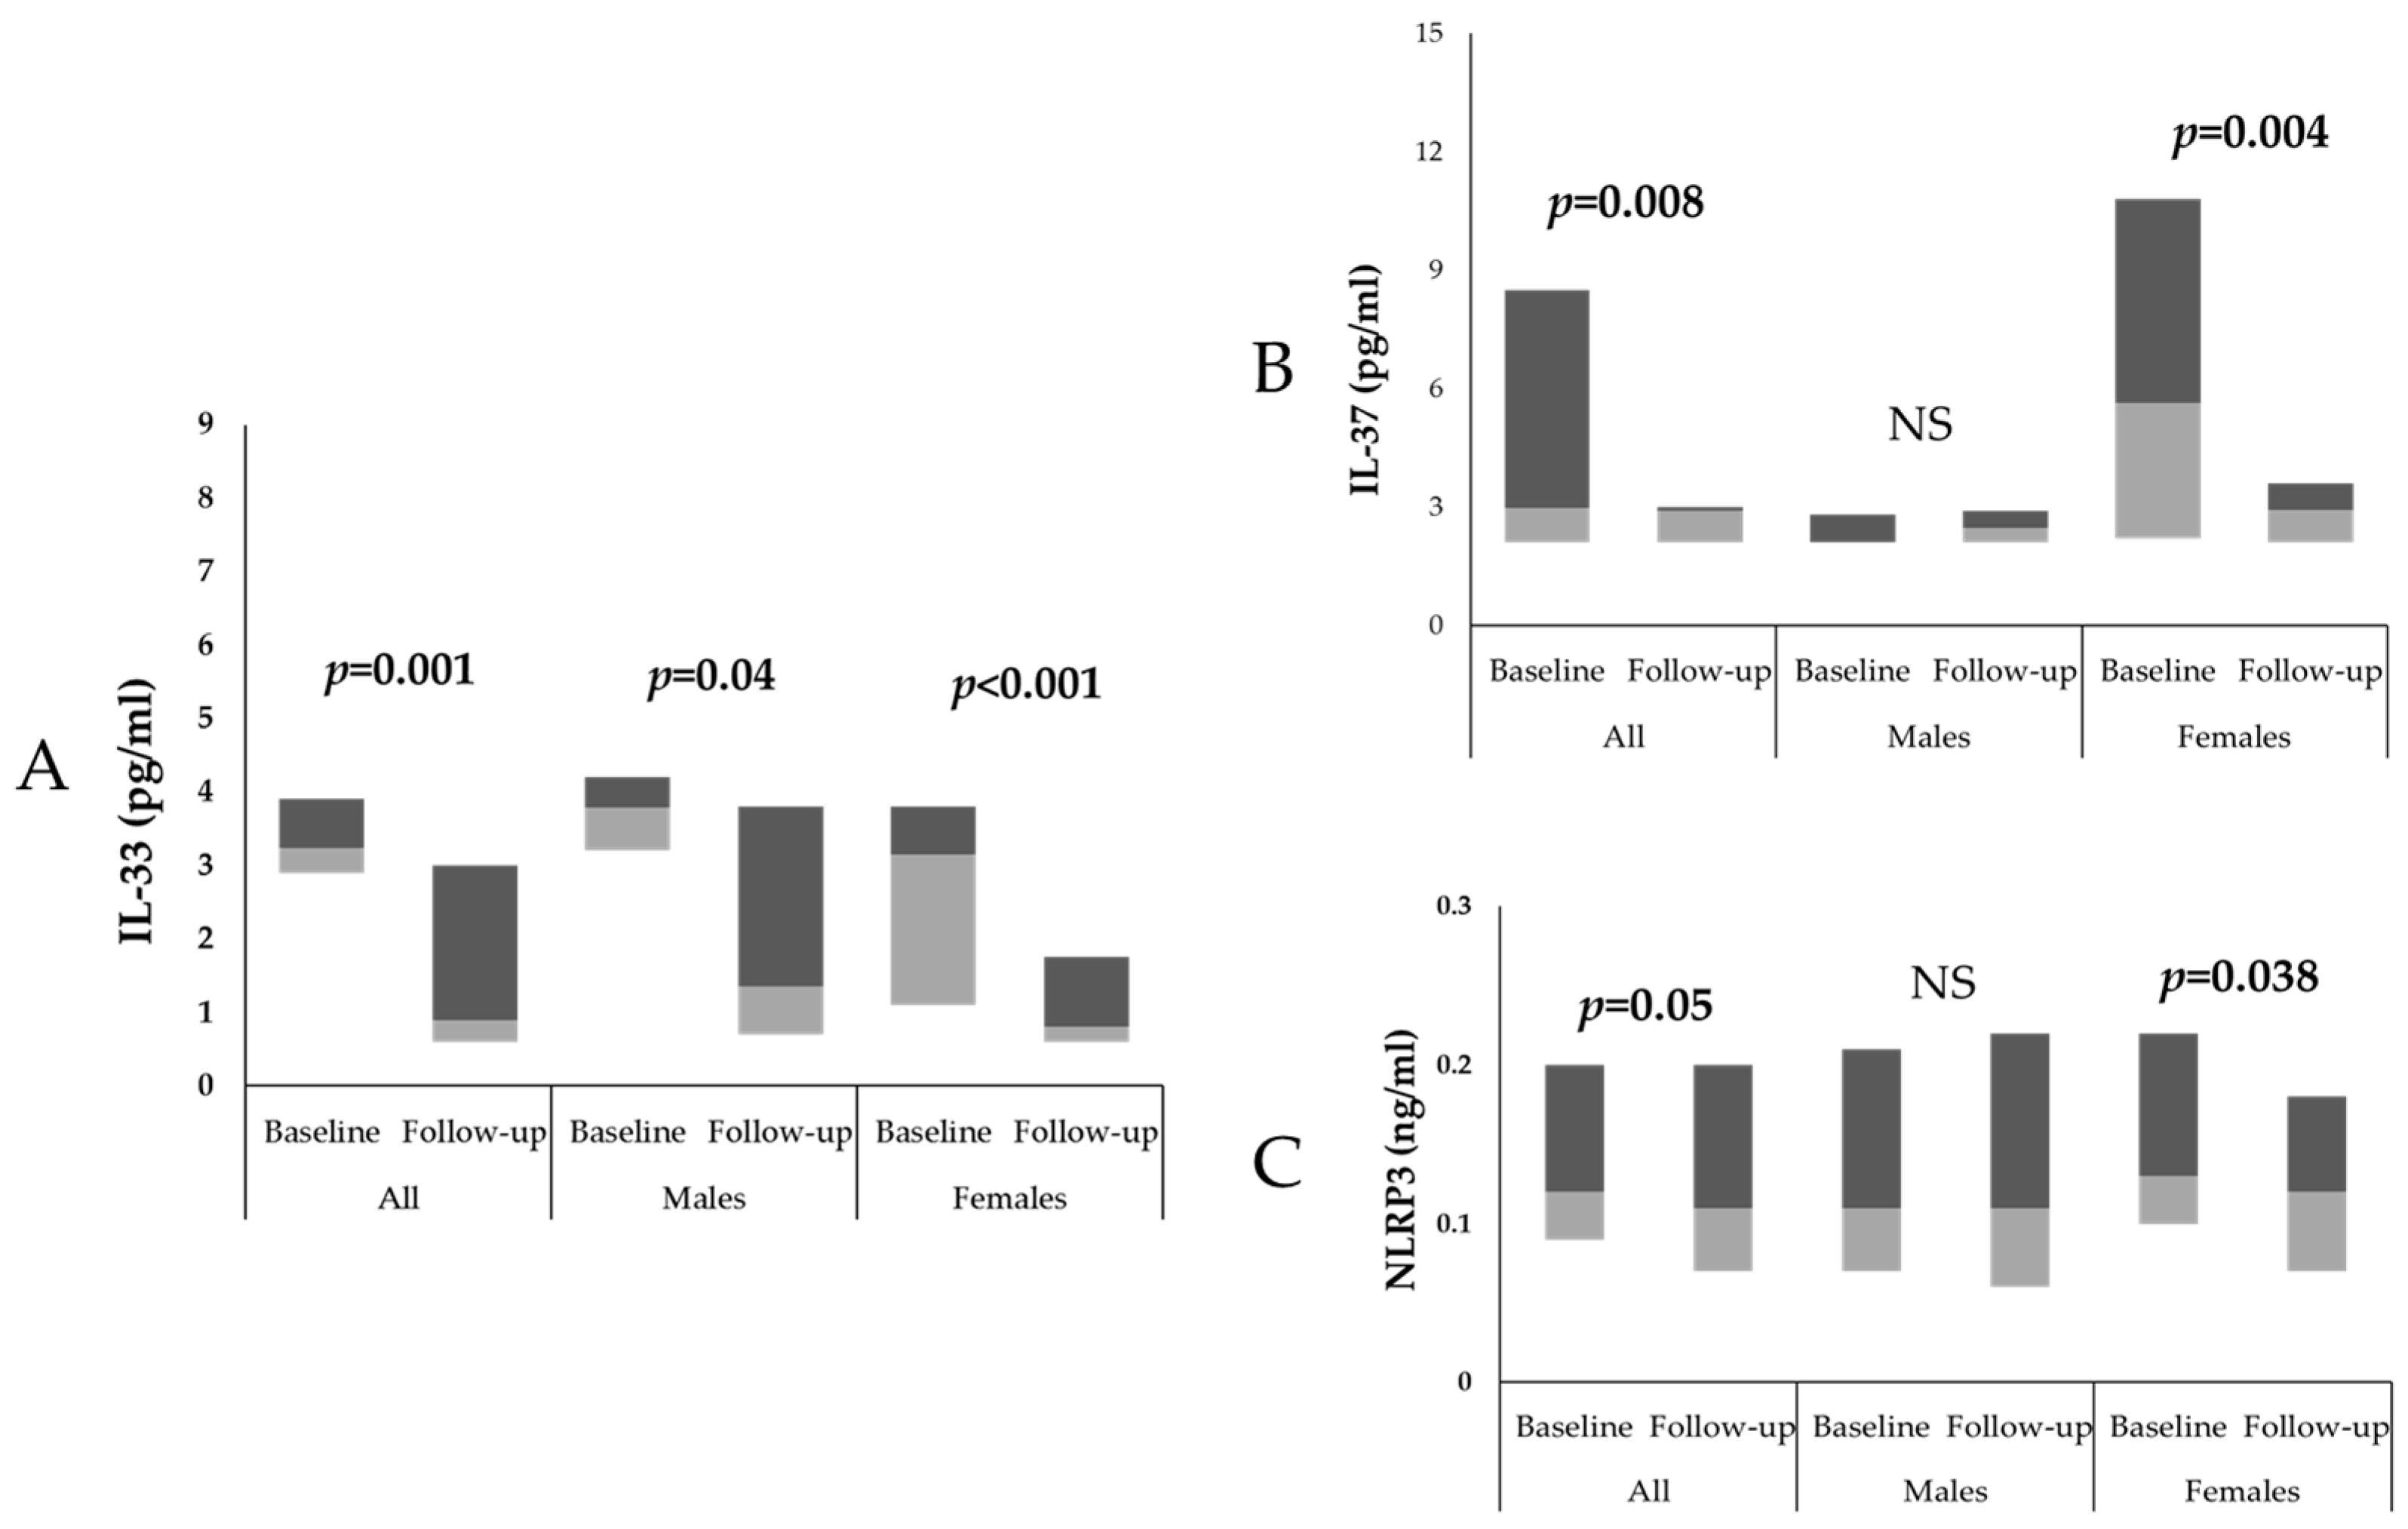
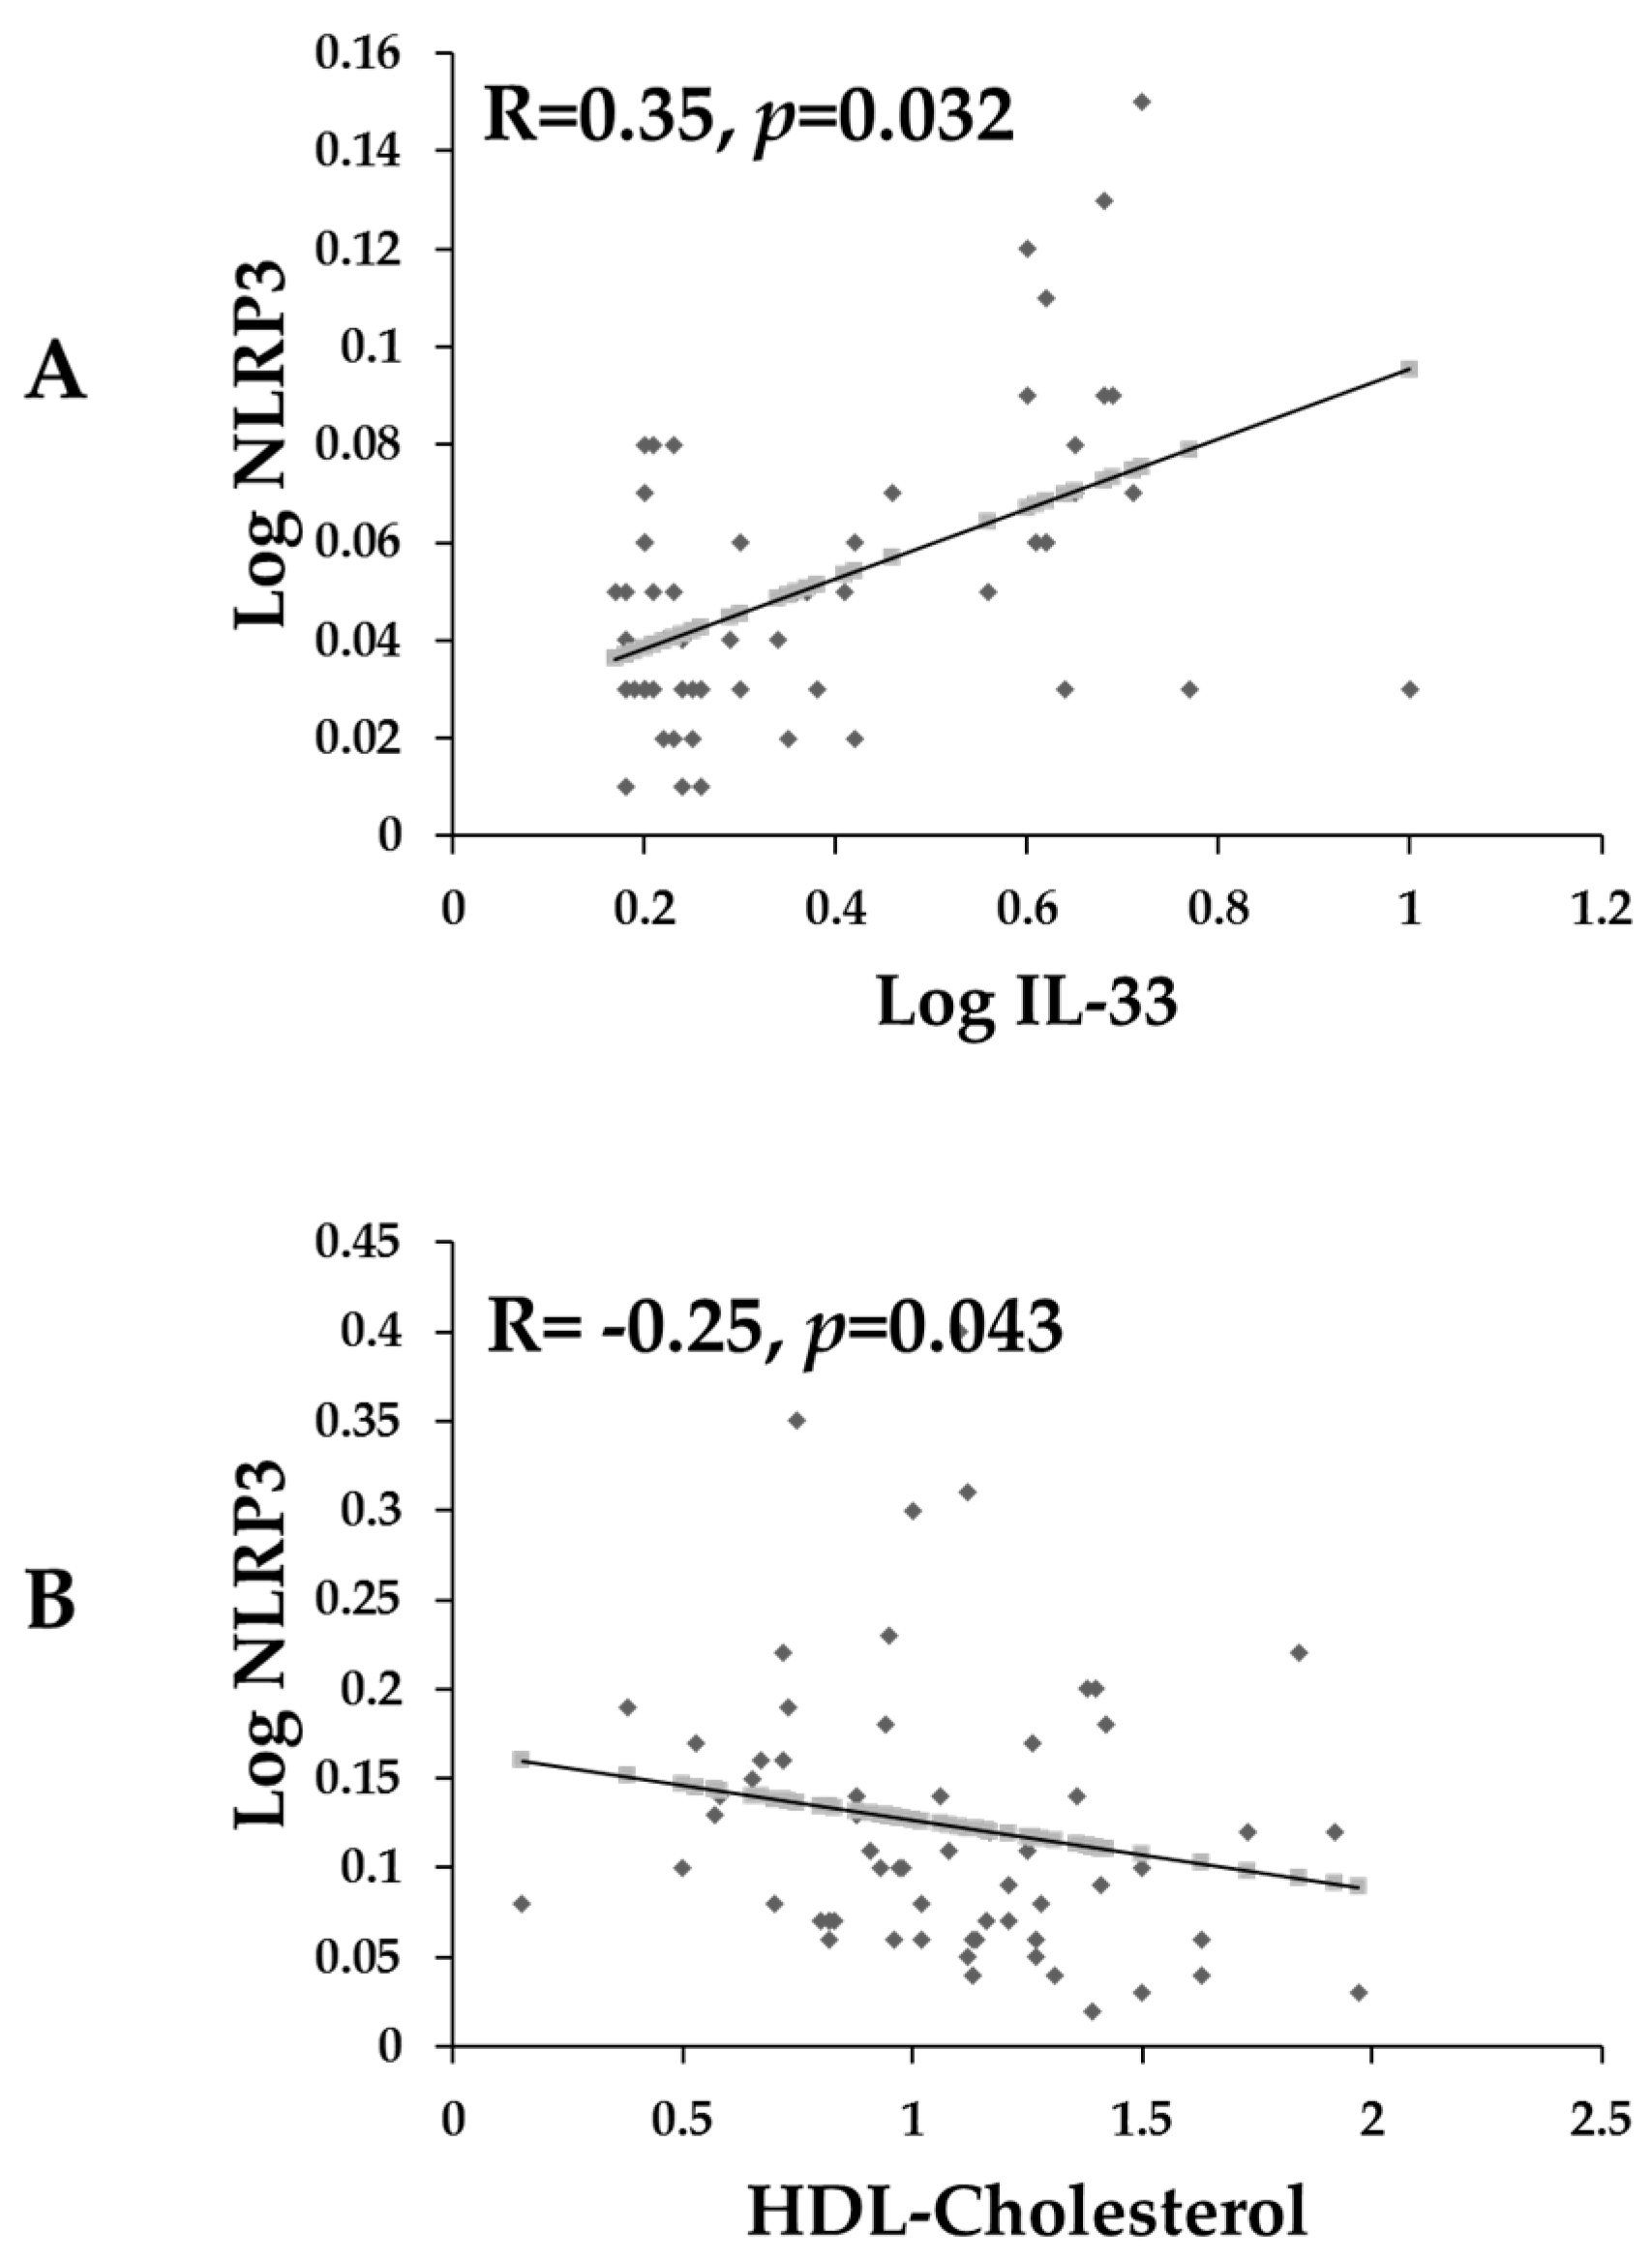
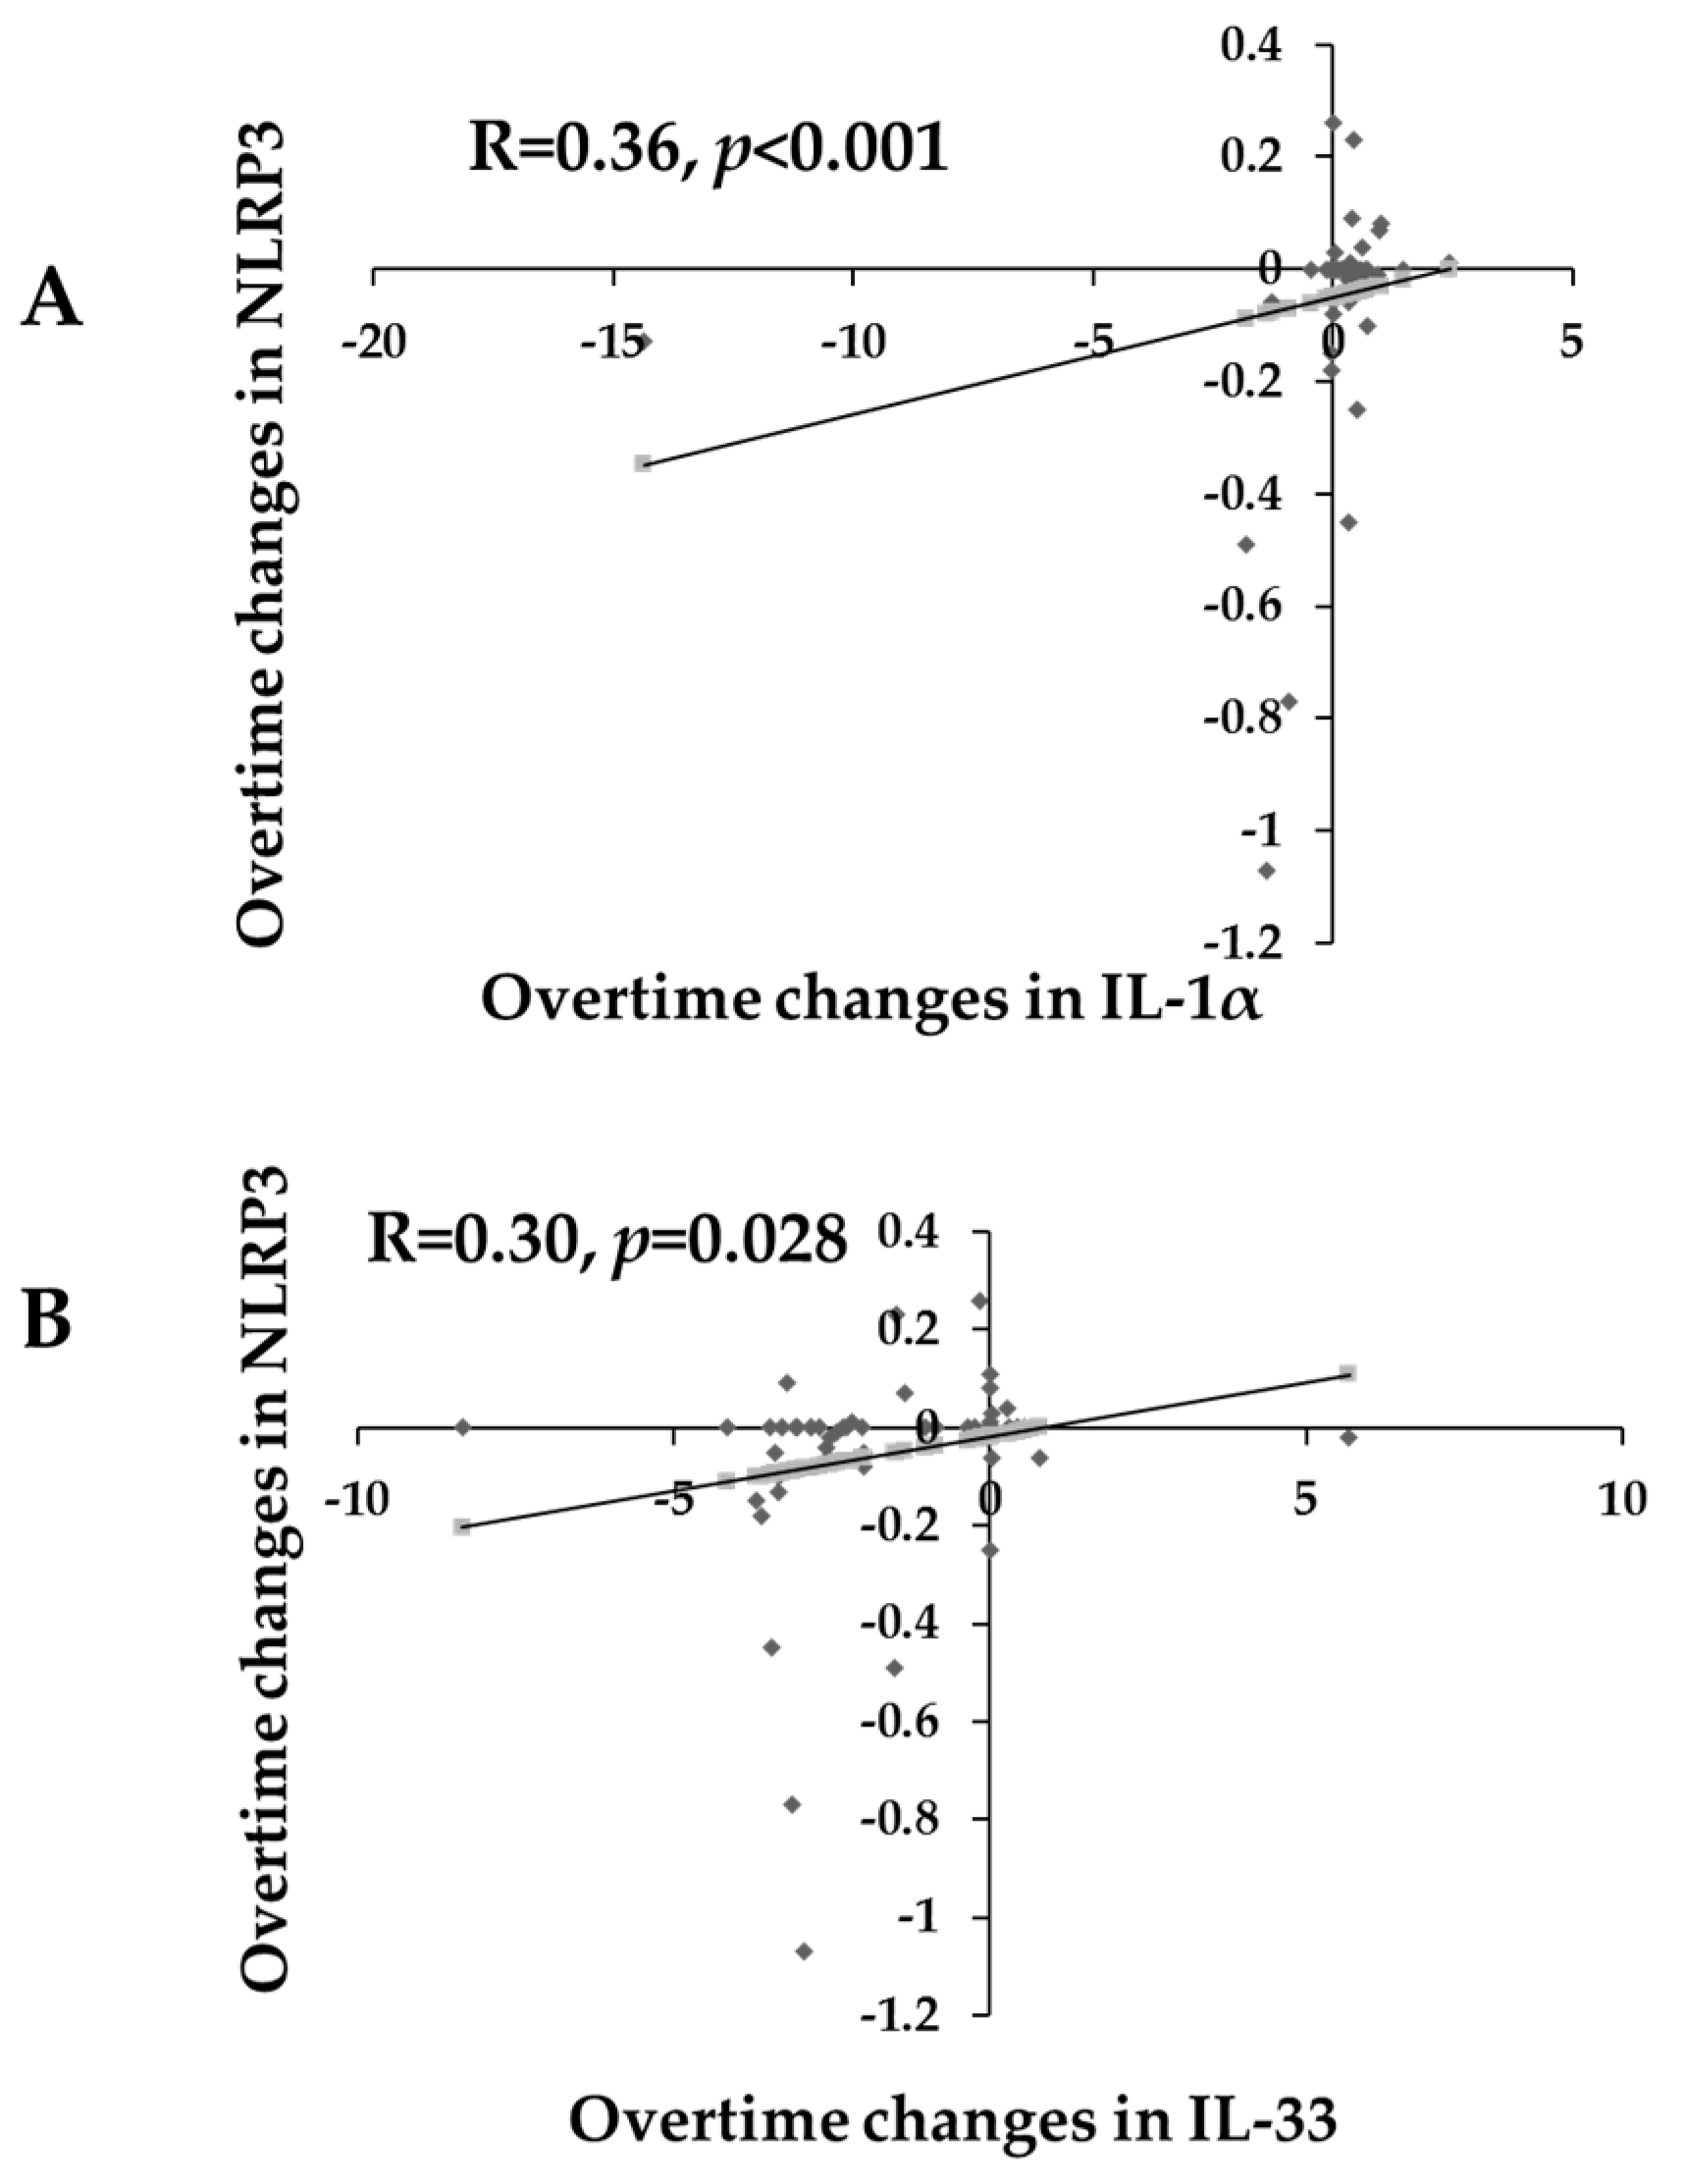
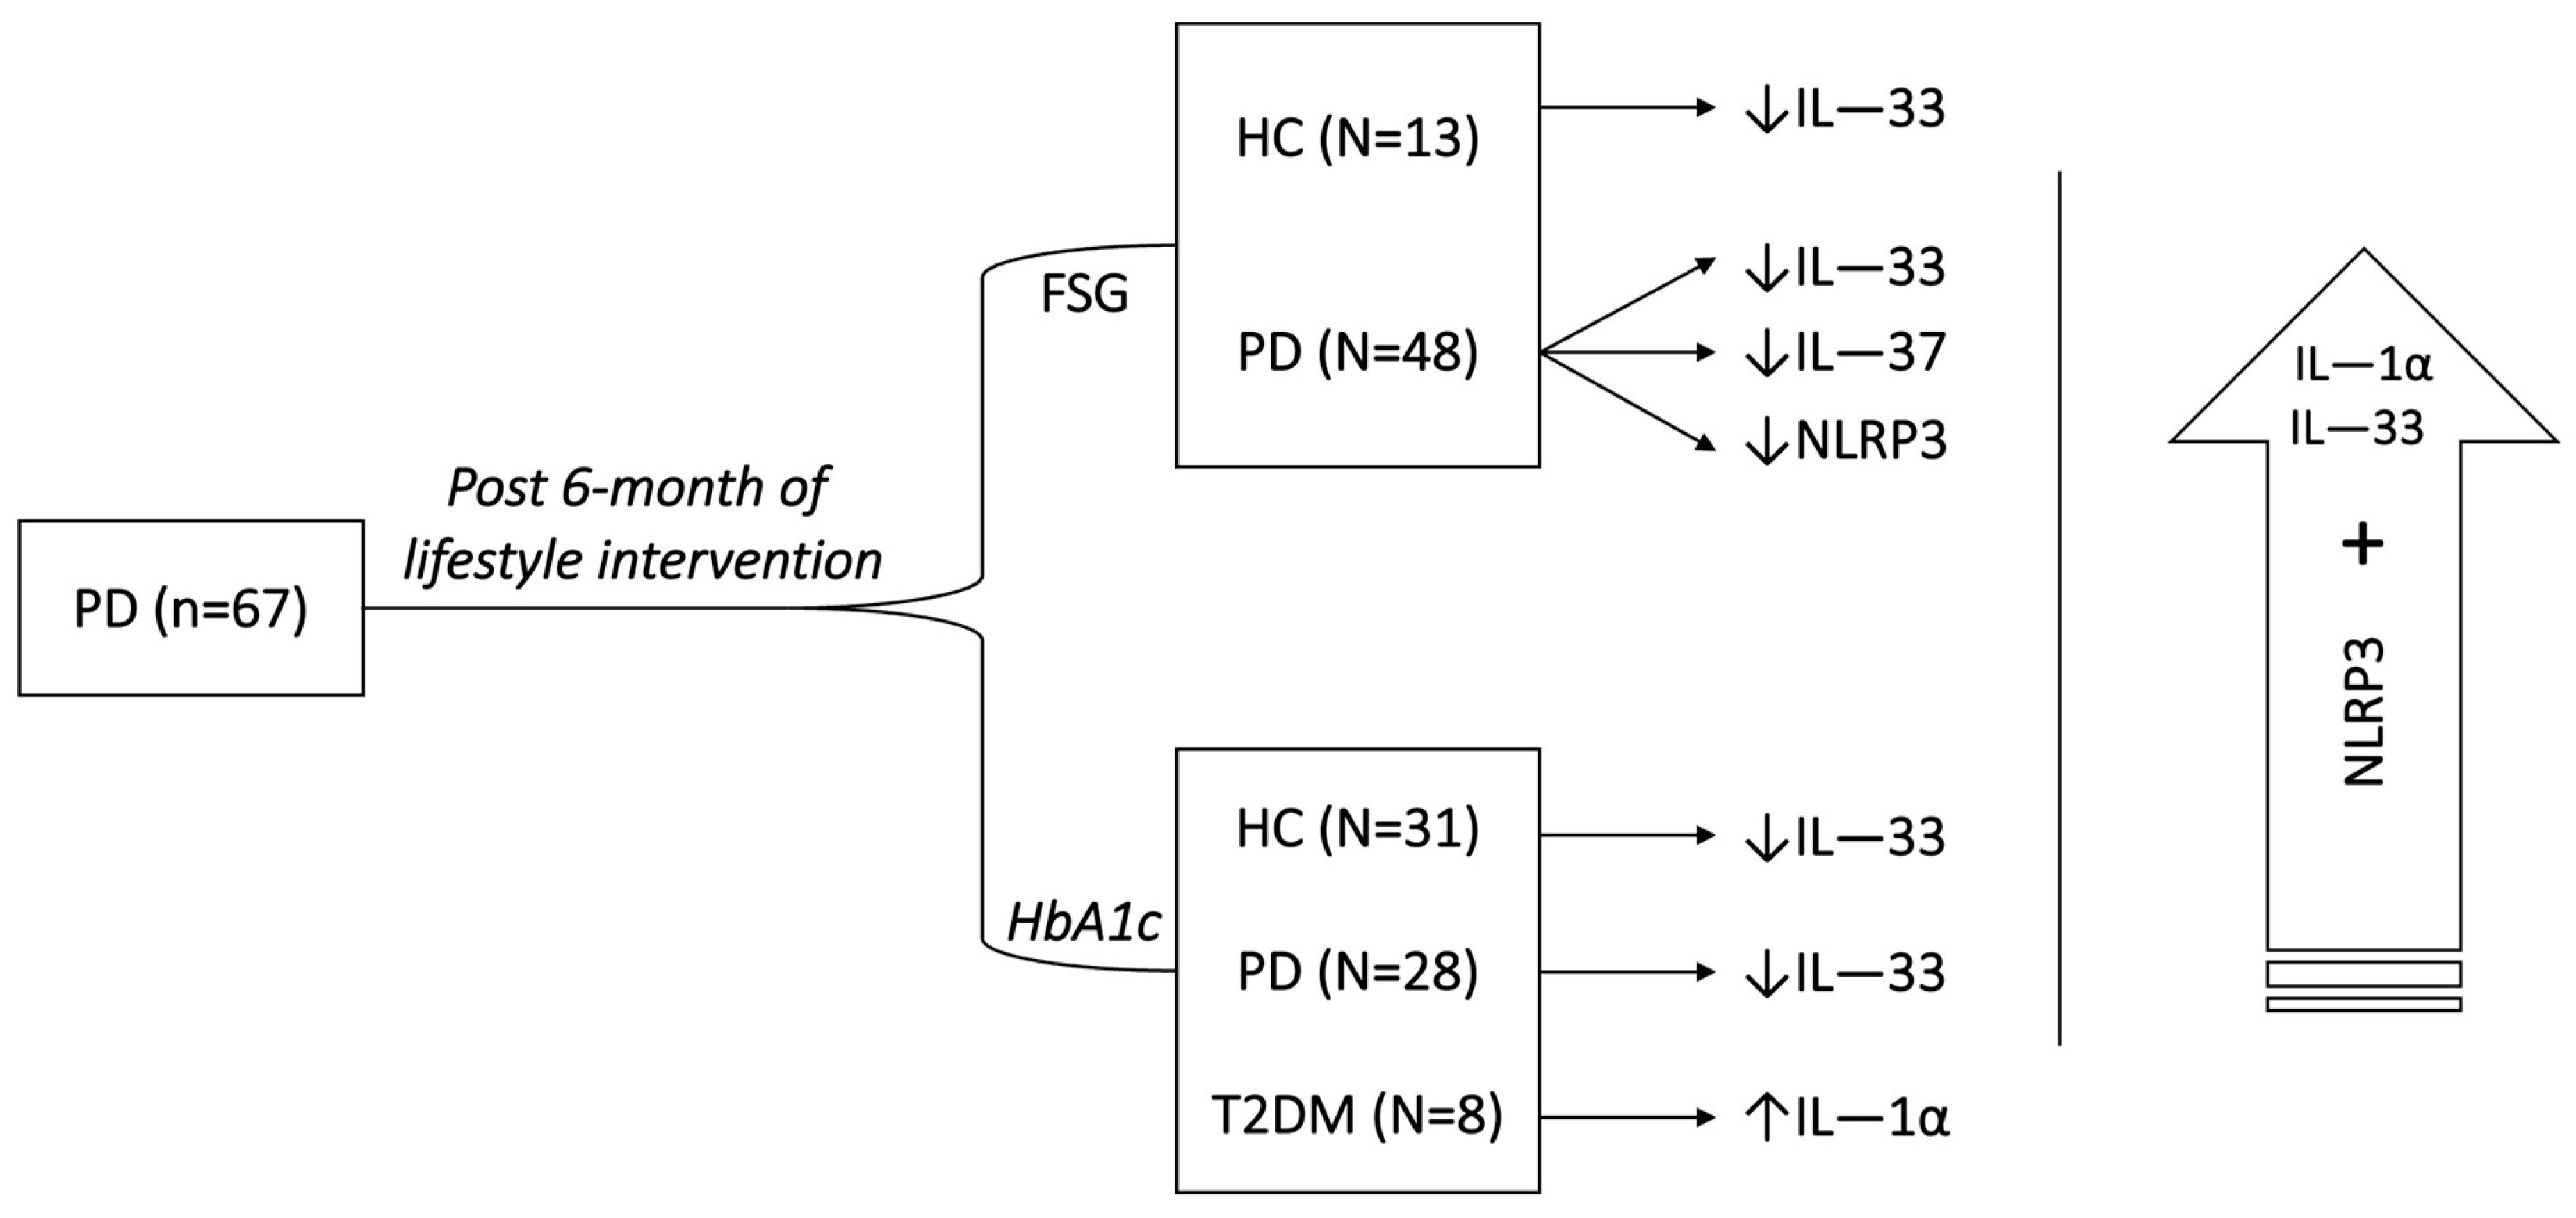
2. Results
3. Discussion
4. Materials and Methods
4.1. Study Design and Participants
4.2. Intervention
4.3. Sample Collection and Anthropometrics
4.4. Biochemical Estimations and Lipid Profile
4.5. Serum NLRP3 Estimation
4.6. Serum IL (1α, 1β, 18, 33 and 37) Estimations
4.7. Data Analysis
Supplementary Materials
Author Contributions
Funding
Institutional Review Board Statement
Informed Consent Statement
Data Availability Statement
Acknowledgments
Conflicts of Interest
References
- Saeedi, P.; Petersohn, I.; Salpea, P.; Malanda, B.; Karuranga, S.; Unwin, N.; Colagiuri, S.; Guariguata, L.; Motala, A.A.; Ogurtsova, K.; et al. Global and regional diabetes prevalence estimates for 2019 and projections for 2030 and 2045: Results from the International Diabetes Federation Diabetes Atlas, 9th edition. Diabetes Res. Clin. Pract. 2019, 157, 107843. [Google Scholar] [CrossRef] [PubMed]
- World Health Organization. Diabetes: Key Facts 2020. Available online: https://www.who.int/news-room/fact-sheets/detail/diabetes#:~:text=People%20with%20diabetes%20have%20a,damage%20and%20poor%20blood%20flow (accessed on 7 August 2023).
- Alomari, A.; Al Hisnah, S. Prevalence of Prediabetes and Associated Risk Factor Assessment among Adults Attending Primary Healthcare Centers in Al Bahah, Saudi Arabia: A Cross-Sectional Study. Cureus 2022, 14, e29465. [Google Scholar] [CrossRef] [PubMed]
- Duan, D.; Kengne, A.P.; Echouffo-Tcheugui, J.B. Screening for Diabetes and Prediabetes. Endocrinol. Metab. Clin. N. Am. 2021, 50, 369–385. [Google Scholar] [CrossRef]
- Echouffo-Tcheugui, J.B.; Selvin, E. Prediabetes and What It Means: The Epidemiological Evidence. Annu. Rev. Public Health 2021, 42, 59–77. [Google Scholar] [CrossRef] [PubMed]
- American Diabetes, A. Standards of Care in Diabetes-2023 Abridged for Primary Care Providers. Clin. Diabetes 2022, 41, 4–31. [Google Scholar] [CrossRef]
- Amer, O.E.; Sabico, S.; Alfawaz, H.A.; Aljohani, N.; Hussain, S.D.; Alnaami, A.M.; Wani, K.; Al-Daghri, N.M. Reversal of Prediabetes in Saudi Adults: Results from an 18 Month Lifestyle Intervention. Nutrients 2020, 12, 804. [Google Scholar] [CrossRef] [PubMed]
- Hallberg, S.J.; Gershuni, V.M.; Hazbun, T.L.; Athinarayanan, S.J. Reversing Type 2 Diabetes: A Narrative Review of the Evidence. Nutrients 2019, 11, 766. [Google Scholar] [CrossRef]
- Shibib, L.; Al-Qaisi, M.; Ahmed, A.; Miras, A.D.; Nott, D.; Pelling, M.; Greenwald, S.E.; Guess, N. Reversal and Remission of T2DM—An Update for Practitioners. Vasc. Health Risk Manag. 2022, 18, 417–443. [Google Scholar] [CrossRef]
- Huang, Y.; Cai, X.; Mai, W.; Li, M.; Hu, Y. Association between prediabetes and risk of cardiovascular disease and all cause mortality: Systematic review and meta-analysis. BMJ 2016, 355, i5953. [Google Scholar] [CrossRef]
- Liu, C.; Foti, K.; Grams, M.E.; Shin, J.I.; Selvin, E. Trends in Self-reported Prediabetes and Metformin Use in the USA: NHANES 2005–2014. J. Gen. Intern. Med. 2020, 35, 95–101. [Google Scholar] [CrossRef]
- Choe, S.S.; Huh, J.Y.; Hwang, I.J.; Kim, J.I.; Kim, J.B. Adipose Tissue Remodeling: Its Role in Energy Metabolism and Metabolic Disorders. Front. Endocrinol. 2016, 7, 30. [Google Scholar] [CrossRef] [PubMed]
- Wani, K.; AlHarthi, H.; Alghamdi, A.; Sabico, S.; Al-Daghri, N.M. Role of NLRP3 Inflammasome Activation in Obesity-Mediated Metabolic Disorders. Int. J. Environ. Res. Public Health 2021, 18, 511. [Google Scholar] [CrossRef]
- Brahimaj, A.; Ligthart, S.; Ghanbari, M.; Ikram, M.A.; Hofman, A.; Franco, O.H.; Kavousi, M.; Dehghan, A. Novel inflammatory markers for incident pre-diabetes and type 2 diabetes: The Rotterdam Study. Eur. J. Epidemiol. 2017, 32, 217–226. [Google Scholar] [CrossRef] [PubMed]
- Grossmann, V.; Schmitt, V.H.; Zeller, T.; Panova-Noeva, M.; Schulz, A.; Laubert-Reh, D.; Juenger, C.; Schnabel, R.B.; Abt, T.G.; Laskowski, R.; et al. Profile of the Immune and Inflammatory Response in Individuals with Prediabetes and Type 2 Diabetes. Diabetes Care 2015, 38, 1356–1364. [Google Scholar] [CrossRef] [PubMed]
- Huang, Z.; Chen, C.; Li, S.; Kong, F.; Shan, P.; Huang, W. Serum Markers of Endothelial Dysfunction and Inflammation Increase in Hypertension with Prediabetes Mellitus. Genet. Test. Mol. Biomark. 2016, 20, 322–327. [Google Scholar] [CrossRef]
- Herder, C.; Carstensen, M.; Ouwens, D.M. Anti-inflammatory cytokines and risk of type 2 diabetes. Diabetes Obes. Metab. 2013, 15 (Suppl. 3), 39–50. [Google Scholar] [CrossRef]
- Luc, K.; Schramm-Luc, A.; Guzik, T.J.; Mikolajczyk, T.P. Oxidative stress and inflammatory markers in prediabetes and diabetes. J. Physiol. Pharmacol. 2019, 70, 809–824. [Google Scholar] [CrossRef]
- Nishida, K.; Otsu, K. Inflammation and metabolic cardiomyopathy. Cardiovasc. Res. 2017, 113, 389–398. [Google Scholar] [CrossRef]
- Wang, W.K.; Wang, B.; Lu, Q.H.; Zhang, W.; Qin, W.D.; Liu, X.J.; Liu, X.Q.; An, F.S.; Zhang, Y.; Zhang, M.X. Inhibition of high-mobility group box 1 improves myocardial fibrosis and dysfunction in diabetic cardiomyopathy. Int. J. Cardiol. 2014, 172, 202–212. [Google Scholar] [CrossRef]
- Golden, T.N.; Simmons, R.A. Immune dysfunction in developmental programming of type 2 diabetes mellitus. Nat. Rev. Endocrinol. 2021, 17, 235–245. [Google Scholar] [CrossRef]
- Martinon, F.; Burns, K.; Tschopp, J. The inflammasome: A molecular platform triggering activation of inflammatory caspases and processing of proIL-beta. Mol. Cell 2002, 10, 417–426. [Google Scholar] [CrossRef] [PubMed]
- Kuo, C.Y.-J.; Maran, J.J.; Jamieson, E.G.; Rupenthal, I.D.; Murphy, R.; Mugisho, O.O. Characterization of NLRP3 Inflammasome Activation in the Onset of Diabetic Retinopathy. Int. J. Mol. Sci. 2022, 23, 14471. [Google Scholar] [CrossRef] [PubMed]
- Alfadul, H.; Sabico, S.; Al-Daghri, N.M. The role of interleukin-1beta in type 2 diabetes mellitus: A systematic review and meta-analysis. Front. Endocrinol. 2022, 13, 901616. [Google Scholar] [CrossRef] [PubMed]
- Zhang, T.; Tian, J.; Fan, J.; Liu, X.; Wang, R. Exercise training-attenuated insulin resistance and liver injury in elderly pre-diabetic patients correlates with NLRP3 inflammasome. Front. Immunol. 2023, 14, 1082050. [Google Scholar] [CrossRef] [PubMed]
- Brannick, B.; Dagogo-Jack, S. Prediabetes and Cardiovascular Disease: Pathophysiology and Interventions for Prevention and Risk Reduction. Endocrinol. Metab. Clin. N. Am. 2018, 47, 33–50. [Google Scholar] [CrossRef]
- Colagiuri, S. Epidemiology of prediabetes. Med. Clin. N. Am. 2011, 95, 299–307. [Google Scholar] [CrossRef] [PubMed]
- Glechner, A.; Keuchel, L.; Affengruber, L.; Titscher, V.; Sommer, I.; Matyas, N.; Wagner, G.; Kien, C.; Klerings, I.; Gartlehner, G. Effects of lifestyle changes on adults with prediabetes: A systematic review and meta-analysis. Prim. Care Diabetes 2018, 12, 393–408. [Google Scholar] [CrossRef] [PubMed]
- Glechner, A.; Harreiter, J.; Gartlehner, G.; Rohleder, S.; Kautzky, A.; Tuomilehto, J.; Van Noord, M.; Kaminski-Hartenthaler, A.; Kautzky-Willer, A. Sex-specific differences in diabetes prevention: A systematic review and meta-analysis. Diabetologia 2015, 58, 242–254. [Google Scholar] [CrossRef] [PubMed]
- Miller, R.G.; Orchard, T.J. Understanding Metabolic Memory: A Tale of Two Studies. Diabetes 2020, 69, 291–299. [Google Scholar] [CrossRef]
- Alfadul, H.; Sabico, S.; Ansari, M.G.A.; Alnaami, A.M.; Amer, O.E.; Hussain, S.D.; Wani, K.; Khattak, M.N.K.; Clerici, M.; Al-Daghri, N.M. Differences and Associations of NLRP3 Inflammasome Levels with Interleukins 1α, 1β, 33 and 37 in Adults with Prediabetes and Type 2 Diabetes Mellitus. Biomedicines 2023, 11, 1315. [Google Scholar] [CrossRef]
- Legiawati, L.; Bramono, K.; Indriatmi, W.; Yunir, E.; Setiati, S.; Jusman, S.W.A.; Purwaningsih, E.H.; Wibowo, H.; Danarti, R. Oral and Topical Centella asiatica in Type 2 Diabetes Mellitus Patients with Dry Skin: A Three-Arm Prospective Randomized Double-Blind Controlled Trial. Evid. Based Complement. Altern. Med. 2020, 2020, 7253560. [Google Scholar] [CrossRef] [PubMed]
- Khalil, M.; El-Badawy, O.; Sharaf-Eldin, A.; Sadek, A.; Sabry, A. Serum levels of Interleukins 1-Alpha & 12 as Predictors of Disease Progression in Hepatitis C Diabetic Patients. Egypt. J. Immunol. 2018, 25, 181–190. [Google Scholar] [PubMed]
- Mirhafez, S.R.; Pasdar, A.; Avan, A.; Esmaily, H.; Moezzi, A.; Mohebati, M.; Meshkat, Z.; Mehrad-Majd, H.; Eslami, S.; Rahimi, H.R.; et al. Cytokine and growth factor profiling in patients with the metabolic syndrome. Br. J. Nutr. 2015, 113, 1911–1919. [Google Scholar] [CrossRef]
- Cantuaria, A.P.C.; Figueiredo, T.M.; Freire, M.S.; Lima, S.M.F.; Almeida, J.A.; Franco, O.L.; Rezende, T.M.B. The effects of glucose concentrations associated with lipopolysaccharide and interferon-gamma stimulus on mediators’ production of RAW 264.7 cells. Cytokine 2018, 107, 18–25. [Google Scholar] [CrossRef]
- Stankovic, M.; Ljujic, B.; Babic, S.; Maravic-Stojkovic, V.; Mitrovic, S.; Arsenijevic, N.; Radak, D.; Pejnovic, N.; Lukic, M.L. IL-33/IL-33R in various types of carotid artery atherosclerotic lesions. Cytokine 2019, 120, 242–250. [Google Scholar] [CrossRef]
- Fan, W.; Kang, W.; Li, T.; Luo, D.; Huang, L.; Yang, Y.; Sun, Y. Interleukin-33 and its receptor soluble suppression of tumorigenicity 2 in the diagnosis of gestational diabetes mellitus. Int. J. Clin. Pract. 2021, 75, e14944. [Google Scholar] [CrossRef] [PubMed]
- Hasan, A.; Kochumon, S.; Al-Ozairi, E.; Tuomilehto, J.; Ahmad, R. Association between Adipose Tissue Interleukin-33 and Immunometabolic Markers in Individuals with Varying Degrees of Glycemia. Dis. Markers 2019, 2019, 7901062. [Google Scholar] [CrossRef]
- Gora, I.M.; Ciechanowska, A.; Ladyzynski, P. NLRP3 Inflammasome at the Interface of Inflammation, Endothelial Dysfunction, and Type 2 Diabetes. Cells 2021, 10, 314. [Google Scholar] [CrossRef]
- Jiang, D.; Chen, S.; Sun, R.; Zhang, X.; Wang, D. The NLRP3 inflammasome: Role in metabolic disorders and regulation by metabolic pathways. Cancer Lett. 2018, 419, 8–19. [Google Scholar] [CrossRef]
- Abderrazak, A.; Syrovets, T.; Couchie, D.; El Hadri, K.; Friguet, B.; Simmet, T.; Rouis, M. NLRP3 inflammasome: From a danger signal sensor to a regulatory node of oxidative stress and inflammatory diseases. Redox Biol. 2015, 4, 296–307. [Google Scholar] [CrossRef]
- Al-Daghri, N.M.; Wani, K.; AlHarthi, H.; Alghamdi, A.; Alnaami, A.M.; Yakout, S.M. Sex-Specific Signature in the Circulating NLRP3 Levels of Saudi Adults with Metabolic Syndrome. J. Clin. Med. 2021, 10, 3288. [Google Scholar] [CrossRef] [PubMed]
- Huang, W.; Wang, X.; Xie, F.; Zhang, H.; Liu, D. Serum NLRP3: A biomarker for identifying high-risk septic patients. Cytokine 2022, 149, 155725. [Google Scholar] [CrossRef] [PubMed]
- Grebe, A.; Hoss, F.; Latz, E. NLRP3 Inflammasome and the IL-1 Pathway in Atherosclerosis. Circ. Res. 2018, 122, 1722–1740. [Google Scholar] [CrossRef] [PubMed]
- Gross, O.; Yazdi, A.S.; Thomas, C.J.; Masin, M.; Heinz, L.X.; Guarda, G.; Quadroni, M.; Drexler, S.K.; Tschopp, J. Inflammasome activators induce interleukin-1alpha secretion via distinct pathways with differential requirement for the protease function of caspase-1. Immunity 2012, 36, 388–400. [Google Scholar] [CrossRef] [PubMed]
- Fettelschoss, A.; Kistowska, M.; LeibundGut-Landmann, S.; Beer, H.D.; Johansen, P.; Senti, G.; Contassot, E.; Bachmann, M.F.; French, L.E.; Oxenius, A.; et al. Inflammasome activation and IL-1beta target IL-1alpha for secretion as opposed to surface expression. Proc. Natl. Acad. Sci. USA 2011, 108, 18055–18060. [Google Scholar] [CrossRef]
- Yazdi, A.S.; Drexler, S.K. Regulation of interleukin 1alpha secretion by inflammasomes. Ann. Rheum. Dis. 2013, 72 (Suppl. 2), ii96–ii99. [Google Scholar] [CrossRef]
- Salti, T.; Khazim, K.; Haddad, R.; Campisi-Pinto, S.; Bar-Sela, G.; Cohen, I. Glucose Induces IL-1alpha-Dependent Inflammation and Extracellular Matrix Proteins Expression and Deposition in Renal Tubular Epithelial Cells in Diabetic Kidney Disease. Front. Immunol. 2020, 11, 1270. [Google Scholar] [CrossRef] [PubMed]
- Schunk, S.J.; Triem, S.; Schmit, D.; Zewinger, S.; Sarakpi, T.; Becker, E.; Hutter, G.; Wrublewsky, S.; Kuting, F.; Hohl, M.; et al. Interleukin-1alpha Is a Central Regulator of Leukocyte-Endothelial Adhesion in Myocardial Infarction and in Chronic Kidney Disease. Circulation 2021, 144, 893–908. [Google Scholar] [CrossRef]
- Hasan, A.; Al-Ghimlas, F.; Warsame, S.; Al-Hubail, A.; Ahmad, R.; Bennakhi, A.; Al-Arouj, M.; Behbehani, K.; Dehbi, M.; Dermime, S. IL-33 is negatively associated with the BMI and confers a protective lipid/metabolic profile in non-diabetic but not diabetic subjects. BMC Immunol. 2014, 15, 19. [Google Scholar] [CrossRef]
- Larsen, K.M.; Minaya, M.K.; Vaish, V.; Pena, M.M.O. The Role of IL-33/ST2 Pathway in Tumorigenesis. Int. J. Mol. Sci. 2018, 19, 2676. [Google Scholar] [CrossRef]
- de Koning, L.; Liptak, C.; Shkreta, A.; Bradwin, G.; Hu, F.B.; Pradhan, A.D.; Rifai, N.; Kellogg, M.D. A multiplex immunoassay gives different results than singleplex immunoassays which may bias epidemiologic associations. Clin. Biochem. 2012, 45, 848–851. [Google Scholar] [CrossRef] [PubMed]
- Tighe, P.J.; Ryder, R.R.; Todd, I.; Fairclough, L.C. ELISA in the multiplex era: Potentials and pitfalls. Proteom. Clin. Appl. 2015, 9, 406–422. [Google Scholar] [CrossRef] [PubMed]
- Marathe, P.H.; Gao, H.X.; Close, K.L. American Diabetes Association Standards of Medical Care in Diabetes 2017. J. Diabetes 2017, 9, 320–324. [Google Scholar] [CrossRef] [PubMed]
- Al-Hamdan, R.; Avery, A.; Al-Disi, D.; Sabico, S.; Al-Daghri, N.M.; McCullough, F. Efficacy of lifestyle intervention program for Arab women with prediabetes using social media as an alternative platform of delivery. J. Diabetes Investig. 2021, 12, 1872–1880. [Google Scholar] [CrossRef] [PubMed]
- Wani, K.; Alfawaz, H.; Alnaami, A.M.; Sabico, S.; Khattak, M.N.K.; Al-Attas, O.; Alokail, M.S.; Alharbi, M.; Chrousos, G.; Kumar, S.; et al. Effects of A 12-Month Intensive Lifestyle Monitoring Program in Predominantly Overweight/Obese Arab Adults with Prediabetes. Nutrients 2020, 12, 464. [Google Scholar] [CrossRef] [PubMed]


| (A) FSG | |||||||||
|---|---|---|---|---|---|---|---|---|---|
| Parameters | Control | PD | T2DM | ||||||
| Baseline | Follow-Up | p-Value | Baseline | Follow-Up | p-Value | Baseline | Follow-Up | p-Value | |
| N (M/F) | 13 (5/8) | 48 (12/36) | 6 (3/3) | ||||||
| Age (years) | 38.5 ± 6.2 | 43.1 ± 7.9 | 39.5 ± 11.2 | ||||||
| Weight (kg) | 80.1 ± 19.1 | 80.4 ± 20.1 | 0.9 | 83.0 ± 13.7 | 82.6 ± 14.2 | 0.4 | 84.9 ± 3.7 | 82.9 ± 3.9 | 0.4 |
| BMI (kg/m2) | 30.8 ± 6.4 | 30.9 ± 6.9 | 0.9 | 33.7 ± 5.4 | 33.6 ± 5.7 | 0.5 | 33.0 ± 1.8 | 32.1 ± 3.5 | 0.4 |
| Waist (cm) | 90.8 ± 11.9 | 90.4 ± 10.9 | 0.7 | 96.2 ± 11.8 | 96.2 ± 11.9 | 1.0 | 97.6 ± 19.2 | 100.2 ± 13.9 | 0.5 |
| Hips (cm) | 105.8 ± 9.6 | 106.7 ± 13.3 | 0.3 | 111.7 ± 9.1 | 110.9 ± 8.7 | 0.1 | 116.2 ± 3.3 | 108.0 ± 11.5 | 0.3 |
| WHR | 0.9 ± 0.03 | 0.9 ± 0.04 | 0.3 | 0.9 ± 0.1 | 0.9 ± 0.1 | 0.2 | 0.8 ± 0.2 | 0.9 ± 0.1 | 0.3 |
| SBP (mmHg) | 122.5 ± 10.5 | 118.9 ± 8.2 | 0.3 | 121.5 ± 15.7 | 118.7 ± 13.4 | 0.2 | 126.0 ± 11.6 | 131.8 ± 12.5 | 0.1 |
| DBP (mmHg) | 74.0 ± 10.2 | 71.5 ± 10.6 | 0.4 | 77.7 ± 10.9 | 75.7 ± 10.9 | 0.2 | 77.0 ± 16.0 | 74.8 ± 12.5 | 0.5 |
| Glucose (mmol/L) | 6.0 ± 0.3 | 4.6 ± 1.0 | <0.01 | 5.9 ± 0.3 | 6.0 ± 0.3 | 0.047 | 6.1 ± 0.3 | 8.8 ± 1.2 | 0.002 |
| HbA1c (%) | 5.8 ± 0.3 | 5.8 ± 0.8 | 0.8 | 5.5 ± 0.5 | 5.7 ± 1.3 | 0.3 | 5.7 ± 0.4 | 6.5 ± 1.3 | 0.2 |
| Insulin (uU/mL) | 17.7 ± 5.5 | 18.4 ± 6.8 | 0.3 | 16.2 ± 5.1 | 15.6 ± 5.0 | 0.005 | 17.8 ± 2.6 | 17.3 ± 2.1 | 0.4 |
| TC (mmol/L) | 4.8 ± 0.8 | 4.7 ± 1.1 | 0.9 | 4.9 ± 1.0 | 5.0 ± 1.2 | 0.5 | 4.1 ± 0.9 | 4.5 ± 0.8 | 0.1 |
| HDL-C (mmol/L) | 1.0 ± 0.2 | 1.1 ± 0.32 | 0.1 | 1.1 ± 0.3 | 1.1 ± 0.4 | 0.8 | 1.0 ± 0.3 | 1.0 ± 0.3 | 0.9 |
| TG (mmol/L) | 1.3 (0.9–2.1) | 1.3 (1.0–2.2) | 0.9 | 1.6 (1.1–2.4) | 1.6 (1.2–2.4) | 0.8 | 1.0 (0.8–1.6) | 1.4 (1.0–2.0) | 0.046 |
| (B) HbA1c | |||||||||
| N (M/F) | 31 (7/24) | 28 (9/19) | 8 (4/4) | ||||||
| Age (years) | 41.7 ± 8.2 | 42.1 ± 7.3 | 41.8 ± 10.7 | ||||||
| Weight (kg) | 81.3 ± 15.9 | 80.0 ± 16.4 | 0.02 | 82.0 ± 11.7 | 82.2 ± 122 | 0.9 | 89.6 ± 14.1 | 90.5 ± 15.8 | 0.7 |
| BMI (kg/m2) | 32.8 ± 6.6 | 32.3 ± 6.6 | 0.02 | 33.2 ± 3.2 | 33.3 ± 3.9 | 0.8 | 34.4 ± 6.9 | 34.8 ± 7.9 | 0.6 |
| Waist (cm) | 98.4 ± 14.7 | 97.4 ± 15.1 | 0.1 | 93.4 ± 7.5 | 94.2 ± 8.3 | 0.5 | 89.6 ± 9.1 | 91.9 ± 6.2 | 0.2 |
| Hips (cm) | 113.0 ± 12.4 | 111.7 ± 12.3 | 0.1 | 108.7 ± 5.3 | 108.7 ± 5.3 | 1.0 | 110.5 ± 6.7 | 107 ± 9.4 | 0.4 |
| WHR | 0.9 ± 0.1 | 0.87 ± 0.1 | 0.7 | 0.9 ± 0.1 | 0.87 ± 0.1 | 0.5 | 0.8 ± 0.1 | 0.86 ± 0.03 | 0.3 |
| SBP (mmHg) | 120 ± 13.9 | 117.4 ± 14.0 | 0.1 | 125.9 ± 16.4 | 121.9 ± 12.9 | 0.3 | 118.1 ± 8.4 | 121.0 ± 6.5 | 0.4 |
| DBP (mmHg) | 75.7 ± 10.9 | 73.6 ± 11.3 | 0.2 | 79.1 ± 12.5 | 76.0 ± 9.8 | 0.2 | 76.0 ± 5.7 | 74.3 ± 7.9 | 0.9 |
| Glucose (mmol/L) | 5.9 ± 0.3 | 5.8 ± 0.9 | 0.3 | 5.9 ± 0.3 | 6.1 ± 1.3 | 0.4 | 6.1 ± 0.4 | 6.5 ± 1.6 | 0.5 |
| HbA1c (%) | 5.4 ± 0.5 | 5.1 ± 0.5 | 0.02 | 5.8 ± 0.3 | 5.9 ± 0.2 | 0.046 | 5.8 ± 0.3 | 8.4 ± 1.7 | 0.006 |
| Insulin (uU/mL) | 16.0 ± 3.7 | 15.7 ± 4.1 | 0.1 | 16.3 ± 5.9 | 15.8 ± 5.8 | 0.004 | 19.1 ± 6.1 | 18.0 ± 7.2 | 0.5 |
| TC (mmol/L) | 4.8 ± 0.9 | 5.1 ± 1.4 | 0.2 | 4.8 ± 0.9 | 4.6 ± 0.8 | 0.4 | 5.1 ± 1.5 | 5.3 ± 1.4 | 0.7 |
| HDL-C (mmol/L) | 1.1 ± 0.3 | 1.1 ± 0.4 | 0.7 | 1.1 ± 0.2 | 1.0 ± 0.3 | 0.7 | 1.0 ± 0.2 | 1.0 ± 0.3 | 0.7 |
| TG (mmol/L) | 1.3 (1.0–2.0) | 1.4 (1.1–2.0) | 0.4 | 1.5 (1.1–2.6) | 1.9 (1.3–2.4) | 0.5 | 2.1 (1.3–2.2) | 1.6 (1.0–2.6) | 0.6 |
| Parameters | Control | PD | T2DM | ||||||
|---|---|---|---|---|---|---|---|---|---|
| Baseline | Follow-Up | p-Value | Baseline | Follow-Up | p-Value | Baseline | Follow-Up | p-Value | |
| N (M/F) | 13 (5/8) | 48 (12/36) | 6 (3/3) | ||||||
| (A) FSG | |||||||||
| IL-33 (pg/mL) | 3.2 (1.1–4.1) | 0.7 (0.6–1.2) | 0.007 | 3.3 (2.9–3.9) | 1.0 (0.6–3.0) | <0.001 | 3.1 (2.8–3.9) | 3.1 (0.9–3.9) | 0.3 |
| IL-37 (pg/mL) | 2.3 (1.9–4.3) | 2.1 (1.9–4.7) | 0.50 | 4.2 (2.1–10.7) | 2.9 (2.1–2.9) | <0.001 | 2.0 (1.6–4.3) | 2.3 (1.6–4.5) | 0.3 |
| NLRP3 (ng/mL) | 0.1 (0.1–0.1) | 0.1 (0.1–0.1) | 0.9 | 0.13 (0.1–0.2) | 0.11 (0.1–0.18) | 0.01 | 0.2 (0.1–0.3) | 0.2 (0.1–0.4) | 0.3 |
| (B) HbA1c | |||||||||
| IL-1α (pg/mL) | 0.8 (0.5–1.3) | 1.0 (0.9–1.2) | 0.2 | 0.7 (0.6–1.1) | 1.0 (0.8–1.2) | 0.07 | 0.6 (0.5–0.8) | 1.0 (0.9–1.4) | 0.046 |
| IL-33 (pg/mL) | 3.2 (0.7–4.0) | 0.8 (0.6–2.1) | <0.001 | 3.3 (3.0–4.0) | 1.0 (0.6–2.1) | <0.001 | 3.2 (3.1–3.8) | 0.8 (0.6–1.3) | 0.2 |
Disclaimer/Publisher’s Note: The statements, opinions and data contained in all publications are solely those of the individual author(s) and contributor(s) and not of MDPI and/or the editor(s). MDPI and/or the editor(s) disclaim responsibility for any injury to people or property resulting from any ideas, methods, instructions or products referred to in the content. |
© 2023 by the authors. Licensee MDPI, Basel, Switzerland. This article is an open access article distributed under the terms and conditions of the Creative Commons Attribution (CC BY) license (https://creativecommons.org/licenses/by/4.0/).
Share and Cite
Alfadul, H.; Sabico, S.; Alnaami, A.M.; Amer, O.E.; Hussain, S.D.; Wani, K.; Clerici, M.; Al-Daghri, N.M. Acute Glycemic Control in Prediabetes Individuals Favorably Alters Serum NLRP3 Inflammasome and Related Interleukins. Int. J. Mol. Sci. 2023, 24, 13837. https://doi.org/10.3390/ijms241813837
Alfadul H, Sabico S, Alnaami AM, Amer OE, Hussain SD, Wani K, Clerici M, Al-Daghri NM. Acute Glycemic Control in Prediabetes Individuals Favorably Alters Serum NLRP3 Inflammasome and Related Interleukins. International Journal of Molecular Sciences. 2023; 24(18):13837. https://doi.org/10.3390/ijms241813837
Chicago/Turabian StyleAlfadul, Hend, Shaun Sabico, Abdullah M. Alnaami, Osama E. Amer, Syed D. Hussain, Kaiser Wani, Mario Clerici, and Nasser M. Al-Daghri. 2023. "Acute Glycemic Control in Prediabetes Individuals Favorably Alters Serum NLRP3 Inflammasome and Related Interleukins" International Journal of Molecular Sciences 24, no. 18: 13837. https://doi.org/10.3390/ijms241813837
APA StyleAlfadul, H., Sabico, S., Alnaami, A. M., Amer, O. E., Hussain, S. D., Wani, K., Clerici, M., & Al-Daghri, N. M. (2023). Acute Glycemic Control in Prediabetes Individuals Favorably Alters Serum NLRP3 Inflammasome and Related Interleukins. International Journal of Molecular Sciences, 24(18), 13837. https://doi.org/10.3390/ijms241813837