
Natural Coumarin Shows Toxicity to Spodoptera litura by Inhibiting Detoxification Enzymes and Glycometabolism

Abstract
:1. Introduction
2. Results
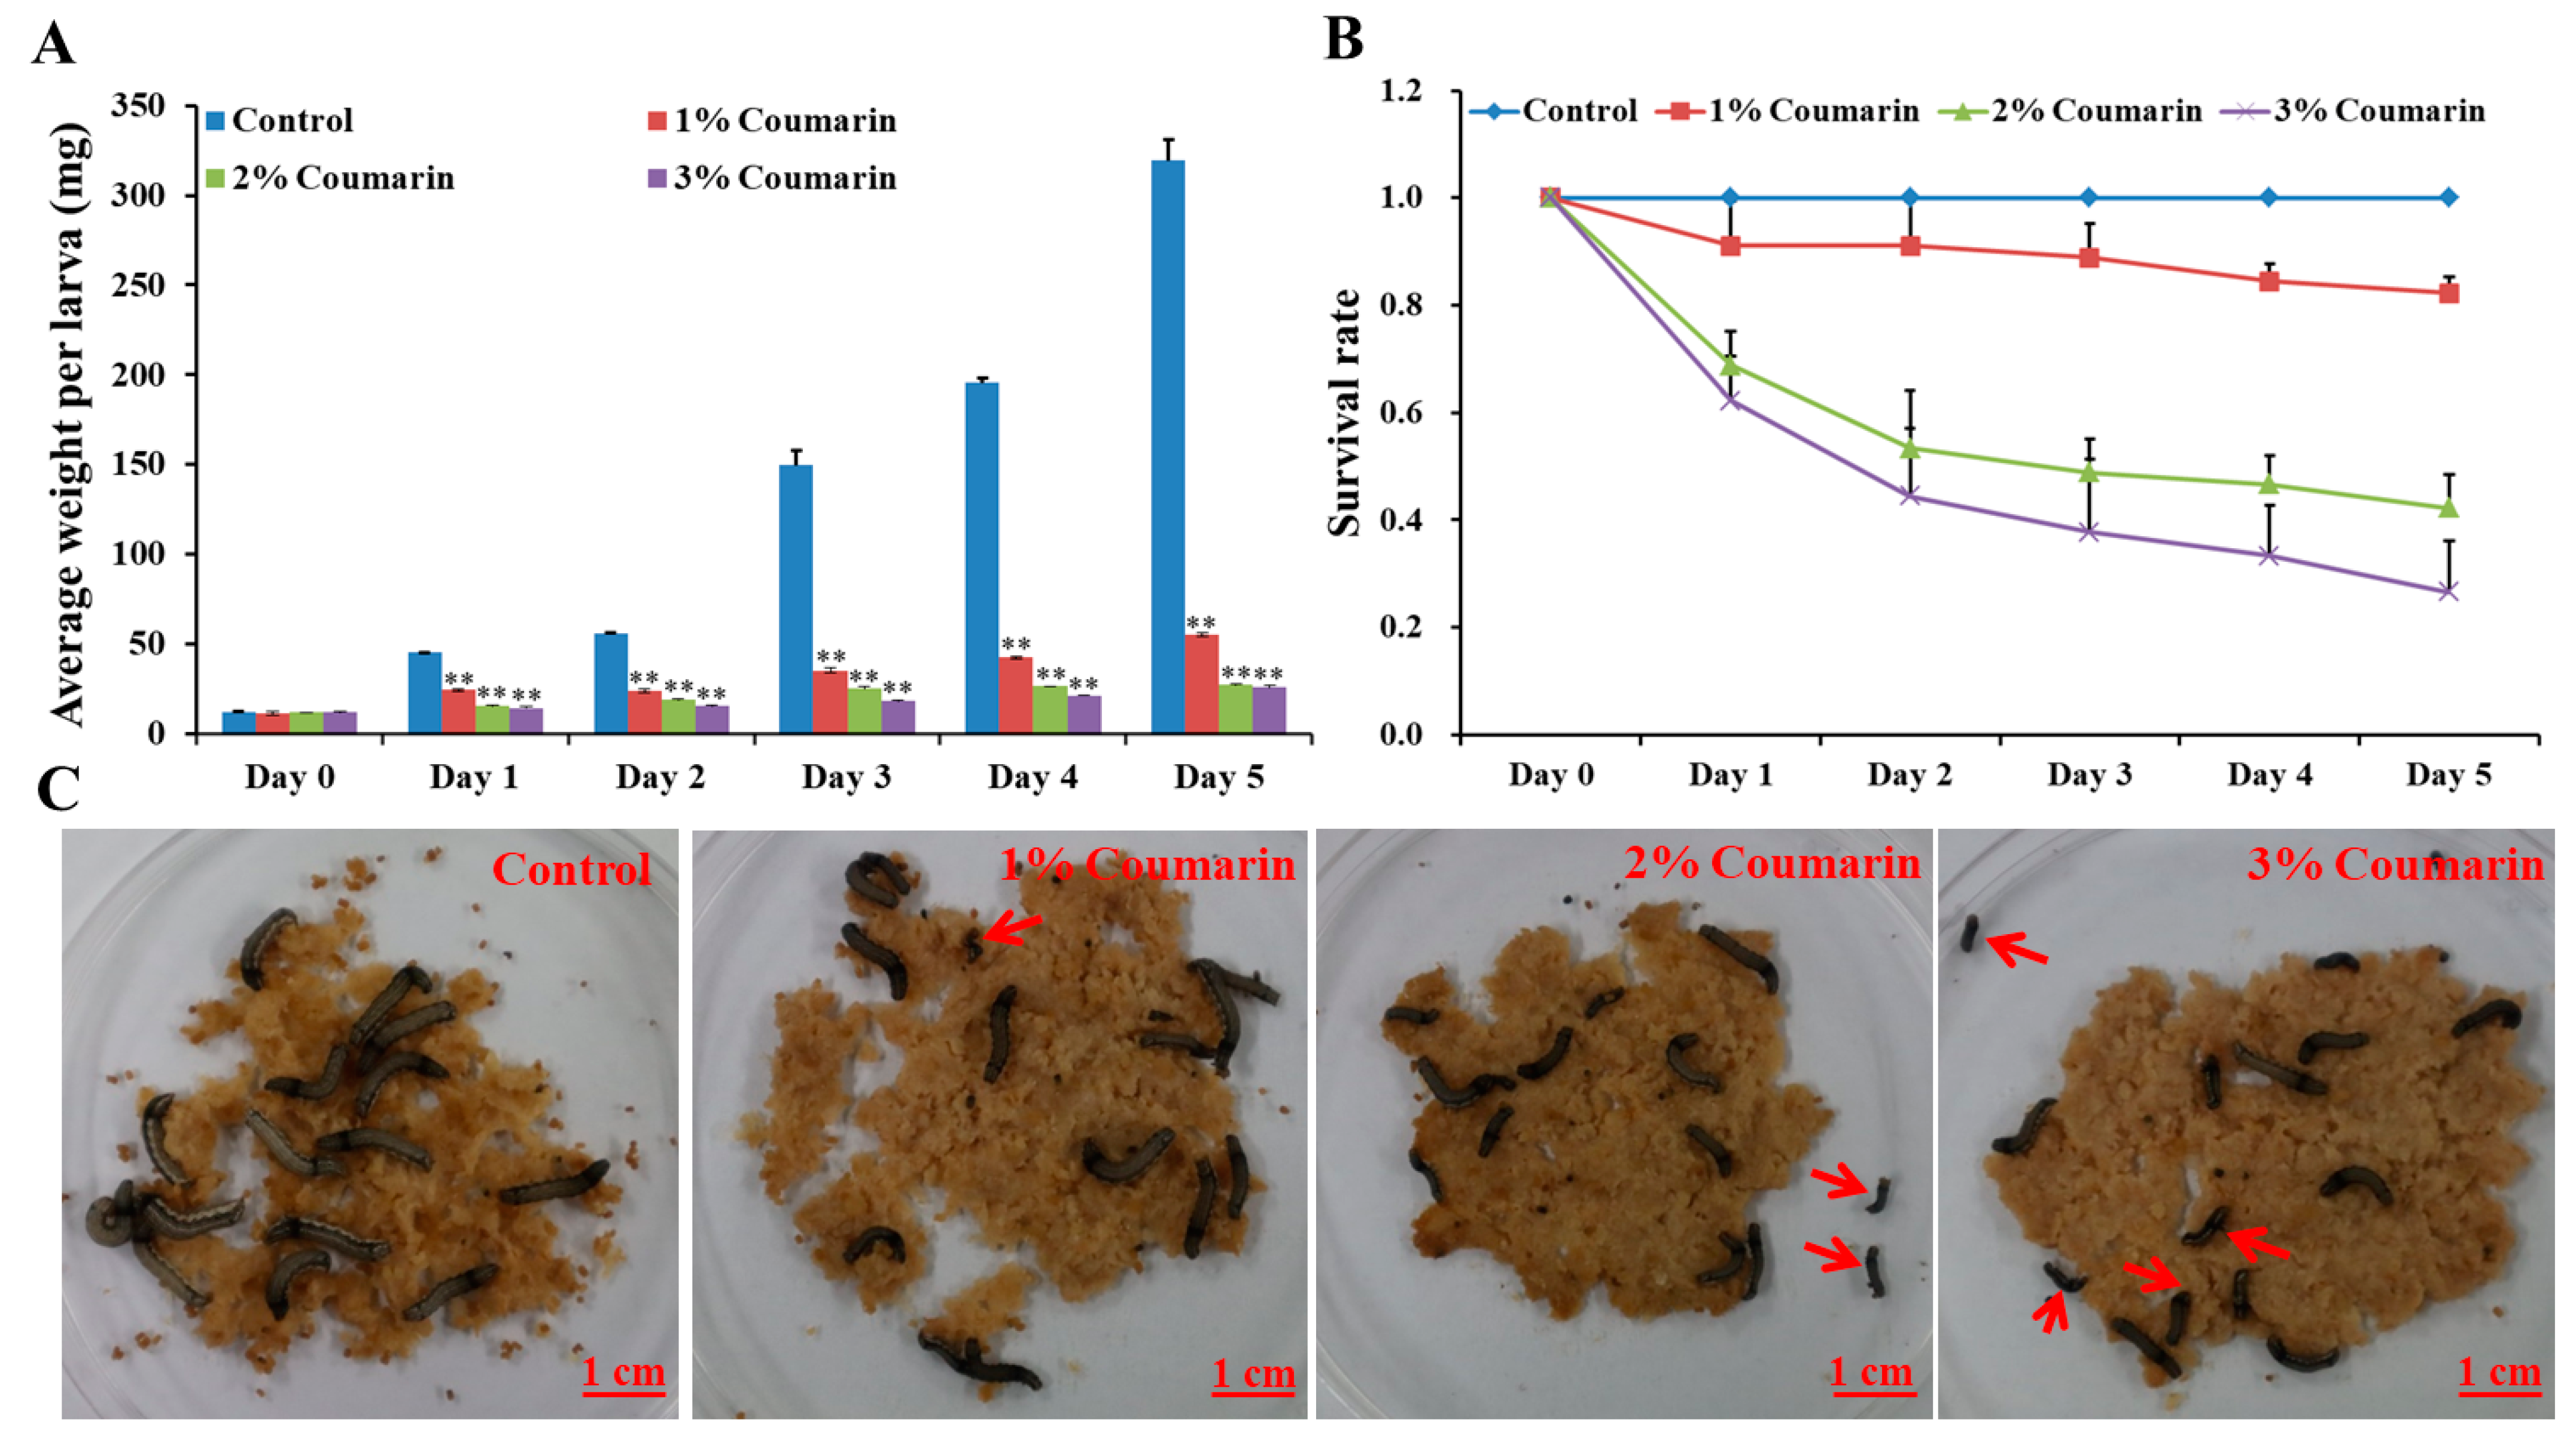
2.1. Toxicological Analysis of S. litura Response to Coumarin
2.2. Transcriptome Analysis of S. litura after Exposure to Coumarin
2.3. Identification of DEGs Related to Detoxification after Exposure to Coumarin
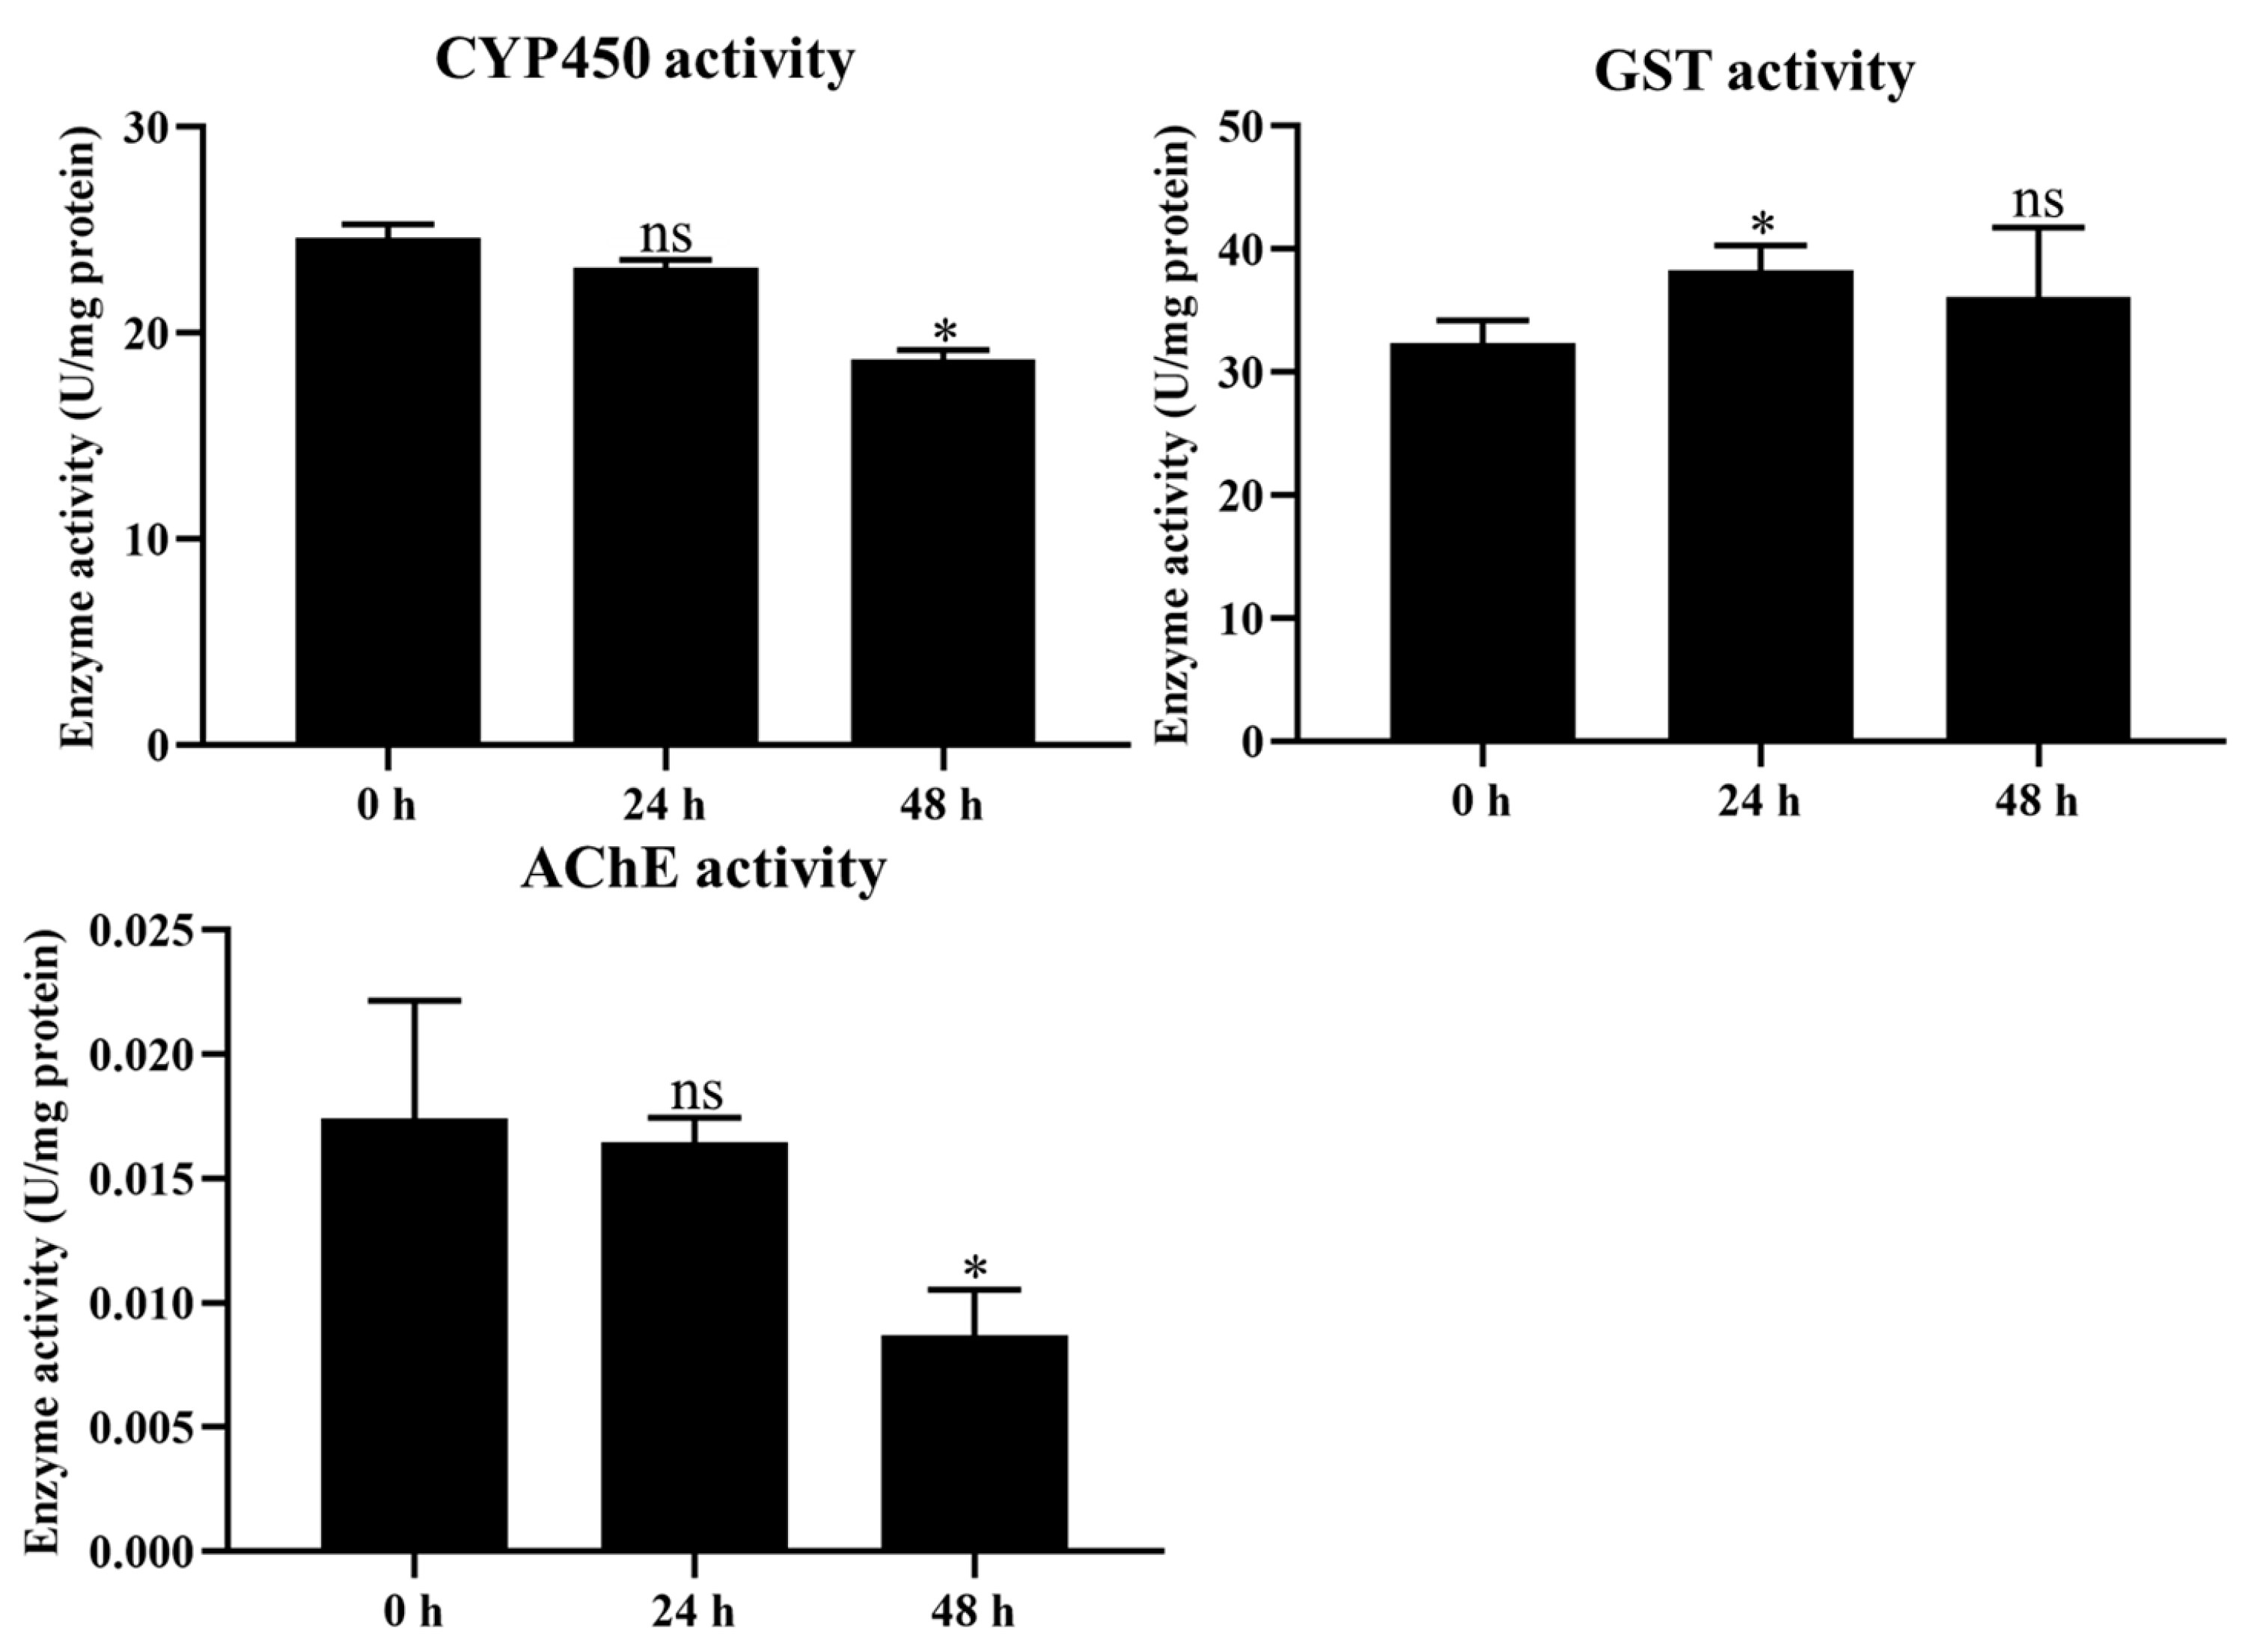
2.4. Determination of Detoxification Enzyme Activity
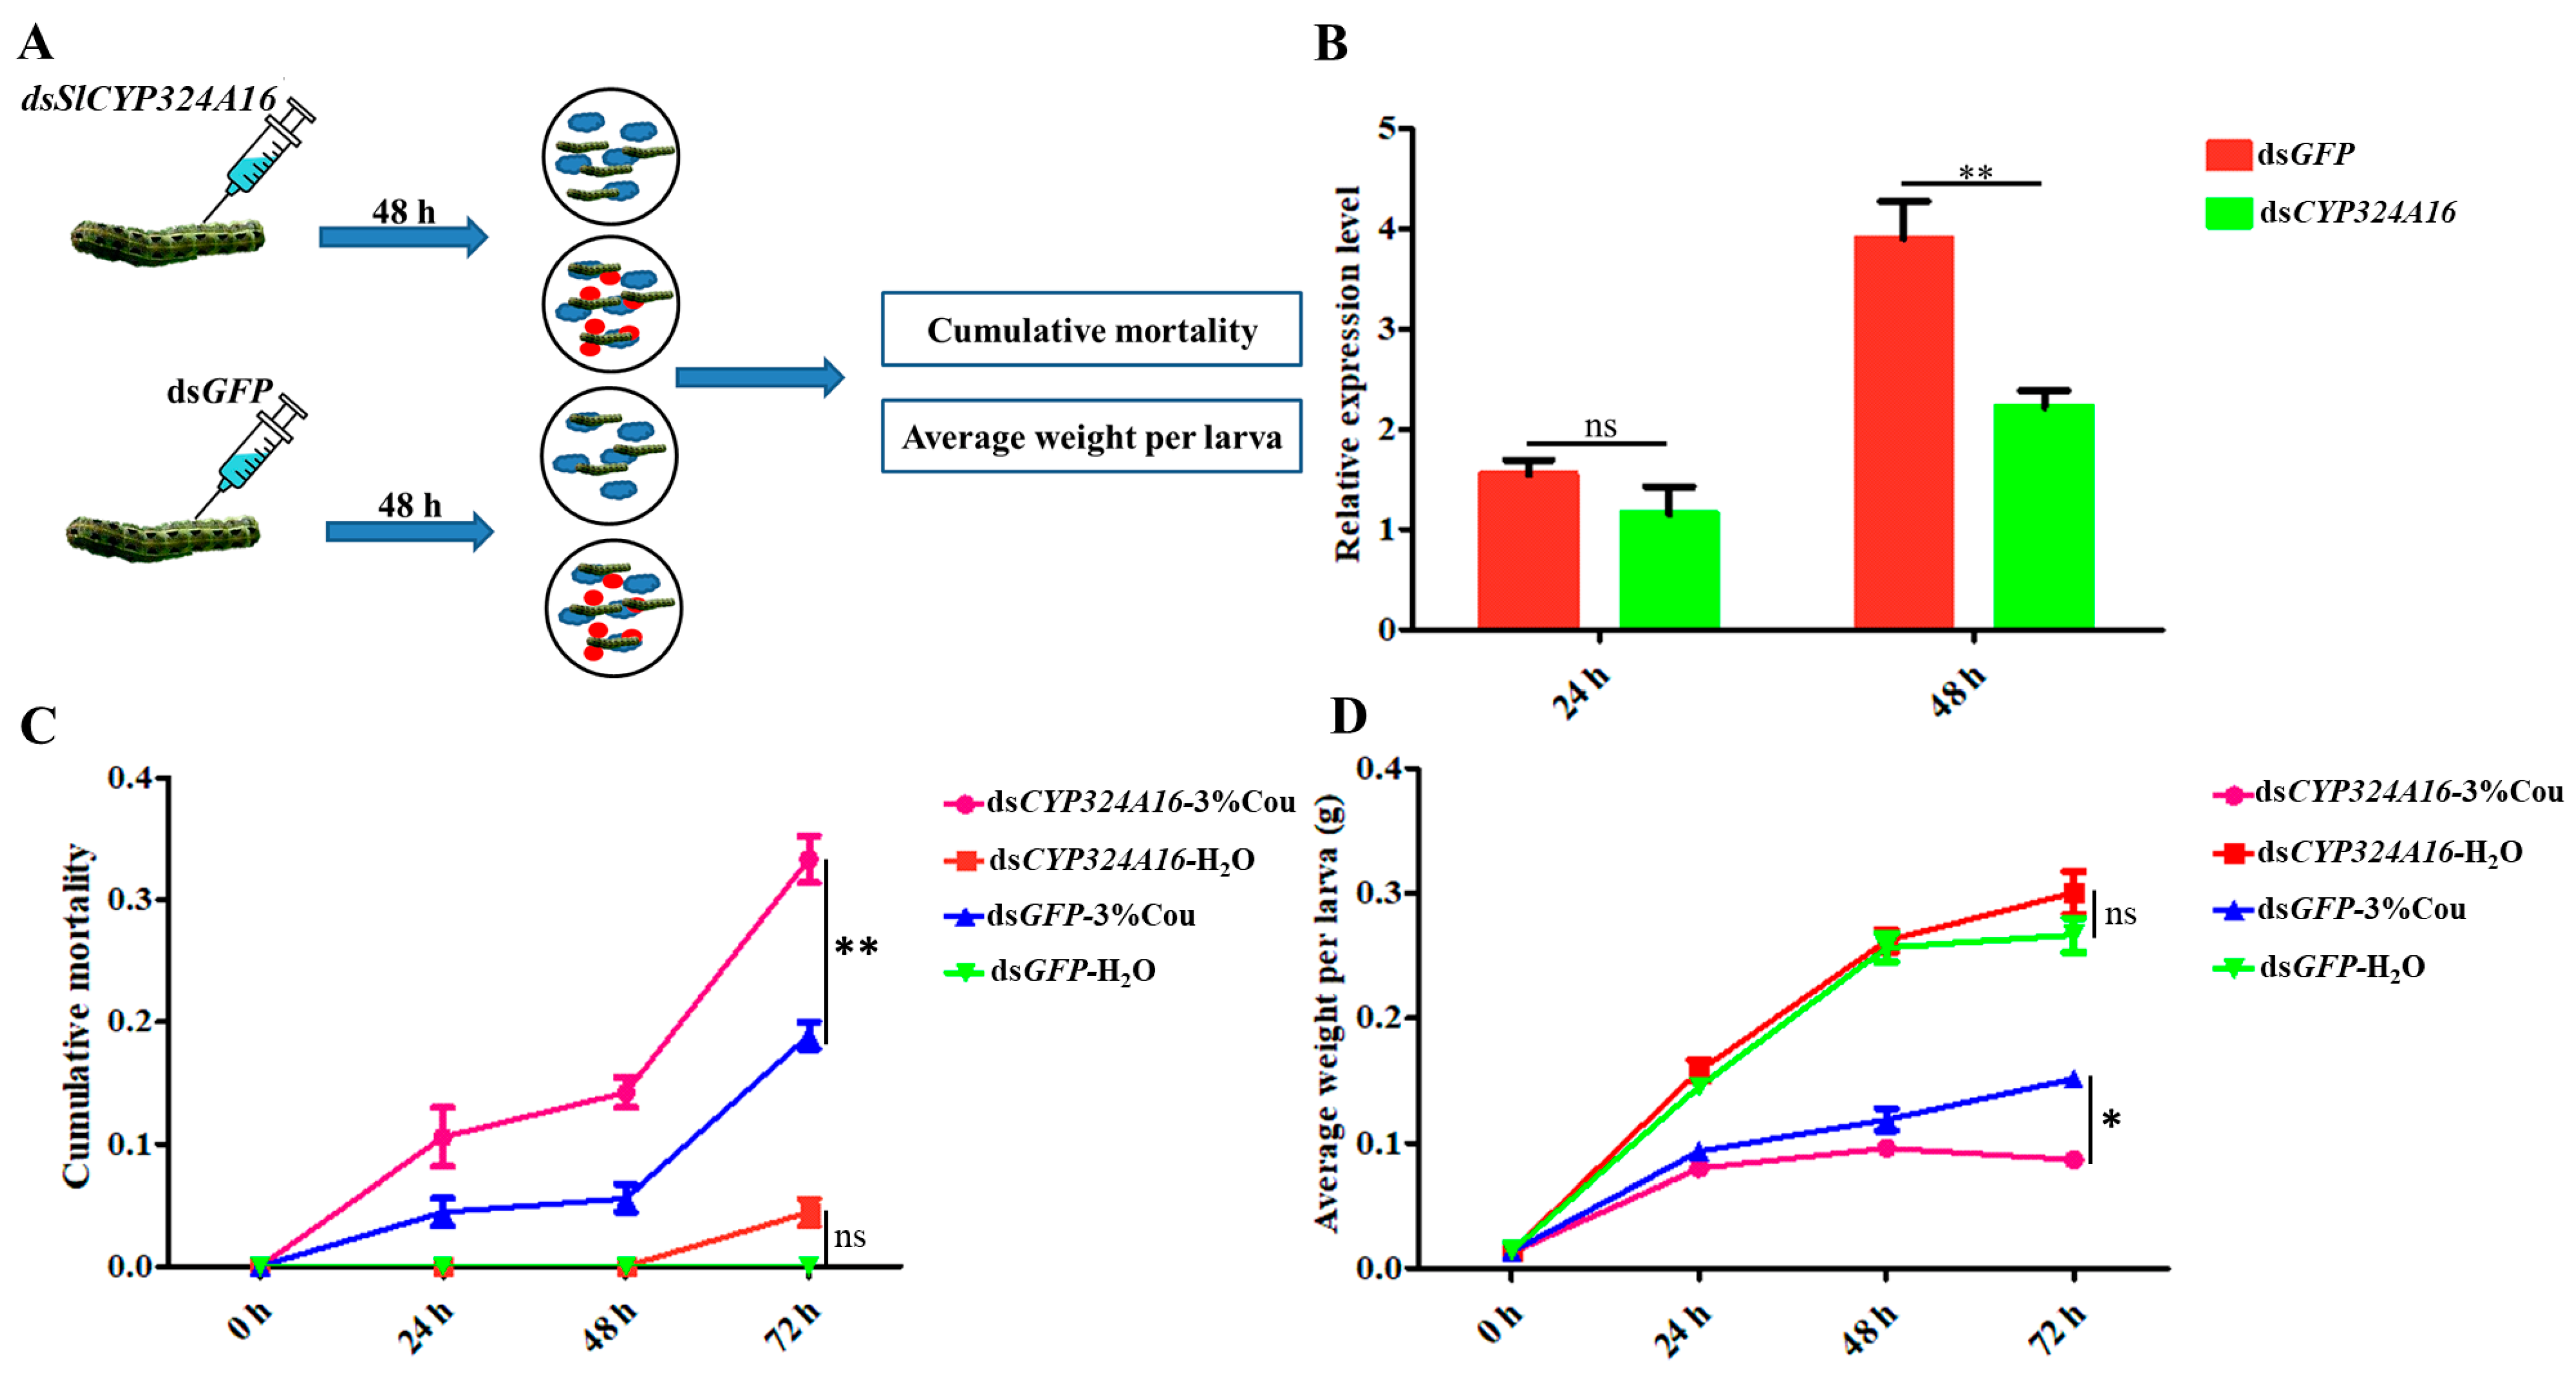
2.5. Effect of Coumarin on S. litura after Silencing of SlCYP324A16
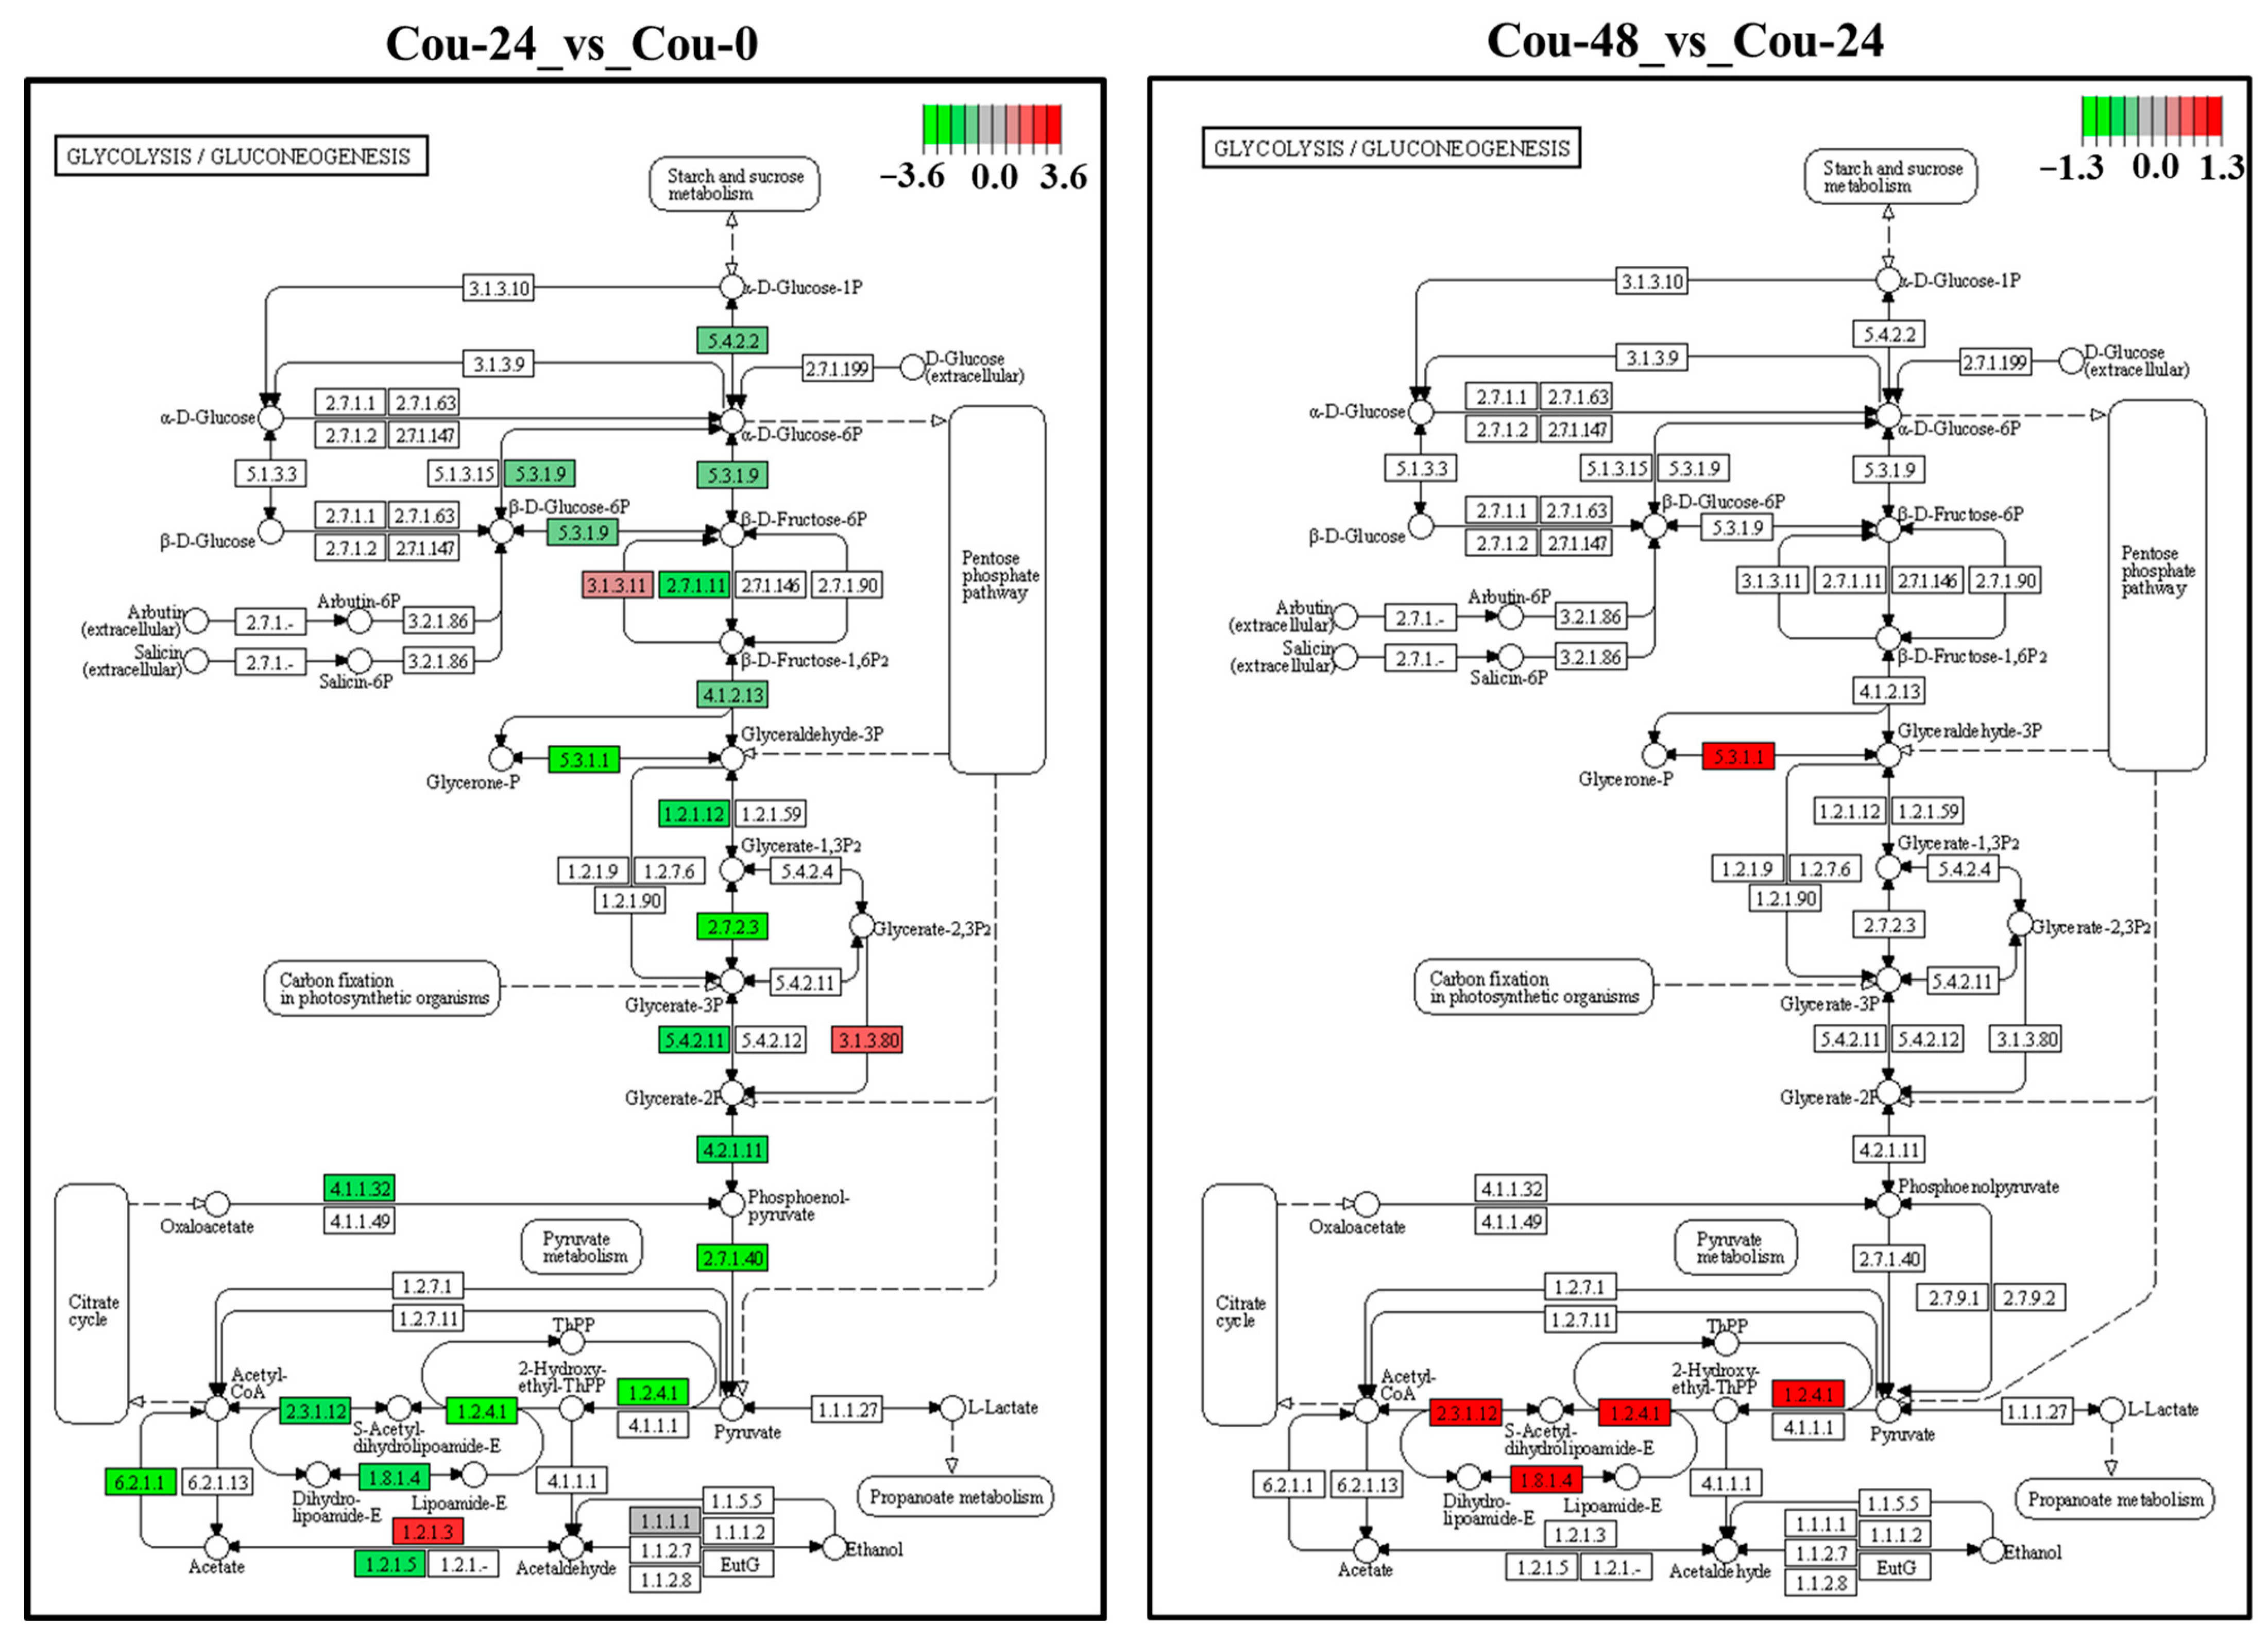
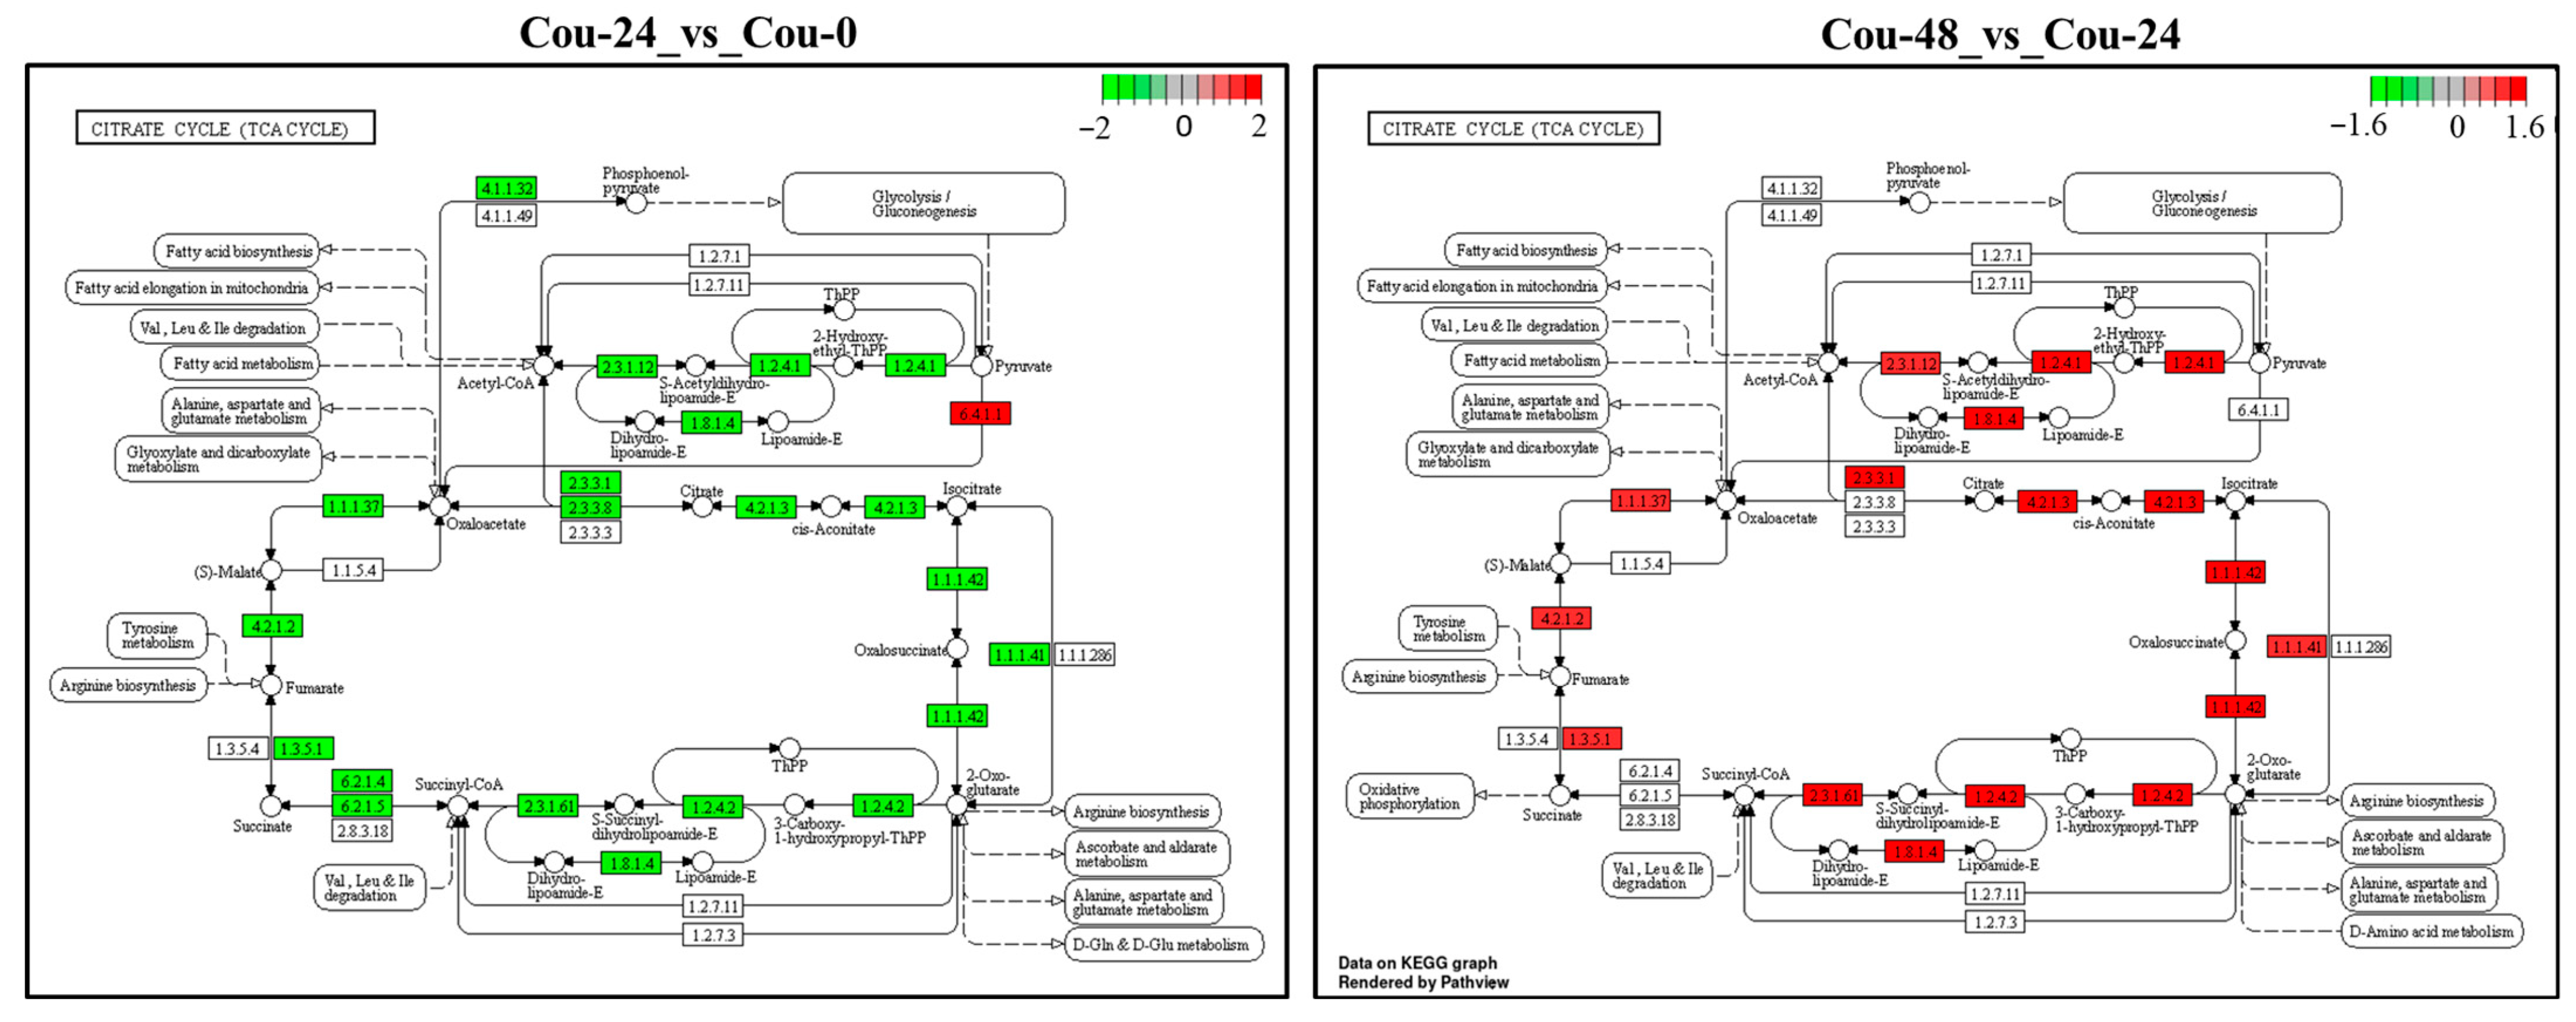
2.6. Identification of DEGs Involved in Glycolysis and TCA cycle after Exposure to Coumarin
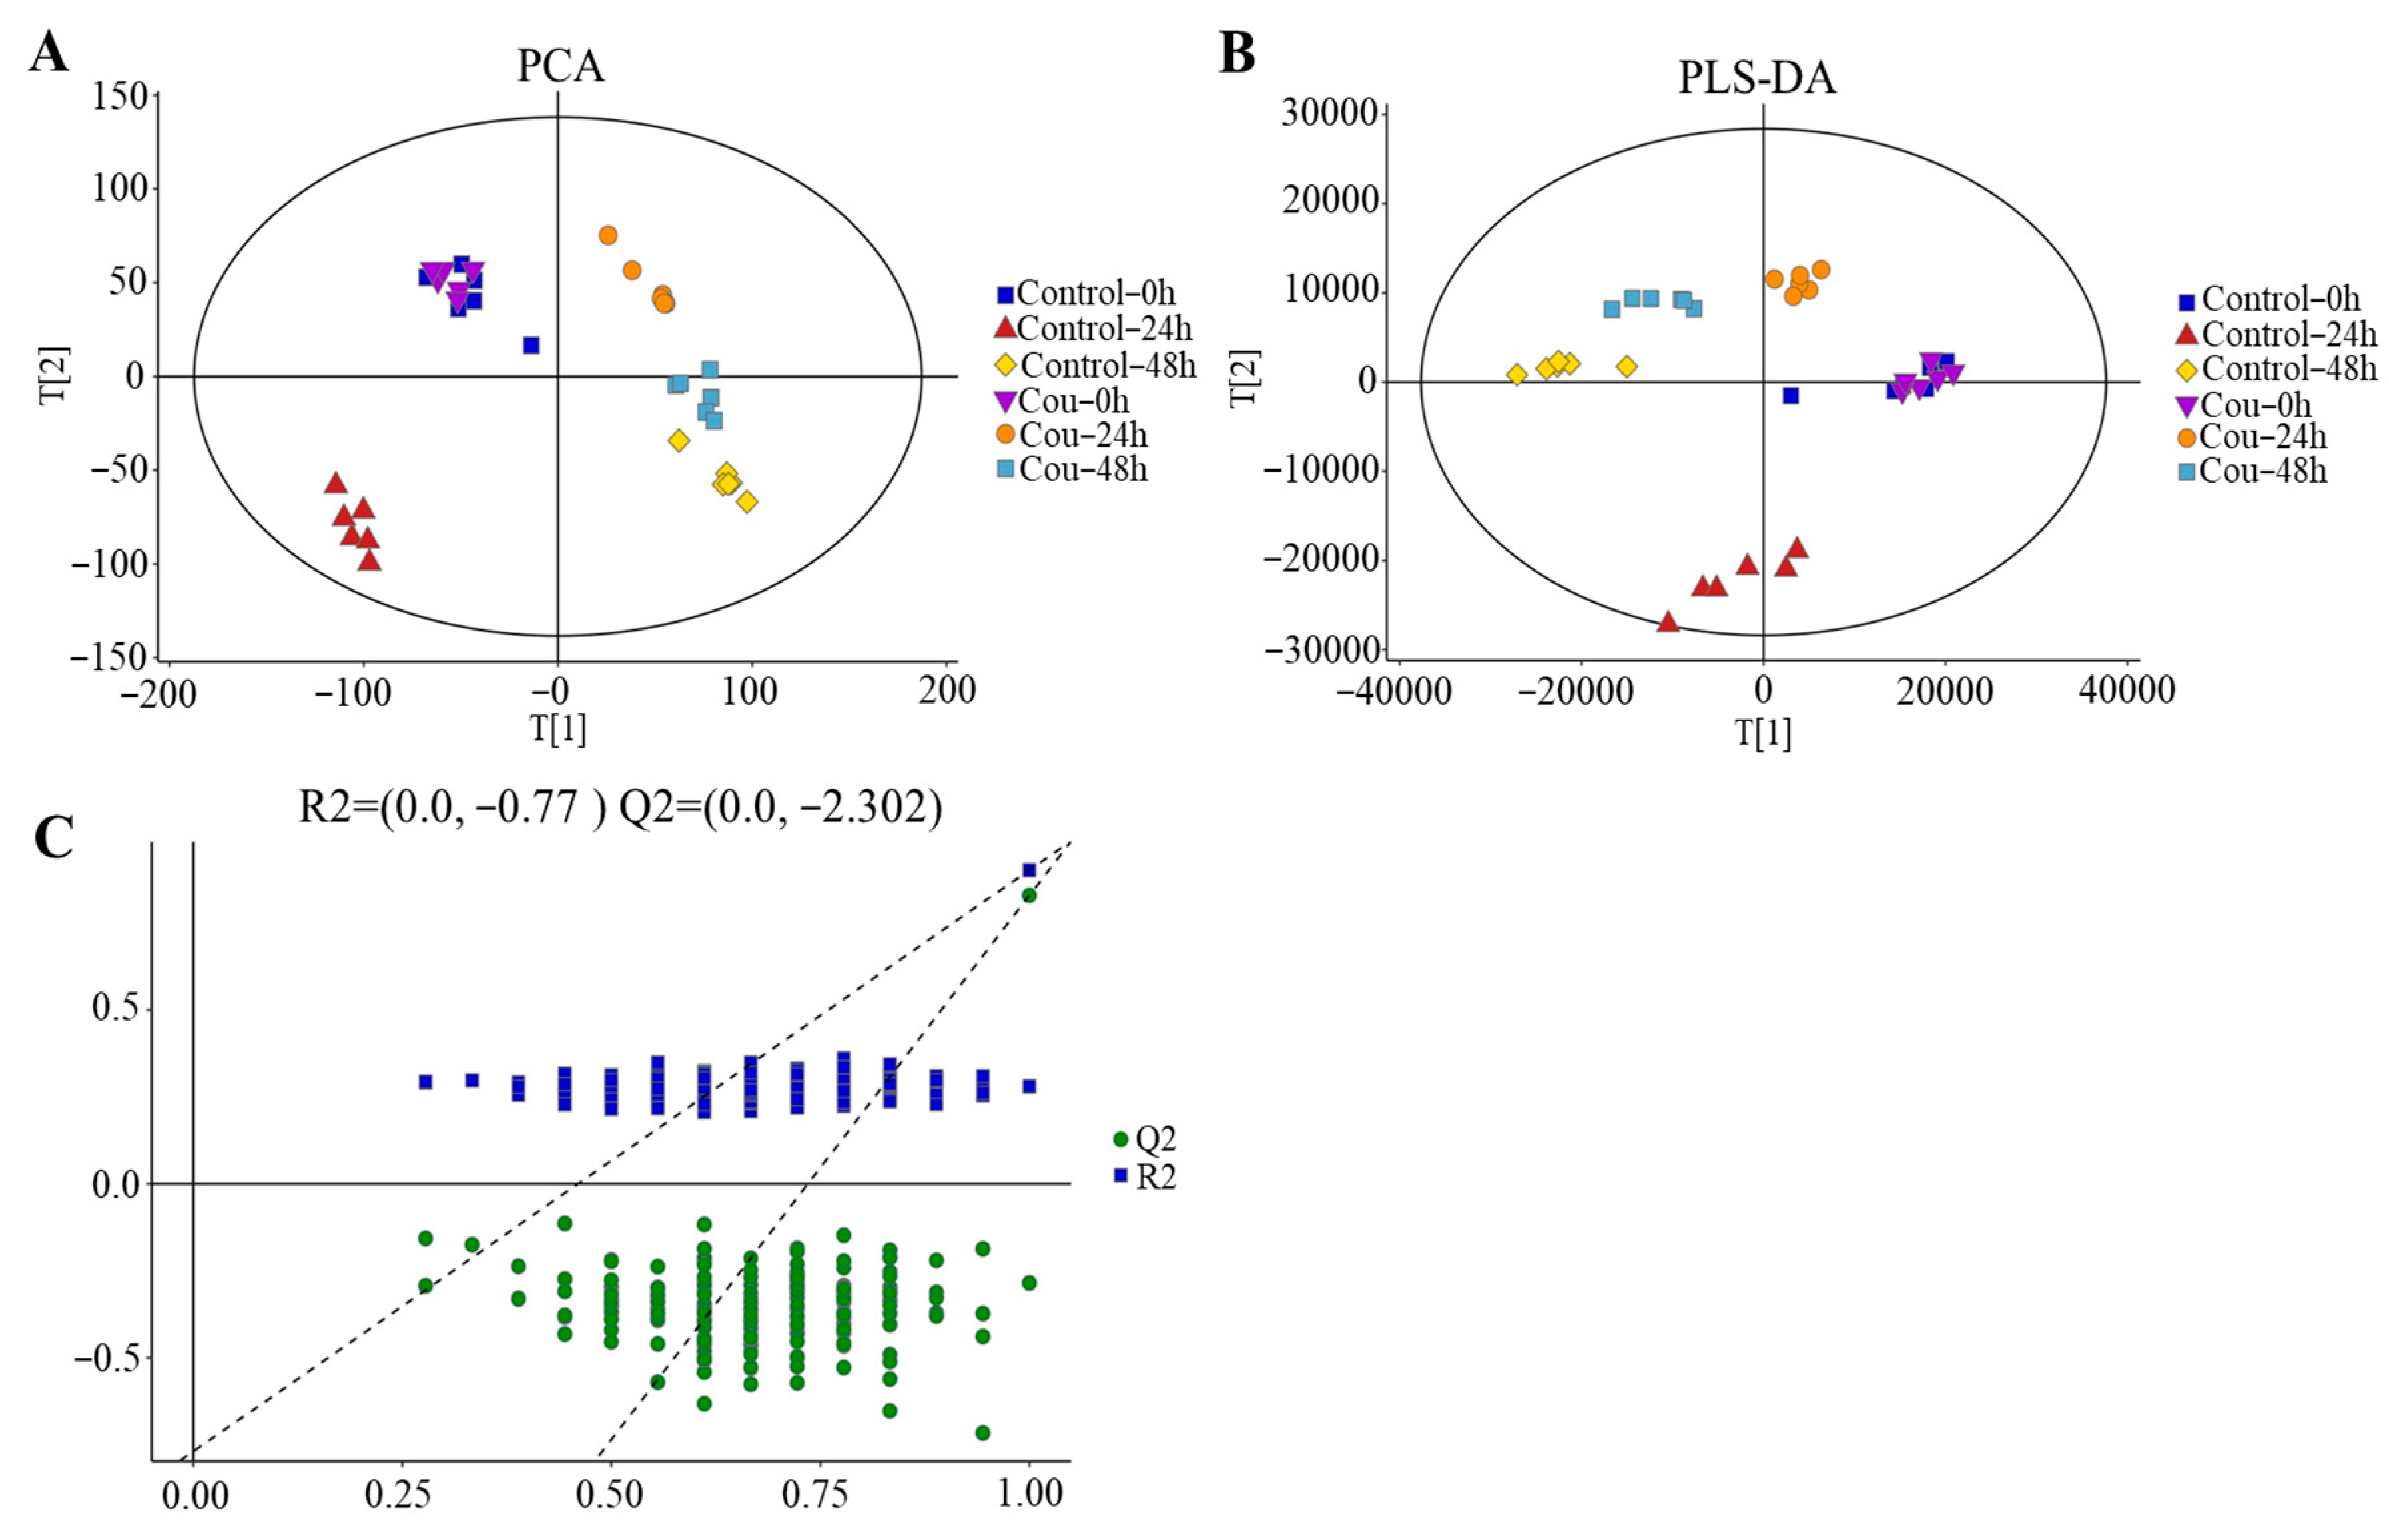
2.7. Metabolite Profiling of S. litura Hemolymph after Exposure to Coumarin
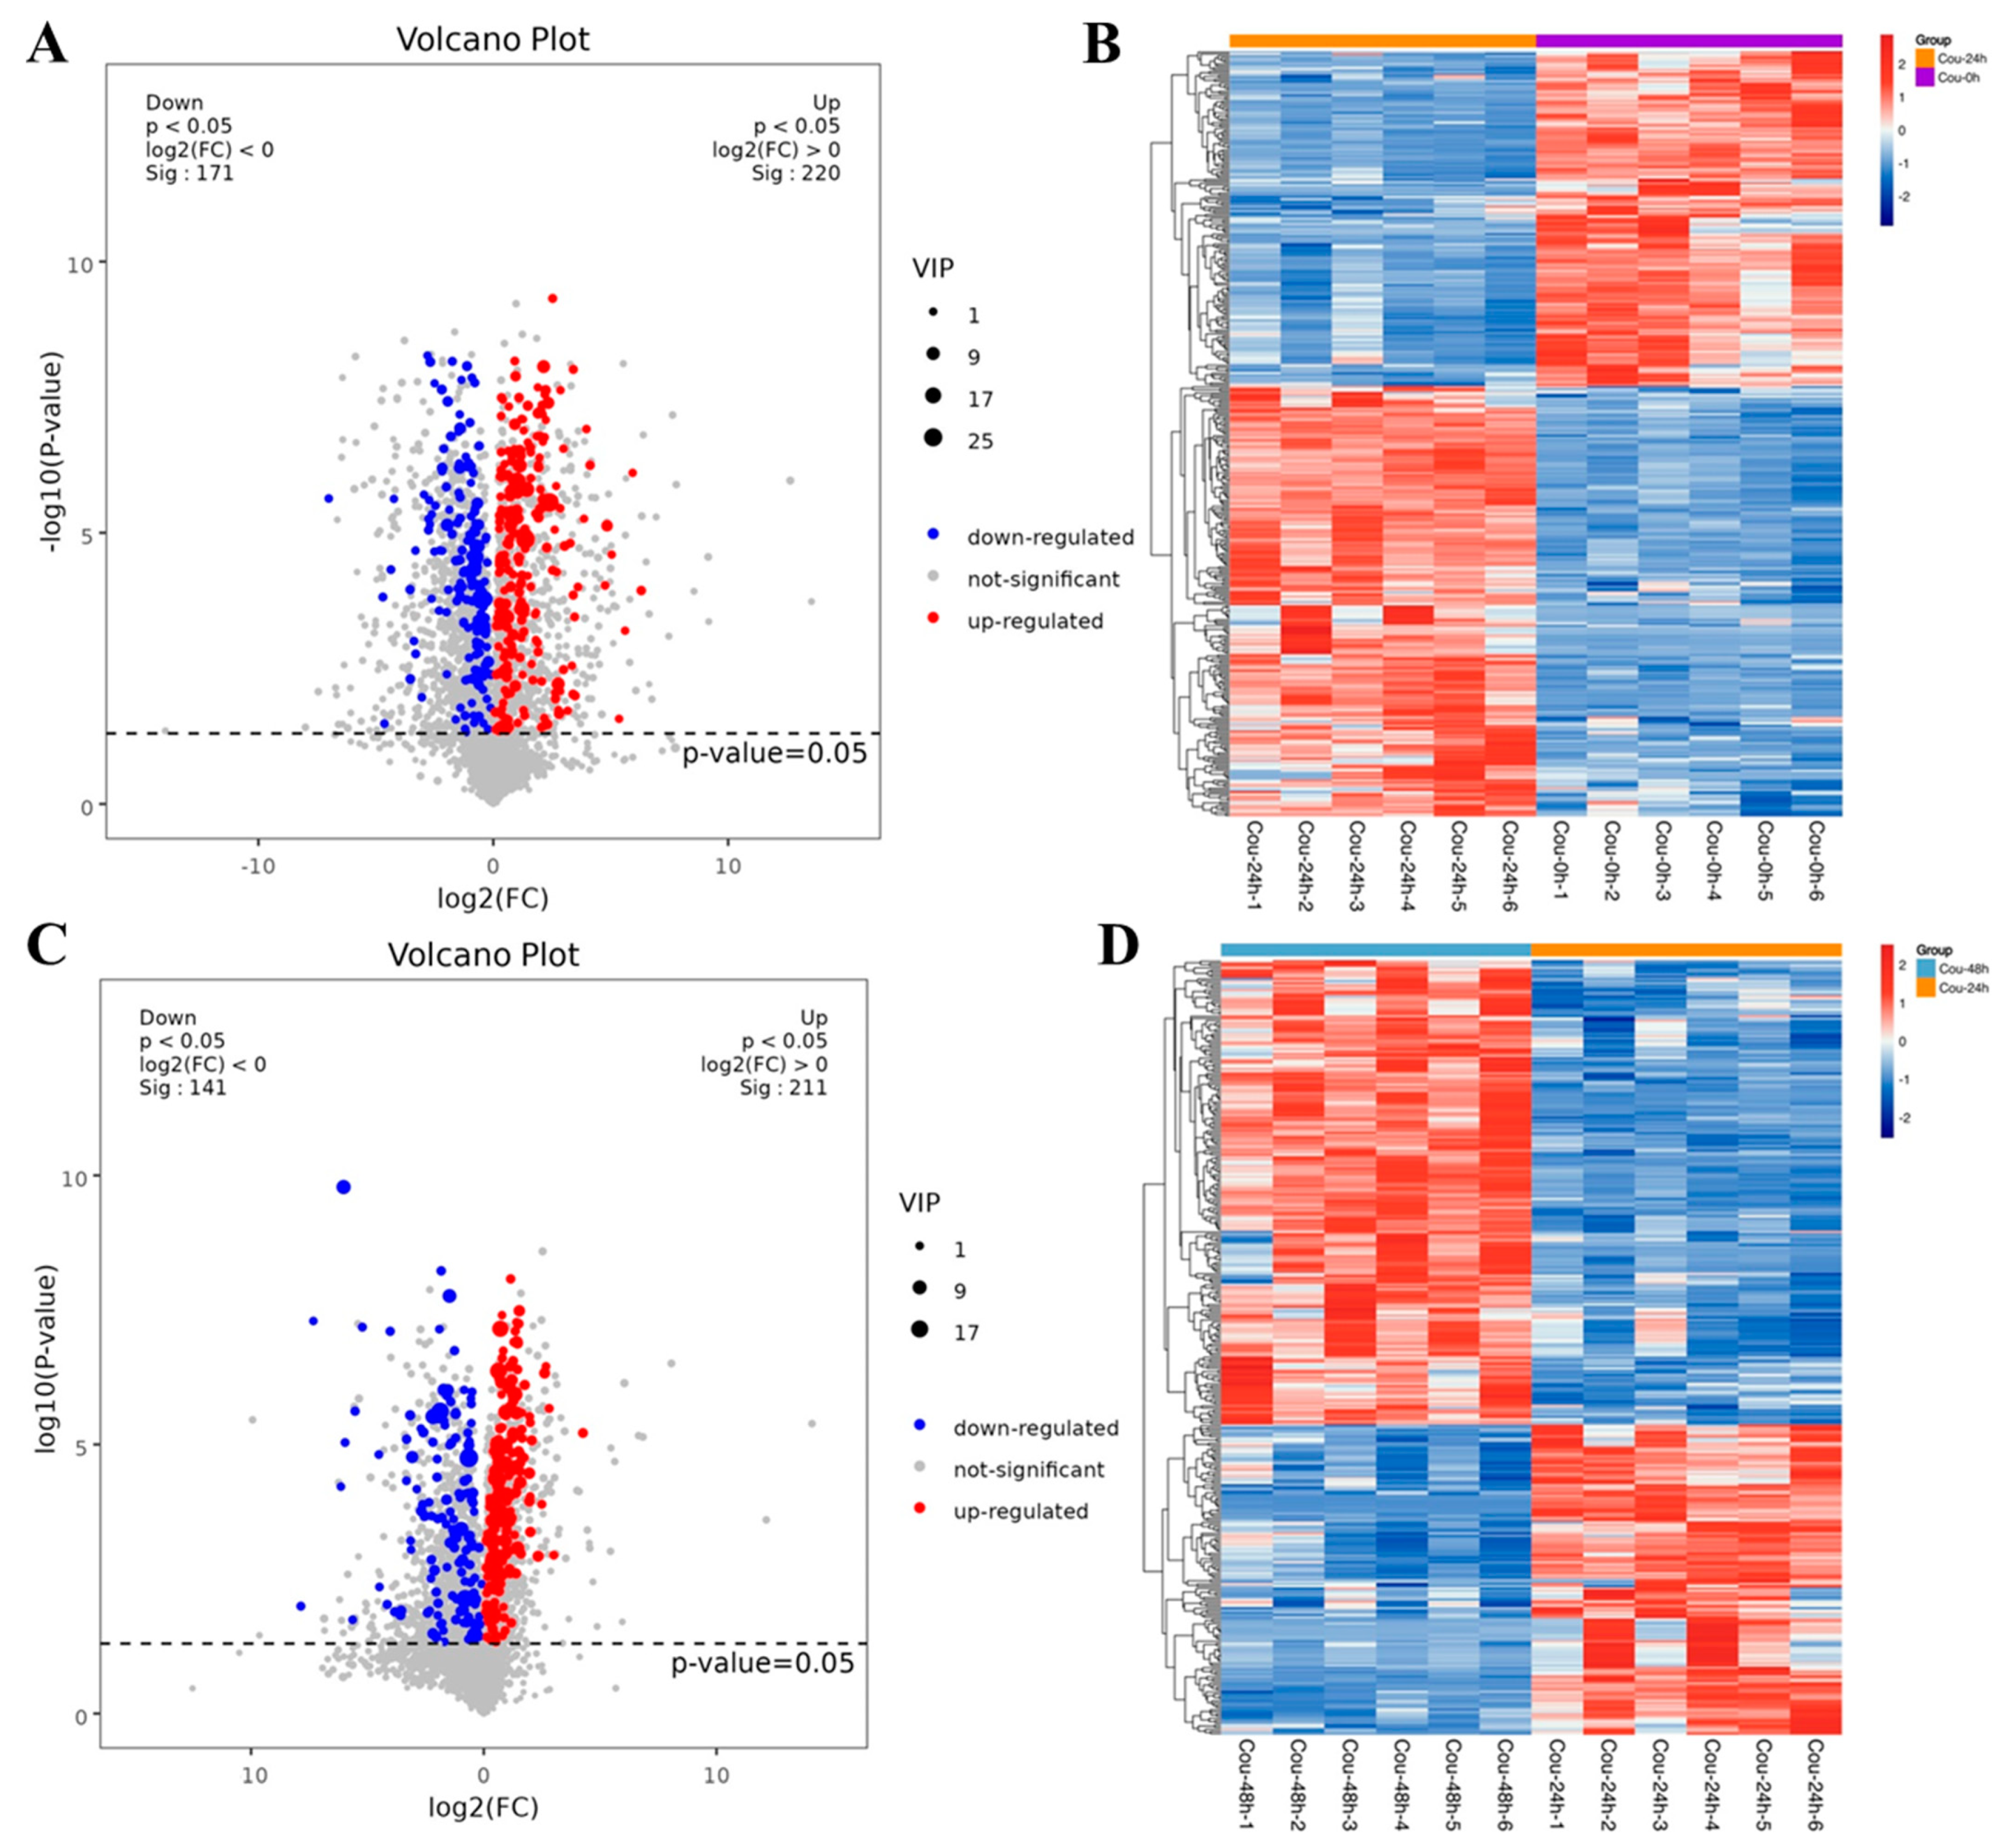
2.8. Effect of Coumarin Treatment on Metabolite Profiling in S. litura Hemolymph
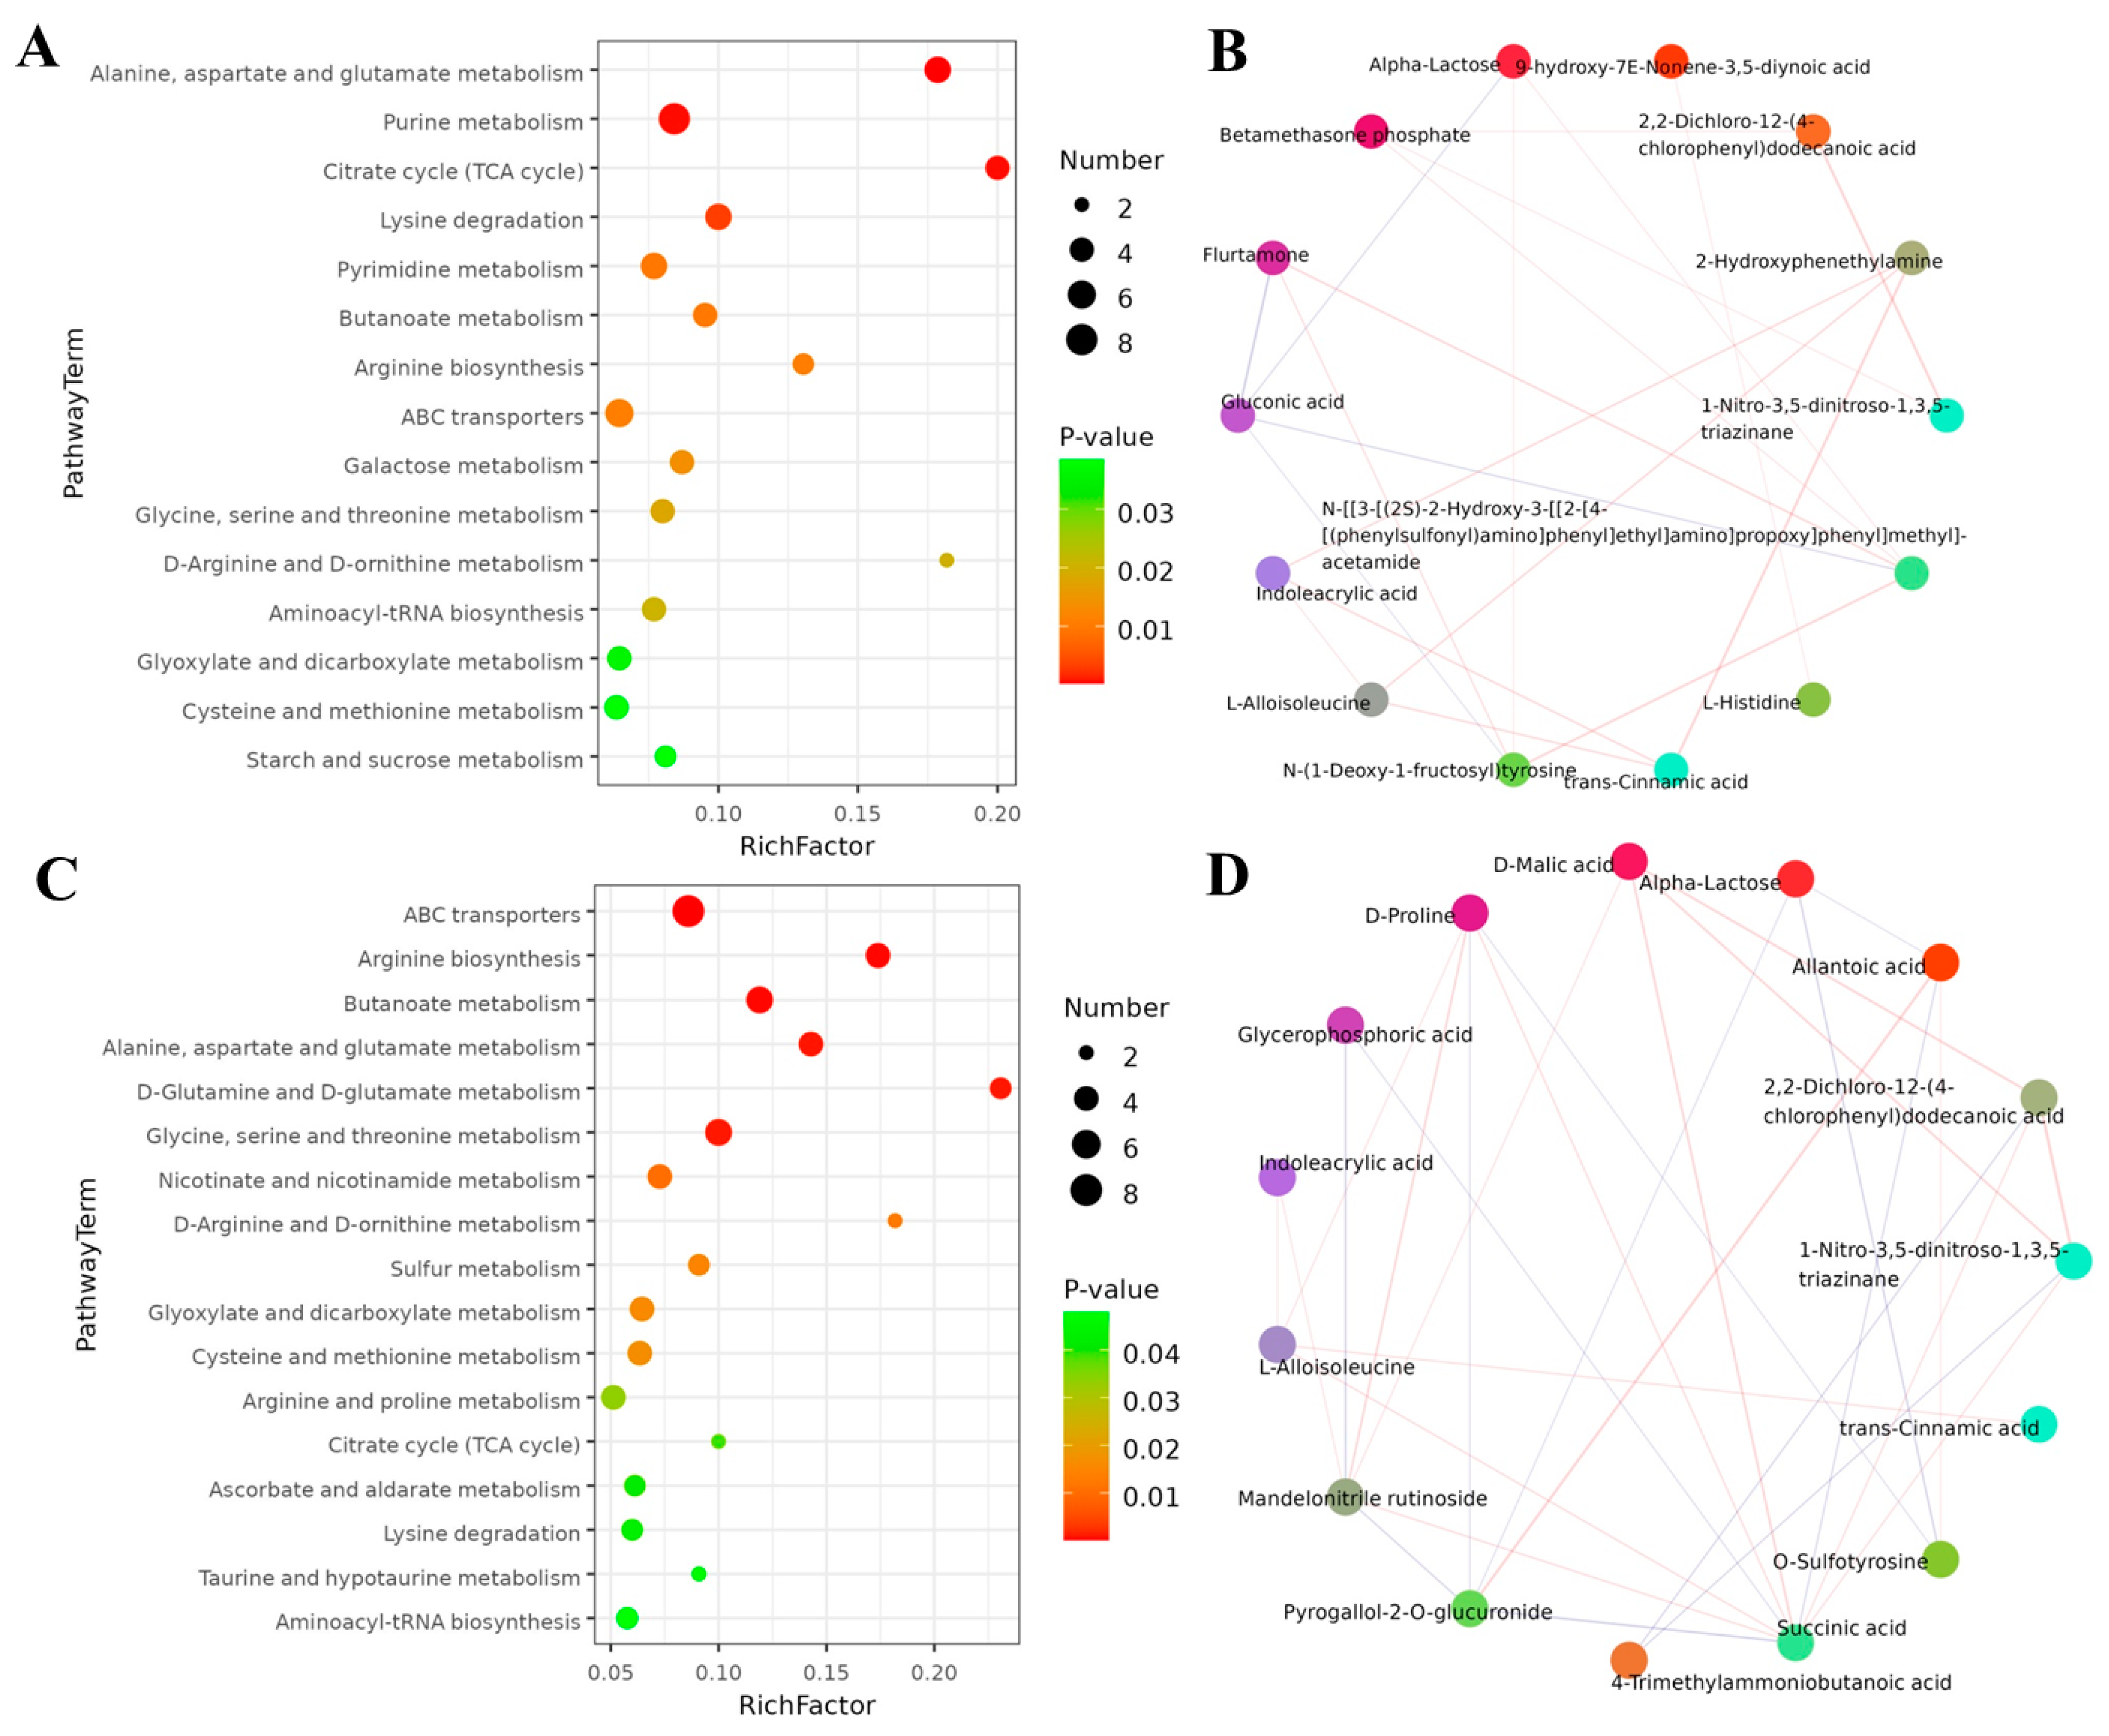
2.9. Metabolic Pathway of S. litura Affected by Coumarin
3. Discussion
4. Materials and Methods
4.1. Spodoptera litura Rearing and Toxicity Assay
4.2. Extraction of RNA, cDNA Synthesis, and RT-qPCR Analysis
4.3. cDNA Library Preparation and Sequencing
4.4. Data Analysis, DEGs Identification, and Bioinformatics Analysis
4.5. Determination of Various Enzymes Activity
4.6. dsRNA Synthesis and Microinjection
4.7. Hemolymph Sample Pretreatment for UPLC-MS Analysis
4.8. UPLC-MS Analysis for Untargeted Metabolite Profiling
4.9. Data Preprocessing and Statistical Analysis
5. Conclusions
Supplementary Materials
Author Contributions
Funding
Institutional Review Board Statement
Informed Consent Statement
Data Availability Statement
Conflicts of Interest
References
- Ahmad, M.; Ghaffar, A.; Rafiq, M. Host plants of leaf worm, Spodoptera litura (Fabricius) uidae in Pakistan. Asian J. Agri Biol. 2013, 1, 23–28. [Google Scholar]
- de Fouchier, A.; Sun, X.; Caballero-Vidal, G.; Travaillard, S.; Jacquin-Joly, E.; Montagne, N. Behavioral effect of plant volatiles binding to Spodoptera littoralis larval odorant receptors. Front. Behav. Neurosci. 2018, 12, 264. [Google Scholar] [CrossRef] [PubMed]
- Li, L.L.; Xu, J.W.; Yao, W.C.; Yang, H.H.; Dewer, Y.; Zhang, F. Chemosensory genes in the head of Spodoptera litura. Bull. Entomol. Res. 2021, 111, 454–463. [Google Scholar] [CrossRef]
- Du, L.X.; Liu, Y.; Zhang, J.; Gao, X.W.; Wang, B.; Wang, G.R. Identification and characterization of chemosensory genes in the antennal transcriptome of Spodoptera exigua. Comp. Biochem. Physiol. Part D Genom. Proteom. 2018, 27, 54–65. [Google Scholar] [CrossRef] [PubMed]
- Bi, H.L.; Xu, J.; Tan, A.J.; Huang, Y.P. CRISPR/Cas9-mediated targeted gene mutagenesis in Spodoptera litura. Insect Sci. 2016, 23, 469–477. [Google Scholar] [CrossRef]
- Miresmailli, S.; Isman, M.B. Botanical insecticides inspired by plant-herbivore chemical interactions. Trends Plant Sci. 2014, 19, 29–35. [Google Scholar]
- Rao, D.E.; Divya, K.; Prathyusha, I.V.S.N.; Krishna, C.R.; Chaitanya, K.V. Insect-resistant plants. Curr. Dev. Biotechnol. Bioeng. 2017, 15, 47–74. [Google Scholar]
- Bhonwong, A.; Stout, M.J.; Attajarusit, J.; Tantasawat, P. Defensive role of tomato polyphenol oxidases against cotton bollworm (Helicoverpa armigera) and beet armyworm (Spodoptera exigua). J. Chem. Ecol. 2009, 35, 28–38. [Google Scholar] [CrossRef]
- Harborne, J.B. The natural coumarins: Occurrence, chemistry and biochemistry (book). Plant Cell Environ. 1982, 5, 435–436. [Google Scholar] [CrossRef]
- Zhao, L.X.; Wang, Z.X.; Peng, J.F.; Zou, Y.L.; Hui, Y.Z.; Chen, Y.Z.; Gao, S.; Fu, Y.; Ye, F. Design, synthesis, and herbicidal activity of novel phenoxypyridine derivatives containing natural product coumarin. Pest. Manag. Sci. 2021, 77, 4785–4798. [Google Scholar] [CrossRef]
- Poudel, S.; Lee, Y. Gustatory receptors required for avoiding the toxic compound coumarin in Drosophila melanogaster. Mol. Cells 2016, 39, 310–315. [Google Scholar] [PubMed]
- Chen, Y.; Wang, P.C.; Zhang, S.S.; Yang, J.; Li, G.C.; Huang, L.Q.; Wang, C.Z. Functional analysis of a bitter gustatory receptor highly expressed in the larval maxillary galea of Helicoverpa armigera. PLoS Genet. 2022, 18, e1010455. [Google Scholar] [CrossRef] [PubMed]
- Zhou, H.; Liu, J.L.; Wan, F.L.; Guo, F.Y.; Ning, Y.S.; Liu, S.S.; Ding, W. Insight into the mechanism of action of scoparone inhibiting egg development of Tetranychus cinnabarinus Boisduval. Comp. Biochem. Physiol. C Toxicol. Pharmacol. 2021, 246, 109055. [Google Scholar] [CrossRef] [PubMed]
- Zhou, H.; Wan, F.L.; Guo, F.Y.; Liu, J.L.; Ding, W. High value-added application of a renewable bioresource as acaricide: Investigation the mechanism of action of scoparone against Tetranychus cinnabarinus. J. Adv. Res. 2021, 38, 29–39. [Google Scholar] [CrossRef]
- Hakim, R.S.; Baldwin, K.; Smagghe, G. Regulation of midgut growth, development, and metamorphosis. Annu. Rev. Entomol. 2010, 55, 593–608. [Google Scholar] [CrossRef]
- Intra, J.; Perotti, M.; Pasini, M.E. Cloning, sequence identification and expression profile analysis of α-L-fucosidase gene from the Mediterranean fruit fly Ceratitis capitate. J. Insect Physiol. 2011, 57, 452–461. [Google Scholar] [CrossRef]
- Yan, P.C.; Wen, C.W.; Zhang, S.Z.; Zhang, Z.D.; Xu, J.P.; Deng, M.J. A toxicological, metabonomic and transcriptional analysis to investigate the property of mulberry 1-deoxynojirimycin against the growth of Samia cynthia ricini. Pestic. Biochem. Physiol. 2018, 152, 45–54. [Google Scholar] [CrossRef]
- Li, P.; Hu, J.W.; Wen, C.W.; Hang, Y.; Zhou, Z.H.; Xie, M.; Lv, J.C.; Wang, C.M.; Huang, Y.H.; Xu, J.P.; et al. Sanguinarine caused larval lethality and growth inhibition by suppressing energy metabolism in silkworms, Bombyx mori. Pestic. Biochem. Physiol. 2019, 160, 154–162. [Google Scholar] [CrossRef]
- Wang, X.Y.; Zhao, Z.Q.; Song, C.X.; Su, Z.H.; Li, M.W.; Wu, Y.C.; Jin, B.R.; Deng, M.J. Fumarate mitigates disruption induced by fenpropathrin in the silkworm Bombyx mori (Lepidoptera): A metabolomics study. Insect Sci. 2023, 30, 789–802. [Google Scholar] [CrossRef]
- Zhu, Y.C.; Guo, Z.B.; Chen, M.S.; Zhu, K.Y.; Liu, X.F.; Scheffler, B. Major putative pesticide receptors, detoxification enzymes, and transcriptional profile of the midgut of the tobacco budworm, Heliothis virescens (Lepidoptera: Noctuidae). J. Invertebr. Pathol. 2011, 106, 296–307. [Google Scholar] [CrossRef]
- Scully, E.D.; Hoover, K.; Carlson, J.E.; Tien, M.; Geib, S.M. Midgut transcriptome profiling of Anoplophora glabripennis, a lignocellulose degrading cerambycid beetle. BMC Genom. 2013, 14, 850. [Google Scholar] [CrossRef] [PubMed]
- Xia, J.X.; Guo, Z.J.; Yang, Z.Z.; Zhu, X.; Kang, S.; Yang, X.; Yang, F.S.; Wu, Q.J.; Wang, S.L.; Xie, W.; et al. Proteomics-based identification of midgut proteins correlated with Cry1Ac resistance in Plutella xylostella (L.). Pestic. Biochem. Physiol. 2016, 132, 108–117. [Google Scholar] [CrossRef] [PubMed]
- Wu, Z.Z.; Pu, X.H.; Shu, B.S.; Bin, S.Y.; Lin, J.T. Transcriptome analysis of putative detoxification genes in the Asian citrus psyllid, Diaphorina citri. Pest Manag. Sci. 2020, 76, 3857–3870. [Google Scholar] [CrossRef]
- Wang, H.D.; Shi, Y.; Wang, L.; Liu, S.; Wu, S.W.; Yang, Y.H.; Feyereisen, R.; Wu, Y.D. CYP6AE gene cluster knockout in Helicoverpa armigera reveals role in detoxification of phytochemicals and insecticides. Nat. Commun. 2018, 9, 4820. [Google Scholar] [CrossRef] [PubMed]
- Kostaropoulos, I.; Mantzari, A.E.; Papadopoulos, A.I. Alterations of some glutathione S-transferase characteristics during the development of Tenebrio molitor (Insecta: Coleoptera). Insect Biochem. Mol. Biol. 1996, 26, 8–9. [Google Scholar] [CrossRef]
- Enayati, A.A.; Ranson, H.; Hemingway, J. Insect glutathione transferases and insecticide resistance. Insect Mol. Biol. 2005, 14, 3–8. [Google Scholar] [CrossRef]
- Kostaropoulos, I.; Papadopouslos, A.I.; Metaxakis, A.; Boukouvala, E.; Papadopoulou-Mourkidou, E. The role of glutathione S-transferases in the detoxification of some organophosphorus insecticides in larvae and pupae of the yellow mealworm, Tenebrio molitor (Coleoptera: Tenebrionidae). Pest Manag. Sci. 2001, 57, 501–508. [Google Scholar] [CrossRef]
- Wei, P.; Cen, M.; Nan, C.; Feng, K.Y.; Shen, G.M.; Cheng, J.Q.; He, L. Downregulation of carboxylesterase contributes to cyflumetofen resistance in Tetranychus cinnabarinus (Boisduval). Pest Manag. Sci. 2019, 75, 2166–2173. [Google Scholar] [CrossRef]
- Zhang, M.X.; Feng, T.T.; Pu, G.L.; Sun, X.Q.; Zhuo, X.G.; Cai, Q.N. Xenobiotic metabolism of plant secondary compounds in the English grain aphid, Sitobion avenae (F.) (Hemiptera: Aphididae). Pestic. Biochem. Physiol. 2013, 107, 44–49. [Google Scholar] [CrossRef]
- Shu, B.S.; Yang, X.M.; Dai, J.H.; Yu, H.K.; Yu, J.C.; Li, X.L.; Cao, L.; Lin, J.T. Effects of camptothecin on histological structures and gene expression profiles of fat bodies in Spodoptera frugiperda. Ecotoxicol. Environ. Saf. 2021, 228, 112968. [Google Scholar] [CrossRef]
- Li, F.L.; Yu, Y.X.; Guo, M.M.; Lin, Y.; Jiang, Y.H.; Qu, M.; Sun, X.J.; Li, Z.X.; Zhai, Y.X.; Tan, Z.J. Integrated analysis of physiological, transcriptomics and metabolomics provides insights into detoxification disruption of PFOA exposure in Mytilus edulis. Ecotoxicol. Environ. Saf. 2021, 214, 112081. [Google Scholar] [CrossRef] [PubMed]
- Rattan, R.S. Mechanism of action of insecticidal secondary metabolites of plant origin. Crop Prot. 2010, 29, 913–920. [Google Scholar] [CrossRef]
- Miralpeix, B.; Rischer, H.; Hakkinen, S.T.; Ritala, A.; Seppanen-Laakso, T.; Oksman-Caldentey, K.; Capell, T.; Christou, P. Metabolic engineering of plant secondary products: Which way forward. Curr. Pharm. Des. 2013, 19, 5622–5639. [Google Scholar] [CrossRef]
- Golan, K.; Sempruch, C.; Gorska-Drabik, E.; Czerniewicz, P.; Lagowska, B.; Kot, I.; Kmiec, K.; Magierowicz, K.; Leszczynski, B. Accumulation of amino acids and phenolic compounds in biochemical plant responses to feeding of two different herbivorous arthropod pests. Arthropod-Plant Interact. 2017, 11, 675–682. [Google Scholar] [CrossRef]
- Sharma, D.C.; Badiyala, A.; Choudhary, A. Bioefficacy and persistent toxicity of biopesticides and insecticides against potato tuber moth, Phthorimaea operculella zell. Pestic. Res. J. 2006, 18, 43–46. [Google Scholar]
- Yerer, M.B.; Dayan, S.; Han, M.I.; Sharma, A.; Tuli, H.S.; Sak, K. Nanoformulations of coumarins and the hybrid molecules of coumarins with potential anticancer effects. Anticancer Agents Med. Chem. 2020, 20, 1797–1816. [Google Scholar] [CrossRef]
- Hemingway, J.; Hawkes, N.J.; McCarroll, L.; Ranson, H. The molecular basis of insecticide resistance in mosquitoes. Insect Biochem. Mol. Biol. 2004, 34, 653–665. [Google Scholar] [CrossRef]
- Pengsook, A.; Tharamak, S.; Keosaeng, K.; Koul, O.; Bullangpoti, V.; Kumrungsee, N.; Pluempanupat, W. Insecticidal and growth inhibitory effects of some thymol derivatives on the beet armyworm, Spodoptera exigua (Lepidoptera: Noctuidae) and their impact on detoxification enzymes. Pest Manag. Sci. 2022, 78, 684–691. [Google Scholar] [CrossRef]
- Wang, Z.L.; Zhao, Z.; Abou-Zaid, M.M.; Arnason, J.T.; Liu, R.; Walshe-Roussel, B.; Waye, A.; Liu, S.Q.; Saleem, A.; Caceres, L.A.; et al. Inhibition of insect glutathione S-transferase (GST) by conifer extracts. Arch. Insect Biochem. Physiol. 2014, 87, 234–249. [Google Scholar] [CrossRef]
- Duan, S.Z.; Fu, Y.R.; Dong, S.S.; Ma, Y.F.; Meng, H.Y.; Guo, R.X.; Chen, J.Q.; Liu, Y.H.; Li, Y. Psychoactive drugs citalopram and mirtazapine caused oxidative stress and damage of feeding behavior in Daphnia magna. Ecotoxicol. Environ. Saf. 2021, 230, 113147. [Google Scholar] [CrossRef]
- Zhao, P.; Xue, H.; Zhu, X.Z.; Wang, L.; Zhang, K.X.; Li, D.Y.; Ji, J.C.; Niu, L.; Gao, X.K.; Luo, J.Y.; et al. Silencing of cytochrome P450 gene CYP321A1 effects tannin detoxification and metabolism in Spodoptera litura. Int. J. Biol. Macromol. 2022, 194, 895–902. [Google Scholar] [CrossRef] [PubMed]
- Yu, H.Z.; Zhang, Q.; Lu, Z.J.; Deng, M.J. Validamycin treatment significantly inhibits the glycometabolism and chitin synthesis in the common cutworm, Spodoptera litura. Insect Sci. 2022, 29, 840–854. [Google Scholar] [CrossRef] [PubMed]
- Bhagavan, N.Y.; Ha, C. Chapter 12-Carbohydrate metabolism I: Glycolysis and the tricarboxylic acid cycle. Essent. Med. Biochem. 2011, 5, 115–133. [Google Scholar]
- Wu, C.; Chakrabarty, S.; Jin, M.H.; Liu, K.Y.; Xiao, Y.T. Insect ATP-binding cassette (ABC) transporters: Roles in xenobiotic detoxification and Bt insecticidal activity. Int. J. Mol. Sci. 2019, 20, 2829. [Google Scholar] [CrossRef] [PubMed]
- Song, J.C.; Lu, Z.J.; Yi, L.; Yu, H.Z. Functional characterization of a trehalose-6-phosphate synthase in Diaphorina citri revealed by RNA interference and transcriptome sequencing. Insects 2021, 12, 1074. [Google Scholar] [CrossRef]
- Huang, C.F.; Sun, C.N. Microsomal monooxygenases in diamondback moth larvae resistant to fenvalerate and piperonyl butoxide. Pestic. Biochem. Physiol. 1989, 33, 168–175. [Google Scholar] [CrossRef]


| Group | Day 0 (mg) | Day 1 (mg) | Day 2 (mg) | Day 3 (mg) | Day 4 (mg) | Day 5 (mg) |
|---|---|---|---|---|---|---|
| Control-1 | 12.01 ± 2.39 | 45.51 ± 2.76 | 55.67 ± 2.71 | 151.90 ± 19.26 | 198.49 ± 31.54 | 304.45 ± 30.17 |
| Control-2 | 12.58 ± 2.60 | 45.24 ± 2.87 | 55.50 ± 2.99 | 138.31 ± 23.43 | 196.13 ± 31.93 | 332.58 ± 30.08 |
| Control-3 | 12.75 ± 2.00 | 45.35 ± 3.23 | 56.63 ± 2.46 | 158.86 ± 18.08 | 192.54 ± 22.92 | 320.94 ± 38.24 |
| 1% Coumarin-1 | 12.40 ± 2.29 | 23.95 ± 23.63 | 24.40 ± 2.40 | 33.30 ± 2.88 | 43.03 ± 2.73 | 53.85 ± 3.04 |
| 1% Coumarin-2 | 10.00 ± 1.99 | 25.39 ± 34.23 | 23.32 ± 1.98 | 35.70 ± 2.64 | 42.54 ± 4.22 | 56.32 ± 3.48 |
| 1% Coumarin-3 | 12.40 ± 2.56 | 24.70 ± 35.25 | 24.95 ± 3.19 | 37.10 ± 2.66 | 42.19 ± 2.62 | 56.14 ± 2.74 |
| 2% Coumarin-1 | 11.90 ± 3.97 | 16.49 ± 22.20 | 18.93 ± 4.54 | 26.41 ± 2.77 | 26.27 ± 2.04 | 27.68 ± 2.11 |
| 2% Coumarin-2 | 12.10 ± 2.11 | 15.02 ± 26.24 | 18.98 ± 3.75 | 24.30 ± 3.06 | 26.88 ± 2.98 | 27.27 ± 1.19 |
| 2% Coumarin-3 | 12.20 ± 2.67 | 14.90 ± 24.83 | 19.36 ± 3.33 | 25.40 ± 2.47 | 26.55 ± 2.40 | 27.58 ± 1.78 |
| 3% Coumarin-1 | 11.30 ± 2.32 | 15.24 ± 31.08 | 15.15 ± 3.52 | 17.56 ± 2.33 | 21.52 ± 2.54 | 25.85 ± 2.93 |
| 3% Coumarin-2 | 12.40 ± 2.42 | 14.63 ± 24.84 | 15.94 ± 2.68 | 18.42 ± 2.55 | 21.32 ± 2.30 | 27.22 ± 1.98 |
| 3% Coumarin-3 | 12.20 ± 2.98 | 13.36 ± 20.69 | 16.15 ± 1.89 | 18.93 ± 2.22 | 21.43 ± 2.11 | 24.76 ± 0.92 |
| Gene Name | Gene Description | Cou-0 | Cou-24 | Log2FC | p-Value |
|---|---|---|---|---|---|
| Carboxylesterase | |||||
| LOC111364714 | venom carboxylesterase-6 | 0.4509 | 17.4966 | 5.4027 | 0.0039 |
| LOC111357589 | uncharacterized LOC111357589 | 1.5355 | 21.0749 | 3.7957 | 0.0004 |
| LOC111357765 | esterase FE4 | 67.1184 | 518.7683 | 2.95397 | 6.31 × 10−63 |
| LOC111354368 | neuroligin-4 | 10.6960 | 53.0543 | 2.2710 | 0.0005 |
| LOC111353581 | esterase FE4 | 56.1103 | 173.585 | 1.6292 | 0.0041 |
| LOC111360085 | acetylcholinesterase | 2656.034 | 7885.301 | 1.5698 | 6.38 × 10⁻⁶ |
| LOC111350208 | venom carboxylesterase-6 | 982.7963 | 469.8686 | −1.0656 | 0.0144 |
| LOC111362777 | liver carboxylesterase B-1 | 160.2841 | 70.9571 | −1.1795 | 0.0028 |
| LOC111358723 | cholinesterase 1 | 16,835.48 | 7140.08 | −1.2375 | 0.0036 |
| LOC111349671 | esterase E4 | 3680.21 | 1548.673 | −1.2490 | 0.0050 |
| LOC111362663 | esterase FE4 | 726.0367 | 278.5143 | −1.3836 | 4.71 × 10⁻⁵ |
| LOC111362657 | bile salt-activated lipase | 2306.892 | 870.5927 | −1.4061 | 0.0050 |
| LOC111350695 | esterase FE4 | 1904.922 | 711.3719 | −1.4215 | 0.0014 |
| LOC111350701 | bile salt-activated lipase | 706.9501 | 239.1579 | −1.5651 | 0.0084 |
| LOC111362653 | esterase FE4 | 436.2362 | 144.3666 | −1.5973 | 0.0022 |
| LOC111358473 | juvenile hormone esterase | 5104.886 | 1636.45 | −1.6415 | 7.51 × 10⁻⁵ |
| LOC111358740 | cholinesterase 1 | 4253.409 | 1281.325 | −1.7312 | 6.72 × 10⁻⁵ |
| LOC111349999 | esterase E4 | 2440.619 | 728.2988 | −1.7452 | 0.0002 |
| LOC111350413 | cholinesterase 2 | 1890.97 | 560.4996 | −1.7549 | 0.0009 |
| LOC111357771 | uncharacterized LOC111357771 | 7112.863 | 2000.605 | −1.8301 | 0.0018 |
| LOC111350646 | acetylcholinesterase-like | 4633.256 | 1161.321 | −1.9966 | 0.0002 |
| LOC111350412 | cholinesterase 2 | 1018.842 | 239.2248 | −2.0916 | 4.85 × 10⁻⁵ |
| LOC111353514 | bile salt-activated lipase | 4112.892 | 874.7928 | −2.2335 | 4.40 × 10⁻⁶ |
| LOC111352711 | esterase FE4 | 705.1868 | 135.7773 | −2.3783 | 1.16 × 10⁻⁵ |
| LOC111359444 | cholinesterase 1 | 1651.381 | 309.4374 | −2.4160 | 1.08 × 10⁻⁹ |
| LOC111362652 | acetylcholinesterase-like | 431.1727 | 75.45582 | −2.5187 | 1.34 × 10⁻⁵ |
| LOC111349252 | esterase B1 | 6211.798 | 888.4212 | −2.8059 | 1.17 × 10⁻¹¹ |
| LOC111355173 | para-nitrobenzyl esterase | 62.3453 | 6.9451 | −3.1797 | 3.31 × 10⁻⁷ |
| Glutathione S-transferase | |||||
| LOC111349158 | glutathione S-transferase 1 | 695.0768 | 20,166.12 | 4.8588 | 1.16 × 10⁻¹³ |
| LOC111356016 | glutathione S-transferase-like | 252.7765 | 743.835 | 1.5576 | 0.0003 |
| LOC111353755 | glutathione S-transferase 2 | 674.6568 | 1625.799 | 1.2701 | 0.0022 |
| LOC111359043 | pyrimidodiazepine synthase | 8507.134 | 19,130.03 | 1.1691 | 0.0116 |
| LOC111360716 | failed axon connections | 74.3522 | 154.7961 | 1.0601 | 0.0071 |
| LOC111363938 | metaxin-1 | 111.9925 | 50.8929 | −1.1422 | 0.0073 |
| LOC111355027 | glutathione S-transferase 1 | 165.9887 | 73.52613 | −1.1773 | 0.0005 |
| LOC111349356 | uncharacterized LOC111349356 | 406.9973 | 159.2776 | −1.3556 | 0.0139 |
| LOC111355916 | glutathione S-transferase 1 | 3748.005 | 1440.041 | −1.3801 | 0.0013 |
| LOC111355915 | glutathione S-transferase 1 | 9381.018 | 3157.125 | −1.5712 | 0.0023 |
| LOC111351682 | glutathione S-transferase 1 | 10,388.87 | 3375.88 | −1.6218 | 0.00078 |
| LOC111354038 | uncharacterized LOC111354038 | 75,761.86 | 22,874.34 | −1.7277 | 5.15 × 10⁻⁶ |
| LOC111351683 | glutathione S-transferase 1 | 1588.893 | 449.4796 | −1.8219 | 2.42 × 10⁻⁶ |
| LOC111353905 | glutathione S-transferase 2 | 1243.536 | 342.7152 | −1.8601 | 1.45 × 10⁻⁷ |
| LOC111351684 | glutathione S-transferase 1 | 3947.215 | 1084.812 | −1.8634 | 6.19 × 10⁻⁶ |
| LOC111347873 | glutathione S-transferase 1 | 1314.675 | 360.5861 | −1.8668 | 0.0023 |
| LOC111351681 | glutathione S-transferase 1 | 3145.222 | 580.4061 | −2.4382 | 2.22 × 10⁻¹¹ |
| Cytochrome P450 | |||||
| LOC111362174 | cytochrome P450 6k1-like | 105.8283 | 69,473.7 | 9.3599 | 3.08 × 10−46 |
| LOC111356842 | cytochrome P450 6B6 | 231.7913 | 81,754.59 | 8.4622 | 6.31 × 10−63 |
| LOC111348641 | cytochrome P450 6B1 | 5.862026 | 407.2171 | 6.1330 | 0.0031 |
| LOC111360789 | probable cytochrome P450 305a1 | 1.954246 | 47.1659 | 4.6182 | 1.87 × 10⁻⁶ |
| LOC111364006 | cytochrome P450 9e2 | 26.28453 | 572.3499 | 4.4647 | 3.12 × 10⁻¹⁵ |
| LOC111354121 | cytochrome P450 6B6 | 67.53937 | 1455.844 | 4.4314 | 7.08 × 10⁻²⁹ |
| LOC111355823 | cytochrome P450 6B5 | 190.4009 | 2531.378 | 3.7308 | 9.72 × 10⁻¹⁰ |
| LOC111351731 | cytochrome P450 9e2 | 1254.484 | 15,917.49 | 3.6659 | 2.41 × 10⁻¹³ |
| LOC111362693 | cytochrome P450 6B5 | 64.3353 | 629.8111 | 3.2822 | 3.54 × 10⁻¹⁷ |
| LOC111351850 | cytochrome P450 18a1 | 23.85004 | 175.475 | 2.8879 | 1.85 × 10⁻⁶ |
| LOC111360254 | cytochrome P450 6B2 | 578.855 | 3923.949 | 2.7610 | 4.98 × 10⁻⁵ |
| LOC111349331 | uncharacterized LOC111349331 | 4.44703 | 26.796 | 2.6392 | 0.0009 |
| LOC111355611 | cytochrome P450 6B6 | 12.77467 | 77.1950 | 2.5895 | 1.00 × 10⁻⁵ |
| LOC111355507 | probable cytochrome P450 6a13 | 924.8003 | 5556.457 | 2.5868 | 1.51 × 10⁻¹⁰ |
| LOC111359605 | uncharacterized LOC111359605 | 2481.81 | 14,894.9 | 2.5854 | 1.94 × 10⁻⁷ |
| LOC111355002 | cytochrome P450 6B2 | 19.17594 | 112.3051 | 2.5569 | 1.35 × 10⁻⁷ |
| LOC111354277 | probable cytochrome P450 301a1 | 40.4871 | 153.1612 | 1.9281 | 0.0018 |
| LOC111361821 | ecdysone 20-monooxygenase | 204.7222 | 726.7638 | 1.8277 | 1.11 × 10⁻⁹ |
| LOC111355325 | cytochrome P450 6B2 | 1609.141 | 5636.928 | 1.8086 | 5.04 × 10⁻⁸ |
| LOC111360297 | cytochrome P450 6B5 | 3525.977 | 10,898.34 | 1.6280 | 4.65 × 10⁻⁵ |
| LOC111347816 | probable cytochrome P450 49a1 | 119.0582 | 352.8756 | 1.5677 | 3.83 × 10⁻⁶ |
| LOC111355678 | probable cytochrome P450 6a13 | 2675.074 | 7503.362 | 1.4879 | 0.0103 |
| LOC111359340 | cytochrome P450 9e2 | 3180.774 | 8024.88 | 1.3352 | 0.0049 |
| LOC111358240 | cytochrome P450 CYP12A2 | 536.533 | 1261.287 | 1.2334 | 0.0018 |
| LOC111352136 | NADPH–cytochrome P450 reductase | 3667.327 | 1772.239 | −1.0494 | 0.0137 |
| LOC111358520 | cytochrome P450 4d2 | 602.4715 | 277.1223 | −1.1202 | 0.0036 |
| LOC111358557 | cytochrome P450 4d2 | 23,612.04 | 9980.55 | −1.2423 | 0.0108 |
| LOC111359601 | uncharacterized LOC111359601 | 2497.045 | 6350.117 | −1.3466 | 0.0002 |
| LOC111354972 | cytochrome P450 4C1 | 373.917 | 144.394 | −1.3743 | 0.0084 |
| LOC111362178 | cytochrome P450 6k1 | 1018.111 | 365.548 | −1.4785 | 0.0154 |
| LOC111358860 | cytochrome P450 6B2 | 5049.159 | 1726.827 | −1.5481 | 0.0009 |
| LOC111352928 | cytochrome P450 4g1 | 2367.485 | 636.8526 | −1.8945 | 1.65 × 10⁻⁶ |
| LOC111355451 | probable cytochrome P450 304a1 | 354.1661 | 83.6607 | −2.0858 | 1.33 × 10⁻⁹ |
| LOC111355009 | cytochrome P450 4C1 | 7093.722 | 914.6282 | −2.9552 | 2.16 × 10⁻¹³ |
| LOC111355116 | cytochrome P450 6B6 | 18,808.81 | 1298.406 | −3.8567 | 9.99 × 10⁻¹⁰ |
| Gene Name | Gene Description | Cou-24 | Cou-48 | Log2FC | p-Value |
|---|---|---|---|---|---|
| Carboxylesterase | |||||
| LOC111362652 | acetylcholinesterase-like | 86.9740 | 1124.752 | 3.6972 | 2.70 × 10⁻¹⁰ |
| LOC111362658 | bile salt-activated lipase-like | 88.1408 | 289.8123 | 1.7178 | 5.45 × 10⁻¹⁰ |
| LOC111350412 | cholinesterase 2-like | 275.3892 | 1693.132 | 2.6216 | 6.09 × 10⁻⁷ |
| LOC111358884 | esterase FE4-like | 1335.792 | 4039.308 | 1.5969 | 1.04 × 10⁻⁶ |
| LOC111358150 | juvenile hormone esterase-like | 25.4487 | 123.1515 | 2.2870 | 9.77 × 10⁻⁶ |
| LOC111349120 | juvenile hormone esterase-like | 4.1534 | 32.2946 | 2.9614 | 1.35 × 10⁻⁵ |
| LOC111359060 | acyl-protein thioesterase 2 | 695.2824 | 1401.097 | 1.0116 | 4.96 × 10⁻⁵ |
| LOC111350724 | cholinesterase 2-like | 8.3791 | 66.7068 | 3.0232 | 0.0001 |
| LOC111350646 | acetylcholinesterase-like | 1337.498 | 5676.586 | 2.0858 | 0.0002 |
| LOC111358740 | cholinesterase 1 | 1472.923 | 3836.439 | 1.3814 | 0.0008 |
| LOC111353514 | bile salt-activated lipase-like | 1005.366 | 3377.045 | 1.7483 | 0.0010 |
| LOC111350208 | venom carboxylesterase-6 | 540.4641 | 1439.223 | 1.4139 | 0.0014 |
| LOC111349999 | esterase E4 | 836.7409 | 2310.262 | 1.4657 | 0.001493 |
| LOC111347824 | venom carboxylesterase-6 | 1761.006 | 778.9888 | −1.1770 | 0.0033 |
| LOC111355173 | para-nitrobenzyl esterase | 7.990478 | 30.3958 | 1.9470 | 0.003954 |
| LOC111354368 | neuroligin-4 | 60.4712 | 25.0773 | −1.2749 | 0.0069 |
| LOC111358473 | juvenile hormone esterase | 1879.844 | 3913.159 | 1.0580 | 0.0077 |
| LOC111354760 | juvenile hormone esterase-like | 890.4963 | 2087.991 | 1.2300 | 0.0080 |
| LOC111349671 | esterase E4 | 1779.289 | 4029.061 | 1.1794 | 0.0091 |
| LOC111362777 | liver carboxylesterase B-1 | 81.2561 | 30.2480 | −1.4280 | 0.0101 |
| Glutathione S-transferase | |||||
| LOC111349356 | uncharacterized LOC111349356 | 183.4426 | 975.2341 | 2.4125 | 2.57 × 10⁻⁵ |
| LOC111350537 | maleylacetoacetate isomerase 2 | 371.1178 | 178.4307 | −1.0574 | 0.0013 |
| LOC111351681 | glutathione S-transferase 1 | 665.3634 | 1336.893 | 1.0075 | 0.0002 |
| LOC111351683 | glutathione S-transferase 1 | 515.4423 | 1607.81 | 1.6423 | 7.70 × 10⁻⁸ |
| LOC111354038 | uncharacterized LOC111354038 | 26,201.41 | 61,566.75 | 1.2325 | 0.0001 |
| LOC111360716 | failed axon connections | 176.875 | 67.81142 | −1.3852 | 9.73 × 10⁻⁵ |
| LOC111362354 | ganglioside-induced differentiation-associated protein 1 | 9.444761 | 46.72668 | 2.3120 | 0.0021 |
| LOC111362825 | ganglioside-induced differentiation-associated protein 1 | 9.6691 | 67.8948 | 2.8149 | 0.0019 |
| LOC111349159 | glutathione S-transferase 1 | 874.2036 | 2515.824 | 1.5254 | 0.0028 |
| Cytochrome P450 | |||||
| LOC111348641 | cytochrome P450 6B1 | 464.3755 | 31.5317 | −3.8818 | 1.40 × 10⁻¹⁰ |
| LOC111354466 | cytochrome P450 6B5 | 3093.616 | 17,813.34 | 2.5257 | 1.84 × 10⁻⁸ |
| LOC111357007 | cytochrome P450 4C1-like | 3.2233 | 38.0246 | 3.5722 | 7.39 × 10⁻⁷ |
| LOC111351850 | cytochrome P450 18a1 | 199.1587 | 38.9521 | −2.3552 | 7.20 × 10⁻⁵ |
| LOC111356966 | uncharacterized LOC111356966 | 33.9002 | 3.3296 | −3.3401 | 0.0001 |
| LOC111355611 | cytochrome P450 6B6-like | 88.6764 | 281.5663 | 1.6713 | 0.0003 |
| LOC111349331 | uncharacterized LOC111349331 | 30.4936 | 6.4089 | −2.2582 | 0.0004 |
| LOC111362178 | cytochrome P450 6k1-like | 421.0712 | 1851.439 | 2.1373 | 0.0007 |
| LOC111349515 | cytochrome P450 6B6 | 1377.623 | 662.0387 | −1.0576 | 0.0015 |
| LOC111362693 | cytochrome P450 6B5 | 718.5333 | 183.6519 | −1.9690 | 0.0016 |
| LOC111351731 | cytochrome P450 9e2 | 18,089.6 | 4118.491 | −2.1350 | 0.0016 |
| LOC111364006 | cytochrome P450 9e2 | 650.4838 | 143.5995 | −2.1804 | 0.0021 |
| LOC111359518 | cytochrome P450 9e2 | 3733.961 | 1712.212 | −1.1250 | 0.0024 |
| LOC111360469 | cytochrome P450 4C1 | 1.07224 | 12.1195 | 3.6048 | 0.0028 |
| LOC111352136 | NADPH–cytochrome P450 reductase | 2034.177 | 4703.494 | 1.2095 | 0.0037 |
| LOC111360789 | probable cytochrome P450 305a1 | 53.7626 | 12.2715 | −2.1290 | 0.0047 |
| Gene Name | Gene Description | Cou-0 | Cou-24 | Log2FC | p-Value |
|---|---|---|---|---|---|
| Glycolysis/Gluconeogenesis | |||||
| LOC111355527 | pyruvate kinase-like | 10,029.49 | 2008.17 | −2.3204 | 3.80 × 10⁻¹² |
| LOC111360804 | triosephosphate isomerase | 3097.679 | 619.1088 | −2.3234 | 2.42 × 10⁻¹⁰ |
| LOC111347932 | enolase | 10,153.42 | 2413.292 | −2.0730 | 2.11 × 10⁻⁹ |
| LOC111356188 | phosphoglycerate kinase | 2259.451 | 461.2755 | −2.2926 | 6.49 × 10⁻⁹ |
| LOC111354384 | probable pyruvate dehydrogenase E1 | 3054.369 | 813.3595 | −1.9093 | 8.15 × 10⁻⁸ |
| LOC111353812 | dihydrolipoyllysine-residue acetyltransferase | 4060.126 | 1149.014 | −1.8214 | 1.73 × 10⁻⁷ |
| LOC111360723 | acetyl-coenzyme A synthetase | 3195.666 | 552.6376 | −2.5323 | 6.23 × 10⁻⁷ |
| LOC111355302 | alcohol dehydrogenase | 2186.852 | 7120.034 | 1.7034 | 8.51 × 10⁻⁷ |
| LOC111353761 | glyceraldehyde-3-phosphate dehydrogenase | 21,385.76 | 6552.904 | −1.7065 | 1.27 × 10⁻⁶ |
| LOC111359970 | phosphoglycerate mutase 1 | 2525.376 | 707.2699 | −1.8365 | 1.66 × 10⁻⁶ |
| LOC111348281 | aldehyde dehydrogenase | 49,571.64 | 11,593.98 | −2.0962 | 1.69 × 10⁻⁶ |
| LOC111353109 | ATP-dependent 6-phosphofructokinase | 754.5358 | 236.7817 | −1.6736 | 4.41 × 10⁻⁶ |
| LOC111356157 | pyruvate dehydrogenase E1 | 3664.081 | 1203.187 | −1.6066 | 4.95 × 10⁻⁶ |
| LOC111358748 | alcohol dehydrogenase class-3 | 7719.941 | 2166.966 | −1.8330 | 1.19 × 10⁻⁵ |
| LOC111355208 | fructose-1,6-bisphosphatase 1 | 622.5551 | 1580.132 | 1.3445 | 2.60 × 10⁻⁵ |
| LOC111349213 | dihydrolipoyl dehydrogenase | 6660.689 | 2382.305 | −1.4835 | 3.61 × 10⁻⁵ |
| LOC111350235 | aldehyde dehydrogenase | 5779.774 | 1693.489 | −1.7712 | 6.37 × 10⁻⁵ |
| LOC111351185 | glucose-6-phosphate isomerase | 431.2507 | 192.815 | −1.1634 | 0.0002 |
| LOC111348104 | phosphoglucomutase-2 | 1575.345 | 679.847 | −1.2129 | 0.0005 |
| LOC111350817 | phosphoenolpyruvate carboxykinase | 8196.958 | 2194.445 | −1.9014 | 0.0006 |
| LOC111359778 | multiple inositol polyphosphate phosphatase 1 | 13.3643 | 55.7705 | 2.0892 | 0.0007 |
| LOC111351708 | putative aldehyde dehydrogenase | 12909.5 | 6377.753 | −1.0173 | 0.0008 |
| LOC111360440 | fructose-bisphosphate aldolase | 8408.846 | 4001.305 | −1.0715 | 0.0021 |
| LOC111355564 | retinal dehydrogenase 1 | 86.5984 | 1068.766 | 3.6245 | 0.0028 |
| LOC111360439 | fructose-bisphosphate aldolase | 2010.322 | 773.8903 | −1.3773 | 0.0060 |
| Citrate cycle (TCA cycle) | |||||
| LOC111362068 | pyruvate carboxylase | 2486.594 | 8433.716 | 1.7623 | 5.34 × 10⁻¹² |
| LOC111351290 | dihydrolipoyllysine-residue succinyltransferase | 7572.191 | 1970.042 | −1.9425 | 1.79 × 10⁻⁹ |
| LOC111354947 | probable isocitrate dehydrogenase | 3068.617 | 925.75 | −1.7293 | 4.72 × 10⁻⁸ |
| LOC111354384 | probable pyruvate dehydrogenase E1 | 3054.369 | 813.3595 | −1.9093 | 8.15 × 10⁻⁸ |
| LOC111348413 | malate dehydrogenase | 10839.8 | 2870.69 | −1.9169 | 9.22 × 10⁻⁸ |
| LOC111359296 | aconitate hydratase | 13267.16 | 3354.373 | −1.9838 | 9.58 × 10⁻⁸ |
| LOC111353812 | dihydrolipoyllysine-residue acetyltransferase | 4060.126 | 1149.014 | −1.8214 | 1.73 × 10⁻⁷ |
| LOC111356489 | fumarate hydratase | 2038.518 | 720.9951 | −1.5001 | 3.09 × 10⁻⁷ |
| LOC111359992 | malate dehydrogenase | 15,350.17 | 4136.996 | −1.8917 | 6.61 × 10⁻⁷ |
| LOC111357468 | succinate dehydrogenase cytochrome b560 subunit | 3175.645 | 872.7566 | −1.8635 | 6.86 × 10⁻⁷ |
| LOC111360629 | probable citrate synthase | 19,544.5 | 5754.938 | −1.7640 | 2.94 × 10⁻⁶ |
| LOC111356157 | pyruvate dehydrogenase E1 | 3664.081 | 1203.187 | −1.6066 | 4.95 × 10⁻⁶ |
| LOC111351504 | ATP-citrate synthase | 2735.836 | 1023.545 | −1.4187 | 5.31 × 10⁻⁶ |
| LOC111350483 | succinate dehydrogenase | 5595.091 | 2138.591 | −1.3875 | 2.97 × 10⁻⁵ |
| LOC111349213 | dihydrolipoyl dehydrogenase | 6660.689 | 2382.305 | −1.4835 | 3.61 × 10⁻⁵ |
| LOC111353386 | isocitrate dehydrogenase | 10,257.99 | 3219.758 | −1.6718 | 5.30 × 10⁻⁵ |
| LOC111357097 | isocitrate dehydrogenase | 2194.843 | 935.3239 | −1.2307 | 6.02 × 10⁻⁵ |
| LOC111348703 | succinate-CoA ligase | 5418.423 | 2189.555 | −1.3073 | 8.66 × 10⁻⁵ |
| LOC111357155 | succinate dehydrogenase | 3485.447 | 1600.493 | −1.1230 | 0.0003 |
| LOC111350817 | phosphoenolpyruvate carboxykinase | 8196.958 | 2194.445 | −1.9013 | 0.0006 |
| LOC111349733 | 2-oxoglutarate dehydrogenase | 7347.055 | 2748.649 | −1.4185 | 0.0007 |
| LOC111356570 | fumarate hydratase | 210.9027 | 70.2749 | −1.5860 | 0.0009 |
| LOC111353246 | succinate-CoA ligase | 3228.557 | 1464.208 | −1.1411 | 0.0011 |
| Gene Name | Gene Description | Cou-24 | Cou-48 | Log2FC | p-Value |
| Glycolysis/Gluconeogenesis | |||||
| LOC111354384 | probable pyruvate dehydrogenase E1 | 933.7818 | 2266.246 | 1.2798 | 0.0002 |
| LOC111360804 | triosephosphate isomerase | 710.7908 | 1714.832 | 1.2714 | 0.0002 |
| LOC111349213 | dihydrolipoyl dehydrogenase | 2735.847 | 6653.498 | 1.2823 | 0.0002 |
| LOC111353812 | dihydrolipoyllysine-residue acetyltransferase | 1319.113 | 2866.238 | 1.1200 | 0.0010 |
| Citrate cycle (TCA cycle) | |||||
| LOC111351290 | dihydrolipoyllysine-residue succinyltransferase | 2258.894 | 5411.073 | 1.2606 | 3.14 × 10⁻⁷ |
| LOC111359296 | aconitate hydratase | 3853.49 | 11,312.4 | 1.5538 | 9.75 × 10⁻⁶ |
| LOC111353386 | isocitrate dehydrogenase | 3700.217 | 10,874.93 | 1.5555 | 7.44 × 10⁻⁵ |
| LOC111356489 | fumarate hydratase | 826.2778 | 1681.034 | 1.0254 | 0.0001 |
| LOC111354384 | probable pyruvate dehydrogenase E1 | 933.7818 | 2266.246 | 1.2798 | 0.0002 |
| LOC111349213 | dihydrolipoyl dehydrogenase | 2735.847 | 6653.498 | 1.2823 | 0.0002 |
| LOC111354947 | probable isocitrate dehydrogenase | 1062.391 | 2351.336 | 1.1467 | 0.0003 |
| LOC111357468 | succinate dehydrogenase | 1001.409 | 2087.434 | 1.0603 | 0.0004 |
| LOC111360629 | probable citrate synthase | 6612.958 | 15,702.9 | 1.2478 | 0.0007 |
| LOC111359992 | malate dehydrogenase | 4751.662 | 10,447.04 | 1.1367 | 0.0008 |
| LOC111353812 | dihydrolipoyllysine-residue acetyltransferase | 1319.113 | 2866.238 | 1.1200 | 0.0010 |
| LOC111349733 | 2-oxoglutarate dehydrogenase | 3161.409 | 7903.156 | 1.3220 | 0.0021 |
Disclaimer/Publisher’s Note: The statements, opinions and data contained in all publications are solely those of the individual author(s) and contributor(s) and not of MDPI and/or the editor(s). MDPI and/or the editor(s) disclaim responsibility for any injury to people or property resulting from any ideas, methods, instructions or products referred to in the content. |
© 2023 by the authors. Licensee MDPI, Basel, Switzerland. This article is an open access article distributed under the terms and conditions of the Creative Commons Attribution (CC BY) license (https://creativecommons.org/licenses/by/4.0/).
Share and Cite
Xia, T.; Liu, Y.; Lu, Z.; Yu, H. Natural Coumarin Shows Toxicity to Spodoptera litura by Inhibiting Detoxification Enzymes and Glycometabolism. Int. J. Mol. Sci. 2023, 24, 13177. https://doi.org/10.3390/ijms241713177
Xia T, Liu Y, Lu Z, Yu H. Natural Coumarin Shows Toxicity to Spodoptera litura by Inhibiting Detoxification Enzymes and Glycometabolism. International Journal of Molecular Sciences. 2023; 24(17):13177. https://doi.org/10.3390/ijms241713177
Chicago/Turabian StyleXia, Tao, Yan Liu, Zhanjun Lu, and Haizhong Yu. 2023. "Natural Coumarin Shows Toxicity to Spodoptera litura by Inhibiting Detoxification Enzymes and Glycometabolism" International Journal of Molecular Sciences 24, no. 17: 13177. https://doi.org/10.3390/ijms241713177
APA StyleXia, T., Liu, Y., Lu, Z., & Yu, H. (2023). Natural Coumarin Shows Toxicity to Spodoptera litura by Inhibiting Detoxification Enzymes and Glycometabolism. International Journal of Molecular Sciences, 24(17), 13177. https://doi.org/10.3390/ijms241713177