Article

Genome-Wide Identification of GATA Family Genes in Phoebe bournei and Their Transcriptional Analysis under Abiotic Stresses

1
College of Forestry, Fujian Agriculture and Forestry University, Fuzhou 350002, China
2
University Key Laboratory of Forest Stress Physiology, Ecology and Molecular Biology of Fujian Province, College of Forestry, Fujian Agriculture and Forestry University, Fuzhou 350002, China
*
Author to whom correspondence should be addressed.
These authors contributed equally to this work.
Int. J. Mol. Sci. 2023, 24(12), 10342; https://doi.org/10.3390/ijms241210342
Submission received: 19 April 2023 / Revised: 13 June 2023 / Accepted: 16 June 2023 / Published: 19 June 2023

Abstract

:
GATA transcription factors are crucial proteins in regulating transcription and are characterized by a type-IV zinc finger DNA-binding domain. They play a significant role in the growth and development of plants. While the GATA family gene has been identified in several plant species, it has not yet been reported in Phoebe bournei. In this study, 22 GATA family genes were identified from the P. bournei genome, and their physicochemical properties, chromosomal distribution, subcellular localization, phylogenetic tree, conserved motif, gene structure, cis-regulatory elements in promoters, and expression in plant tissues were analyzed. Phylogenetic analysis showed that the PbGATAs were clearly divided into four subfamilies. They are unequally distributed across 11 out of 12 chromosomes, except chromosome 9. Promoter cis-elements are mostly involved in environmental stress and hormonal regulation. Further studies showed that PbGATA11 was localized to chloroplasts and expressed in five tissues, including the root bark, root xylem, stem bark, stem xylem, and leaf, which means that PbGATA11 may have a potential role in the regulation of chlorophyll synthesis. Finally, the expression profiles of four representative genes, PbGATA5, PbGATA12, PbGATA16, and PbGATA22, under drought, salinity, and temperature stress, were detected by qRT-PCR. The results showed that PbGATA5, PbGATA22, and PbGATA16 were significantly expressed under drought stress. PbGATA12 and PbGATA22 were significantly expressed after 8 h of low-temperature stress at 10 °C. This study concludes that the growth and development of the PbGATA family gene in P. bournei in coping with adversity stress are crucial. This study provides new ideas for studying the evolution of GATAs, provides useful information for future functional analysis of PbGATA genes, and helps better understand the abiotic stress response of P. bournei.

1. Introduction

The growth and development of plants is a continuous process typically starting from seed germination and ending with seed maturation. During these stages, plants must face and respond to a variety of environmental conditions. Plant responses to environmental challenges are commonly mediated through transcription factors that regulate gene expression of their target genes via cis-acting elements in the promoter. Therefore, the study of transcription factors is important to understand genetic control of gene expression in many plant metabolic pathways [1,2]. Many well-known families of transcription factors have been demonstrated in plants, such as GATA (GATA-binding factor) [3], bZIP (Basic leucine zipper) [4], MYB (Myeloblastosis) [5], NAC [6,7,8,9,10], bHLH (Basic helix–loop–helix) [11], ERF (Ethylene response factor) [12], CBF (CRT-binding factor) [13], and WRKY [11].
GATA-binding transcription factors are a family of proteins found in eukaryotes, including fungi, animals, and plants [14,15,16]. These proteins contain one or two highly conserved zinc finger DNA-binding domains that match the common sequence C-X2-C-X18–20-C-X2-C, followed by a basic region [17,18]. Fungal GATA factors are known to regulate various processes such as nitrogen metabolism, photo-induction, siderophore biosynthesis, and mating-type switching [14]. These factors typically contain the C-X2-C-X17-C-X2-C or C-X2-C-X18-C-X2-C domains [14]. Six GATA family members have been found in vertebrates, and there is a certain evolutionary relationship between them [15]. The GATA family of transcription factors is involved in multiple processes of plant growth and development and plays an important role in biological processes such as abiotic stress and secondary metabolism [16].
GATA factor was first discovered in tobacco (Nicotiana tabacum) and was found to be similar to the NIT2 gene in Neurospora crassa. The Ntl1 gene, which encodes the GATA factor, is believed to regulate the nitrate assimilation pathway due to its weak nitrate inducibility and regulation by light [19]. Subsequently, the GATA family has been identified in several plant species, including Arabidopsis thaliana [16], Oryza sativa [16,20], Eucalyptus urophylla [3], and Solanum lycopersicum [21]. GATA factor has been shown to inhibit the flowering of A. thaliana [22]. Research has demonstrated that LLM-domain B-class GATA genes are involved in the control of stomata formation, and these genes operate before the regulators of stomata formation, namely SPEECHLESS (SPCH), MUTE, and SCREAM/SCREAM2, and also function in conjunction with or separately from the patterning regulators TOO MANY MOUTHS and STOMATAL DENSITY AND DISTRIBUTION1 [23]. In the previous study, seven cucumber GATA genes were involved in chloroplast development and chlorophyll biosynthesis, four cucumber GATA genes were also associated with low nitrogen, and there were six cucumber GATA genes with both anti-abiotic and biotic stress functions [24]. In Chinese pears (Pyrus bretschneideri), the GATA gene has been found to play an important role in hormone signaling pathways [25]. In addition, GNC and CGA1 have been shown to play an important role in plant nitrogen assimilation [26]. Previous studies have indicated that GATA transcription factors play a significant role in various physiological and biochemical processes, including but not limited to plant photoresponse, chloroplast development, chlorophyll biosynthesis, low nitrogen response, hormone synthesis, and regulation of plant response to drought and salinity stress. Despite the vast size of the GATA gene family, the majority of GATA genes’ biological functions remain unexplored and require further investigation.
The diversity of forest ecosystems has brought great benefits and impacts to people’s life, while forests also regulate the carbon cycle in the atmosphere and alleviate problems such as soil acidification [27,28,29]. Phoebe bournei is widely distributed in southern China and is one of the important tree species that make up forests. Phoebe bournei is evergreen trees or shrubs of the genus Phoebe in the Lauraceae family and is a globally endangered species in the Lauraceae family [30]. It has a wood aroma, and its tough material, which is not easy to crack and process, is widely used in wood carving art and building construction, with high economic value and ecological value. However, extreme environments such as cold stress and drought stress hinder the growth of P. bournei [31,32]. Transcription factors have a profound effect on enhancing plant cold and salinity tolerance [33,34,35,36,37], helping plants cope with extreme temperatures [38,39,40,41], and regulating plant hormones [42,43]. GATA transcription factors, in particular, have been found in numerous plants but have not been explored in P. bournei. Therefore, this study systematically analyzed the GATA transcription factor of P. bournei and predicted and analyzed its physicochemical properties, phylogenetic relationships, chromosome localization, gene structure, protein-conserved group sequence, cis-acting element, and qRT-PCR detection, which provided a solid foundation for further improving the stress resistance of P. bournei and exploring the GATA family gene.

2. Results

2.1. Identification of PbGATA Genes in P. bournei

A total of 22 GATA genes were identified in the P. bournei genome, and these genes were renamed as PbGATA1~PbGATA22 according to their distribution positions on the P. bournei chromosome (Table 1 and Figure 1). The 22 GATA proteins encode amino acids between 139 aa and 835 aa. The size of a protein is usually proportional to the length of its amino acid sequence. In this study, the 22 PbGATA proteins had a relative molecular weight that ranged from 15,586.05 Da (PbGATA18) to 94,357.56 Da (PbGATA11). In total, 12 PbGATA proteins were acidic (pI < 7.0), and the remaining 10 were alkaline. Moreover, they were all unstable proteins (instability index > 40), with a range of 41.87 to 76.26. The results demonstrated that the aliphatic index ranges from 50.73 to 84.42, with an average value of 62.82, reflecting the thermal stability of the PbGATA protein. The PbGATA proteins were all hydrophilic proteins, according to the grand average of hydropathicity, which was negative. Approximately 16 PbGATA proteins were predicted to be localized in the nucleus via subcellular localization, followed by five in the cytoplasm, and one in the chloroplast, named PbGATA11.

2.2. Phylogenetic Analysis and Sequence Alignment of GATA Proteins

A maximum likelihood phylogenetic tree was created using MEGA 7.0.21 software based on the multiple sequence alignment of 22 PbGATA proteins, 30 AtGATA proteins, and 35 MdGATA proteins in order to examine the phylogenetic relationship and biological function of the GATA genes among various species and classify the GATA genes discovered in P. bournei (Figure 2). The PbGATA family proteins were classified into four clusters (A, B, C, and D) based on the classification of Arabidopsis and M. domestica GATA proteins [18,44]. Subfamily A had the most PbGATA proteins (nine), accounting for 40.9% of the total PbGATA proteins among the four categorized subfamilies. This was followed by subfamilies B (seven), C (five), and D, the last of which has the fewest GATA proteins with only one member (4.54%), PdGATA5. It is thought that PbGATA retains all four subfamilies across evolution, but the number of GATA genes varies between species.
Their conserved domain sequences were aligned in order to further investigate the 22 PbGATA proteins’ sequence characteristics. The multiple sequence alignment showed that the conserved domain C-X2-C-X18–20-C-X2-C was present in all GATA proteins (Figure 3 and Figure 4B), and its secondary structure includes four β collapse and an α helix. The analysis showed that the zinc finger domains of most GATA amino acid sites in P. bournei were conservative.

2.3. PbGATA Protein Gene Structure and Conserved Motif Analysis

Exon/intron organization analysis of 22 PbGATA genes indicated that the number of exons in GATA genes ranged from 1 (PbGATA20) to 18 (PbGATA11). Subfamily B had the fewest average exons per gene (three), whereas subfamily C had the most (nine). Except for subfamily A, the structural properties of the PbGATA genes within the same subfamily were comparable but differed between subfamilies (Figure 4). For instance, each PbGATA gene in subfamily C had eight or more exons, whereas the genes in subfamily B had two or three exons, with a maximum of five. With the exception of PbGATA11, all components of subfamily A have comparable gene structure features.
The 22 PbGATA proteins had a total of 10 conserved motifs, denoted as motifs 1 through 10. Similar conserved motif compositions were frequently present in the majority of the GATA proteins from the same subfamily (Figure 5B). In total, five of the 22 PbGATAs only contained motif 1. Overall, nine of the 22 PbGATAs contained motif 1 and 2. In addition, nine of the 22 PbGATAs contained motifs 2 and 1, and five contained motifs 1 and 10. Motif 1 occurs in all subfamilies, and, according to Figure 3 and Figure 5C, this motif is annotated as the GATA zinc finger domain. Individual motifs occur only in specific subfamilies, for example, motifs 5 and 9 occur only in subfamily A, motif 8 occurs only in subfamily B, and motifs 6, 7, 3, 4, and 10 occur only in subfamily D.
As a consequence, the PbGATA subfamily categorization is further supported by shared gene structures, conserved motif arrangements, and phylogenetic trees within the same subfamily. The variety of the quantity, arrangement, and distribution of diverse motifs in different subfamilies may be what differentiates them from one another.

2.4. Cis-Acting Elements Analysis of the PbGATA Gene Family

By detecting 2000 bp promoter sequences upstream of the PbGATA gene, studies show 24 cis-acting elements in the promoter region of the PbGATA family, such as ARE, AAGAA-motif, ABRE, Box 4, and so on, which involve four components of environmental stress reaction: plant growth and development, hormone response, and light response (Figure 6 and Table S1). Among them, the largest number of elements of function is the classification of stress response (285), followed by the classification of hormone response (262), and the smallest is the classification of plant growth and development (111). The drought related cis-element MYB (91), the pressure-resistant cis-element STRE (79), and the MeJA-responsiveness-related element MYC (123) were present in 22 PbGATAs, in large quantities. The results suggest that PbGATA family genes may be more sensitive to stress and hormonal responses.
The subfamilies A, B, C, and D contained 353, 271, 139, and 47 cis-acting elements, respectively, of which the subfamily A PbGATA19 (50) contained the largest number of cis-elements, followed by PbGATA17 (49) of subfamily B and PbGATA5 (47) of subfamily D; CAT-boxes were the least absent (7). The WUN-motif is not present in subfamily C, which may be due to the weak response of the subfamily to wounds; subfamily B does not have the CCGTCC-box cis-acting element, possibly because this subfamily plays a less important role in plant growth. In a nutshell, the cis-elements study suggested that while a considerable number of PbGATA genes are expected to respond to diverse environmental stresses, their impact on plant growth and development is rather minor.

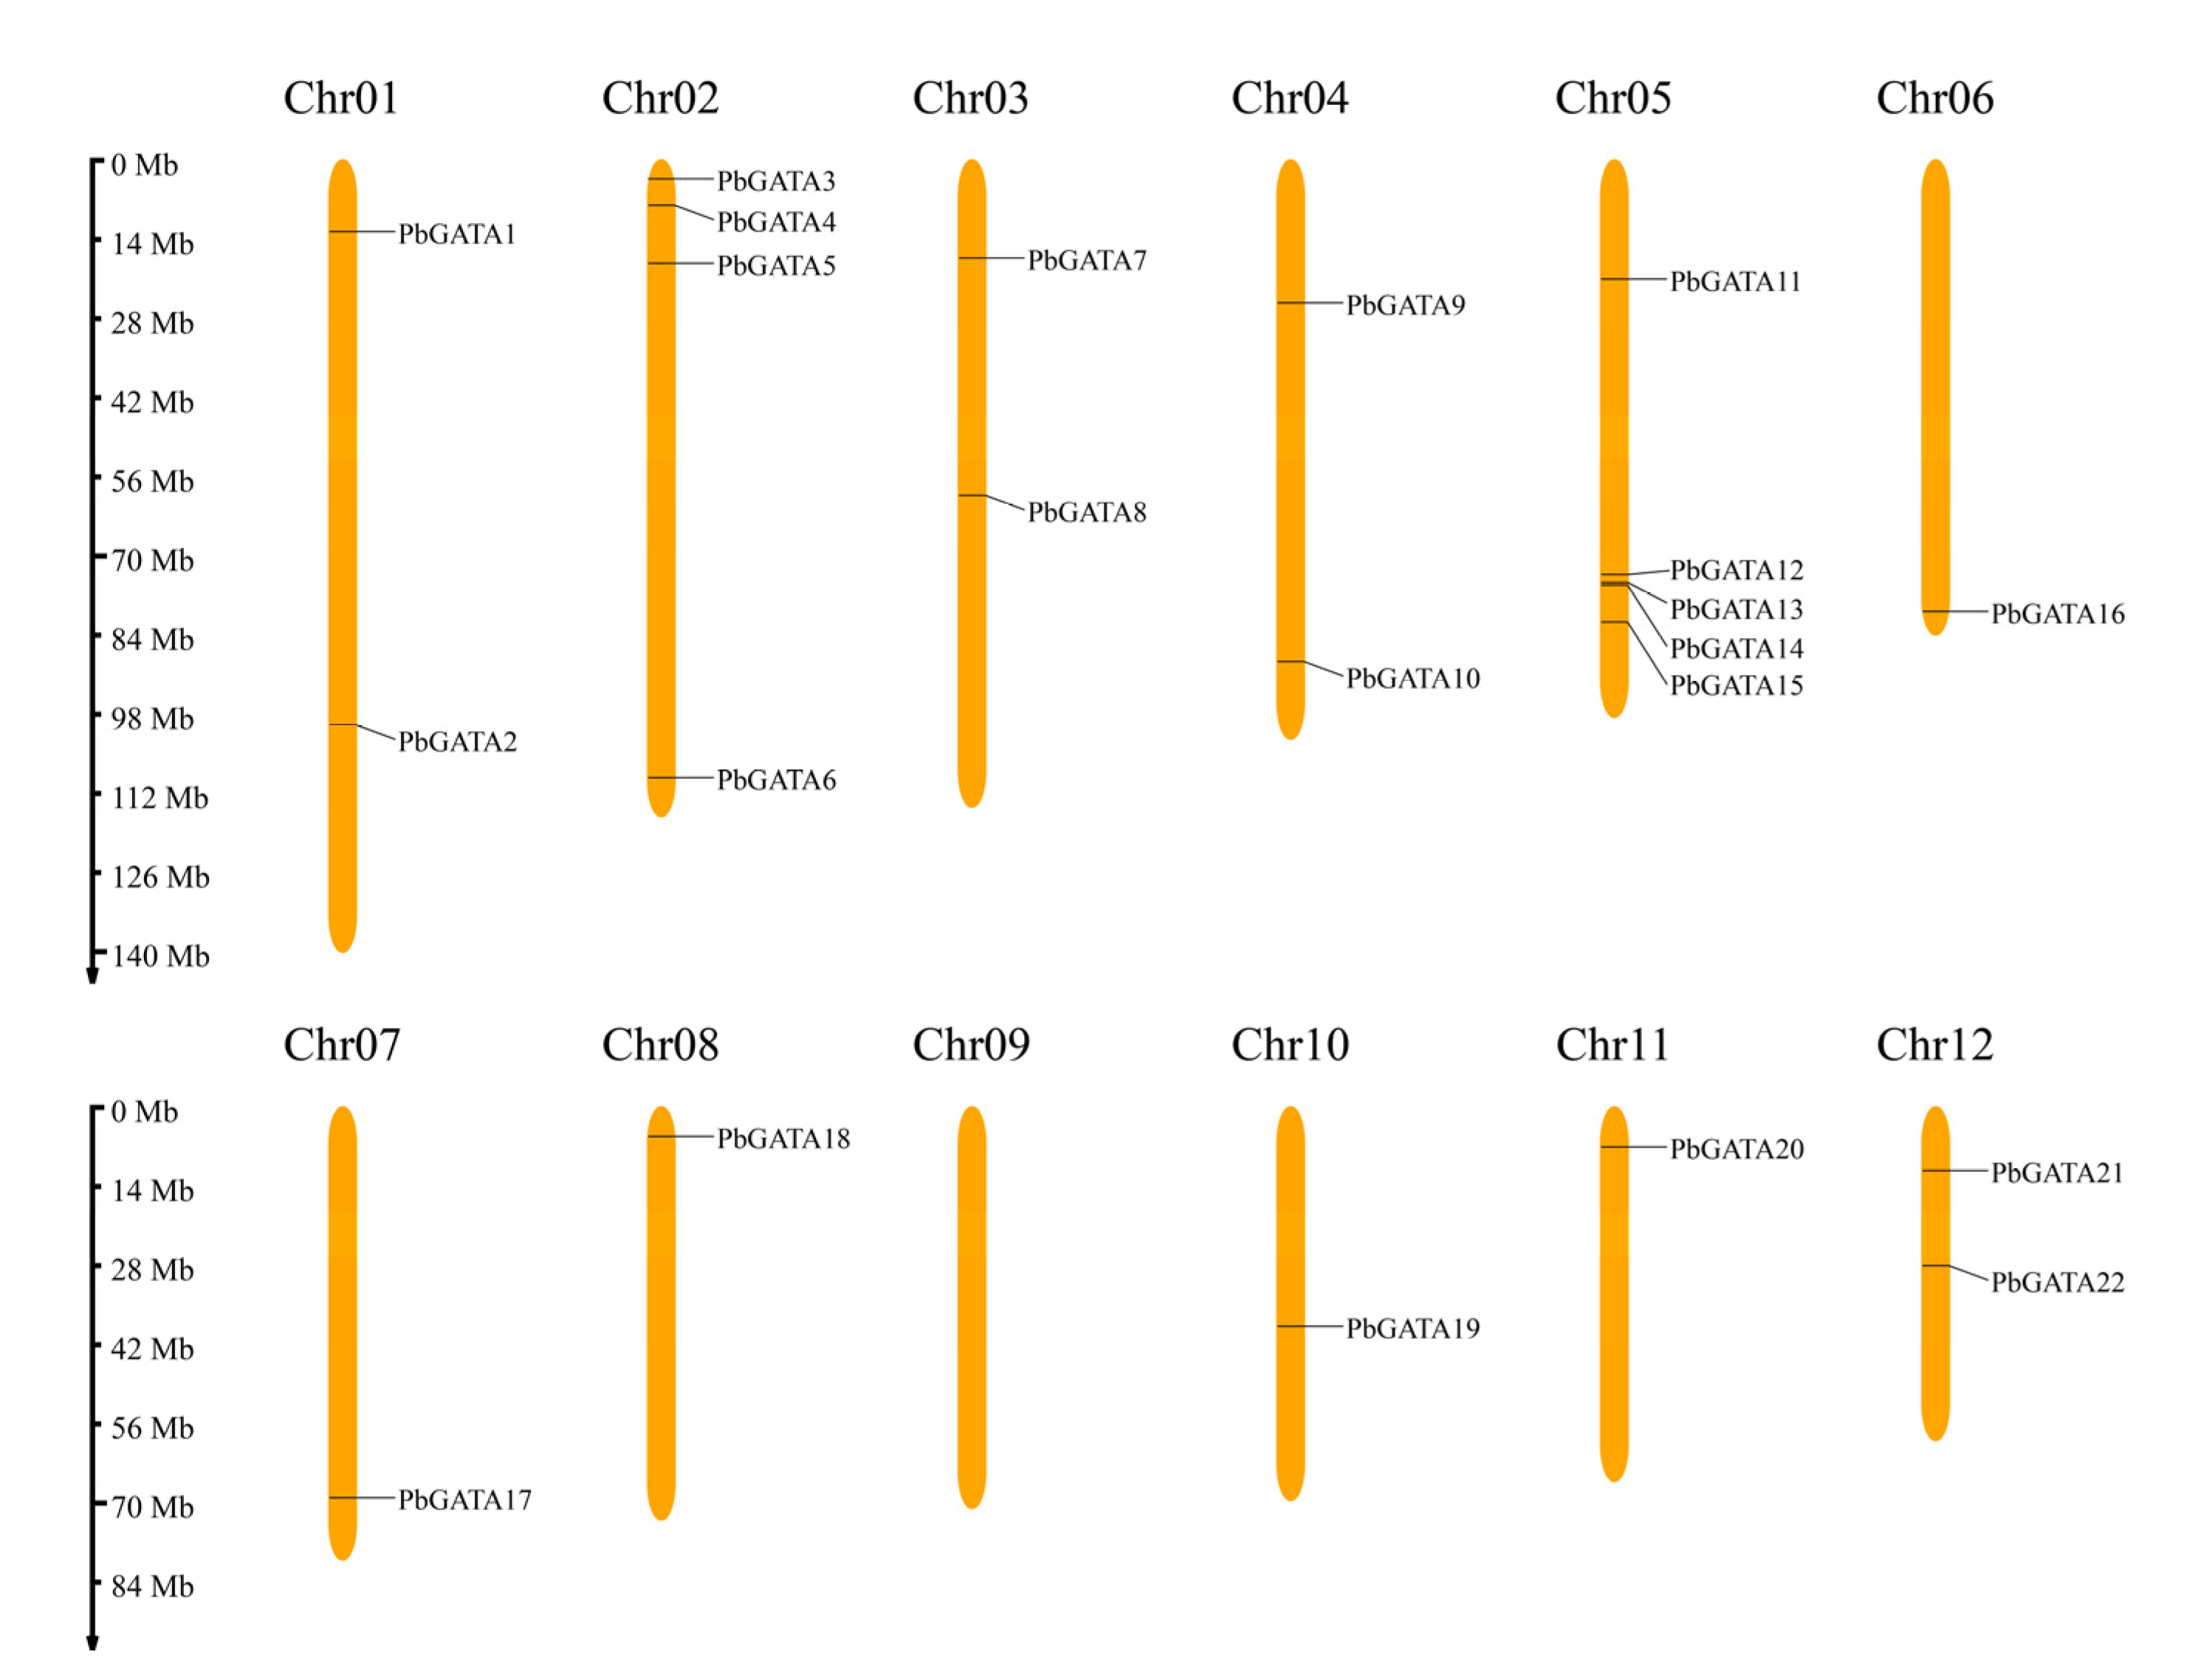
2.5. The Distribution, Genomic Synteny, and Gene Duplication of PbGATA Genes

According to the P. bournei genome annotation, 22 PbGATA genes were mapped to eleven chromosomes, except chromosome 09 (Figure 1). Of these, chromosome 05 had the most GATA genes (up to five), followed by chromosome 02, which had four GATA genes. Tandem replication events are defined as two or more closely related genes scattered in the range of 200 KB, whereas fragment replication events are defined as pairs of homologous genes placed on distinct chromosomes [45]. In the PbGATA genes, we found no tandem repeats (Figure 1). In addition, fragment repeat events were identified using TBtools (Figure 7). PbGATA1/13, PbGATA5/12, PbGATA6/14, PbGATA6/16, PbGATA11/21, and PbGATA14/16 were among the genes with a fragment replication event. Of the six pairs of genes with fragment repeat events, three pairs of PbGATA genes belonged to subfamily C, two pairs belonged to subfamily A, and one pair belonged to subfamily B.
The results showed that these duplication episodes are the major driving factor behind the increase in the number of PbGATA genes, and subfamily A and subfamily C, which contain a relatively significant number of PbGATA genes, may have been enlarged throughout the entire genome duplication process. Segmental duplication events may be important in the increase in the number of PbGATA genes in P. bournei.
To further study the evolutionary mechanism of the PbGATA family, the collinearity of PbGATA gene pairs between the Arabidopsis genome, the Oryza sativa genome, the Populus thichocarpa genome, and the Glycine max genome was compared (Figure 8). The results showed that PbGATA formed 13 collinearity gene pairs with AtGATA, 17 collinearity gene pairs with OsGATA, 26 collinearity gene pairs with PtGATA, and 36 collinearity gene pairs with GmGATA.
Multiple PbGATA genes have been identified as homologous genes of a single AtGATA, OsGATA, PtGATA, and GmGATA gene. Similarly, there are multiple AtGATA, OsGATA, PtGATA, and GmGATA genes that are homogeneous to a single PbGATA gene. From this collinearity relationship, we can think that the amplification of this gene family may occur before the differentiation of P. bournei, Arabidopsis, rice, etc.

2.6. Expression Analysis of PbGATAs in P. bournei Tissues

The expression patterns of the 22 PbGATAs were compared in five P. bournei tissues: the root bark, the root xylem, the stem bark, the stem xylem, and the leaf (Figure 9 and Table S2). The lowest expression was in the root xylem and the greatest was in the stem bark in five separate tissues, and the overall expression of bark tissue was higher than the total expression of the xylem and leaves. In subfamily A, except for PbGATA19, which was only expressed in the bark and leaf tissues, the remaining eight genes were expressed in various tissues, of which the expression of PbGATA11 was the highest among the 22 PbGATAs. In subfamily B, PbGATA18, which was expressed in all five tissues, and the remaining genes were only expressed in some tissues. For example, PbGATA10 was only expressed in the root bark and was the least expressed. PbGATA12 and PbGATA3 were expressed at low levels or absent in other tissues but were at high levels in the leaf tissue, presumably due to the fact that these genes are largely involved in leaf growth and development. Subfamily C genes were expressed in all five tissues and had the highest average expression. While subfamily D has just one gene, it was expressed in all five organs. These findings suggested that the expression levels of PbGATA vary within and between the subfamilies.

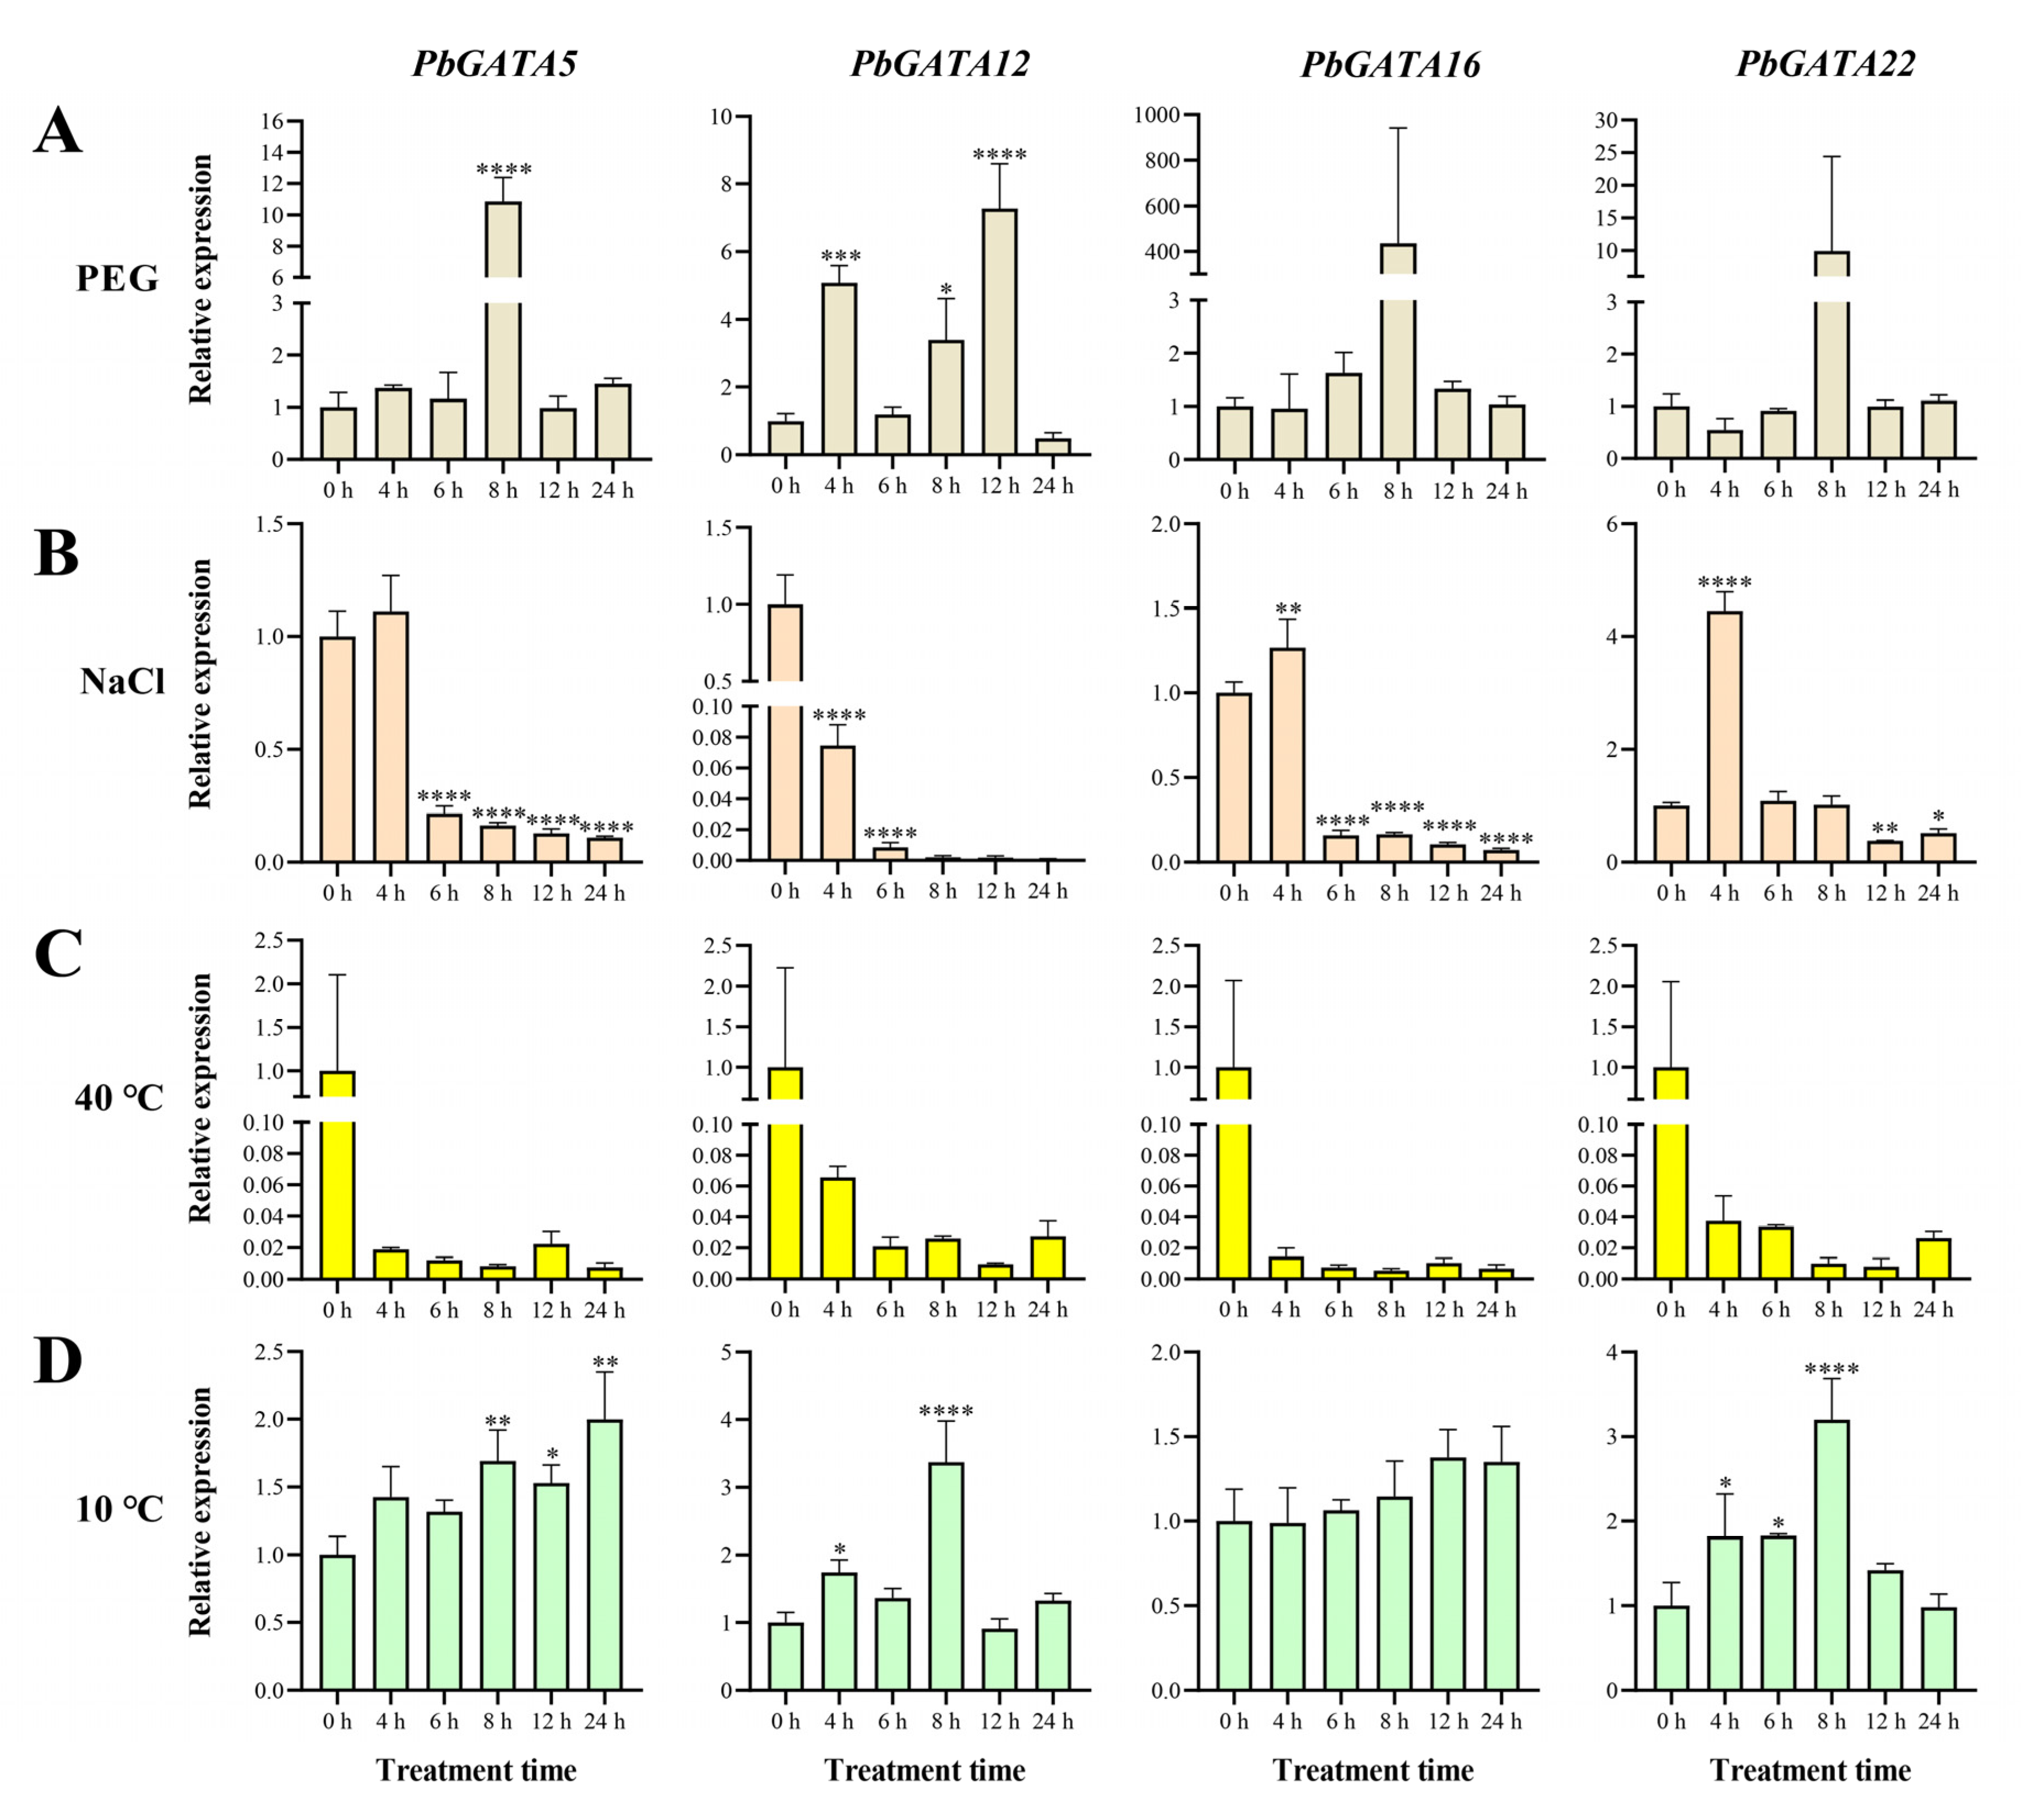
2.7. Expression of PbGATA Genes under Abiotic Stress

Four representative genes, PbGATA5, PbGATA12, PbGATA16, and PbGATA22, were chosen in order to study their expression in response to temperature, salinity, and drought stress. These four genes originated from four subfamilies, all of which had more stress-related cis-acting elements and were highly expressed in the leaves (Figure 5 and Figure 9). The results showed that drought, salt, and temperature affected the expression levels of the PbGATA gene (Table S3). Under the immersion treatment of 10% PEG6000 nutrient solution (Figure 10), the expression of PbGATA5 and PbGATA22 increased significantly by about 10 times 8 h after treatment compared with before the start of treatment, and the expression of PbGATA16 was extremely high. Based on these results, we suspect that PbGATA5, PbGATA22, and PbGATA16 play an important role in coping with drought stress. Under 10% NaCl stress, we found that PbGATA5 and PbGATA12 were inhibited to varying degrees, but the upregulation of PbGATA16 and PbTAGA22 began at 4 h after treatment, and PbTAGA22 had higher upregulation than PbGATA16.
Under 40 °C treatment, the expression of each gene showed varying degrees of downregulation, indicating that the expression of the PbGATA gene was not visible under high-temperature stress. Each gene changed in distinct ways when exposed to 10 °C compared to the control group. The expression of PbGATA12 and PbGATA22 was particularly high after 8 h of treatment. Therefore, we hypothesize that PbGATA12 and PbGATA22 have a significant effect on low-temperature stress in P. bournei.

3. Discussion

GATA transcription factors have been demonstrated to play an important role in plant salt tolerance [21,46], temperature stress [47], chlorophyll production [26], and hormone treatment [48]. Because of the importance of the GATA gene family in abiotic stress and plant growth and development, it has been studied in plants such as peanuts [49] and cucumbers [24], but genome-wide discovery of the PbGATA family gene has not been pursued. As a result, genome-wide characterization and expression investigation of the GATA gene family will aid in our understanding of the GATA gene’s function and involvement in P. bournei.
In this research, we used bioinformatics to identify the PbGATA family gene and discovered 22 PbGATA genes separated into four subfamilies (Figure 2). Like A. thaliana and M. domestica [18,44], PbGATA is distributed in the highest number in subfamily A, subfamily B is second, and in subfamily D, it is the least numerous. We found that P. bournei had eight and 13 GATA members less than Arabidopsis and apple, respectively. There are different evolutionary branches of the PbGATA family in P. bournei. The GATA family members of the three were cross-distributed, and no separate branches were found (Figure 2). This proves that the GATA family gene of dicots has no obvious variation in the evolutionary direction for the time being and is still conserved.
The leaf-transcriptome profiles of P. bournei treated with varying drought stress revealed that numerous domains, including the GATA zinc finger domain, displayed distinct expression patterns between the treatment’s internal conjunction processes [32,50,51]. The GATA paralog transcription factors GNC and CGA1 regulated nitrogen assimilation in green tissues by modulating the expression of chloroplast-localized GLUTAMATE SYNTHASE (GLU1/Fd-GOGAT), hence influencing the number of chloroplasts and the proportionate transcription level of leaf starch [26,52]. GATA genes Csa3G165640, Csa5G622830, Csa3G843820, Csa6G405920, Csa6G502700, Csa6G504690, and Csa7G452960 have also been implicated in chlorophyll biosynthesis regulation in cucumbers [24]. The GATA genes GmGATA58 and PdGATA19 have been shown to be important in controlling chlorophyll production in soybean [53]. Several of the preceding investigations revealed that various GATA genes are directly connected to the physiological function of chlorophyll, influencing plant physiological processes. It is worth exploring the fact that our analysis of the predictions of PbGATA subcellular localization shows that most PbGATA is localized in the cytoplasm and nucleus, and only PbGATA11 is localized in the chloroplasts (Table 1). Moreover, PbGATA11 has the largest molecular weight, and the expression is also highest in the root epidermis, root xylem, stem epidermis, stem xylem, and leaves (Figure 9). We speculate that the function and role of this gene are related to the physiological activity of chloroplasts, which needs to be proven by further experiments.
Variations in conserved motif and gene structure across GATA protein family members are key factors for functional variability [49,54]. A PbGATA motif study revealed that ZnF_GATA, a critical domain for identifying PbGATA genes, was strongly conserved in virtually all PbGATA genes (Figure 4). The PbGATA gene’s conserved domain was discovered by multiple sequence alignment to be C-X2-C-X18–20-C-X2-C, which is compatible with the conserved domain previously identified in peppers [48], whereas two subfamilies of cabbage rape have the N-X2-C-X18-CX2C domain, not the C-X2-C-X18–20-C-X2-C conserved domain, and one subfamily of the GATA gene of cucumbers has the C-X4-C-X18-C-X2-C domain [24,55]. Baseline analysis and replication events established links between subfamily A and the remaining three subfamilies of the PbGATA family gene [56]. There is a correlation of amino acid sequences between subfamily A and subfamilies B, C, and D of the GATA family gene [57]. Only St4CL1 in subfamily A in the potato 4CL family gene has motif 6, and all St4CLs in subfamily B contain motif 6, and an important reason for its phylogenetic differentiation is the change in amino acids in motif 6 [58]. In the conservative motifs analysis of this study, motif 9 is only distributed in subfamily A. This suggests that motif 9 may be the evolutionary cause of subfamily A of the PbGATA gene (Figure 5). St4CL1 and St4CL2 are tandem replicate genes in potato subfamily A; however, St4CL2 lacks motif 6, indicating that one of the reasons the St4CL family gene split into two forms was due to the loss of motif 6 in this gene tandem repeat event [58]. In the fragment replication event of PbGATA, PbGATA5 is a fragment replication gene with PbGATA12, but PbGATA12 does not have motif 3, motif 4, and motif 10, and motif 8 is added, which indicates that the deletion of motif 3, 4, and 10 and the increase in motif 8 occur in this gene fragment duplication event, which may lead to the differentiation of the PbGATA family gene into subfamily B and subfamily D types from here. Thus, motifs 3, 4, 10, and 8 are also genetic and phylogenetic connections between subfamilies B and D.
The response of genes to stress Is closely related to the cis-element present in the gene [59]. For example, CBF1 can promote C-repeat/DRE binding to cope with low-temperature and dehydration stress in Arabidopsis [60]. The CaGATA gene in chickpeas regulates the response to water stress [61]. The qRT-PCR analysis showed that the PbGATA gene had a relatively obvious response to PEG6000-simulated drought, salt, and 10 °C low-temperature stress (Figure 10). At the same time, cis-acting elements linked with drought stress, such as MYB (drought-related element), were found in the promoter region of the PbGATA genes, including PbGATA16, PbGATA5, and PbGATA22 (Table S1). Among the four representative genes selected, PbGATA16 had the most MYB cis-elements. Therefore, it is reasonable to guess that PbGATA5, PbGATA22, and especially PbGATA16 play an important role in the response to drought stress in P. bournei. The upstream signal of the ICE-CBF cascade is JA, and cold stress induces the accumulation of endogenous JA, actively modulating the cold tolerance of A. thaliana. Plant hormones have an important influence on regulating plant metabolism, salt resistance, and drought tolerance [62]. In OsLPXC knockout plant leaves in rice plants under low-temperature stress, a large accumulation of MDA and electrolyte leakage occur with the inhibition of JA biosynthesis [63]. In this study, the four representative genes were upregulated to varying degrees under low temperature treatment at 10 °C. We found that MYC (MeJA-responsiveness) promoters are present in the cis-component of these genes and in the largest number in the PbGATA12 gene. Cold promotes the accumulation of JA, leading to MYC2 regulating ADC1 expression, which in turn prompts tomato plants to cope with low-temperature stress [64,65]. Therefore, we suspect that the function of PbGATA in response to low-temperature stress is related to the MeJA response regulated by the cis-element. Based on the above findings, the role of PbGATA genes under drought and low-temperature stress in P. bournei can be predicted (Figure 11) [64,66].

4. Materials and Methods

4.1. Identification of PbGATA Genes in P. bournei

The P. bournei genome assembly file was downloaded from China National GeneBank DataBase [67] (CNGBdb) (https://db.cngb.org/ (accessed on 5 December 2022)). A specific hidden Markov model (HMM) of GATA transcription factor [68] (Pfam number: PF00320) was used to search for the candidate GATA genes in the P. bournei genome. Then, we further used the NCBI Conserved Domain Database (NCBI-CDD) (https://www.ncbi.nlm.nih.gov/Structure/bwrpsb/bwrpsb.cgi (accessed on 5 December 2022)) to verify the candidate sequences and deleted genes that did not belong to the GATA transcription factor family [69]. Ultimately, a total of 22 PbGATA genes were identified and renamed according to their position on the chromosomes. Furthermore, the ExPASy online tool (http://www.expasy.ch/tools/pi_tool.html (accessed on 5 December 2022)) was used to determine the physicochemical characteristics of all PbGATA proteins, including amino acid number (size), molecular weight (MW), theoretical isoelectric point (pI), instability index, aliphatic index, and grand average of hydropathicity (GRAVY). Finally, we predicted the subcellular localization of PbGATA proteins using WoLF PSORT (https://wolfpsort.hgc.jp/ (accessed on 6 December 2022))

4.2. Phylogenetic Analysis

GATA protein full-length sequences of Arabidopsis and M. domestica were obtained from PlantTFDB (http://planttfdb.gao-lab.org/ (accessed on 6 December 2022)) [70]. Multiple sequence alignment of three plants’ GATA protein amino acids was conducted by MUSCLE function in MEGA 7.0.21 with default parameters [71]. Additionally, the sequence alignment results were further visualized with Jalview 2.11.2.6 software [72]. The MEGA 7.0.21 program was applied to produce the phylogenetic tree using the maximum likelihood (ML) approach with the best-fit model “JTT + F + I” and 1000 bootstrap replication times. The phylogenetic trees were visualized and further enhanced with the iTOL website (https://itol.embl.de/itol.cgi (accessed on 6 December 2022)).

4.3. Gene Structures, Conserved Domain and Protein Motifs Analysis

Distribution information on exons and introns was obtained from P. bournei genome GFF files [67]. The conserved domain of the PbGATA proteins was uploaded and verified by the NCBI-CDD Database [69]. Conservative motifs of protein sequences were exhibited by MEME suite (http://meme-suite.org/tools/meme (accessed on 6 December 2022)) [73] with the following two parameters: the maximum motif number was 10 and the distribution of motif site occurrences was zero or one per sequence. Finally, the intron–exon structure, conserved domain, and 10 motifs of the PbGATA proteins were illustrated by Tbtools [74].

4.4. Chromosomal Location, Gene Duplication, and Collinearity Relationship

Information on the location of the PbGATA genes was found based on the GFF annotation files of the P. bournei genome [67]. Taking advantage of MG2C v2.1 (http://mg2c.iask.in/mg2c_v2.1/ (accessed on 7 December 2022)), the chromosome location pattern was produced. Gene duplication patterns of the PbGATA family gene were identified and examined by Tbtools [74]. The genome files of four other plant species, namely, Arabidopsis, rice, poplar, and soybean, were obtained from the NCBI. Then, the collinearity relationships of PbGATA with the four above species were analyzed and plotted using the “Advanced Circos” functional plate in Tbtools [74].

4.5. Cis-Elements in the Promoter and Expression Analysis of PbGATA Genes

The 2000 bp upstream sequence of PbGATAs were extracted and served as the promoter sequence used to identify cis-elements and prediction using PlantCARE (https://bioinformatics.psb.ugent.be/webtools/plantcare/html/ (accessed on 7 December 2022)) [75]. The positions and numbers of the cis-elements were visualized by Tbtools [74]. RNA-seq data of different tissues in P. bournei were downloaded from the NCBI database using BioProject accession number PRJNA628065 [69].

4.6. Plant Materials and Abiotic Stresses Treatment

One-year-old P. bournei seedings were collected from Fujian Academy of Forestry and grown under natural conditions. During the stress treatment period, the seedlings were cultured in an artificial climate incubator with a temperature of 25 °C and a humidity of 75%. Then, the P. bournei seedlings were exposed to salt stress (10% NaCl solution), drought stress (10% PEG6000), cold stress (4 °C), and heat stress (40 °C). Samples of mature leaves were collected at 0 (CK), 4, 6, 8, 12, and 24 h. The control group (CK) was treated with distilled water and/or normal growth conditions. Then, the P. bournei leaves obtained after treatment were immediately placed in liquid nitrogen and stored in a refrigerator at −80 °C for further RNA extraction.

4.7. RNA Extraction and qRT-PCR Analysis

Total RNA of the collected leaf tissue was extracted from the control group and the stress-treated samples using a HiPure Plant RNA Mini Kit (Magen). cDNA was synthesized with a PrimeScript RT reagent Kit (Perfect Real Time) (TaKaRa). qRT-PCR was conducted to evaluate the expression profiles of PbGATA genes in response to stress treatment. The specific primers used in the qRT-PCR experiment were designed by the Primer 3 website (http://bioinfo.ut.ee/primer3-0.4.0/ (accessed on 27 March 2023)) and are listed in Supplementary Table S4. PbEF1α was obtained as a reference gene (GenBank number, KX682032.1) [31]. The raw Cq values were analyzed by the 2−ΔΔCT method and compared with the reference gene [76]. All experiments were performed with three biological replicates and three technical replicates. The relative transcriptional expression levels were subjected to one-way ANOVA and multiple comparisons with the control group at the 5% significance level via GraphPad Prism 8.3.0 software.

5. Conclusions

In conclusion, the PbGATA genes are crucial for the growth of P. bournei and hence have vital potential for the enhancement of this extremely commercially relevant woody plant. These genes were classified into four subfamilies based on a phylogenetic study and their gene structure, which is congruent with the previously stated GATA family. Our findings shine a spotlight on the evolution of the GATA family gene in angiosperms. PbGATA genes are hydrophilic proteins that are unstable. The conserved domains are C-X2-C-X18–20-C-X2-C. The prediction of cis-elements and the expression trend of the PbGATA subfamilies indicate that they participate in a series of physiological processes of different tissues, especially in coping with drought stress, which was also reflected in the subsequent qRT-PCR analysis results. PbGATA16, PbGATA22, and PbGATA5 are vital in dealing with drought stress, whereas PbGATA12 and PbGATA22 are important in dealing with low-temperature stress. Fragment replication events are important in PbGATA gene amplification, and amplification can occur before P. bournei, Arabidopsis, and rice differentiation. This study provides a scientific basis for further exploration of the GATA family gene of P. bournei and also complements the comprehensive study of GATA transcription factors.

Supplementary Materials

The supporting information can be downloaded at: https://www.mdpi.com/article/10.3390/ijms241210342/s1.

Author Contributions

Conceptualization, Z.Y., W.L. and S.C. (Shijiang Cao); methodology, S.C. (Shijiang Cao); software, W.L.; data curation, W.L.; formal analysis, W.L.; writing—original draft preparation, Z.Y.; writing—review and editing, Z.Y., W.L., J.P. and S.Y.; investigation, J.L.; supervision, S.C. (Shijiang Cao); project administration, S.C. (Shipin Chen); visualization, Z.Y. and W.L. All authors have read and agreed to the published version of the manuscript.

Funding

This research was funded by Fujian Province Seed Industry Innovation and Industrialization Project “Innovation and Industrialization Development of Precious Tree Seed Industries (P. bournei)” (ZYCX-LY-202102); Sub-project of National Key R&D Program “P. bournei Efficient Cultivation Technology” (2016YFD0600603-2) co-funded.

Institutional Review Board Statement

Not applicable.

Informed Consent Statement

Not applicable.

Data Availability Statement

All the data and materials that are required to reproduce these findings can be shared by contacting the corresponding author.

Acknowledgments

We would like to sincerely express our gratitude to the teacher, Xinghao Tang, who comes from Fujian Academy of Forestry, for providing the P. bournei one-year-old seedings and artificial climate incubators, as well as for his help and guidance in the revision of the manuscript.

Conflicts of Interest

The authors declare no conflict of interest.

References

  1. Lindemose, S.; O′Shea, C.; Jensen, M.K.; Skriver, K. Structure, Function and Networks of Transcription Factors Involved in Abiotic Stress Responses. Int. J. Mol. Sci. 2013, 14, 5842–5878. [Google Scholar] [CrossRef] [Green Version]
  2. Franco-Zorrilla, J.M.; López-Vidriero, I.; Carrasco, J.L.; Godoy, M.; Vera, P.; Solano, R. DNA-binding specificities of plant transcription factors and their potential to define target genes. Proc. Natl. Acad. Sci. USA 2014, 111, 2367–2372. [Google Scholar] [CrossRef] [PubMed] [Green Version]
  3. Du, K.; Xia, Y.; Zhan, D.; Xu, T.; Lu, T.; Yang, J.; Kang, X. Genome-Wide Identification of the Eucalyptus urophylla GATA Gene Family and Its Diverse Roles in Chlorophyll Biosynthesis. Int. J. Mol. Sci. 2022, 23, 5251. [Google Scholar] [CrossRef] [PubMed]
  4. Éva, C.; Moncsek, B.; Szőke-Pázsi, K.; Kunos, V.; Mészáros, K.; Makai, S.; Sági, L.; Juhász, A. bZIP transcription factors repress the expression of wheat (Triticum aestivum L.) high molecular weight glutenin subunit genes in vegetative tissues. Acta Physiol. Plant. 2023, 45, 29. [Google Scholar] [CrossRef]
  5. Abdullah-Zawawi, M.-R.; Ahmad-Nizammuddin, N.-F.; Govender, N.; Harun, S.; Mohd-Assaad, N.; Mohamed-Hussein, Z.-A. Comparative genome-wide analysis of WRKY, MADS-box and MYB transcription factor families in Arabidopsis and rice. Sci. Rep. 2021, 11, 19678. [Google Scholar] [CrossRef] [PubMed]
  6. Dudhate, A.; Shinde, H.; Yu, P.; Tsugama, D.; Gupta, S.K.; Liu, S.; Takano, T. Comprehensive analysis of NAC transcription factor family uncovers drought and salinity stress response in pearl millet (Pennisetum glaucum). BMC Genom. 2021, 22, 70. [Google Scholar] [CrossRef]
  7. Nakashima, K.; Takasaki, H.; Mizoi, J.; Shinozaki, K.; Yamaguchi-Shinozaki, K. NAC transcription factors in plant abiotic stress responses. Biochim. Biophys. Acta 2012, 1819, 97–103. [Google Scholar] [CrossRef]
  8. Olsen, A.N.; Ernst, H.A.; Leggio, L.L.; Skriver, K. NAC transcription factors: Structurally distinct, functionally diverse. Trends Plant Sci. 2005, 10, 79–87. [Google Scholar] [CrossRef]
  9. Nuruzzaman, M.; Sharoni, A.M.; Kikuchi, S. Roles of NAC transcription factors in the regulation of biotic and abiotic stress responses in plants. Front. Microbiol. 2013, 4, 248. [Google Scholar] [CrossRef] [Green Version]
  10. Puranik, S.; Sahu, P.P.; Srivastava, P.S.; Prasad, M. NAC proteins: Regulation and role in stress tolerance. Trends Plant Sci. 2012, 17, 369–381. [Google Scholar] [CrossRef]
  11. Khan, I.; Asaf, S.; Jan, R.; Bilal, S.; Lubna; Khan, A.L.; Kim, K.-M.; Al-Harrasi, A. Genome-wide annotation and expression analysis of WRKY and bHLH transcriptional factor families reveal their involvement under cadmium stress in tomato (Solanum lycopersicum L.). Front. Plant Sci. 2023, 14, 1100895. [Google Scholar] [CrossRef]
  12. Khoudi, H. SHINE clade of ERF transcription factors: A significant player in abiotic and biotic stress tolerance in plants. Plant Physiol. Biochem. 2023, 195, 77–88. [Google Scholar] [CrossRef]
  13. Medina, J.; Bargues, M.; Terol, J.; Pérez-Alonso, M.; Salinas, J. The Arabidopsis CBF Gene Family Is Composed of Three Genes Encoding AP2 Domain-Containing Proteins Whose Expression Is Regulated by Low Temperature but Not by Abscisic Acid or Dehydration. Plant Physiol. 1999, 119, 463–470. [Google Scholar] [CrossRef] [PubMed] [Green Version]
  14. Scazzocchio, C. The fungal GATA factors. Curr. Opin. Microbiol. 2000, 3, 126–131. [Google Scholar] [CrossRef]
  15. Gillis, W.Q.; John, J.S.; Bowerman, B.; Schneider, S.Q. Whole genome duplications and expansion of the vertebrate GATA transcription factor gene family. BMC Evol. Biol. 2009, 9, 207. [Google Scholar] [CrossRef] [PubMed] [Green Version]
  16. Reyes, J.C.; Muro-Pastor, M.I.; Florencio, F.J. The GATA Family of Transcription Factors in Arabidopsis and Rice. Plant Physiol. 2004, 134, 1718–1732. [Google Scholar] [CrossRef] [PubMed] [Green Version]
  17. Lowry, J.A.; Atchley, W.R. Molecular Evolution of the GATA Family of Transcription Factors: Conservation Within the DNA-Binding Domain. J. Mol. Evol. 2000, 50, 103–115. [Google Scholar] [CrossRef]
  18. Krishna, S.S.; Majumdar, I.; Grishin, N.V. Structural classification of zinc fingers: SURVEY AND SUMMARY. Nucleic Acids Res. 2003, 31, 532–550. [Google Scholar] [CrossRef] [PubMed] [Green Version]
  19. Daniel-Vedele, F.; Caboche, M. A tobacco cDNA clone encoding a GATA-1 zinc finger protein homologous to regulators of nitrogen metabolism in fungi. Molec. Gen. Genet. 1993, 240, 365–373. [Google Scholar] [CrossRef]
  20. Gupta, P.; Nutan, K.K.; Singla-Pareek, S.L.; Pareek, A. Abiotic Stresses Cause Differential Regulation of Alternative Splice Forms of GATA Transcription Factor in Rice. Front. Plant Sci. 2017, 8, 1944. [Google Scholar] [CrossRef] [Green Version]
  21. Wang, Y.; Cao, X.; Zhang, D.; Li, Y.; Wang, Q.; Ma, F.; Xu, X.; Zhan, X.; Hu, T. SlGATA17, A tomato GATA protein, interacts with SlHY5 to modulate salinity tolerance and germination. Environ. Exp. Bot. 2023, 206, 105191. [Google Scholar] [CrossRef]
  22. Richter, R.; Bastakis, E.; Schwechheimer, C. Cross-Repressive Interactions between SOC1 and the GATAs GNC and GNL/CGA1 in the Control of Greening, Cold Tolerance, and Flowering Time in Arabidopsis. Plant Physiol. 2013, 162, 1992–2004. [Google Scholar] [CrossRef] [Green Version]
  23. Klermund, C.; Ranftl, Q.L.; Diener, J.; Bastakis, E.; Richter, R.; Schwechheimer, C. LLM-Domain B-GATA Transcription Factors Promote Stomatal Development Downstream of Light Signaling Pathways in Arabidopsis thaliana Hypocotyls. Plant Cell 2016, 28, 646–660. [Google Scholar] [CrossRef] [PubMed] [Green Version]
  24. Zhang, K.; Jia, L.; Yang, D.; Hu, Y.; Njogu, M.K.; Wang, P.; Lu, X.; Yan, C. Genome-Wide Identification, Phylogenetic and Expression Pattern Analysis of GATA Family Genes in Cucumber (Cucumis sativus L.). Plants 2021, 10, 1626. [Google Scholar] [CrossRef]
  25. Manzoor, M.A.; Sabir, I.A.; Shah, I.H.; Wang, H.; Yu, Z.; Rasool, F.; Mazhar, M.Z.; Younas, S.; Abdullah, M.; Cai, Y. Comprehensive Comparative Analysis of the GATA Transcription Factors in Four Rosaceae Species and Phytohormonal Response in Chinese Pear (Pyrus bretschneideri) Fruit. Int. J. Mol. Sci. 2021, 22, 12492. [Google Scholar] [CrossRef] [PubMed]
  26. Hudson, D.; Guevara, D.; Yaish, M.W.; Hannam, C.; Long, N.; Clarke, J.D.; Bi, Y.-M.; Rothstein, S.J. GNC and CGA1 Modulate Chlorophyll Biosynthesis and Glutamate Synthase (GLU1/Fd-GOGAT) Expression in Arabidopsis. PLoS ONE 2011, 6, e26765. [Google Scholar] [CrossRef]
  27. Curovic, M.; Spalevic, V.; Sestras, P.; Motta, R.; Dan, C.; Garbarino, M.; Vitali, A.; Urbinati, C. Structural and ecological characteristics of mixed broadleaved old-growth forest(Biogradska Gora-Montenegro). Turk. J. Agric. For. 2020, 44, 428–438. [Google Scholar] [CrossRef]
  28. Horemans, J.A.; Janssens, I.A.; Gielen, B.; Roland, M.; Deckmyn, G.; Verstraeten, A.; Neirynck, J.; Ceulemans, R. Weather, pollution and biotic factors drive net forest-atmosphere exchange of CO2 at different temporal scales in a temperate-zone mixed forest. Agric. For. Meteorol. 2020, 291, 108059. [Google Scholar] [CrossRef]
  29. Cerullo, G.; França, F.; Finch, T.; Erm, P.; Griffiths, H.; Louzada, J.; Bousfield, C.G.; Massam, M.R.; Peres, C.A.; Barlow, J.; et al. Sparing old-growth maximises conservation outcomes within selectively logged Amazonian rainforest. Biol. Conserv. 2023, 282, 110065. [Google Scholar] [CrossRef]
  30. Chen, B.; Zeng, Y.; Li, C.; Xu, B.; Zhang, C.; Chen, W.; Li, S.; Liu, W. Characterization of the complete chloroplast genome of the Phoebe bournei. Mitochondrial DNA Part B 2020, 5, 3291–3292. [Google Scholar] [CrossRef]
  31. Zhang, J.; Zhu, Y.; Pan, Y.; Huang, H.; Li, C.; Li, G.; Tong, Z. Transcriptomic profiling and identification of candidate genes in two Phoebe bournei ecotypes with contrasting cold stress responses. Trees 2018, 32, 1315–1333. [Google Scholar] [CrossRef]
  32. Li, X.; Liu, L.; Sun, S.; Li, Y.; Jia, L.; Ye, S.; Yu, Y.; Dossa, K.; Luan, Y. Leaf-transcriptome profiles of phoebe bournei provide insights into temporal drought stress responses. Front. Plant Sci. 2022, 13, 1010314. [Google Scholar] [CrossRef] [PubMed]
  33. Agarwal, M.; Hao, Y.; Kapoor, A.; Dong, C.-H.; Fujii, H.; Zheng, X.; Zhu, J.-K. A R2R3 Type MYB Transcription Factor Is Involved in the Cold Regulation of CBF Genes and in Acquired Freezing Tolerance. J. Biol. Chem. 2006, 281, 37636–37645. [Google Scholar] [CrossRef] [Green Version]
  34. Balazadeh, S.; Siddiqui, H.; Allu, A.D.; Matallana-Ramirez, L.P.; Caldana, C.; Mehrnia, M.; Zanor, M.-I.; Köhler, B.; Mueller-Roeber, B. A gene regulatory network controlled by the NAC transcription factor ANAC092/AtNAC2/ORE1 during salt-promoted senescence: ANAC092 Gene Regulatory Network. Plant J. 2010, 62, 250–264. [Google Scholar] [CrossRef] [PubMed]
  35. Kaplan, F.; Kopka, J.; Haskell, D.W.; Zhao, W.; Schiller, K.C.; Gatzke, N.; Sung, D.Y.; Guy, C.L. Exploring the Temperature-Stress Metabolome of Arabidopsis. Plant Physiol. 2004, 136, 4159–4168. [Google Scholar] [CrossRef] [Green Version]
  36. Thomashow, M.F. PLANT COLD ACCLIMATION: Freezing Tolerance Genes and Regulatory Mechanisms. Annu. Rev. Plant Physiol. Plant Mol. Biol. 1999, 50, 571–599. [Google Scholar] [CrossRef] [Green Version]
  37. Vogel, J.T.; Zarka, D.G.; Van Buskirk, H.A.; Fowler, S.G.; Thomashow, M.F. Roles of the CBF2 and ZAT12 transcription factors in configuring the low temperature transcriptome of Arabidopsis: Arabidopsis Low Temperature Transcriptome. Plant J. 2004, 41, 195–211. [Google Scholar] [CrossRef]
  38. Gilmour, S.J.; Zarka, D.G.; Stockinger, E.J.; Salazar, M.P.; Houghton, J.M.; Thomashow, M.F. Low temperature regulation of theArabidopsisCBF family of AP2 transcriptional activators as an early step in cold-inducedCORgene expression. Plant J. 1998, 16, 433–442. [Google Scholar] [CrossRef]
  39. Hannah, M.A.; Heyer, A.G.; Hincha, D.K. A Global Survey of Gene Regulation during Cold Acclimation in Arabidopsis thaliana. PLoS Genet. 2005, 1, e26. [Google Scholar] [CrossRef]
  40. Jaglo-Ottosen, K.R.; Gilmour, S.J.; Zarka, D.G.; Schabenberger, O.; Thomashow, M.F. Arabidopsis CBF1 Overexpression Induces COR Genes and Enhances Freezing Tolerance. Science 1998, 280, 104–106. [Google Scholar] [CrossRef] [Green Version]
  41. Wisniewski, M.; Norelli, J.; Bassett, C.; Artlip, T.; Macarisin, D. Ectopic expression of a novel peach (Prunus persica) CBF transcription factor in apple (Malus × domestica) results in short-day induced dormancy and increased cold hardiness. Planta 2011, 233, 971–983. [Google Scholar] [CrossRef]
  42. Hussain, S.; Cheng, Y.; Li, Y.; Wang, W.; Tian, H.; Zhang, N.; Wang, Y.; Yuan, Y.; Hussain, H.; Lin, R.; et al. AtbZIP62 Acts as a Transcription Repressor to Positively Regulate ABA Responses in Arabidopsis. Plants 2022, 11, 3037. [Google Scholar] [CrossRef] [PubMed]
  43. Richter, R.; Behringer, C.; Zourelidou, M.; Schwechheimer, C. Convergence of auxin and gibberellin signaling on the regulation of the GATA transcription factors GNC and GNL in Arabidopsis thaliana. Proc. Natl. Acad. Sci. USA 2013, 110, 13192–13197. [Google Scholar] [CrossRef] [Green Version]
  44. Chen, H.; Shao, H.; Li, K.; Zhang, D.; Fan, S.; Li, Y.; Han, M. Genome-wide identification, evolution, and expression analysis of GATA transcription factors in apple (Malus × domestica Borkh.). Gene 2017, 627, 460–472. [Google Scholar] [CrossRef] [PubMed]
  45. Holub, E.B. The arms race is ancient history in Arabidopsis, the wildflower. Nat. Rev. Genet. 2001, 2, 516–527. [Google Scholar] [CrossRef] [PubMed]
  46. Ahmed, B.; Alam, M.; Aktar, N.; Hossain, S.; Ullah, W.; Bashar, K.K.; Kabir, S.M.T.; Emdad, E.M.; Islam, S. Genome-wide investigation of aquaporin genes in Corchorus spp and their role in organ development and abiotic stress tolerance. Plant Gene 2023, 34, 100410. [Google Scholar] [CrossRef]
  47. Jiang, C.; Lv, G.; Ge, J.; Bin He, B.; Zhang, Z.; Hu, Z.; Bin Zeng, B. Genome-wide identification of the GATA transcription factor family and their expression patterns under temperature and salt stress in Aspergillus oryzae. AMB Express 2021, 11, 56. [Google Scholar] [CrossRef]
  48. Yu, C.; Li, N.; Yin, Y.; Wang, F.; Gao, S.; Jiao, C.; Yao, M. Genome-wide identification and function characterization of GATA transcription factors during development and in response to abiotic stresses and hormone treatments in pepper. J. Appl. Genet. 2021, 62, 265–280. [Google Scholar] [CrossRef]
  49. Li, X.; Deng, X.; Han, S.; Zhang, X.; Dai, T. Genome-Wide Identification and Expression Analysis of GATA Gene Family under Different Nitrogen Levels in Arachis hypogaea L. Agronomy 2023, 13, 215. [Google Scholar] [CrossRef]
  50. Merika, M.; Orkin, S.H. DNA-Binding Specificity of GATA Family Transcription Factors. Mol. Cell. Biol. 1993, 13, 3999–4010. [Google Scholar]
  51. Trainor, C.D.; Ghirlando, R.; Simpson, M.A. GATA Zinc Finger Interactions Modulate DNA Binding and Transactivation. J. Biol. Chem. 2000, 275, 28157–28166. [Google Scholar] [CrossRef] [PubMed] [Green Version]
  52. Chiang, Y.-H.; Zubo, Y.O.; Tapken, W.; Kim, H.J.; Lavanway, A.M.; Howard, L.; Pilon, M.; Kieber, J.J.; Schaller, G.E. Functional Characterization of the GATA Transcription Factors GNC and CGA1 Reveals Their Key Role in Chloroplast Development, Growth, and Division in Arabidopsis. Plant Physiol. 2012, 160, 332–348. [Google Scholar] [CrossRef] [PubMed] [Green Version]
  53. Zhang, C.; Huang, Y.; Xiao, Z.; Yang, H.; Hao, Q.; Yuan, S.; Chen, H.; Chen, L.; Chen, S.; Zhou, X.; et al. A GATA Transcription Factor from Soybean (Glycine max) Regulates Chlorophyll Biosynthesis and Suppresses Growth in the Transgenic Arabidopsis thaliana. Plants 2020, 9, 1036. [Google Scholar] [CrossRef]
  54. Kim, M.; Xi, H.; Park, J. Genome-wide comparative analyses of GATA transcription factors among 19 Arabidopsis ecotype genomes: Intraspecific characteristics of GATA transcription factors. PLoS ONE 2021, 16, e0252181. [Google Scholar] [CrossRef] [PubMed]
  55. Zhu, W.; Guo, Y.; Chen, Y.; Wu, D.; Jiang, L. Genome-wide identification, phylogenetic and expression pattern analysis of GATA family genes in Brassica napus. BMC Plant Biol. 2020, 20, 543. [Google Scholar] [CrossRef] [PubMed]
  56. Lu, Y.; Zhao, P.; Zhang, A.; Wang, J.; Ha, M. Genome-Wide Analysis of HSP70s in Hexaploid Wheat: Tandem Duplication, Heat Response, and Regulation. Cells 2022, 11, 818. [Google Scholar] [CrossRef]
  57. Liu, Y.; Bahar, I. Sequence Evolution Correlates with Structural Dynamics. Mol. Biol. Evol. 2012, 29, 2253–2263. [Google Scholar] [CrossRef] [Green Version]
  58. Nie, T.; Sun, X.; Wang, S.; Wang, D.; Ren, Y.; Chen, Q. Genome-Wide Identification and Expression Analysis of the 4-Coumarate: CoA Ligase Gene Family in Solanum tuberosum. Int. J. Mol. Sci. 2023, 24, 1642. [Google Scholar] [CrossRef]
  59. Du, X.; Lu, Y.; Sun, H.; Duan, W.; Hu, Y.; Yan, Y. Genome-Wide Analysis of Wheat GATA Transcription Factor Genes Reveals Their Molecular Evolutionary Characteristics and Involvement in Salt and Drought Tolerance. Int. J. Mol. Sci. 2022, 24, 27. [Google Scholar] [CrossRef]
  60. Stockinger, E.J.; Gilmour, S.J.; Thomashow, M.F. Arabidopsis thaliana CBF1 encodes an AP2 domain-containing transcriptional activator that binds to the C-repeat/DRE, a cis-acting DNA regulatory element that stimulates transcription in response to low temperature and water deficit. Proc. Natl. Acad. Sci. USA 1997, 94, 1035–1040. [Google Scholar] [CrossRef] [Green Version]
  61. Niu, L.; Chu, H.D.; Tran, C.D.; Nguyen, K.H.; Pham, H.X.; Le, D.T.; Li, W.; Wang, W.; Le, T.D.; Tran, L.-S.P. The GATA Gene Family in Chickpea: Structure Analysis and Transcriptional Responses to Abscisic Acid and Dehydration Treatments Revealed Potential Genes Involved in Drought Adaptation. J. Plant Growth Regul. 2020, 39, 1647–1660. [Google Scholar] [CrossRef]
  62. Per, T.S.; Khan, N.A.; Reddy, P.S.; Masood, A.; Hasanuzzaman, M.; Khan, M.I.R.; Anjum, N.A. Approaches in modulating proline metabolism in plants for salt and drought stress tolerance: Phytohormones, mineral nutrients and transgenics. Plant Physiol. Biochem. 2017, 115, 126–140. [Google Scholar] [CrossRef]
  63. Islam, F.; Khan, M.S.S.; Ahmed, S.; Abdullah, M.; Hannan, F.; Chen, J. OsLPXC negatively regulates tolerance to cold stress via modulating oxidative stress, antioxidant defense and JA accumulation in rice. Free Radic. Biol. Med. 2023, 199, 2–16. [Google Scholar] [CrossRef] [PubMed]
  64. Ding, F.; Wang, C.; Xu, N.; Wang, M.; Zhang, S. Jasmonic acid-regulated putrescine biosynthesis attenuates cold-induced oxidative stress in tomato plants. Sci. Hortic. 2021, 288, 110373. [Google Scholar] [CrossRef]
  65. Dombrecht, B.; Xue, G.P.; Sprague, S.J.; Kirkegaard, J.A.; Ross, J.J.; Reid, J.B.; Fitt, G.P.; Sewelam, N.; Schenk, P.M.; Manners, J.M.; et al. MYC2 Differentially Modulates Diverse Jasmonate-Dependent Functions in Arabidopsis. Plant Cell 2007, 19, 2225–2245. [Google Scholar] [CrossRef] [PubMed] [Green Version]
  66. Zhu, J.-K. Abiotic Stress Signaling and Responses in Plants. Cell 2016, 167, 313–324. [Google Scholar] [CrossRef] [PubMed] [Green Version]
  67. Han, X.; Zhang, J.; Han, S.; Chong, S.L.; Meng, G.; Song, M.; Wang, Y.; Zhou, S.; Liu, C.; Lou, L.; et al. The chromosome-scale genome of Phoebe bournei reveals contrasting fates of terpene synthase (TPS)-a and TPS-b subfamilies. Plant Commun. 2022, 3, 100410. [Google Scholar] [CrossRef]
  68. El-Gebali, S.; Mistry, J.; Bateman, A.; Eddy, S.R.; Luciani, A.; Potter, S.C.; Qureshi, M.; Richardson, L.J.; Salazar, G.A.; Smart, A.; et al. The Pfam protein families database in 2019. Nucleic Acids Res. 2019, 47, D427–D432. [Google Scholar] [CrossRef]
  69. Marchler-Bauer, A.; Bo, Y.; Han, L.; He, J.; Lanczycki, C.J.; Lu, S.; Chitsaz, F.; Derbyshire, M.K.; Geer, R.C.; Gonzales, N.R.; et al. CDD/SPARCLE: Functional classification of proteins via subfamily domain architectures. Nucleic Acids Res. 2017, 45, D200–D203. [Google Scholar] [CrossRef] [Green Version]
  70. Jin, J.; Tian, F.; Yang, D.-C.; Meng, Y.-Q.; Kong, L.; Luo, J.; Gao, G. PlantTFDB 4.0: Toward a central hub for transcription factors and regulatory interactions in plants. Nucleic Acids Res. 2017, 45, D1040–D1045. [Google Scholar] [CrossRef] [Green Version]
  71. Edgar, R.C. MUSCLE: Multiple sequence alignment with high accuracy and high throughput. Nucleic Acids Res. 2004, 32, 1792–1797. [Google Scholar] [CrossRef] [Green Version]
  72. Waterhouse, A.M.; Procter, J.B.; Martin, D.M.A.; Clamp, M.; Barton, G.J. Jalview Version 2—A multiple sequence alignment editor and analysis workbench. Bioinformatics 2009, 25, 1189–1191. [Google Scholar] [CrossRef] [Green Version]
  73. Bailey, T.L.; Boden, M.; Buske, F.A.; Frith, M.; Grant, C.E.; Clementi, L.; Ren, J.; Li, W.W.; Noble, W.S. MEME SUITE: Tools for motif discovery and searching. Nucleic Acids Res. 2009, 37, w202–w208. [Google Scholar] [CrossRef]
  74. Chen, C.J.; Chen, H.; Zhang, Y.; Thomas, H.R.; Frank, M.H.; He, Y.H.; Xia, R. TBtools: An Integrative Toolkit Developed for Interactive Analyses of Big Biological Data. Mol. Plant 2020, 13, 1194–1202. [Google Scholar] [CrossRef] [PubMed]
  75. Lescot, M.; Déhais, P.; Thijs, G.; Marchal, K.; Moreau, Y.; Van de Peer, Y.; Rouzé, P.; Rombauts, S. PlantCARE, a database of plant cis-acting regulatory elements and a portal to tools for in silico analysis of promoter sequences. Nucleic Acids Res. 2002, 30, 325–327. [Google Scholar] [CrossRef] [PubMed]
  76. Livak, K.J.; Schmittgen, T.D. Analysis of relative gene expression data using real-time quantitative PCR and the 2−ΔΔCT Method. Methods 2001, 25, 402–408. [Google Scholar] [CrossRef] [PubMed]
Figure 1. Distribution of PbGATA genes in Phoebe bournei chromosomes. Each chromosomal graphic shows the chromosome number at the top. The scale on the left can be used to assess chromosomal length and gene position.
Ijms 24 10342 g001
Figure 2. Phylogenetic tree of three plants’ GATA proteins. The different colored arcs represent the GATA protein subfamilies. The tree was built using 22 PbGATAs from Phoebe bournei, 30 AtGATAs from Arabidopsis thaliana, and 35 MdGATAs from Malus domestica. MEGA 7.0.21 was used to create a maximum likelihood phylogenetic tree, and the bootstrap test replicate was set to 1000 times.
Ijms 24 10342 g002
Figure 3. GATA domain sequence alignments of Phoebe bournei GATA family members. (A) At the top, highly conserved amino acid positions are marked with letters and triangles; (B) Sequence identities are shown at the bottom.
Ijms 24 10342 g003
Figure 4. PbGATA gene phylogenetic relationship and gene structure schematic diagram. (A) Phylogenetic tree of 22 PbGATA proteins, which was constructed with MEGA 7.0.21, and the guided test replicates were set to 1000 times. (B) Conserved domains’ PbGATA proteins. The protein’s length can be approximated using the scale at the bottom. (C) Exon/intron structure of the PbGATA gene. The exon is represented by the green box, while the intron is represented by the black line. The yellow box indicates the PbGATA gene’s UTR region.
Ijms 24 10342 g004
Figure 5. Schematic diagram of the conserved motif of the PbGATA gene. (A) Phylogenetic tree of 22 PbGATA proteins. (B) Different colors correspond to different types of motifs with the numbers 1–10. (C) The sequence information of 10 conserved motifs.
Ijms 24 10342 g005
Figure 6. Schematic diagram of cis-element location and number. (A) The cis-element prediction of 22 PbGATA gene promoter sequences (−2000 bp) was analyzed by PlantCARE. Below are the 24 cis-elements and their classes. (B) The numbers of the 24 cis-elements of the 22 PbGATA genes.
Ijms 24 10342 g006
Figure 7. Synteny analysis of the PbGATA family in Phoebe bournei. The gray lines represent all synteny blocks in the Phoebe bournei genome, whereas the blue lines represent duplicated PbGATA gene pairs. The chromosome number is presented in a rectangular box for each chromosome.
Ijms 24 10342 g007
Figure 8. Arabidopsis, rice, poplar, soybean, and Phoebe bournei GATA gene synteny analysis. The red lines highlight the syntenic GATA gene pairs, while the gray lines in the background show the collinear blocks in the genomes of Phoebe bournei with other plants.
Ijms 24 10342 g008
Figure 9. Tissue-specific gene expression patterns of 22 PbGATA genes, including the root bark, root xylem, stem bark, stem xylem, and leaf. The high and low transcript abundances are denoted by the red and blue colors, respectively. Expressions with log2 ([FPKM] + 1) normalization.
Ijms 24 10342 g009
Figure 10. The expression profile of the PbGATA gene in Phoebe bournei was detected by qRT-PCR in response to drought, salt, and temperature stress. (A) Relative gene expression levels under drought (10% PEG6000) treatment over the same time period (0, 6, 8, 12, and 24 h). The control group was treated with distilled water. (B) Relative gene expression levels under salt (10% NaCl solution) stress. The control group was treated with distilled water. (C) Relative gene expression levels under heat (40 °C) stress. The control group was 25 °C, and the humidity was 75%. (D) Relative gene expression levels under cold (10 °C) stress. The control group was 25 °C, and the humidity was 75%. (* p < 0.05, ** p < 0.01, *** p < 0.0005, and **** p < 0.0001).
Ijms 24 10342 g010
Figure 11. GATA signaling pathway prediction model in Phoebe bournei in adapting to drought and cold stress. Drought stress causes plants to create hyperosmotic stress and causes Ca2+ to enter cells, both of which induce ABA to accumulate and drought-related genes to express in plants, which leads to stomatal closure, allowing plants to enhance drought tolerance. Under cold stress, plants boost endogenous jasmonate synthesis, activate COI1 receptors, and target JAZ proteins for breakdown and MYC release. MYC activates downstream cold response genes via the GATA protein to increase cold tolerance.
Ijms 24 10342 g011
Table 1. Detailed information on 22 PbGATA genes of Phoebe bournei and their encoded proteins.
Gene AccessionGene IdSize
/aa 1
MW 2
/Da
Theoretical pI 3Instability IndexAliphatic IndexGRAVY 4Subcellular Localization
OF13718-RAPbGATA134738,311.395.7653.2552.85−0.728Nuclear
OF15544-RAPbGATA232835,629.817.6349.2966.07−0.498Nuclear
OF04947-RAPbGATA327730,986.999.1155.9851.08−0.758Nuclear
OF04715-RAPbGATA425528,381.026.2369.4863.41−0.765Nuclear
OF04159-RAPbGATA558363,358.545.7354.9673.95−0.540Cytoplasmic
OF25233-RAPbGATA633034,979.096.0851.9265.03−0.576Cytoplasmic
OF12989-RAPbGATA725528,381.026.2369.4863.41−0.765Nuclear
OF24112-RAPbGATA824627,122.349.8065.8853.13−0.778Nuclear
OF29225-RAPbGATA933135,698.906.2542.9963.69−0.549Nuclear
OF20951-RAPbGATA1017219,533.779.8363.4284.42−0.623Cytoplasmic
OF07140-RAPbGATA1183594,357.568.7045.2777.02−0.479Chloroplast
OF10821-RAPbGATA1228832,390.469.5756.1455.24−0.914Nuclear
OF26110-RAPbGATA1324226,442.969.4860.4960.91−0.614Nuclear
OF26160-RAPbGATA1433336,686.855.0154.5268.86−0.738Nuclear
OF09346-RAPbGATA1522323,988.639.6458.7650.85−0.697Nuclear
OF29485-RAPbGATA1635538,554.056.2046.5563.80−0.622Cytoplasmic
OF24473-RAPbGATA1717318,087.436.5141.8769.31−0.353Cytoplasmic
OF06020-RAPbGATA1813915,586.059.4645.7272.37−0.732Nuclear
OF14849-RAPbGATA1924827,353.295.4164.3250.73−0.706Nuclear
OF14230-RAPbGATA2016919,161.819.3664.4157.16−0.938Nuclear
OF14459-RAPbGATA2133535,786.945.2552.5262.33−0.527Nuclear
OF16584-RAPbGATA2222825,868.956.6776.2656.45−0.885Nuclear
1 aa: amino acid number; 2 MW: molecular weight; 3 pI: theoretical isoelectric point; 4 GRAVY: grand average of hydropathicity.
Disclaimer/Publisher’s Note: The statements, opinions and data contained in all publications are solely those of the individual author(s) and contributor(s) and not of MDPI and/or the editor(s). MDPI and/or the editor(s) disclaim responsibility for any injury to people or property resulting from any ideas, methods, instructions or products referred to in the content.

