Article

Identification and Isolation of α-Glucosidase Inhibitors from Siraitia grosvenorii Roots Using Bio-Affinity Ultrafiltration and Comprehensive Chromatography

1
Guangxi Key Laboratory of Plant Functional Phytochemicals and Sustainable Utilization, Guangxi Institute of Botany, Guangxi Zhuang Autonomous Region and Chinese Academy of Sciences, Guilin 541006, China
2
Guangxi Key Laboratory of Electrochemical and Magnetochemical Functional Materials, College of Chemistry and Bioengineering, Guilin University of Technology, Guilin 541004, China
*
Authors to whom correspondence should be addressed.
These authors contributed equally to this work.
Int. J. Mol. Sci. 2023, 24(12), 10178; https://doi.org/10.3390/ijms241210178
Submission received: 6 May 2023 / Revised: 5 June 2023 / Accepted: 13 June 2023 / Published: 15 June 2023
(This article belongs to the Special Issue Drug Discovery and Application of New Technologies)

Abstract

:
The discovery of bioactive compounds from medicinal plants has played a crucial role in drug discovery. In this study, a simple and efficient method utilizing affinity-based ultrafiltration (UF) coupled with high-performance liquid chromatography (HPLC) was developed for the rapid screening and targeted separation of α-glucosidase inhibitors from Siraitia grosvenorii roots. First, an active fraction of S. grosvenorii roots (SGR2) was prepared, and 17 potential α-glucosidase inhibitors were identified based on UF-HPLC analysis. Second, guided by UF-HPLC, a combination of MCI gel CHP-20P column chromatography, high-speed counter-current countercurrent chromatography, and preparative HPLC were conducted to isolate the compounds producing active peaks. Sixteen compounds were successfully isolated from SGR2, including two lignans and fourteen cucurbitane-type triterpenoids. The structures of the novel compounds (4, 6, 7, 8, 9, and 11) were elucidated using spectroscopic methods, including one- and two-dimensional nuclear magnetic resonance spectroscopy and high-resolution electrospray ionization mass spectrometry. Finally, the α-glucosidase inhibitory activities of the isolated compounds were verified via enzyme inhibition assays and molecular docking analysis, all of which were found to exhibit certain inhibitory activity. Compound 14 exhibited the strongest inhibitory activity, with an IC50 value of 430.13 ± 13.33 μM, which was superior to that of acarbose (1332.50 ± 58.53 μM). The relationships between the structures of the compounds and their inhibitory activities were also investigated. Molecular docking showed that the highly active inhibitors interacted with α-glucosidase through hydrogen bonds and hydrophobic interactions. Our results demonstrate the beneficial effects of S. grosvenorii roots and their constituents on α-glucosidase inhibition.

Graphical Abstract

1. Introduction

Diabetes mellitus (DM), a metabolic disease characterized by sustained hyperglycemia resulting in various complications, has gradually become one of the most serious metabolic disorders worldwide [1]. Inhibiting carbohydrate digestive enzymes to delay glucose absorption is one of the most effective approaches for overcoming postprandial hyperglycemia. Therefore, α-glucosidase, a carbohydrate digestive enzyme in the small intestine that catalyzes the cleavage of oligosaccharides to glucose in the small intestine, is an essential target for the regulation of postprandial serum glucose in patients with diabetes [2]. To date, α-glucosidase inhibitors, such as acarbose, miglitol, and voglibose, have been recommended as first-line therapies [3]. However, these drugs may cause adverse reactions, such as nausea, vomiting, diarrhea, and damage to liver and kidney function [4,5]. Hence, the extraction of effective α-glucosidase inhibitors with low toxicity from medicinal and homologous plants has attracted increasing attention because of their wide range of sources, minimal side effects, and excellent health-promoting activities [6,7,8].
Cucurbitaceae is a well-known plant family, considered to have potent hypoglycemic effects, and is recognized in the empirical control of DM [9]. As a member of the Cucurbitaceae family, Siraitia grosvenorii is a precious medicinal and edible plant distributed mainly in southern China. S. grosvenorii fruits are used as traditional herbal medicines for the treatment of dry cough, extreme thirst, sore throat, and hyperglycemia. Several cucurbitane glycosides have been identified from the fruits and have been reported to have broad bioactivities, including antioxidant, anti-inflammatory, hepatoprotective, anti-tumor, and anti-asthma activities [10,11,12,13,14]. Moreover, cucurbitane glycosides can reduce blood glucose by increasing insulin levels and inhibiting α-glucosidase activity, thereby reducing pancreatic injury [15]. Although several S. grosvenorii roots are available, they have only been used as organic materials and fertilizers in plantations. A few phytochemical investigations have revealed that the ethanolic extract of the roots mainly consists of cucurbitane-type compounds, including cucurbitacin B, cucurbitacin Q1, siraitic acids A–H, siraitic acid II B, siraitic acid II C, and siraitic glycoside II F [16,17,18,19,20]. Our preliminary study revealed that S. grosvenorii root extract inhibits α-glucosidase, but the active constituents that inhibit α-glucosidase have not been determined yet. Therefore, the effective components and the mechanism involved in the hypoglycemic effects of S. grosvenorii roots need to be explored further.
An efficient isolation strategy plays a key role in active substance discovery. However, owing to the complexity of natural extracts and the high structural diversity of their components, the conventional separation strategy presents randomness and blindness. In recent years, affinity-based ultrafiltration (UF) coupled with high-performance liquid chromatography (HPLC) has emerged as a simple, rapid, and effective technique to identify bioactive candidate molecules from natural products. UF-HPLC inhibition profiling provides a biochromatogram that allows the identification of HPLC peaks correlated with inhibitory activity, and thereby, specific isolation toward only active peaks becomes possible. This technology has been successfully used to accelerate the identification of α-glucosidase, α-amylase, and aldose reductase inhibitors [21,22,23].
In this study, a UF-HPLC-based strategy was established to screen α-glucosidase inhibitors from S. grosvenorii roots, and the targeted separation of these potential inhibitors was guided via UF-HPLC and was performed using a combination of MCI gel CHP-20P column chromatography, high-speed countercurrent chromatography (HSCCC), and preparative HPLC (pre-HPLC). Furthermore, the inhibitory activities of the potential inhibitors were verified, and the underlying plausible mechanisms were further explored using molecular docking analysis. This study supports the potential application of S. grosvenorii roots in the prevention and treatment of diabetes.

2. Results and Discussion

2.1. Inhibition of α-Glucosidase by Crude S. grosvenorii Root Extract and the Eluted Fractions

Generally, the efficacy of medicinal plants depends on their characteristic bioactive chemical components. Since we had previously found that S. grosvenorii roots extract inhibited α-glucosidase, we obtained more active fractions using the HPD-100 macroporous resin column. In the present study, according to HPLC analysis, Fraction 1 and 2 (SGR1 and SGR2) of S. grosvenorii roots extract demonstrated significantly different constituents, which were eluted from the HPD-100 column with 40% and 60% MeOH, respectively. Moreover, an α-glucosidase inhibitory assay was carried out to assess the effect of SGR1 and SGR2, while acarbose served as a positive control. The assay results (Table 1) showed that SGR2 was more active than the crude extract and SGR1, with an IC50 value of 631.1 ± 50.2 μg/mL, which is superior to that of acarbose (860.3 ± 31.3 μg/mL). It has been reported that the main components in S. grosvenorii roots are triterpenoids, which could be enriched with a 60% methanol solution. This may explain why SGR2 exhibited the strongest α-glucosidase inhibitory activity. Consequently, there is an urgent need to rapidly identify natural α-glucosidase inhibitors from SGR2.

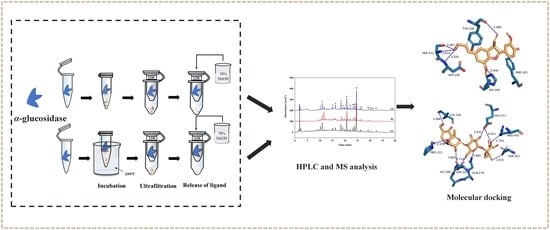
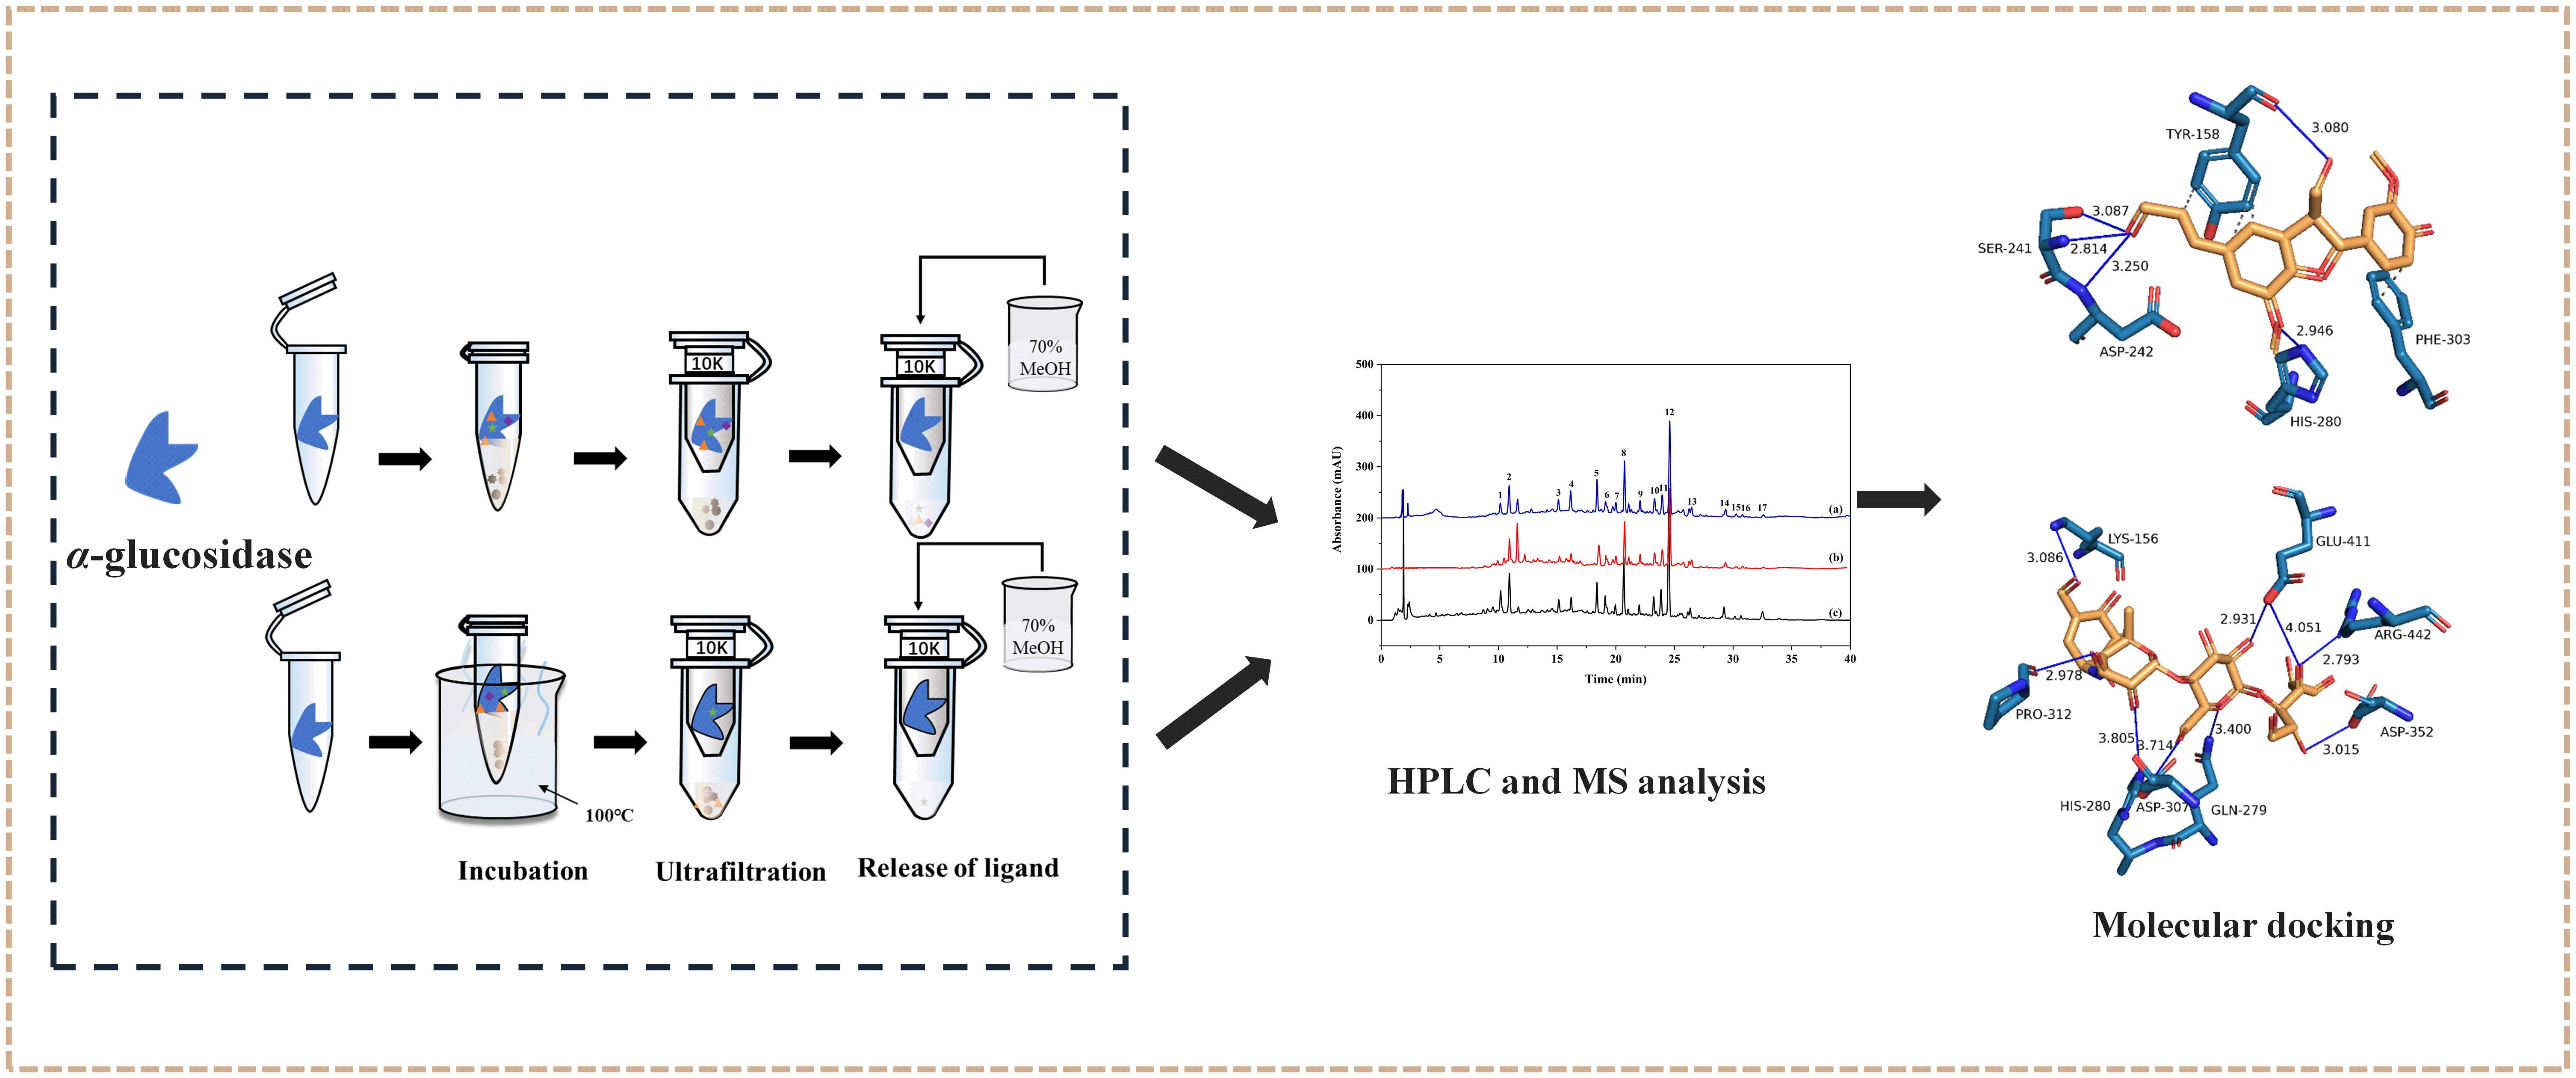
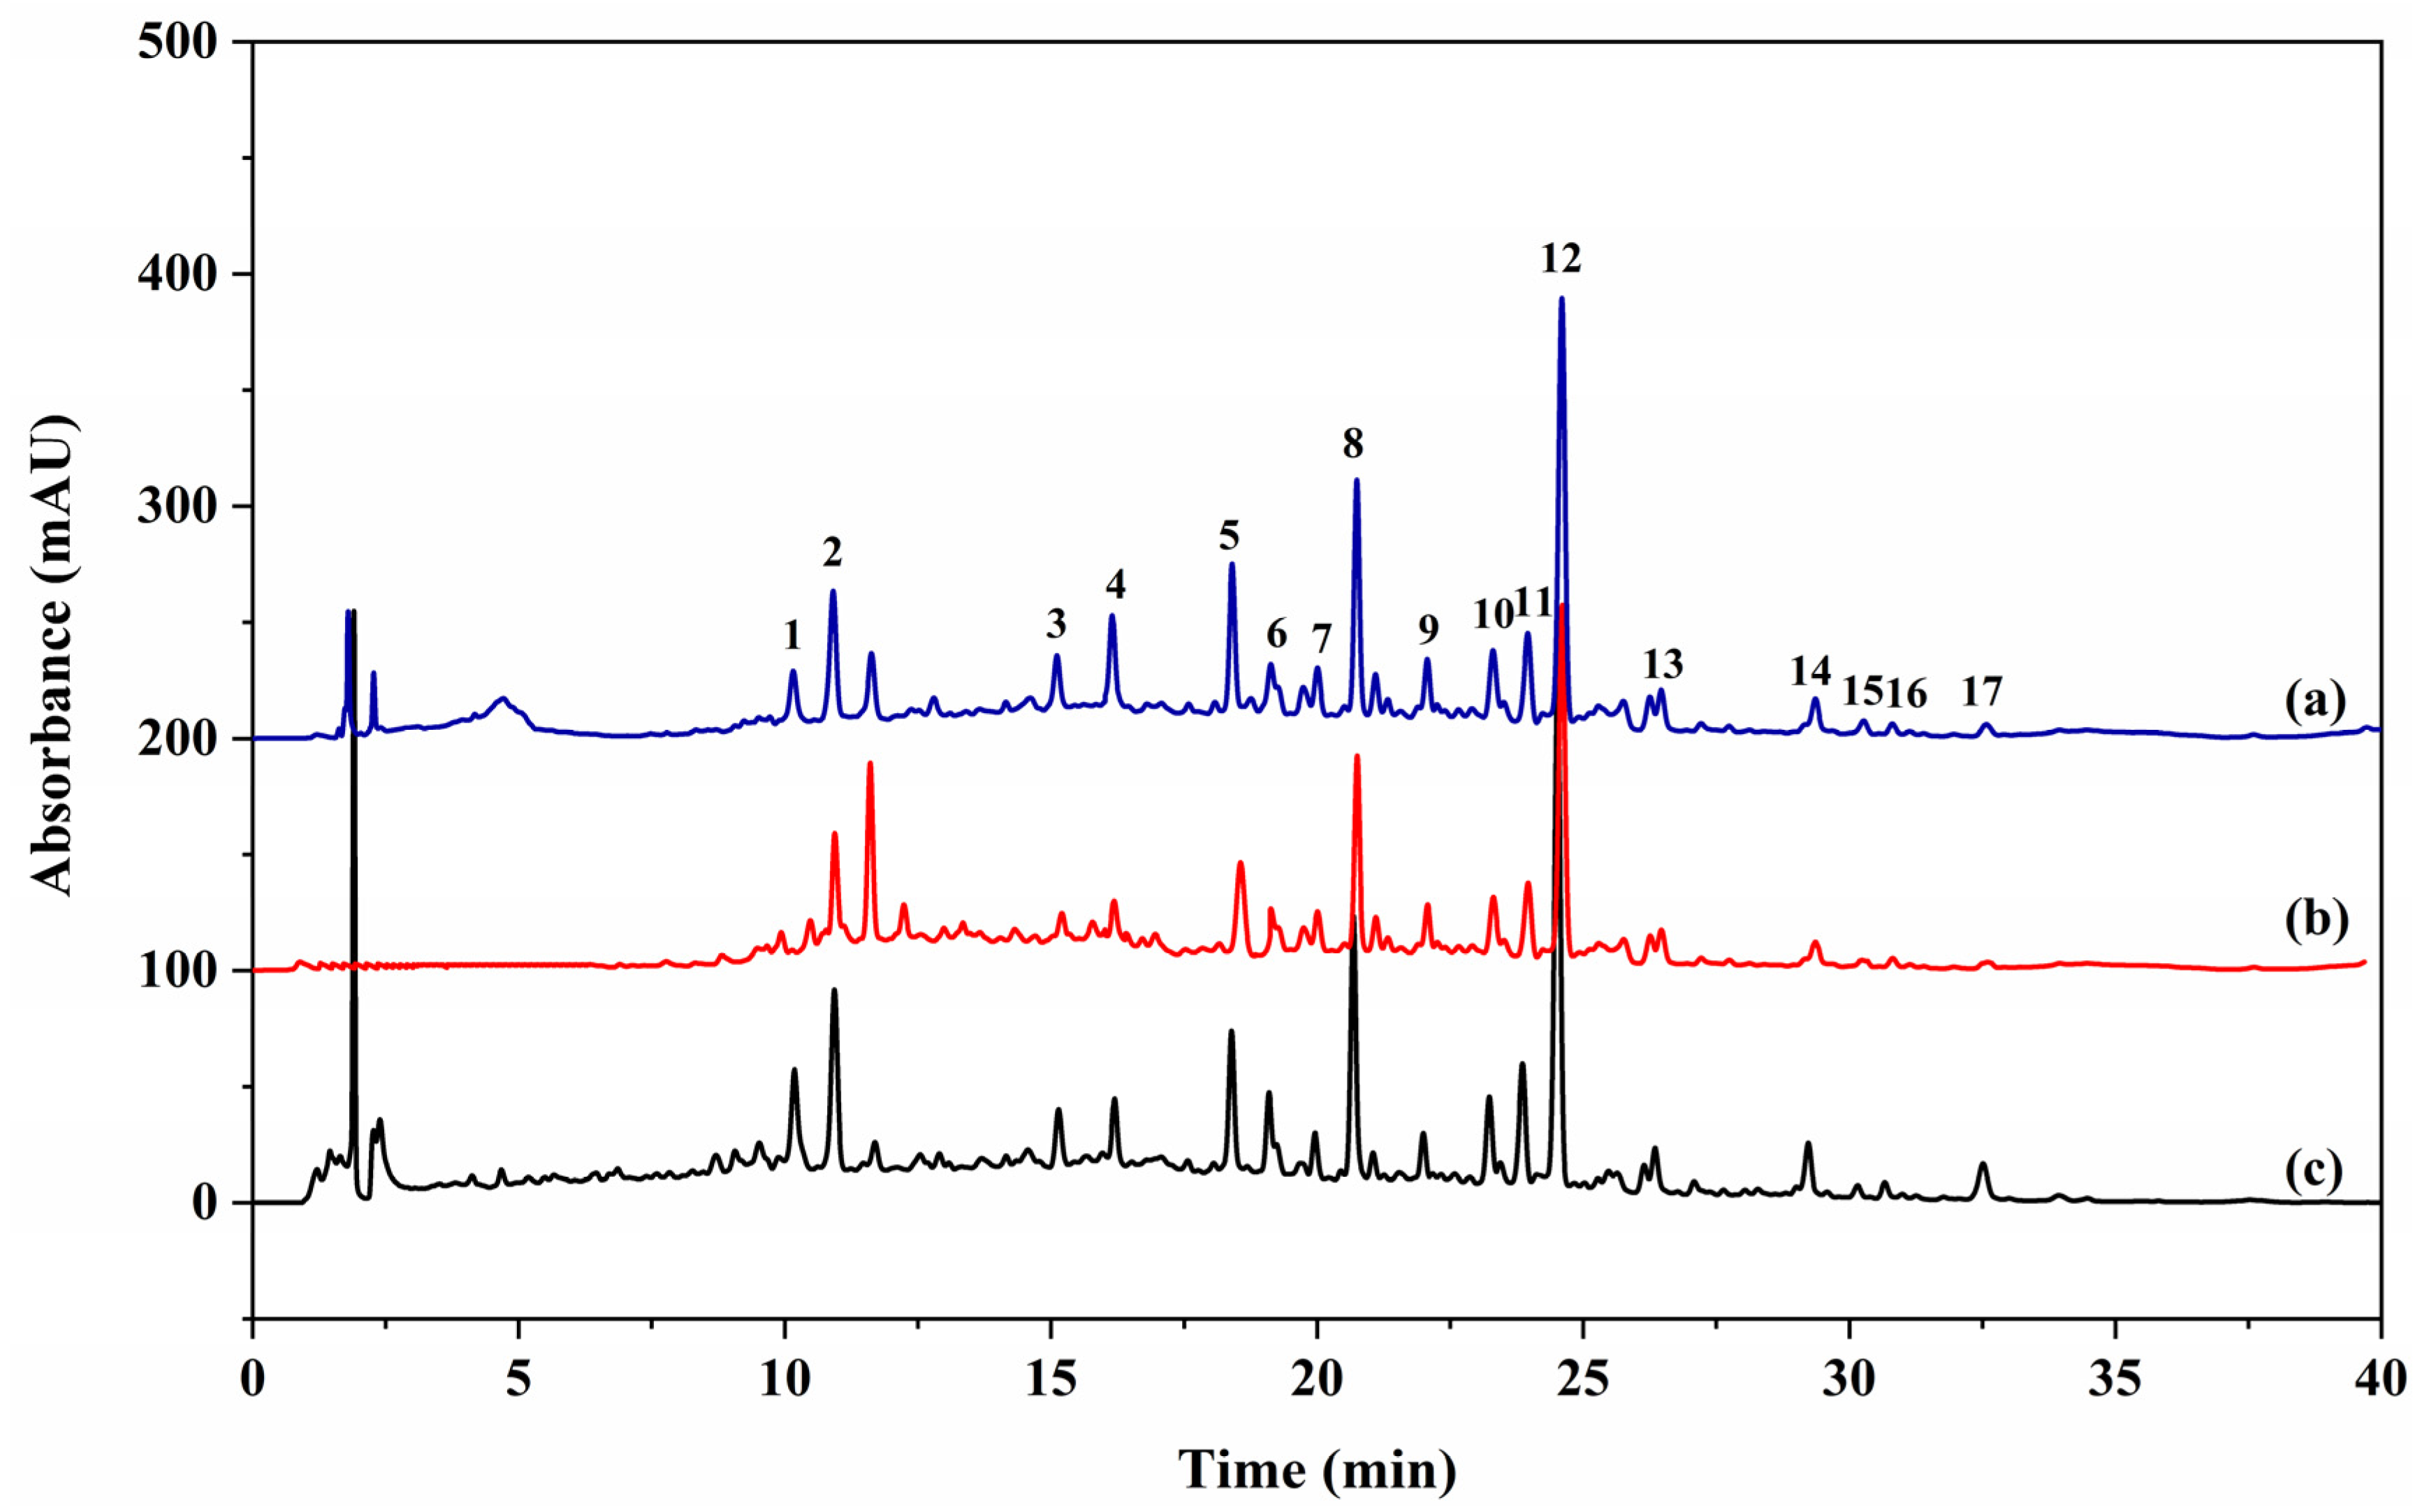
2.2. Screening for Potential α-Glucosidase Inhibitors in SGR2

Affinity UF is a new, highly sensitive, and throughput technique that can rapidly identify bioactive compounds from complex natural products [24,25]. After incubation with α-glucosidase and interception by a UF membrane, active compounds in SGR2 bound to α-glucosidae were released by adding methanol and then further analyzed using HPLC. Figure 1 shows that the 17 peaks in the SGR2 sample incubated with active α-glucosidase (Figure 1 blue line) showed higher intensities than the sample with denatured α-glucosidase (Figure 1 red line), implying that the active compounds in SGR2 are potential α-glucosidase inhibitors.
To further evaluate the relative binding capacities of individual compounds and their contribution to the overall inhibitory activity of the extract, the specific binding factor was calculated using Equation (2) [26]. The values of 17 specific binding factors obtained from the above calculation are shown in Table 2, which revealed that the 17 peaks exhibited significantly different binding capacities. A total of 6 peaks (9–12, 14–15) had specific binding factors higher than 5%, and peak 14 exhibited the highest binding affinity with a specific binding factor of 17.26%, followed by peak 15 with a specific binding factor of 7.98%. However, the detection of relative binding affinities did not completely represent the α-glucosidase inhibitory activities of the compounds. Thus, the α-glucosidase inhibitory activities of the identified ligands need to be further validated in vitro.

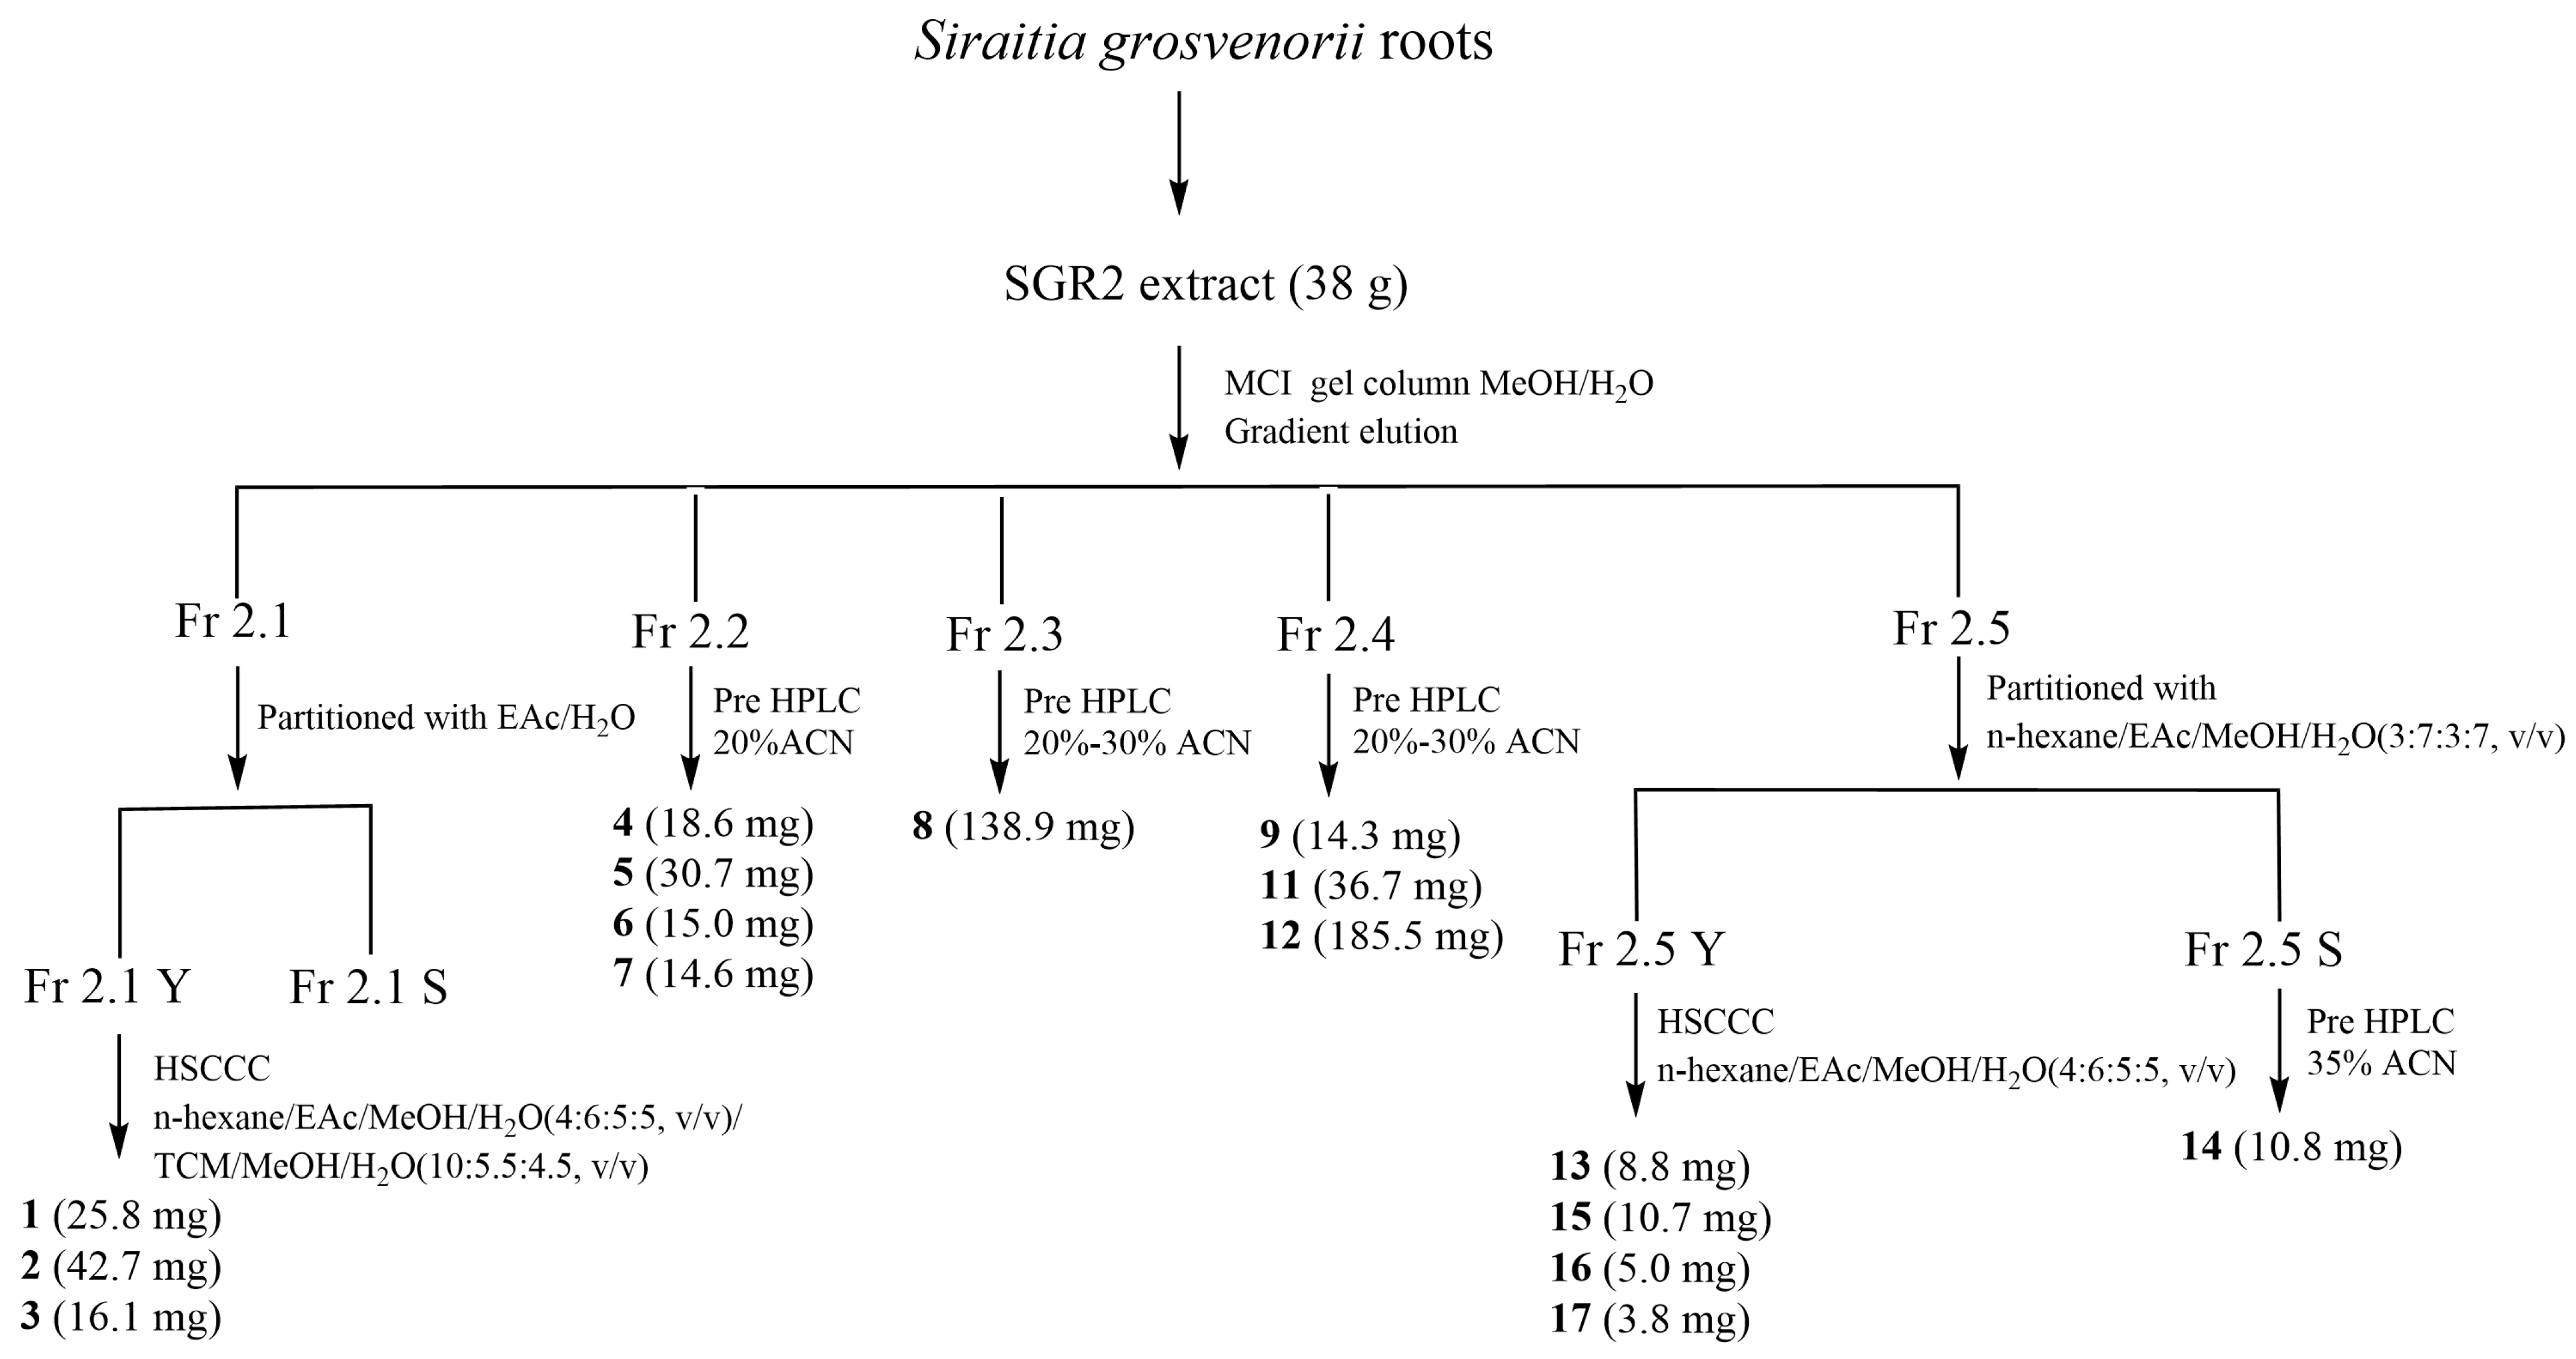
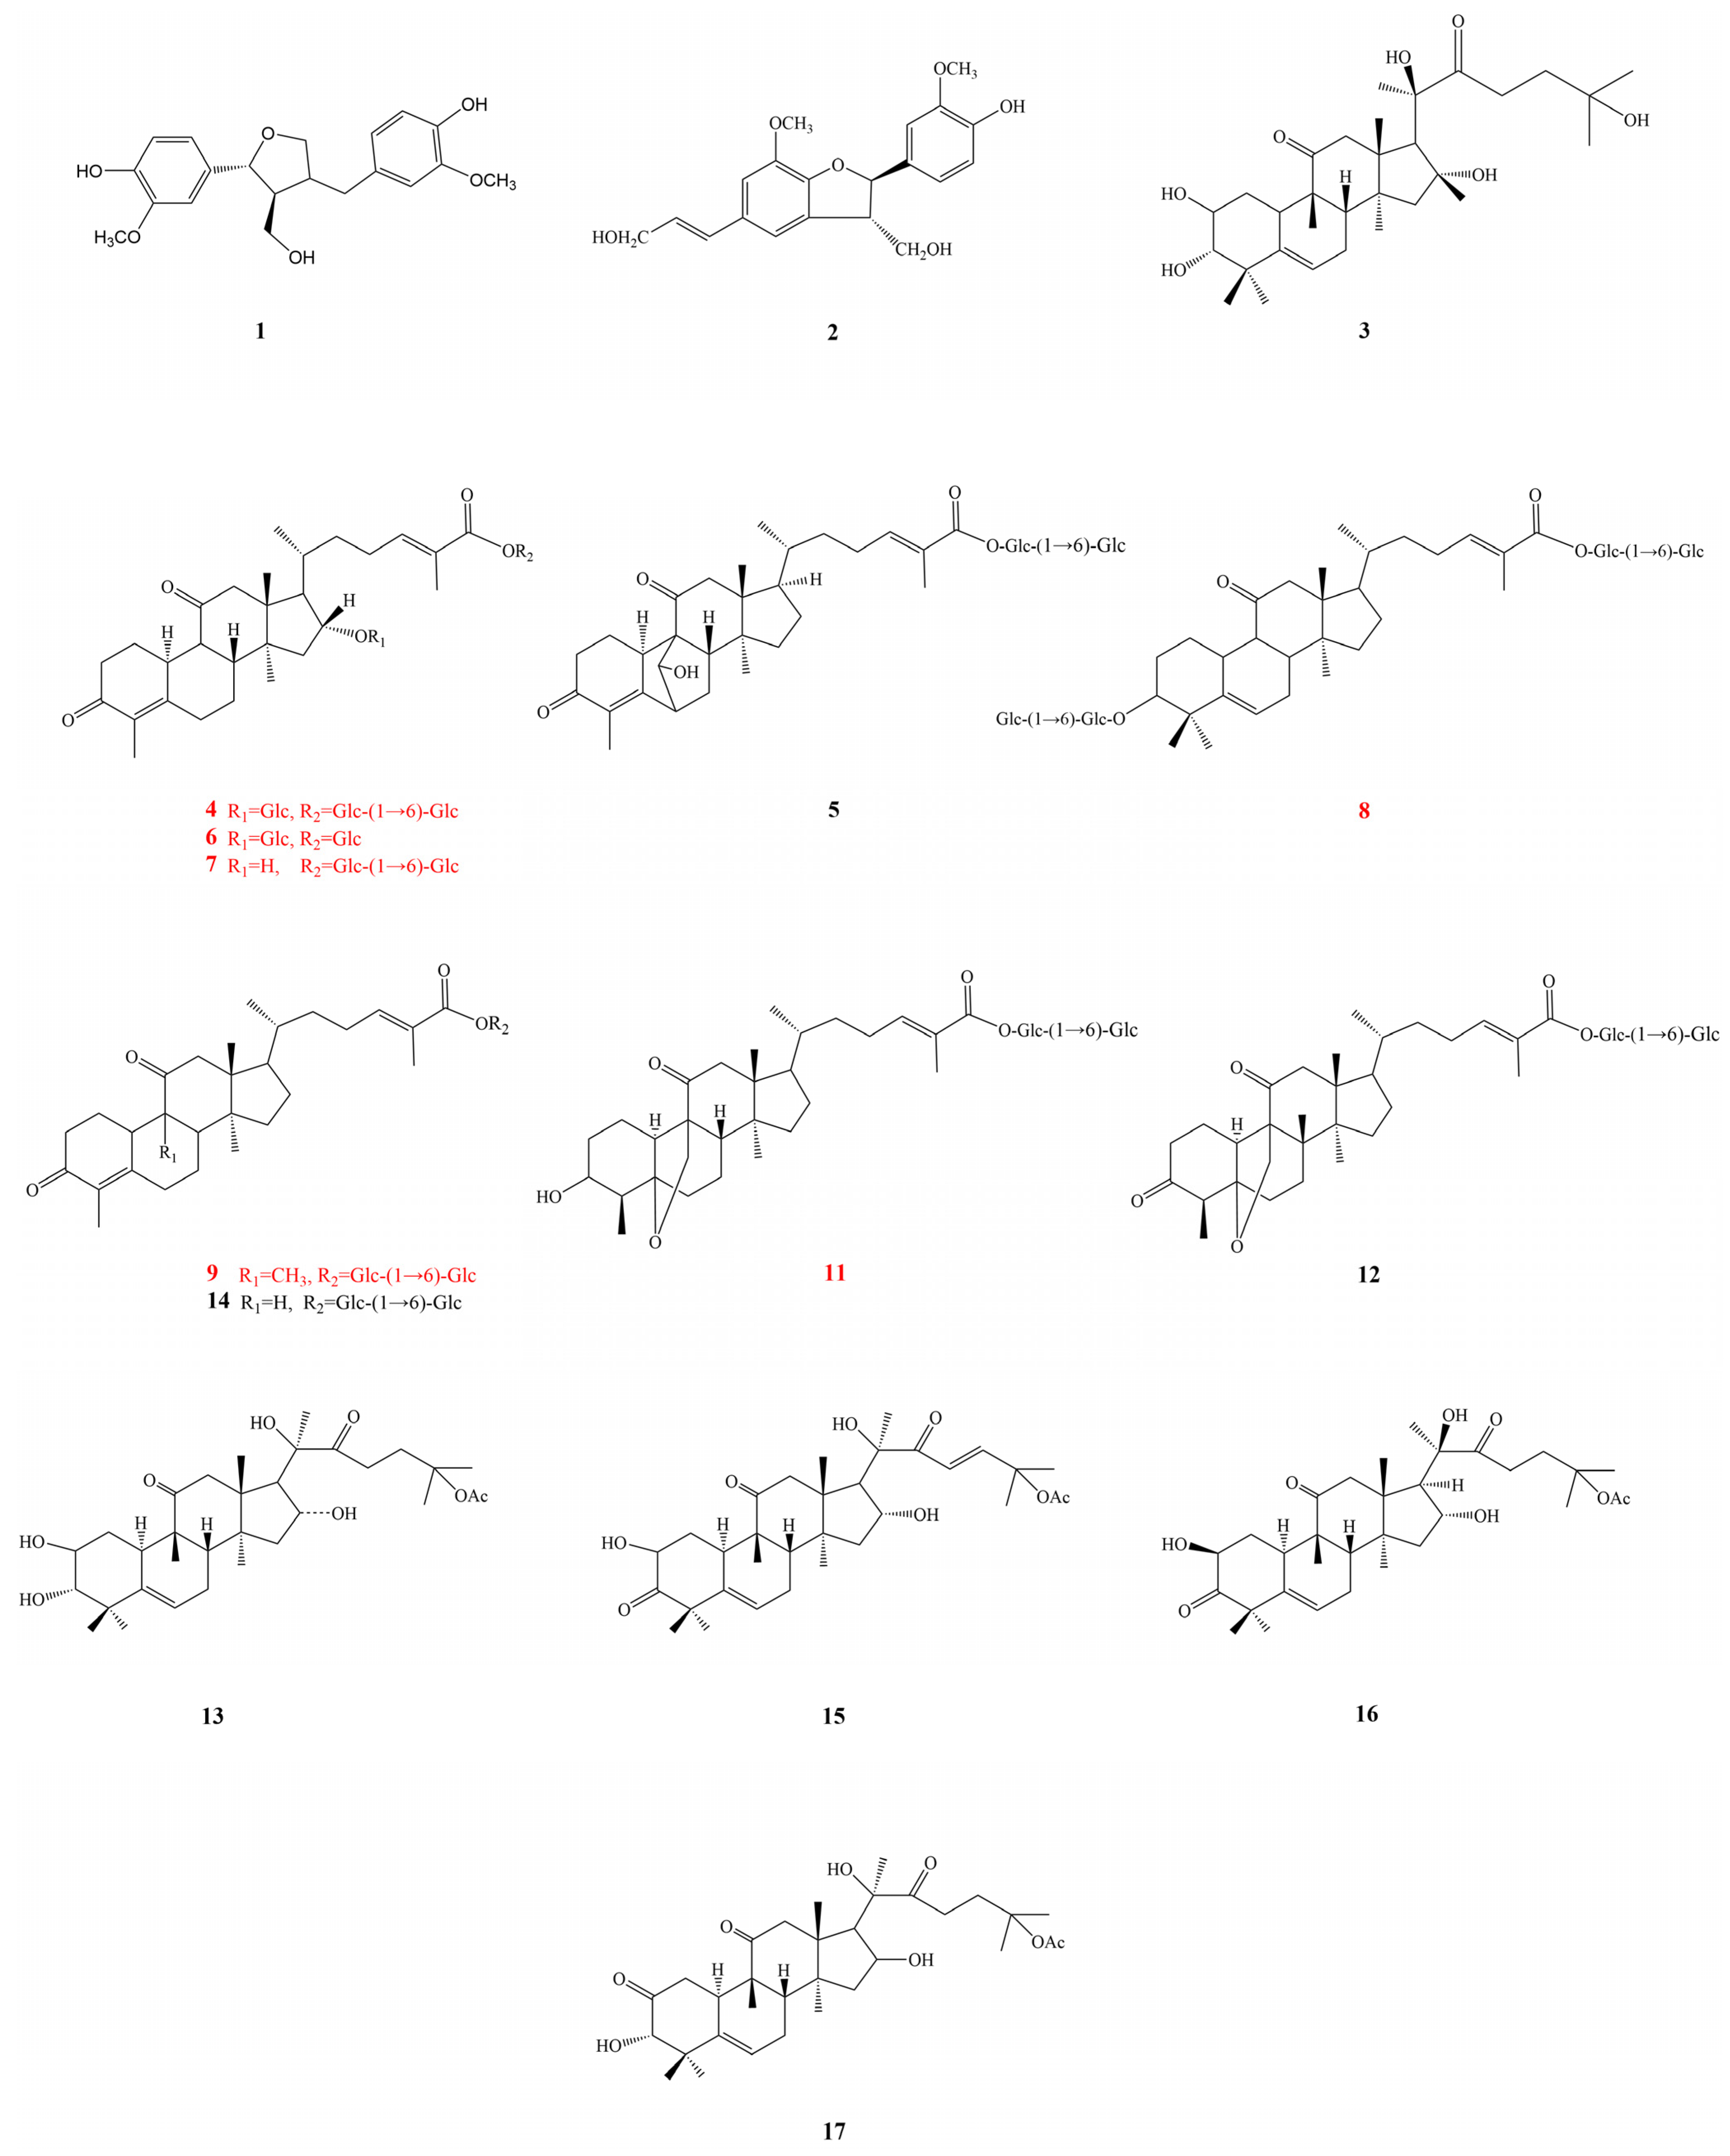
2.3. Isolation and Structural Identification

Isolation is an indispensable step in verifying the function of the active compounds. As shown in Figure 1, there were complex components with a broad range of polarities in SGR2, and some of them were in low abundance, which made it difficult to comprehensively isolate bioactive components via a single-step separation process. Therefore, guided by the UF-HPLC profiles, a combination of MCI gel CHP-20P column chromatography (CC), HSCCC, and pre-HPLC was conducted to isolate the active peaks associated with the α-glucosidase activity. First, to eliminate the untargeted constituents and concentrate the minor potential ligands, SGR2 was further fractionated using MCI gel CHP-20P CC. Macroporous resin CC is one of the most widely used techniques for pretreating crude extracts because of its high selectivity, efficiency, and simplified operation [27]. The eluate of the MCI gel CHP-20P CC was composed of five subfractions according to the HPLC analysis results, which were subsequently subjected to HSCCC and pre-HPLC processes. Pre-HPLC is an effective method for separating complex constituents with a broad range of polarities. In addition, it can provide a straightforward view of a specific analysis, which facilitates the precise isolation of compounds. Our results showed that pre-HPLC provided a high-resolution separation of peaks 4–12 from Fr 2.2–Fr 2.4, and peak 14 from Fr 2.5 (Figure 2). The peaks 1–3, 13, and 15–17 were distributed over a broad range in the HPLC chromatogram, but they all showed low and medium polarity, as observed by TLC analysis; therefore, they were distributed in the organic phase when partitioned by the aqueous phase. Previous studies show that HSCCC is highly effective in separating such compounds [17,19]. Hence, HSCCC was employed to separate peaks 1–3, 13, and 15–17. In summary, 16 compounds were isolated from SGR2 using comprehensive isolation techniques. However, the structure of peak 10 could not be elucidated because it was unstable after purification.

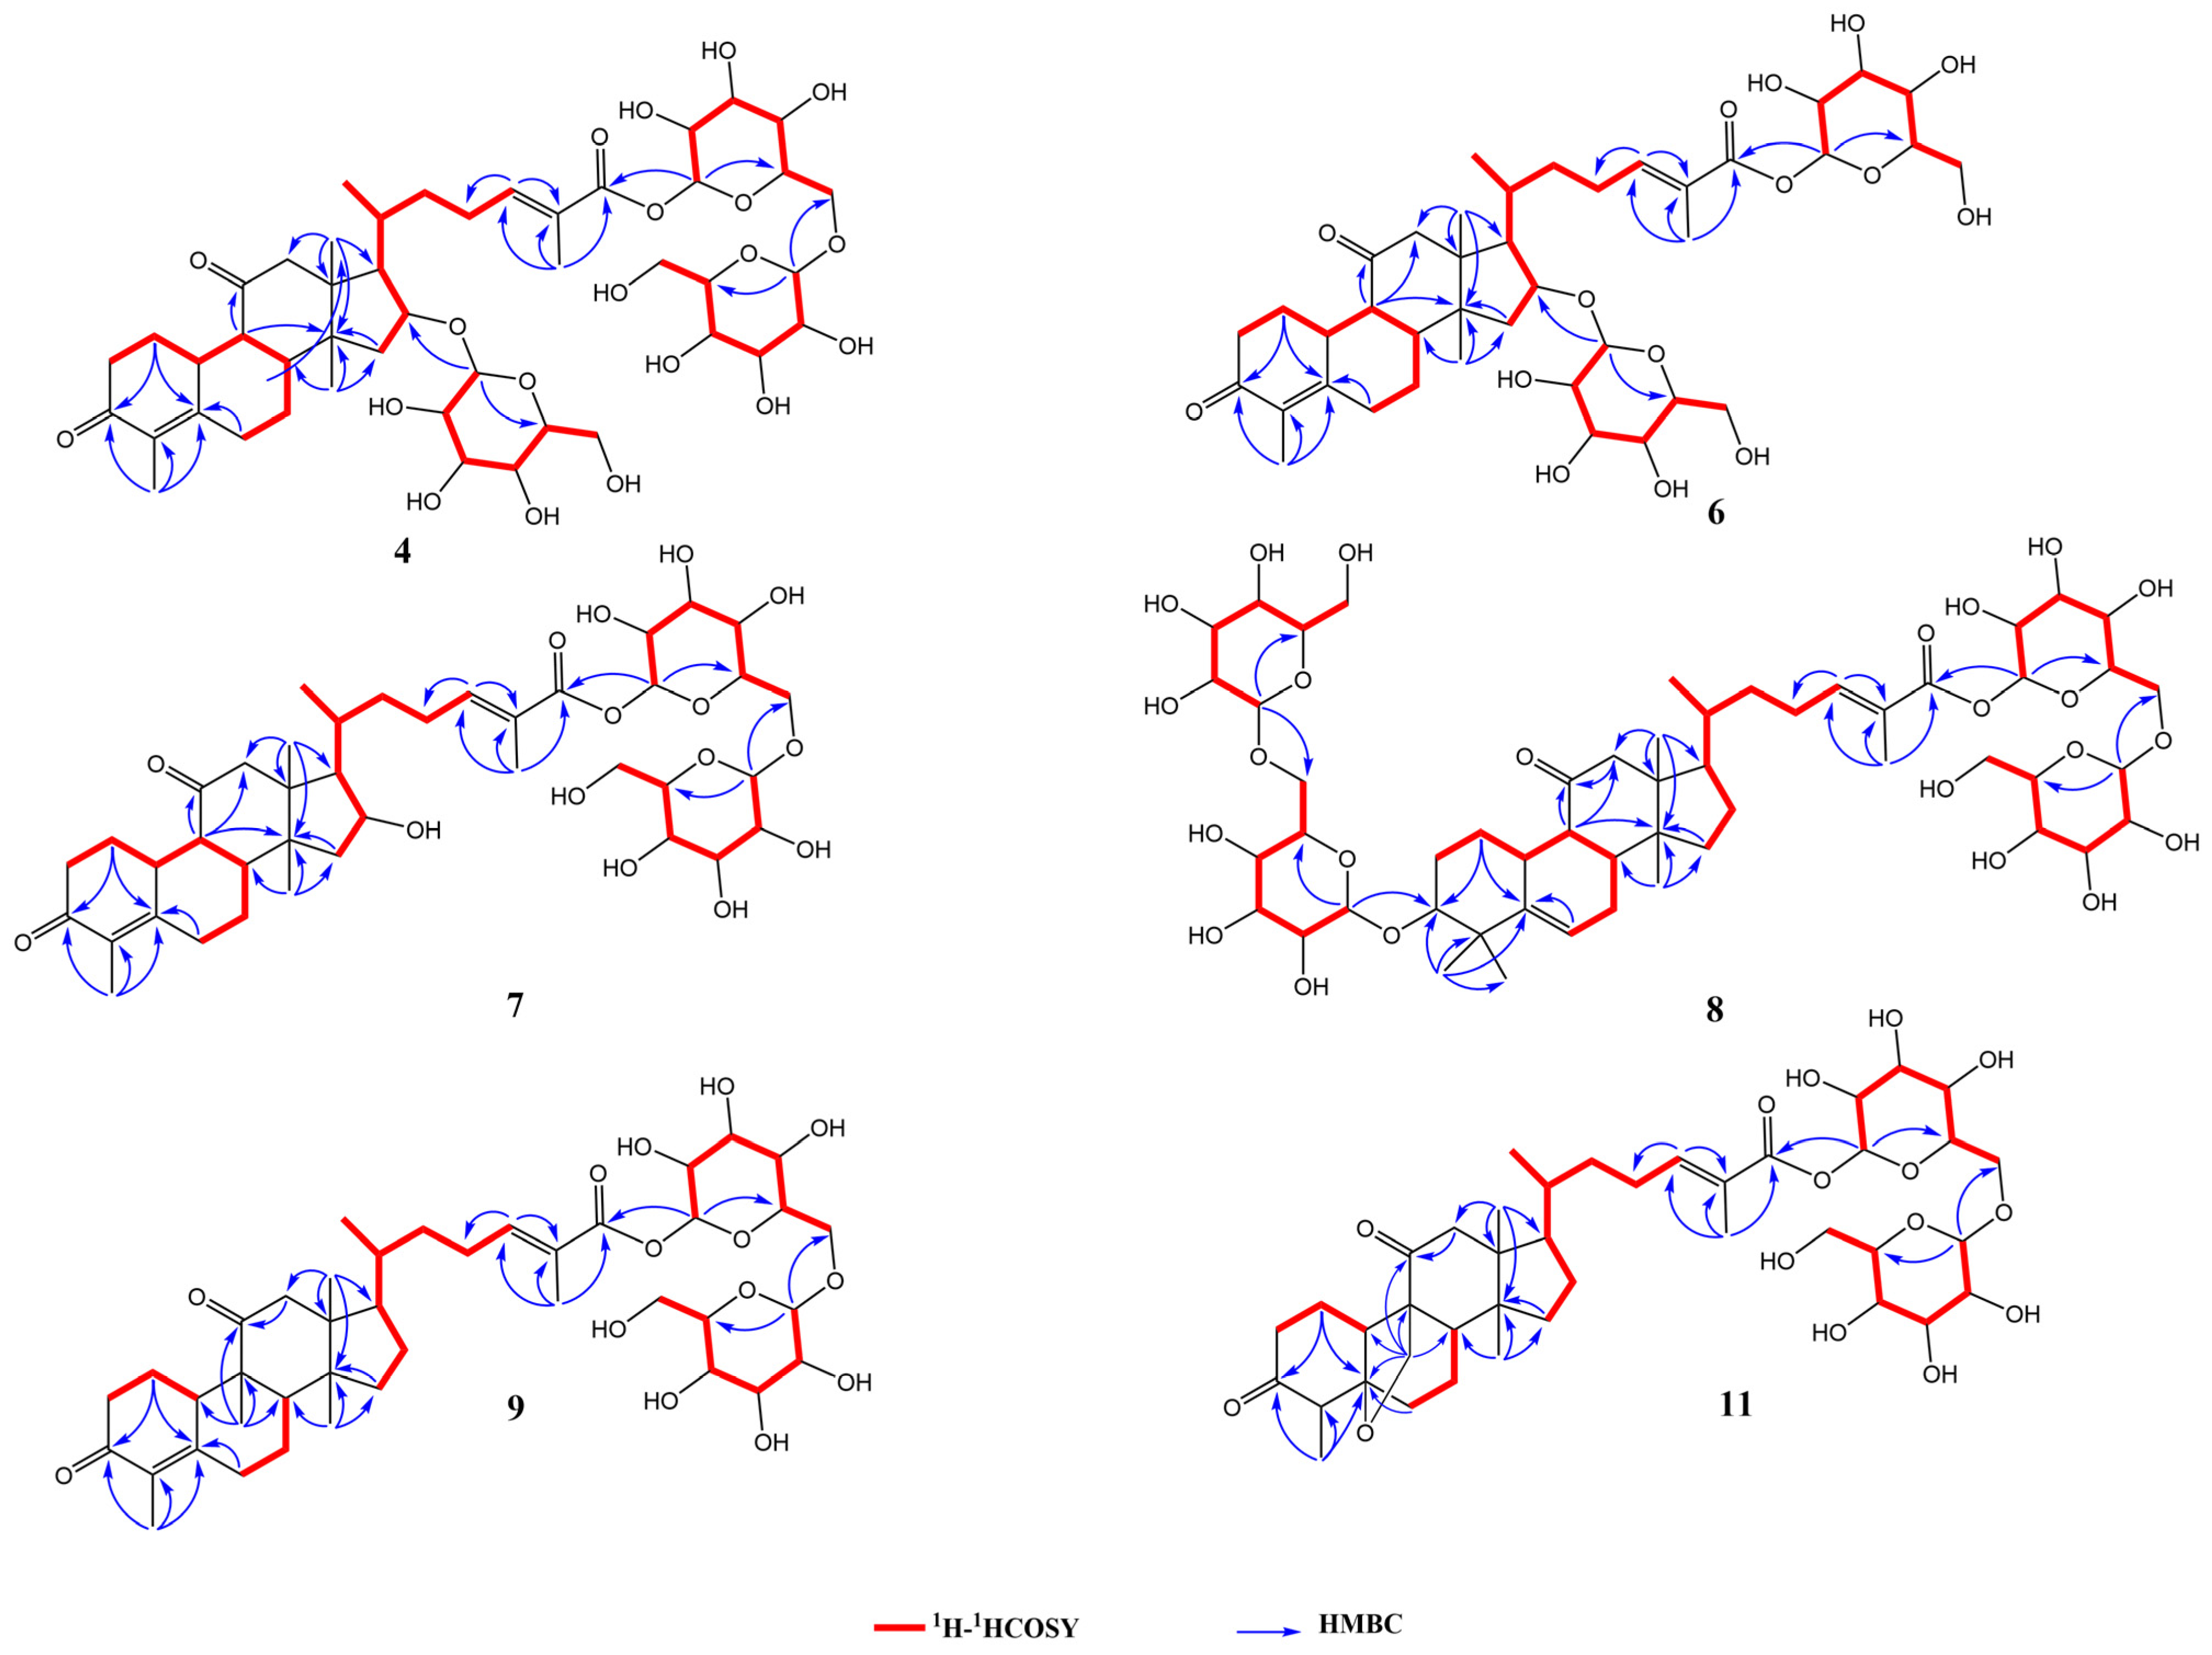
2.3.1. Elucidating the Structure of Novel Compounds

Compound 4 was obtained as a white amorphous powder. The molecular formula was determined to be C46H70O20, based on HR-ESI-MS at m/z 987.4471 [M+HCOO] (calculated for C47H71O22, 987.4442). Its 1H NMR data (Table 3) in pyridine-d5 indicated the presence of five methyl groups [δH 1.95 (3H, s), 1.93 (3H, s), 1.53 (3H, s), 0.87 (3H, d, J = 6.2 Hz), and 0.76 (3H, s)], an olefinic proton at δH 7.38 (1H, t, J = 7.7 Hz), and three β-glucopyranosyl moieties [δH 6.39 (1H, d, J = 7.8 Hz), 4.99 (1H, d, J = 8.1 Hz), and 4.87 (1H, d, J = 7.8 Hz)] in compound 4. Based on the 13C NMR data (Table 4), compound 4 contains 46 carbon atoms that construct three glucopyranosyl moieties (δC 105.5, 102.8, 96.5,78.9, 78.9, 78.7, 78.7, 78.6, 78.2, 75.4, 74.4, 73.5, 72.6, 71.7, 69.8, 64.0, and 62.8), three carbonyl carbons (δC 210.9, 198.9, and 167.6), one double bond (δC 146.3 and 127.2), five methyl groups (δC 19.2, 17.8, 17.6, 13.0, and 11.5), an oxygenated methine (δC 82.9), eleven methylene carbons (δC 69.8, 64.0, 62.8, 52.5, 40.0, 37.6, 33.8, 31.2, 28.8, 27.9, and 26.2) and four quaternary carbons (δC 158.2, 130.3, 51.1, and 47.7). These NMR signals indicate that compound 4 might be triterpenoid β-glucopyranoside. By comparing its 13C NMR data with those of siraitic acid E [20], three more signs for glycosylation and the glucosylation shifts of C-16 (δC 82.9) and C-27 (δC 167.6) were observed, suggesting that three sugar moieties might be attached to C-16 and C-27. In the heteronuclear multiple bond coherence (HMBC) spectrum, cross-peaks between H-1 (δH 4.87) of glucosyl-GI and C-16 (δC 82.9) of the aglycone, and H-1 (δH 6.39) of glucosyl-GII and C-27 (δC 167.6) were observed. Moreover, the correlation between H-6 (δH 4.73, 4.34, m) of glucosyl-GII and C-1 (δC 105.5) of glucosyl-GIII, as well as H-1 (δH 4.99) between glucosyl-GIII and C-6 (δC 69.8) of glucosyl-GII confirmed the linkage of the GIII-(1→6)-GII moiety. Based on the above evidence, together with the analysis of the 1H-1H correlation spectroscopy (COSY) and nuclear overhauser effect spectroscopy (NOESY) spectra, compound 4 was determined as shown in Figure 3 and named siraitic acid III E. (The spectrograms of compounds 4 are shown in Figures S1–S6).
Compound 6 was obtained as a white amorphous powder, which possessed a molecular formula of C40H60O15 deduced from HR-ESI-MS at m/z 803.3812 [M+Na]+ (calculated for C40H60O15Na, 803.3824). Fragment ions at m/z 618 [M-Na-Glc] and 456 [M-Na-2Glc] were obtained from the analysis of MS/MS fragment ions, suggesting the presence of two glucose moieties. The 13C and 1H NMR data for compound 6 (Table 3 and Table 4) were similar to those for compound 4, except for the sugar moieties. The 1H NMR spectrum of compound 6 displays signals for two β-glucopyranosyl moieties [δH 6.50 (1H, d, J = 7.6 Hz), 4.88 (1H, d, J = 7.7 Hz)]. In the HMBC spectrum, the cross-peaks between H-16 (δH 4.52, t, J = 6.6 Hz) and C-1 (δC 102.8) of glucosyl-GI, H-1 (δH 4.86) of glucosyl-GI and C-16 (δC 82.9) of the aglycone, and H-1 (δH 6.50) of glucosyl-GII and C-27 (δC 167.6) of the aglycone suggested sugar linkage. Based on the abovementioned data, together with the analysis of the heteronuclear single quantum coherence spectroscopy (HSQC), HMBC, 1H-1H COSY, and NOESY spectra, the chemical structure of compound 6 was elucidated as shown in Figure 3 and named siraitic acid IIb E. (The spectrograms of compounds 6 are shown in Figures S7–S12).
Compound 7 was obtained as white amorphous powder and yielded a quasi-molecular ion peak at m/z 803.3774 [M+Na]+ (calculated for C40H60O15Na, 803.3824) by HR-ESI-MS, consistent with a molecular formula of C40H60O15. The 1H and 13C NMR data for compound 7 (Table 3 and Table 4) were similar to those for compound 6. The noticeable difference was that the signals of C-16 in 7 were downshifted from δC 77.0 to 82.8, indicating that compound 7 may be a C-16 isomer of compound 6. The HMBC correlations between H-1 (δH 6.42) of glucosyl-GI and C-27 (δC 167.5) of the aglycone, H-6 (δH 4.37, 4.47, m) of glucosyl-GI and C-1 (δC 105.8) of glucosyl-GII, and H-1 (δH 4.77) of glucosyl-GII and C-6 (δC 69.8) of glucosyl-GI constituted the GII-(1→6)-GI moiety. In the NOESY spectrum, nuclear overhauser effect-related peaks of H-16 (δH 4.30) and H-20 (δH 1.61) were observed, and the relative configuration of the hydroxyl group was determined. Based on the abovementioned information and prior data, compound 7 is shown in Figure 3 and named siraitic acid II E. (The spectrograms of compounds 7 are shown in Figures S13–S18).
The molecular formula of compound 8 was assigned as C53H84O24 by HR-ESI-MS at m/z 1103.5267 [M−H] (calculated for C53H83O24, 1103.5280). The NMR data (Table 3 and Table 4) showed signals attributable to six methyl groups (δH 1.91, 1.52, 1.11, 0.90, 0.82, 0.70, δC 27.3, 25.6, 18.8, 17.2, 17.1, and 13.0), two olefinic protons at (δH 7.06 and 5.51), together with four sugar anomeric signals δH (6.43, 5.15, 5.02, and 4.81) and δC (107.5, 106.0, 105.8, and 96.7). Compound 8 was classified as a triterpenoid saponin with a nor-cucurbitane skeleton according to previous studies [28,29], and its aglycone structure was the same as that of siraitic acid H. HMBC correlations between H-1 (δH 4.81) of glucosyl-GI and C-3 (δC 88.2) of the aglycone, and H-1 (δH 5.16) of glucosyl-GII and C-6 (δC 70.9) of glucosyl-GI were observed, which constituted the GII-(1→6)-GI moiety. Moreover, the cross-peaks between H-1 (δH 6.44) of glucosyl-GIII and C-27 (δC 167.6) and H-1 (δH 5.02) of glucosyl-GIV and C-6 (δC 63.0) of glucosyl-GIV constituted the GIV-(1→6)-GIII moiety. The NOESY spectrum showed that H-3 (δH 3.73) was related to H-9 (δH 2.18), H-9 was related to H-10 (δH 3.14), and H-9 was not associated with H-8. Therefore, the substitution configuration of the C-3 glycosyl group was determined. The relevant hydrocarbon spectrum data were analyzed and assigned using HSQC, HMBC, and 1H-1H COSY spectra. Subsequently, the structural formula of compound 8 was identified as shown in Figure 3, and named siraitic acid IV H. (The spectrograms of compounds 8 are shown in Figures S19–S24).
Compound 9 was isolated as white amorphous powder, which gave a quasi-molecular ion peak at m/z 823.4124 [M+HCOO] (calculated for C42H63O16, 823.4122) by HR-ESI-MS, consistent with a molecular formula of C41H62O14. The 1H and 13C NMR data (Table 3 and Table 4) for compound 9 were similar to those for siraitic acid II C (compound 14) [16], except for one additional methyl group in compound 9 (δC 23.2, δH 0.76 (3H, s)). Furthermore, this methyl signal (δC 23.2) was strongly correlated with H-8 (δH 1.90), C-9 (δC 50.0), C-10 (δC 41.1), and C-11(δC 214.8); C-9 was a quaternary carbon, thereby the methyl was attached to the C-9 position of the aglycone, which was determined to be the same as that in siraitic acid G. Therefore, the chemical structure of compound 9 was elucidated as shown in Figure 3 and named siraitic acid II G. (The spectrograms of compounds 9 are shown in Figures S25–S30).
Compound 11 was obtained as white amorphous powder and had a molecular formula of C41H64O15 deduced from the quasi-molecular ion peak at m/z 819.4166 [M+Na]+ (calculated for C41H64O15Na, 819.4137) by HR-ESI-MS. HMBC examination revealed the occurrence of an epoxy functional group between C-19 and C-5 and a carbonyl group at C-11, which is consistent with the parent nucleus of siraitic acid A [30]. Compound 11 was similar to siraitic acid II B (compound 12) [16], except that a hydroxyl group was placed at the C-3 position. Furthermore, it was observed that the carbon signal at C-3, in comparison with siraitic acid II B, evidently shifted to δC 78.3 in the 13C NMR data for compound 11. Thus, based on comprehensive 1H-1H COSY and HMBC correlation analysis, compound 11 was determined as shown in Figure 3 and named siraitic acid II A. (The spectrograms of compounds 11 are shown in Figures S31–S36).
The key 1H-1H COSY (red bold lines) and HMBC (blue arrows) correlations of the novel compounds are shown in Figure 4.

2.3.2. Identification of the Known Isolated Compounds

The other 10 known compounds were identified to be (-)-lariciresinol (1) [31], 3,4′-dimethoxy-4,9,9′-trihydroxy-benzofuranolignan-7′-ene (2) [32], 23,24-dihydrocucurbitacin F (3) [33], siraitic glycoside II F (5) [17], siraitic acid II B (12) [16], 23,24-dihydrocucurbitacin F-25-acetate (13) [34], siraitic acid II C (14) [16], cucurbitacin B (15) [35], 23,24-dihydrocucurbitacin B (16) [36], and dihydroisocucurbitacin B-25-acetate (17) [37], respectively, based on their 1H and 13C NMR spectroscopic data (Supporting Information), as well as the comparison of these data with those reported previously.

2.4. Inhibition of α-Glucosidase and Structural-Activity Relationship

Although the UF-HPLC assay was selective and specific for screening α-glucosidase ligands, false positives might arise from the nonspecific binding of certain compounds to nonfunctional α-glucosidase sites. To verify the potency of the abovementioned inhibitors, all isolated compounds were tested for α-glucosidase inhibition in vitro, at 1.0 mg/mL concentration (Table 2). Expectedly, all compounds exhibited different inhibitory actions. Compounds that displayed more than 50% inhibition were evaluated for IC50. Compounds 1, 2, 7, 9, 11, 12, 14, and 15 demonstrated significant in vitro α-glucosidase inhibitory activity, with IC50 values in the range of 430.13–2275.47 μM. Among these, compound 14 (siraitic acid II C) exhibited the strongest α-glucosidase inhibitory activity. This study is the first to report their inhibitory effects against α-glucosidase.
It is known that the structural diversity of active molecules leads to significant differences in α-glucosidase inhibitory activity. The isolated compounds included lignans, cucurbitacins, and cucurbitane glycosides. A limited structural-activity relationship was developed for all three classes of compounds. Compared with cucurbitane glycosides, lignans and cucurbitacins contain more hydroxy groups, which are distributed at different sites. Studies have verified that the number and sites of hydroxy groups in the molecular structures play very important roles in the inhibitory activity against α-glucosidase. Cucurbitacins, which are structurally diverse triterpenes found in members of the Cucurbitaceae and several other plant families, possess immense pharmacological potential [38]. Cucurbitacin B was reported to exhibit anticancer and antidiabetic activities [39] and showed better inhibitory activity against α-glucosidase than the other cucurbitacins in this study.
Among the cucurbitane glycoside derivatives, compounds with two glucose residues showed better activity than those with three or four glucose residues. Zhang et al. revealed that deglycosylation could occur in cucurbitane glycosides (mogrosides) of S. grosvenorii fruits in T2DM rats and confirmed that the hypoglycemic effects of the mogroside fraction containing 1–3 glucose residues were superior to that containing 4–5 glucose residues [15]. Relevant studies have also found that flavonoid deglycosylation increases the inhibitory activity against α-glucosidase [23,40]. This may be due to the larger size of the glycosylated side chains and greater steric hindrance, resulting in a significant decrease in the binding affinity toward α-glucosidase. However, the activity difference between the compounds with two glucose residues (siraitic glycoside II F, siraitic acid IIb E, siraitic acid II E, siraitic acid II A, siraitic acid II B, and siraitic acid II C) may be due to the difference in the site of hydroxy groups and their steric conformation.

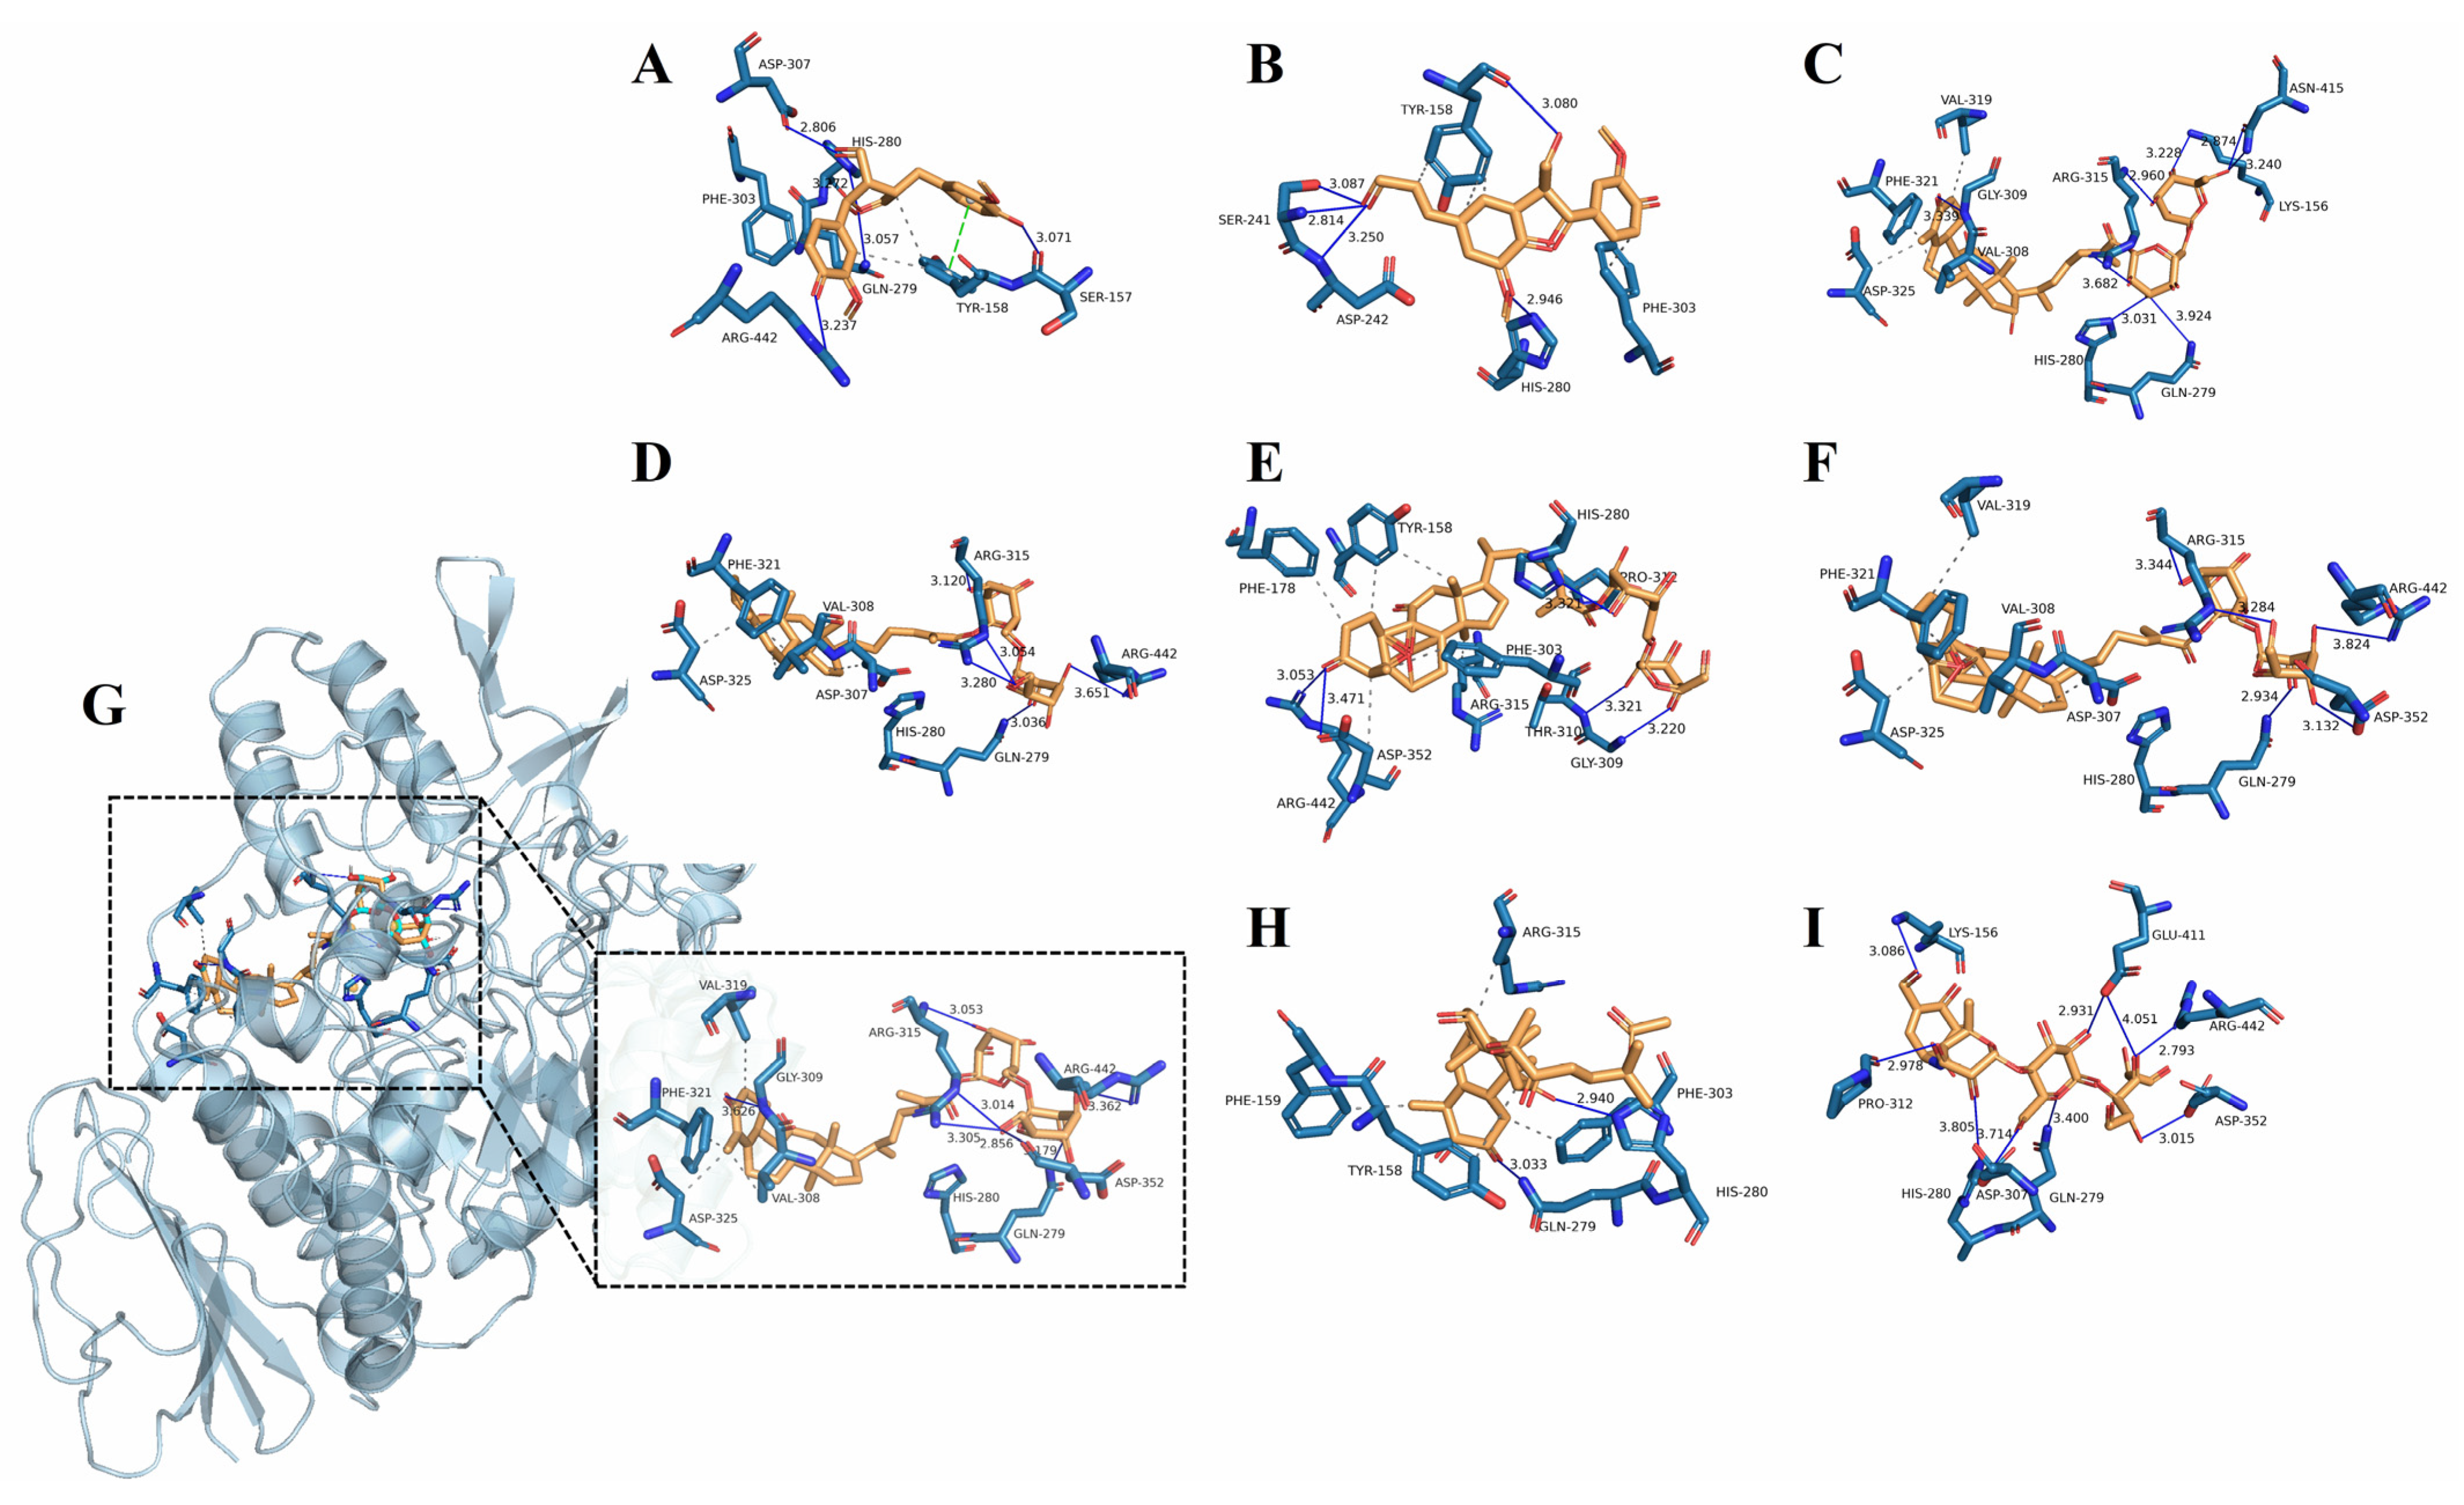
2.5. Molecular Docking Analysis

Molecular docking is a significant method to predict and study the interactions between ligand-receptor complexes by studying the docking energy, acting sites, and key residues [41]. The underlying mechanisms of the screened inhibitors (compounds 1, 2, 7, 9, 11, 12, 14, and 15) were further clarified by molecular docking analysis, the results of which are shown in Figure 5 and Table 5. Figure 5A–I shows the 3D structures of the docking of the eight inhibitors/acarbose with α-glucosidase. Table 5 lists the molecular docking results and shows that compounds (1, 2, 7, 9, 11, 12, 14, and 15) possessed a lower or equal binding affinity to acarbose, which indicated that these active compounds bound closely to the receptor for α-glucosidase. However, except for compounds 1 and 14, the inhibitory activities of the other compounds were lower than that of acarbose, despite their high binding energy values. This can be mainly attributed to the standard error of the Autodock program (2.5 kcal/mol) [42]. Notably, compound 14 demonstrated the strongest affinity to α-glucosidase (−10.0 kcal/mol), confirming that it was the strongest α-glucosidase inhibitor among the compounds isolated in the present study.
The docking results showed that all active compounds were well accommodated in the active site of α-glucosidase, through hydrogen bonding and/or hydrophobic interactions. With respect to specific docking sites, acarbose showed nine H-bond interactions with seven amino acid catalytic residues of α-glucosidase, including Gln 279, Asp352, Arg 442, Glu 411, Pro312, His 280, and Lys 156. Many studies have verified that Gln 279, Asp352, Arg442, Glu411, and His 280 are essential active catalytic sites of α-glucosidase [23]. The eight components formed multiple H-bonds with different amino acid residues of α-glucosidase. However, there were four common active residues (Asp 352, Arg 442, Gln 279, and His 280) that interacted with acarbose and the active isolated components, validating the established method.
In addition to H-bond interactions, hydrophobic effects also contributed to the interactions between α-glucosidase and the isolated compounds. However, only H-bond interactions were observed between acarbose and α-glucosidase, indicating that the isolated compounds possessed different active mechanisms against α-glucosidase compared with acarbose. The structural features observed in the isolated compounds included the presence of an electron-donating group, such as hydroxyl, carbonyl, and methyl groups, which bonded with the amino acid residues of α-glucosidase. For example, compound 14, which was the most active compound, formed seven H-bonds with four catalytic residues, Gly 309, Arg 315, Asp 352, and Arg 442, of α-glucosidase, with an average H-bond distance of 3.199 Å (Figure 5G and Table 5). On the one hand, compared with compound 14 (IC50 = 430.13 ± 13.33 μM), the lesser activity by compound 9 (IC50 = 1580.96 ± 12.54 μM) might be due to the introduction of a methyl group at C-9. This substitution undoubtedly increases steric hindrance, thereby inducing conformational changes and/or reducing accessibility to the active binding site [43]. On the other hand, although compound 7 formed more H- bond interactions than compounds 9 and 14, it still exhibited relatively low α-glucosidase inhibitory activity, which may be due to the difference in the catalytic active sites interacting with α-glucosidase. However, it is unclear which active site residues inhibit the catalytic activity of α-glucosidase. In summary, it was verified that the hydrogen bonds and hydrophobic effects between the isolated compounds and α-glucosidase play important roles in the high inhibition of α-glucosidase. These interaction modes clearly indicate the inhibitory capability of all isolated compounds against α-glucosidase. The results of the molecular docking study further confirmed the reliability of the UF screening technique.

3. Materials and Methods

3.1. Materials and Reagents

S. grosvenorii roots were collected from Longjiang Township (Guilin, China) and identified by Fenglai Lu, an associate researcher at the Guangxi Institute of Botany. Acarbose (RFS-A01411804026, ≥98%) and p-nitrophenyl-α-D-glucopyranoside (p-NPG, K17A10B82914, S10137, ≥99%) were acquired from Chengdu Herb Purify Co., Ltd. (Chengdu, China) and Yuanye Biological Technology Co., Ltd. (Shanghai, China), respectively. We obtained α-glucosidase (#00001076200, G5003-100UN, 24.19 U/mg) from Sigma-Aldrich (Shanghai, China). Phosphate-buffered saline (PBS, No. 20211029, pH 7.2–7.4) was purchased from Solarbio Science & Technology Co., Ltd. (Beijing, China). Acetonitrile (HPLC grade) was obtained from Fisher Scientific (Waltham, MA, USA), while dichloromethane, methanol, ethanol, and other organic solvents and chemicals (analytical grade) were acquired from Xilong Scientific (Guangzhou, China). Ultrapure water was used for all experiments.

3.2. Extraction and Preparation of Fractions from S. grosvenorii Root Extract

S. grosvenorii root extracts (SGR) were prepared as described previously [17]. Briefly, air-dried and powdered roots of S. grosvenorii (10 kg) were immersed in 70% (v/v) ethanol, extracted three times every two weeks at 25 °C (2 × 50 L), and concentrated under reduced pressure. The extract (1 kg) was inserted into a macroporous resin HPD-100 column (2 kg, 55 × 10 cm i.d.) and eluted with gradient mixtures of MeOH and H2O (40:60, 60:40, and 100:00 v/v; each 2.5 L). Finally, the 40% and 60% MeOH fractions were condensed, and the isolates were named SGR1 and SGR2, respectively, for chemical analysis and biological activity research.

3.3. Assessment of α-Glucosidase Inhibition

The α-glucosidase inhibitory activity of the S. grosvenorii root extracts was determined using a method mentioned previously [44], with some modifications to it. Briefly, the sample was dissolved in PBS containing 10% dimethyl sulfoxide. A mixture of the tested sample (50 μL, different concentrations) and α-glucosidase (20 μL, 0.2 U/mL) was placed in a 96-well microplate and incubated at 37 °C for 5 min. Next, 20 μL pNPG (1 mM) was added, and the mixture was further reacted for 30 min at 37 °C and terminated through the addition of NaCO3 solution (50 μL, 0.2 mM). The percentage inhibition of α-glucosidase was determined by measuring the absorbance of the mixture at 405 nm and calculated by Equation (1):
Inhibition (%) = [1 − (Ainhibitor − Ablank inhibitor)/(Acontrol − Acontrol blank)] × 100
where Ainhibitor, Ablank inhibitor, Acontrol, Acontrol blank are the absorbance values of the potential inhibitor and α-glucosidase, only the potential inhibitor without α-glucosidase, only α-glucosidase, and PBS buffer, respectively.

3.4. Screening and Identification of α-Glucosidase Inhibitors

Affinity UF was performed as previously described [45], with slight modifications. Briefly, a PBS solution of SGR2 (10 mg/mL, 800 μL) was mixed with α-glucosidase (1 U/mL, 400 μL) and incubated at 37 °C for 45 min. Next, the mixture was centrifuged at 10,000 rpm for 10 min using a UF membrane with a 10 kDa molecular weight cutoff, to collect the active component and α-glucosidase complexes. The complexes were washed 3 times with 600 μL of PBS (0.1 M, pH 7.2) to remove unbound compounds. A solution of 70% methanol (200 μL) was added to the residue and incubated at 4 °C for 20 min to release the bound compounds. Then, the solution was collected and concentrated to a dry state. Subsequently, the dry residue was further dissolved with 0.2 mL methanol and subjected to HPLC analysis. As a negative control, α-glucosidase was inactivated at 100 °C in a water bath for 10 min. The α-glucosidase inhibitors in SGR2 were subsequently identified by comparing the HPLC chromatograms of active α-glucosidase and inactive α-glucosidase. The specific binding factors were calculated according to Equation (2):
Specific binding factor (%) = (Aa − Ab)/Ac × 100%
where, Aa is the peak area of the experiment with active α-glucosidase, Ab is the peak area of the control group with denatured α-glucosidase, and Ac is the peak area of the extract.

3.5. Extraction and Isolation

The SGR2 extract (38 g) was inserted into an MCI gel CHP-20P column with a MeOH/H2O gradient (10:90 → 100:0, v/v) to yield five fractions (Fr 2.1–Fr 2.5). Guided by the HPLC analysis results, a combination of MCI macroporous resin column chromatography, HSCCC, and semi-preparative HPLC was conducted to isolate the active peaks. A total of 16 compounds were isolated: compounds 1 (25.8 mg), 2 (42.7 mg), 3 (16.1 mg), 4 (18.6 mg), 5 (30.7 mg), 6 (15.0 mg), 7 (14.6 mg), 8 (138.8 mg), 9 (14.3 mg), 11 (36.7 mg), 12 (185.5 mg), 13 (8.8 mg), 14 (10.8 mg), 15 (10.7 mg), 16 (5.0 mg), and 17 (3.8 mg). However, compound 10 could not be elucidated because it was unstable after purification. A flowchart of the process is shown in Figure 2. (Details of the extraction and isolation are presented in the Supporting Information).

3.6. Spectroscopic Data

The optical rotations were determined using a JASCO P-2000 polarimeter (Jasco Co., Tokyo, Japan). The IR spectra were recorded on a Mattson Genesis II spectrometer (Thermo Nicolet, Madison, WI, USA). High-resolution electrospray ionization (HR) ESI-MS spectra were obtained using an LCMS-IT-TOF (Shimadzu, Tokoyo, Japan) mass spectrometer with acetonitrile as the solvent. 1H and 13C NMR spectra were recorded on a Brucker Avance 500 instrument (Bruker BioSpin, Billerica, MA, USA) (500 MHz for 1H NMR and 126 MHz for 13C NMR) with C5D5N as the solvent. UV spectra were recorded on a Shimadzu UVmini-1240 (Shimadzu, Kyoto, Japan).

3.6.1. Siraitic Acid III E (4)

White amorphous powder; [α ] D 20 +15.1 (c 0.1, MeOH); IR (KBr) νmax: 3442, 1698, 1649, 1074 cm−1; UV (ACN) λmax: 247 nm; 1H and 13C NMR (Table 3 and Table 4); HR-ESI-MS m/z: 987.4471 [M+HCOO] (calculated for C47H71O22, 987.4442).

3.6.2. Siraitic Acid IIb E (6)

White amorphous powder; IR (KBr) νmax: 3391, 2927, 1704, 1647, 1076 cm−1; UV (ACN) λmax: 234 nm; 1H and 13C NMR (Table 3 and Table 4); HR-ESI-MS m/z: 803.3812 [M+Na]+ (calculated for C40H60O15Na, 803.3824).

3.6.3. Siraitic Acid II E (7)

White amorphous powder; IR (KBr) νmax: 3400, 2927, 1703, 1647, 1072 cm−1; UV (ACN) λmax: 228 nm; 1H and 13C NMR (Table 3 and Table 4); HR-ESI-MS m/z: 803.3774 [M+Na]+ (calculated for C40H60O15Na, 803.3824).

3.6.4. Siraitic Acid IV H (8)

White amorphous powder; [α ] D 20 −394.8 (c 0.1, MeOH); IR (KBr) νmax: 3417, 3168, 1716, 1069 cm−1; UV (ACN) λmax: 231 nm; 1H and 13C NMR (Table 3 and Table 4); HR-ESI-MS m/z: 1103.5267 [M−H] (calculated for C53H83O24, 1103.5280).

3.6.5. Siraitic Acid II G (9)

White amorphous powder; IR (KBr) νmax: 3400, 2929, 1703, 1072 cm−1; UV (ACN) λmax: 232 nm; 1H and 13C NMR (Table 3 and Table 4); HR-ESI-MS m/z: 823.4124 [M+HCOO] (calculated for C42H63O16, 823.4122).

3.6.6. Siraitic Acid II A (11)

White amorphous powder; [α ] D 20 +65.9 (c 0.1, MeOH); IR (KBr) νmax: 3391, 2933, 1698, 1069 cm−1; 1H and 13C NMR (Table 3 and Table 4); HR-ESI-MS m/z: 987.4471 [M+HCOO] (calculated for C47H71O22, 987.4442).

3.7. HPLC Conditions

HPLC analysis was performed on an Agilent 1260 Infinity II (Agilent Technologies, Santa Clara, CA, USA) consisting of a G7111A quaternary pump, a G7129A automated sample injector, a G7116A thermostated column compartment, a G7115A DAD detector, and a Poroshell 120 EC-C18 column (4 μm, 150 mm × 4.6 mm, Agilent Technologies, Santa Clara, CA, USA) at 30 °C. The gradient system consisted of acetonitrile (A) and water (B), using the following gradient elution profile: 0 min, 20% A, 40 min, 50% A, at a flow rate of 0.8 mL/min.

3.8. Determination of Sugar Configuration

The sugar configurations of compounds 4, 6, 7, 8, 9, and 11 were determined using a method described previously [46]. Briefly, the compound (1 mg) was hydrolyzed by heating in 0.5 M HCl (0.1 mL), and Amberlite IRA400 was added to neutralize it. After the filtrate was vacuum-dried, the residue was dissolved in 0.1 mL pyridine that contained 0.5 mg L-cysteine methyl ester hydrochloride and heated at 60 °C for 1 h. Subsequently, a 0.1 mL solution of o-tolyl isocyanate (0.5 mg) in pyridine was added, and the mixture was heated at 60 °C for another 1 h. The reaction solution was directly analyzed by HPLC on a Poroshell 120 EC-C18 column (4 μm, 150 mm × 4.6 mm); an isocratic elution of acetonitrile and water (25:75, v/v) at a flow rate of 0.8 mL/min was performed, and the detection wavelength was 254 nm. The absolute configuration of the sugar component was determined by comparing the retention time tR for these compounds with that of D-glucose.

3.9. Molecular Docking Analysis

To explore how the screened inhibitors conjugated with α-glucosidase, the binding interactions between compounds and α-glucosidase were investigated using molecular docking. The crystal structure of α-glucosidase was downloaded from the Protein Data Bank database (PDB ID: 3A4A) (https://www.rcsb.org/, accessed on 16 February 2023), and the 3D structures of the ligands with the lowest energies were established using Chem3D Ultra 19.0. Molecular docking was performed using the AutoDock vina 1.1.2 software suite [47]. The centroid coordinate of the grid box was set as below: x: 21.281, y: −0.635, z: 18.475, with a map of 33.75 × 33.75 × 33.75.

3.10. Statistical Analysis

All experiments were repeated three times, and the results are presented as the mean ± standard deviation. The data were analyzed using the SPSS 22 and Origin 2018 software. (OriginPro 2018C SR1 b9.5.1.195).

4. Conclusions

Elucidating the phytochemical profiles and bioactive compounds is crucial for the application of new plant resources in the health, food, and pharmaceutical industries. In the present study, a strategy for rapid screening and targeted separation of α-glucosidase inhibitors from an active S. grosvenorii roots fraction, SGR2, was developed using UF-HPLC and a combination of comprehensive separation techniques. Sixteen potential inhibitors were successfully isolated from SGR2, including lignans, cucurbitacins, and cucurbitane glycosides. Among them, six compounds were novel cucurbitane-type triterpenoids, and their structures were meticulously elucidated through NMR spectroscopy and HR-ESI-MS. Notably, all isolated compounds exhibited α-glucosidase inhibitory activities, as verified by enzyme inhibition assays and molecular docking analysis. Siraitic acid II C (compound 14) showed the highest inhibitory activity with an IC50 value of 430.13 ± 13.33 μM, which is superior to that of acarbose (1332.50 ± 58.53 μM). Molecular docking evaluations confirmed that these inhibitors interacted with α-glucosidase through hydrogen bonds and hydrophobic interactions, showing different active mechanisms against α-glucosidase than that exhibited by acarbose. Therefore, our results not only demonstrate the beneficial effects of S. grosvenorii roots and their constituents on α-glucosidase inhibition, providing a theoretical basis for their application in the prevention and treatment of diabetes, but also indicate that this strategy is efficient in distinguishing potential α-glucosidase inhibitors from natural plant extracts, given that it overcomes the randomness and blindness associated with the isolation of compounds using existing conventional separation strategies.

Supplementary Materials

The supporting information can be downloaded at: https://www.mdpi.com/article/10.3390/ijms241210178/s1.

Author Contributions

Conceptualization, F.L, J.S. (Jingru Song) and Q.T.; experiments, J.S. (Jiayi Sun); original draft, J.S. (Jiayi Sun); investigation, X.J., X.Y. and F.L.; data curation, J.S. (Jiayi Sun) and F.L.; methodology, X.J. and J.S. (Jingru Song); formal analysis, F.L.; conceptualization, J.S. (Jingru Song) and D.L.; validation, X.Y.; supervision, D.L. and Q.T.; project administration, D.L.; funding acquisition, D.L. All authors have read and agreed to the published version of the manuscript.

Funding

This research was funded by Guangxi Science and Technology Major Project (Guike AA22096020), the Joint Funds of the National Natural Science Foundation of China (No. U20A2004), Guangxi Science and Technology Base and Talent Project [grant number Guike AA21196009], the National Key Research and Development Program of China (No. 2022YFD1600302), Natural Science Foundation of Guangxi (2023GXNSFDA026053), Guilin Key Research and Development Project (2020010404), the Natural Science Foundation of Guangxi (No. 2020GXNSFBA297055), and the Guilin Innovation Platform and Talent Plan (20210102-3).

Institutional Review Board Statement

Not applicable.

Informed Consent Statement

Not applicable.

Data Availability Statement

The data presented in this study are available upon request from the corresponding author.

Conflicts of Interest

The authors declare no conflict of interest.

References

  1. International Diabetes Federation. IDF Diabetes Atlas. Available online: https://diabetesatlas.org/atlas/tenth-edition/ (accessed on 31 January 2023).
  2. Morais, F.S.; Canuto, K.M.; Ribeiro, P.R.V.; Silva, A.B.; Pessoa, O.D.L.; Freitas, C.D.T.; Alencar, N.M.N.; Oliveira, A.C.; Ramos, M.V. Chemical profiling of secondary metabolites from Himatanthus drasticus (Mart.) Plumel latex with inhibitory action against the enzymes α-amylase and α-glucosidase: In vitro and in silico assays. J. Ethnopharmacol. 2020, 253, 112644. [Google Scholar] [CrossRef]
  3. Tan, K.; Tesar, C.; Wilton, R.; Jedrzejczak, R.P.; Joachimiak, A. Interaction of antidiabetic α-glucosidase inhibitors and gut bacteria α-glucosidase. Protein Sci. 2018, 27, 1498–1508. [Google Scholar] [CrossRef] [Green Version]
  4. Kim, J.H.; Ahn, J.H.; Kim, S.K.; Lee, D.H.; Kim, H.S.; Shon, H.S.; Jeon, H.J.; Kim, T.H.; Cho, Y.W.; Kim, J.T.; et al. Combined use of basal insulin analog and acarbose reduces postprandial glucose in patients with uncontrolled type 2 diabetes. J. Diabetes Investig. 2015, 6, 219–226. [Google Scholar] [CrossRef]
  5. Kumar, R.V.; Sinha, V.R. Newer insights into the drug delivery approaches of α-glucosidase inhibitors. Expert Opin. Drug Deliv. 2012, 9, 403–416. [Google Scholar] [CrossRef]
  6. Lianza, M.; Poli, F.; Nascimento, A.M.d.; Soares da Silva, A.; da Fonseca, T.S.; Toledo, M.V.; Simas, R.C.; Chaves, A.R.; Leitão, G.G.; Leitão, S.G. In vitro α-glucosidase inhibition by Brazilian medicinal plant extracts characterised by ultra-high performance liquid chromatography coupled to mass spectrometry. J. Enzym. Inhib. Med. Chem. 2022, 37, 554–562. [Google Scholar] [CrossRef] [PubMed]
  7. Alam, F.; Shafique, Z.; Amjad, S.T.; Bin Asad, M.H.H. Enzymes inhibitors from natural sources with antidiabetic activity: A review. Phytother. Res. 2019, 33, 41–54. [Google Scholar] [CrossRef] [PubMed] [Green Version]
  8. Imtiaz, F.; Islam, M.; Saeed, H.; Ahmed, A.; Hashmi, F.K.; Khan, K.M.; Dar, U.I.; Ullah, K.; Rana, S.M.; Saleem, B.; et al. Prediction of α-Glucosidase Inhibitory Activity of LC-ESI-TQ-MS/MS-Identified Compounds from Tradescantia pallida Leaves. Pharmaceutics 2022, 14, 2578. [Google Scholar] [CrossRef] [PubMed]
  9. Mukherjee, P.K.; Singha, S.; Kar, A.; Chanda, J.; Banerjee, S.; Dasgupta, B.; Haldar, P.K.; Sharma, N. Therapeutic importance of Cucurbitaceae: A medicinally important family. J. Ethnopharmacol. 2022, 282, 114599. [Google Scholar] [CrossRef] [PubMed]
  10. Li, Y.; Zou, L.Y.; Li, T.; Lai, D.N.; Wu, Y.Y.; Qin, S. Mogroside V inhibits LPS-induced COX-2 expression/ROS production and overexpression of HO-1 by blocking phosphorylation of AKT1 in RAW264.7 cells. Acta Biochim. Biophys. Sin. 2019, 51, 365–374. [Google Scholar] [CrossRef]
  11. Li, L.H.; Zheng, W.F.; Wang, C.; Qi, J.M.; Li, H.B. Mogroside V Protects against Hepatic Steatosis in Mice on a High-Fat Diet and LO2 Cells Treated with Free Fatty Acids via AMPK Activation. J. Evid.-Based Complement. Altern. Med. 2020, 2020, 7826874. [Google Scholar] [CrossRef]
  12. Liu, C.; Dai, L.; Liu, Y.; Rong, L.; Dou, D.; Sun, Y.; Ma, L. Antiproliferative Activity of Triterpene Glycoside Nutrient from Monk Fruit in Colorectal Cancer and Throat Cancer. Nutrients 2016, 8, 360. [Google Scholar] [CrossRef] [PubMed] [Green Version]
  13. Liu, H.S.; Wang, C.C.; Qi, X.Y.; Zou, J.; Sun, Z.D. Antiglycation and antioxidant activities of mogroside extract from Siraitia grosvenorii (Swingle) fruits. J. Food Sci. Technol. 2018, 55, 1880–1888. [Google Scholar] [CrossRef] [PubMed]
  14. Zhao, X.; Fu, X.Y.; Wang, T.T.; Xu, R.; Shayiranbieke, A.; Zheng, X.X.; Jia, X.N.; Xiao, C.N.; Zhao, X.F. Screening of bioactive flavour compounds targeting muscarinic-3 acetylcholine receptor from Siraitia grosvenorii and evaluation of their synergistic anti-asthmatic activity. Food Chem. 2022, 395, 133593. [Google Scholar] [CrossRef] [PubMed]
  15. Zhang, Y.; Zhou, G.; Peng, Y.; Wang, M.; Li, X. Anti-hyperglycemic and anti-hyperlipidemic effects of a special fraction of Luohanguo extract on obese T2DM rats. J. Ethnopharmacol. 2020, 247, 112273. [Google Scholar] [CrossRef]
  16. Li, D.P.; El-Aasr, M.; Ikeda, T.; Ogata, M.; Miyashita, H.; Yoshimitsu, H.; Nohara, T. Two new cucurbitane-type glycosides obtained from roots of Siraitia grosvenori SWINGLE. Chem. Pharm. Bull. 2009, 57, 870–872. [Google Scholar] [CrossRef] [Green Version]
  17. Lu, F.L.; Sun, J.Y.; Jiang, X.H.; Yang, X.R.; Liu, H.W.; Yan, X.J.; Chen, Y.Y.; Li, D.P. The generally useful estimate of solvent systems method facilitates off-line two-dimensional countercurrent chromatography for isolating compositions from Siraitia grosvenorii roots. J. Sep. Sci. 2023, 46, e2200708. [Google Scholar] [CrossRef]
  18. Si, J.Y.; Chen, D.H.; Tu, G.Z. Siraitic acid F, a new nor-cucurbitacin with novel skeleton, from the roots of Siraitia grosvenorii. J. Asian Nat. Prod. Res. 2005, 7, 37–41. [Google Scholar] [CrossRef]
  19. Sun, J.Y.; Sun, J.Q.; Li, H.P.; Yan, X.J.; Li, D.P.; Lu, F.L. Preparation of cucurbitacin compounds in Siraitia grosvenorii roots by high speed countercurrent chromatography. Se Pu Chin. J. Chromatogr. 2022, 40, 364–371. [Google Scholar] [CrossRef]
  20. Si, J.Y.; Chen, D.H.; Shen, L.G.; Tu, G.Z. Studies on the chemical constituents from the root of Siraitia grosvenorii. Acta Pharm. Sin. 1999, 34, 918–920. [Google Scholar]
  21. Abudurexiti, A.; Zhang, R.; Zhong, Y.; Tan, H.; Yan, J.; Bake, S.; Ma, X. Identification of α-glucosidase inhibitors from Mulberry using UF-UPLC-QTOF-MS/MS and molecular docking. J. Funct. Foods 2023, 101, 105362. [Google Scholar] [CrossRef]
  22. Miranda de Souza Duarte-Filho, L.A.; Ortega de Oliveira, P.C.; Yanaguibashi Leal, C.E.; de Moraes, M.C.; Picot, L. Ligand fishing as a tool to screen natural products with anticancer potential. J. Sep. Sci. 2023, 2200964. [Google Scholar] [CrossRef] [PubMed]
  23. Cai, Y.Z.; Wu, L.F.; Lin, X.; Hu, X.P.; Wang, L. Phenolic profiles and screening of potential α-glucosidase inhibitors from Polygonum aviculare L. leaves using ultra-filtration combined with HPLC-ESI-qTOF-MS/MS and molecular docking analysis. Ind. Crops Prod. 2020, 154, 112673. [Google Scholar] [CrossRef]
  24. Muchiri, R.N.; van Breemen, R.B. Drug discovery from natural products using affinity selection-mass spectrometry. Drug Discov. Today Technol. 2021, 40, 59–63. [Google Scholar] [CrossRef]
  25. Choi, Y.; Jung, Y.; Kim, S.-N. Identification of Eupatilin from Artemisia argyi as a Selective PPARα Agonist Using Affinity Selection Ultrafiltration LC-MS. Molecules 2015, 20, 13753–13763. [Google Scholar] [CrossRef] [Green Version]
  26. Zhang, H.; Zhang, X.J.; Jiang, H.J.; Xu, C.; Tong, S.Q.; Yan, J.Z. Screening and identification of α-glucosidase inhibitors from Shenqi Jiangtang Granule by ultrafiltration liquid chromatography and mass spectrometry. J. Sep. Sci. 2018, 41, 797–805. [Google Scholar] [CrossRef]
  27. Abdulla, R.; Mansur, S.; Lai, H.; Ubul, A.; Sun, G.; Huang, G.; Aisa, H.A. Qualitative Analysis of Polyphenols in Macroporous Resin Pretreated Pomegranate Husk Extract by HPLC-QTOF-MS. Phytochem. Anal. 2017, 28, 465–473. [Google Scholar] [CrossRef] [PubMed]
  28. Agrawal, P.K. NMR spectroscopy in the structural elucidation of oligosaccharides and glycosides. Phytochemistry 1992, 31, 3307–3330. [Google Scholar] [CrossRef]
  29. Prakash, I.; Chaturvedula, V.S. Additional new minor cucurbitane glycosides from Siraitia grosvenorii. Molecules 2014, 19, 3669–3680. [Google Scholar] [CrossRef] [Green Version]
  30. Wang, X.; Lu, W.; Chen, J.; Gong, M.; Li, Y.; Lu, D.; Lv, Y.; Zheng, Q. Studies on the chemical constituents of root of Luohanguo (Siraitia grosvenori). Chin. Herb. Med. 1996, 27, 515–518. [Google Scholar]
  31. Yang, L.; Wang, H.; Yan, H.; Wang, K.; Wu, S.; Li, Y. (−)-Lariciresinol Isolated from the Roots of Isatis indigotica Fortune ex Lindl. Inhibits Hepatitis B Virus by Regulating Viral Transcription. Molecules 2022, 27, 3223. [Google Scholar] [CrossRef]
  32. Yu, D.; Yang, J. Nuclear magnetic resonance spectroscopy. In Analytical Chemistry Manual, 2nd ed.; Chemical Industry Press: Beijing, China, 1999; Volume VII, p. 873. [Google Scholar]
  33. Torres-Moreno, H.; Marcotullio, M.C.; Velázquez, C.; Ianni, F.; Robles-Zepeda, R.E. Cucurbitacin IIb, a steroidal triterpene from Ibervillea sonorae induces antiproliferative and apoptotic effects on cervical and lung cancer cells. Steroids 2020, 157, 108597. [Google Scholar] [CrossRef] [PubMed]
  34. Nie, R.L.; Morita, T.; Kasai, R.; Zhou, J.; Wu, C.Y.; Tanaka, O. Saponins from Chinese medicinal plants. (I). Isolation and structures of hemslosides. Planta Med. 1984, 50, 322–327. [Google Scholar] [CrossRef] [PubMed]
  35. Kim, H.J.; Lee, J.Y.; Cheon, C.; Ko, S.-G. Development and Validation of a New Analytical HPLC-PDA Method for Simultaneous Determination of Cucurbitacins B and D from the Roots of Trichosanthes kirilowii. J. Chem. 2022, 2022, 2109502. [Google Scholar] [CrossRef]
  36. Li, H.H.; Li, J.; Zhang, X.J.; Li, J.M.; Xi, C.; Wang, W.Q.; Lu, Y.L.; Xuan, L.J. 23,24-Dihydrocucurbitacin B promotes lipid clearance by dual transcriptional regulation of LDLR and PCSK9. Acta Pharmacol. Sin. 2020, 41, 327–335. [Google Scholar] [CrossRef]
  37. Li, Z.-R.; Qiu, M.-H.; Xu, X.-P.; Tian, J.; Nie, R.-L.; Duan, Z.-H.; Lei, Z.-M. Triterpenoid Saponins and a Cucurbitcin from Thladiatha cordifolia. Plant Divers. 1998, 20, 1–3. [Google Scholar]
  38. Kaushik, U.; Aeri, V.; Mir, S.R. Cucurbitacins—An insight into medicinal leads from nature. Pharmacogn. Rev. 2015, 9, 12–18. [Google Scholar]
  39. Kim, K.H.; Lee, I.S.; Park, J.Y.; Kim, Y.; An, E.J.; Jang, H.J. Cucurbitacin B Induces Hypoglycemic Effect in Diabetic Mice by Regulation of AMP-Activated Protein Kinase Alpha and Glucagon-Like Peptide-1 via Bitter Taste Receptor Signaling. Front. Pharmacol. 2018, 9, 1071. [Google Scholar] [CrossRef]
  40. Proença, C.; Ribeiro, D.; Freitas, M.; Fernandes, E. Flavonoids as potential agents in the management of type 2 diabetes through the modulation of α-amylase and α-glucosidase activity: A review. Crit. Rev. Food Sci. Nutr. 2022, 62, 3137–3207. [Google Scholar] [CrossRef]
  41. Ibrahim, R.M.; Elmasry, G.F.; Refaey, R.H.; El-Shiekh, R.A. Lepidium meyenii (Maca) Roots: UPLC-HRMS, Molecular Docking, and Molecular Dynamics. ACS Omega 2022, 7, 17339–17357. [Google Scholar] [CrossRef]
  42. Shahzad, D.; Saeed, A.; Larik, F.A.; Channar, P.A.; Abbas, Q.; Alajmi, M.F.; Arshad, M.I.; Erben, M.F.; Hassan, M.; Raza, H.; et al. Novel C-2 Symmetric Molecules as α-Glucosidase and α-Amylase Inhibitors: Design, Synthesis, Kinetic Evaluation, Molecular Docking and Pharmacokinetics. Molecules 2019, 24, 1511. [Google Scholar] [CrossRef] [Green Version]
  43. Liu, B.R.; Zheng, H.R.; Jiang, X.J.; Zhang, P.Z.; Wei, G.Z. Serratene triterpenoids from Lycopodium cernuum L. as α-glucosidase inhibitors: Identification, structure-activity relationship and molecular docking studies. Phytochemistry 2022, 195, 113056. [Google Scholar] [CrossRef] [PubMed]
  44. Flores-Bocanegra, L.; González-Andrade, M.; Bye, R.; Linares, E.; Mata, R. α-Glucosidase Inhibitors from Salvia circinata. J. Nat. Prod. 2017, 80, 1584–1593. [Google Scholar] [CrossRef] [PubMed]
  45. Fang, H.L.; Liu, M.L.; Li, S.Y.; Song, W.Q.; Ouyang, H.; Xiao, Z.P.; Zhu, H.L. Identification, potency evaluation, and mechanism clarification of α-glucosidase inhibitors from tender leaves of Lithocarpus polystachyus Rehd. Food Chem. 2022, 371, 131128. [Google Scholar] [CrossRef]
  46. Tanaka, T.; Tomii, K.; Ueda, T.; Kouno, I.; Nakashima, T. Facile discrimination of aldose enantiomers by reversed-phase HPLC. Chem. Pharm. Bull. 2007, 55, 899–901. [Google Scholar] [CrossRef] [PubMed] [Green Version]
  47. Trott, O.; Olson, A.J. AutoDock Vina: Improving the speed and accuracy of docking with a new scoring function, efficient optimization, and multithreading. J. Comput. Chem. 2010, 31, 455–461. [Google Scholar] [CrossRef] [PubMed] [Green Version]
Figure 1. The chromatograms obtained from the high-performance liquid chromatography (HPLC) (230 nm) of the chemical constituents in the SGR2 fraction obtained by ultrafiltration. The black solid line represents HPLC profiles of the SGR2 fraction without ultrafiltration (c); the blue and red lines represent HPLC profiles of the SGR2 fraction with activated (a) and inactivated α-glucosidase by ultrafiltration (b), respectively.
Ijms 24 10178 g001
Figure 2. Flowchart of the process used for the purification of compounds from Siraitia grosvenorii roots.
Ijms 24 10178 g002
Figure 3. Chemical structures of compounds 117, isolated from Siraitia grosvenorii root (SGR2).
Ijms 24 10178 g003
Figure 4. Key 1H 1H correlation spectroscopy (COSY; red bold lines) and heteronuclear multiple bond coherence (HMBC; blue arrows) correlations of compounds 4, 6, 7, 8, 9, and 11.
Ijms 24 10178 g004
Figure 5. Molecular docking analysis of the isolated potential inhibitors and acarbose with α-glucosidase. Compound 1 (A), 2 (B), 7 (C), 9 (D), 11 (E), 12 (F), 14 (G), 15 (H), and acarbose (I). The blue solid lines represent hydrogen bonds, and the gray dashed lines represent hydrophobic interactions. Compound 14 was used as an example to demonstrate the three-dimensional structure and pocket of the protein-ligand complex.
Ijms 24 10178 g005
Table 1. Inhibition of α-glucosidase by the crude S. grosvenorii root extract and its MeOH eluent fractions.
SampleInhibition (%) 1IC50 (μg/mL) 2
crude extract9.81 ± 1.214850.0 ± 217.6
SGR148.09 ± 0.83990.7 ± 21.6
SGR259.07 ± 2.73631.1 ± 50.2
Acarbose55.15 ± 1.55860.3 ± 31.3 3
1 The results are expressed as % of inhibition testing the samples at a concentration of 1.0 mg/mL; 2 each value is mean ± SD; 3 the molar concentration is 1332.50 ± 58.53 μM.
Table 2. The retention time, specific binding factors, and inhibitory activity of 17 active peaks binding to α-glucosidase (%).
PeakRetention Time (min)Compound NamesSpecific Binding Factors Mean ± SD (n = 3)Inhibition (%) 1IC50 (μM) 2
110.16(-)-lariciresinol4.97 ± 0.1578.18 ± 1.541832.87 ± 31.33
210.913,4′-dimethoxy-4,9,9′-trihydroxy-benzofuranolignan-7′-ene1.87 ± 0.7763.43 ± 0.232275.47 ± 13.80
315.1223,24-dihydrocucurbitacin F3.76 ± 0.3338.27 ± 0.70n.d.
416.19Siraitic acid III E2.93 ± 0.7236.74 ± 0.36n.d.
518.40Siraitic glycoside II F4.39 ± 0.4242.73 ± 1.79n.d.
619.13Siraitic acid IIb E3.91 ± 0.1742.44 ± 0.81n.d.
720.00Siraitic acid II E3.46 ± 1.0358.48 ± 1.191206.84 ± 5.49
820.74Siraitic acid IV H0.27 ± 0.1823.38 ± 1.05n.d.
922.07Siraitic acid II G5.33 ± 2.1153.12 ± 0.991580.96 ± 12.54
1023.30Unknown6.27 ± 1.08--
1123.96Siraitic acid II A6.59 ± 0.9150.60 ± 1.231239.78 ± 20.49
1224.60Siraitic acid II B6.65 ± 1.1851.34 ± 0.831034.53 ± 36.95
1326.4623,24-dihydrocucurbitacin F-25-acetate1.31 ± 0.0621.67 ± 0.58n.d.
1429.36Siraitic acid II C17.26 ± 3.1472.01 ± 2.18430.13 ± 13.33
1530.27Cucurbitacin B7.98 ± 1.1150.59 ± 0.981505.41 ± 57.02
1630.8123,24-dihydrocucurbitacin B4.70 ± 0.7627.54 ± 3.80n.d.
1732.58Dihydroisocucurbitacin B-25-acetate2.28 ± 0.4423.74 ± 0.33n.d.
1 Inhibition rate (%) was measured in the concentration of 1.0 mg/mL compound; 2 n.d. = not determined because α-glucosidase inhibition at a concentration of 1.0 mg/mL was lower than 50%.
Table 3. 1H-NMR data of compounds 4, 69, and 11 (in C5D5N, δ in ppm, 500 MHz).
Position4678911
aglycone
12.60, 1.42, m2.59, 1.41, m2.65, 1.51, m1.85, m2.02, 1.87, m1.11, 2.05, m
22.47, 2.38, m2.47, 2.38, m2.53, 2.44, m2.58, 2.16, m 1.54, 1.91, m
3 3.73, m 3.86, d (7.5)
4 1.58, dd (7.1, 3.0)
62.79, 1.80, m2.80, 1.78, m2.84, 1.86, m5.51, m2.45, m1.84, 1.98, m
71.51, 1.24, m1.48, 1.23, m1.58, 1.33, m1.59, 1.19, m1.68, m1.25, 1.96, m
81.82, m1.82, m1.86, m1.96, m1.90, m2.04, br t (7.2)
92.27, m2.28, t, (11.1)2.37, t (11.4)2.18, m
102.72, m2.71, m2.75, m3.14, m2.91, m2.40, dd (11.8, 5.8)
11
122.80, 2.47, m2.80, 2.47, m2.93, 2.56, d (12.4)2.50, m2.82, 2.61, d (16.3)
151.64, 1.95, m1.93, 1.62, m1.95, 1.68, m1.17, m1.29, m
164.52, m4.52, t (7.0)4.30, m1.89, m1.94, m
172.21, m2.13, m2.12, m 1.70, m
180.75, s0.74, s0.83, s0.70, s0.76, s0.68, s
19 1.11, s3.67, d (8.4),
4.73, d (8.4)
201.60, m1.61, m1.61, m1.30, m1.34, m
210.86, d (6.0)0.87, d (6.6)0.93, d (6.2)0.82, d (6.4)0.84, d (6.5)0.85, d (6.4)
222.11, 1.72, m2.07, 1.79, m1.98, m1.37, 0.98, m1.44, m
232.36, 2.08, m2.44, 2,10, m2.47, 2.04, m2.15, 1.94, m2.19, m
247.36, t (7.7)7.40, t (7.1)7.38, t (6.7)7.06, t (6.9)7.09, t (7.5)
261.93, s1.95, s1.93, s1.91, s1.92, s1.93, s
281.91, s1.91, s1.89, s1.11, s1.90, s1.35, d (7.0)
29 1.52, s
301.50, s1.51, s1.48, s0.90, s1.16, s1.19, s
sugar
GI14.87, d (7.7)4.88, d (7.7)6.42, d (8.2)4.81, m6.45, d (8.0)6.47, d (8.0)
GI24.01, m3.95, t (8.5)4.16, m3.90, m4.25, m4.01, m
GI34.24, m4.23, m4.15, m4.20, m3.89, m3.90, m
GI44.16, m4.17, m4.41, t (9.7)3.97, m4.44, m4.21, m
GI53.92, m4.01, m4.28, m4.11, m4.22, m4.18, m
GI64.34, 4.46, m4.44, 4.37, m4.77, 4.37, m4.83, 4.30, m4.79, d (11.9)
4.38, m
4.78, 4.38, m
GII16.37, d (7.6)6.50, d (7.6)6.47, d (7.6)5.15, m5.02, m4.93, d (8.3)
GII24.25, m4.34, m4.01, t (8.2)4.04, m4.05, t (8.2)4.01, m
GII34.19, m4.31, m3.90, m4.20, m4.31, m4.01, m
GII44.20, m4.36, m4.21, m4.11, m4.24, m4.18, m
GII54.24, m4.02, m4.18, m4.20, m4.22, m3.85, m
GII64.73, 4.34, m4.66, 4.42, m4.50, 4.36, m4.53, 4.37, m4.49, d (11.9)
4.37, m
4.63, 4.40, m
GIII14.99, d (7.9) 6.43, d (7.6)
GIII24.01, m 4.22, m
GIII34.01, m 4.23, m
GIII44.20, m 4.41, m
GIII53.87, m 4.20, m
GIII64.65, 4.42, m 4.77, 4.37, m
GIV1 5.02, d (7.8)
GIV2 4.01, m
GIV3 3.88, m
GIV4 4.23, m
GIV5 4.20, m
GIV6 4.47, 4.35, m
Table 4. 13C-NMR data for compounds 4, 69, and 11 in C5D5N (δ in ppm, 125 MHz).
Position4678911Position4678911
aglycone sugar
128.828.828.926.224.918.5GI1102.8102.896.6107.596.696.7
237.637.637.730.237.820.2GI275.475.574.575.774.575.6
3198.9198.8198.988.2197.971.0GI379.078.778.279.078.978.3
4130.3130.3130.343.0132.940.8GI472.672.871.172.171.271.3
5158.2158.1158.2144.8157.386.4GI578.779.078.977.878.379.0
631.231.231.3118.928.526.2GI662.962.469.870.969.970.0
727.927.927.928.721.728.5GII196.596.5105.8106.0105.7105.8
845.345.345.436.545.846.0GII274.474.775.575.675.574.6
955.055.055.150.750.060.6GII378.679.078.779.078.878.9
1038.138.138.135.441.145.4GII471.871.371.872.171.871.9
11210.9210.8211.0212.5214.8210.3GII578.879.778.878.978.878.8
1252.552.652.852.351.551.0GII669.864.262.963.263.063.0
1347.747.847.947.047.449.3GIII1105.5 96.7
1451.151.151.547.849.749.6GIII275.4 74.6
1540.040.045.433.434.934.2GIII378.8 78.9
1683.082.877.057.828.332.6GIII473.5 71.2
1756.356.358.750.550.849.9GIII578.8 78.4
1817.917.917.917.117.917.0GIII664.0 70.0
19 23.274.9GIV1 105.8
2034.934.835.236.736.536.4GIV2 75.6
2119.219.219.118.818.618.7GIV3 78.8
2233.833.934.935.535.235.3GIV4 71.8
2326.226.026.226.326.226.2GIV5 78.7
24146.4146.3145.5145.2145.0144.9GIV6 63.0
25127.2127.3127.8128.0127.9127.9
2613.013.112.913.012.812.9
27167.6167.6167.5167.6167.5167.6
2811.511.611.627.311.613.5
29 25.6
3017.717.717.917.219.720.4
Table 5. Molecular interactions between α-glucosidase and potential inhibitors/acarbose.
Main CompoundBinding
Affinity
(kcal/mol)
Number of Binding
to Residues
Residues Involved in
H-Bond Formation
Hydrophobic Interaction
1−8.55HIS 280, GLN 279, SER 157, ASP 307, ARG 442SER 157, GLN 279, HIS 280, ASP 307, ARG 442
π-π stacking: TYR158
2−8.55SER 241, ASP 242, TYR 158, HIS 280TYR 158, SER 241, ASP 242, HIS 280
7−9.98LYS 156, HIS 280, GLN 279, ARG 315, GLY 309, ASN 415VAL 319, VAL 308, ASP325, PHE 321
9−9.95ARG 315, ARG 442, GLN 279VAL 308, PHE 321, ASP 325, ASP 307
11−9.85HIS 280, THR 310, GLY 309, ASP 352, ARG 442ASP 352, PHE 303, ARG 315, TYR 158, PRO 312
12−10.05GLN 279, ARG 315, ASP 352, ARG442VAL 319, PHE 321, ASP325, ASP 307
14−10.07ARG 315, ASP 352, GLN 279, GLY 309, ARG442VAL 319, PHE 321, ASP 325, VAL 308
15−8.42GLN 279, HIS 280PHE159, PHE 303, ARG 315, TYR 158
Acarbose−8.49GLN 279, ASP352, ARG 442, GLU 411, PRO 312, HIS 280, LYS 156-
Disclaimer/Publisher’s Note: The statements, opinions and data contained in all publications are solely those of the individual author(s) and contributor(s) and not of MDPI and/or the editor(s). MDPI and/or the editor(s) disclaim responsibility for any injury to people or property resulting from any ideas, methods, instructions or products referred to in the content.

