
Upregulated FKBP1A Suppresses Glioblastoma Cell Growth via Apoptosis Pathway


Abstract
1. Introduction
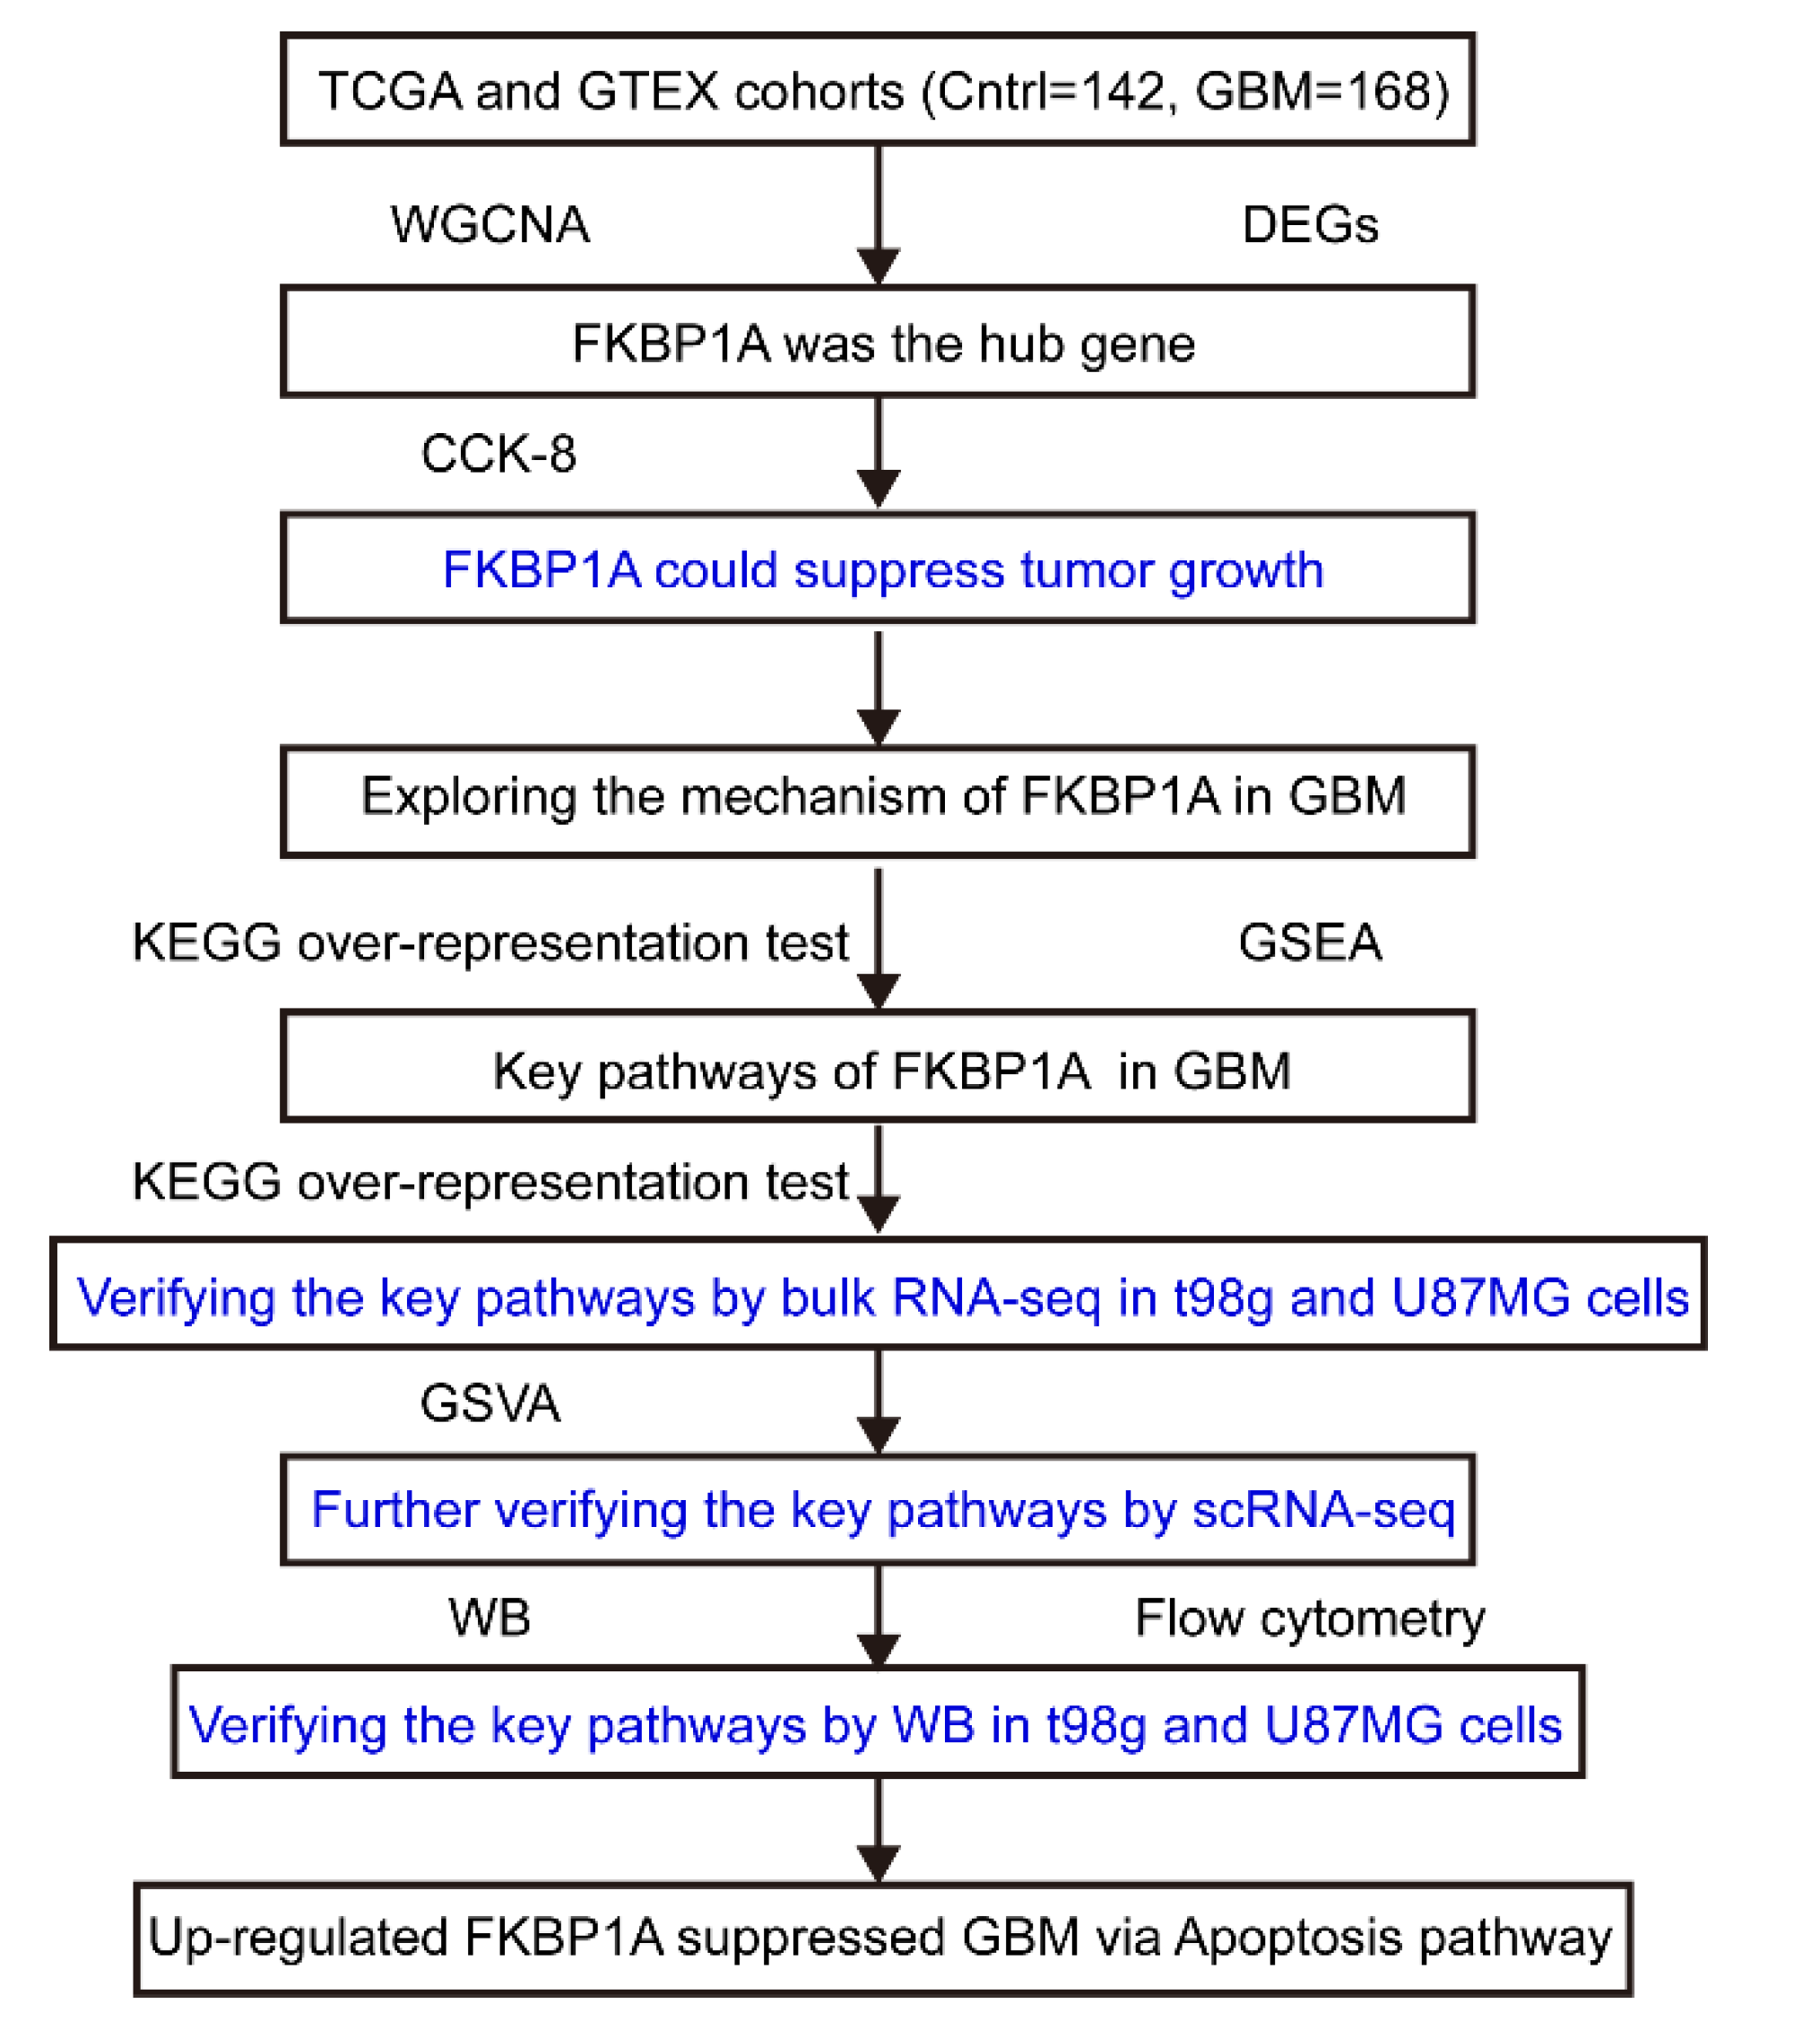
2. Results
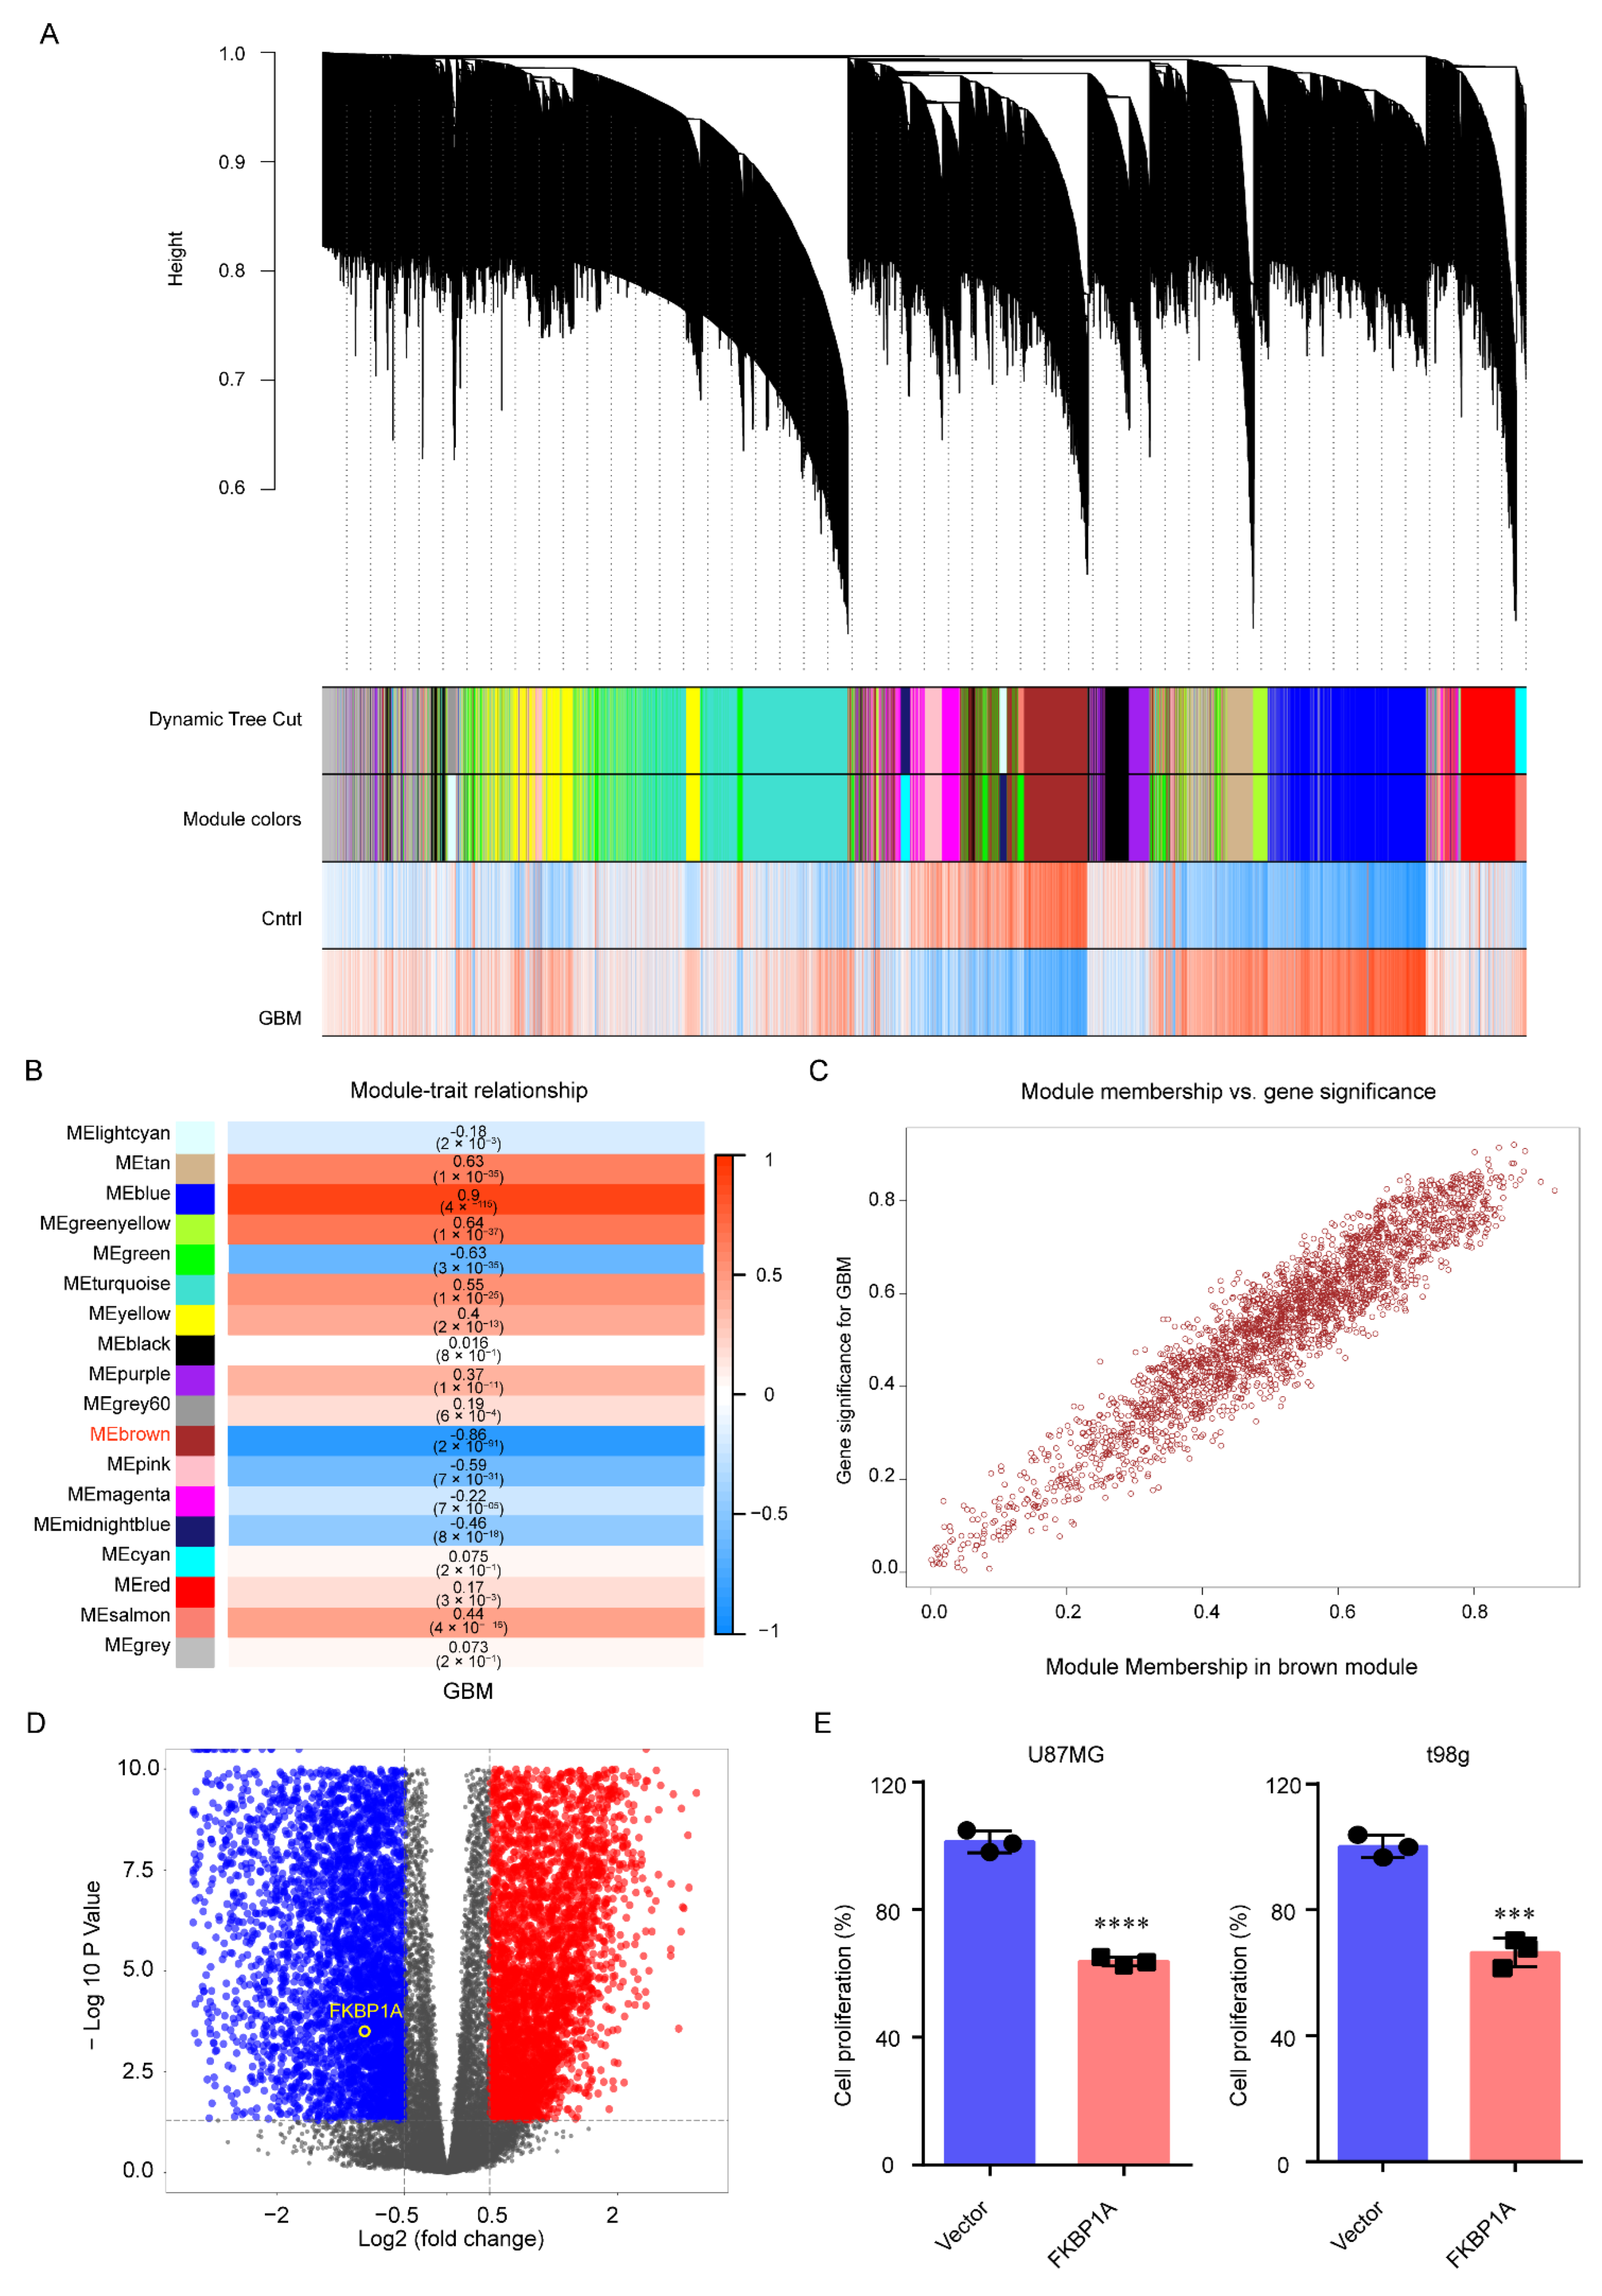
2.1. FKBP1A Was the Hub Gene in GBM Progression
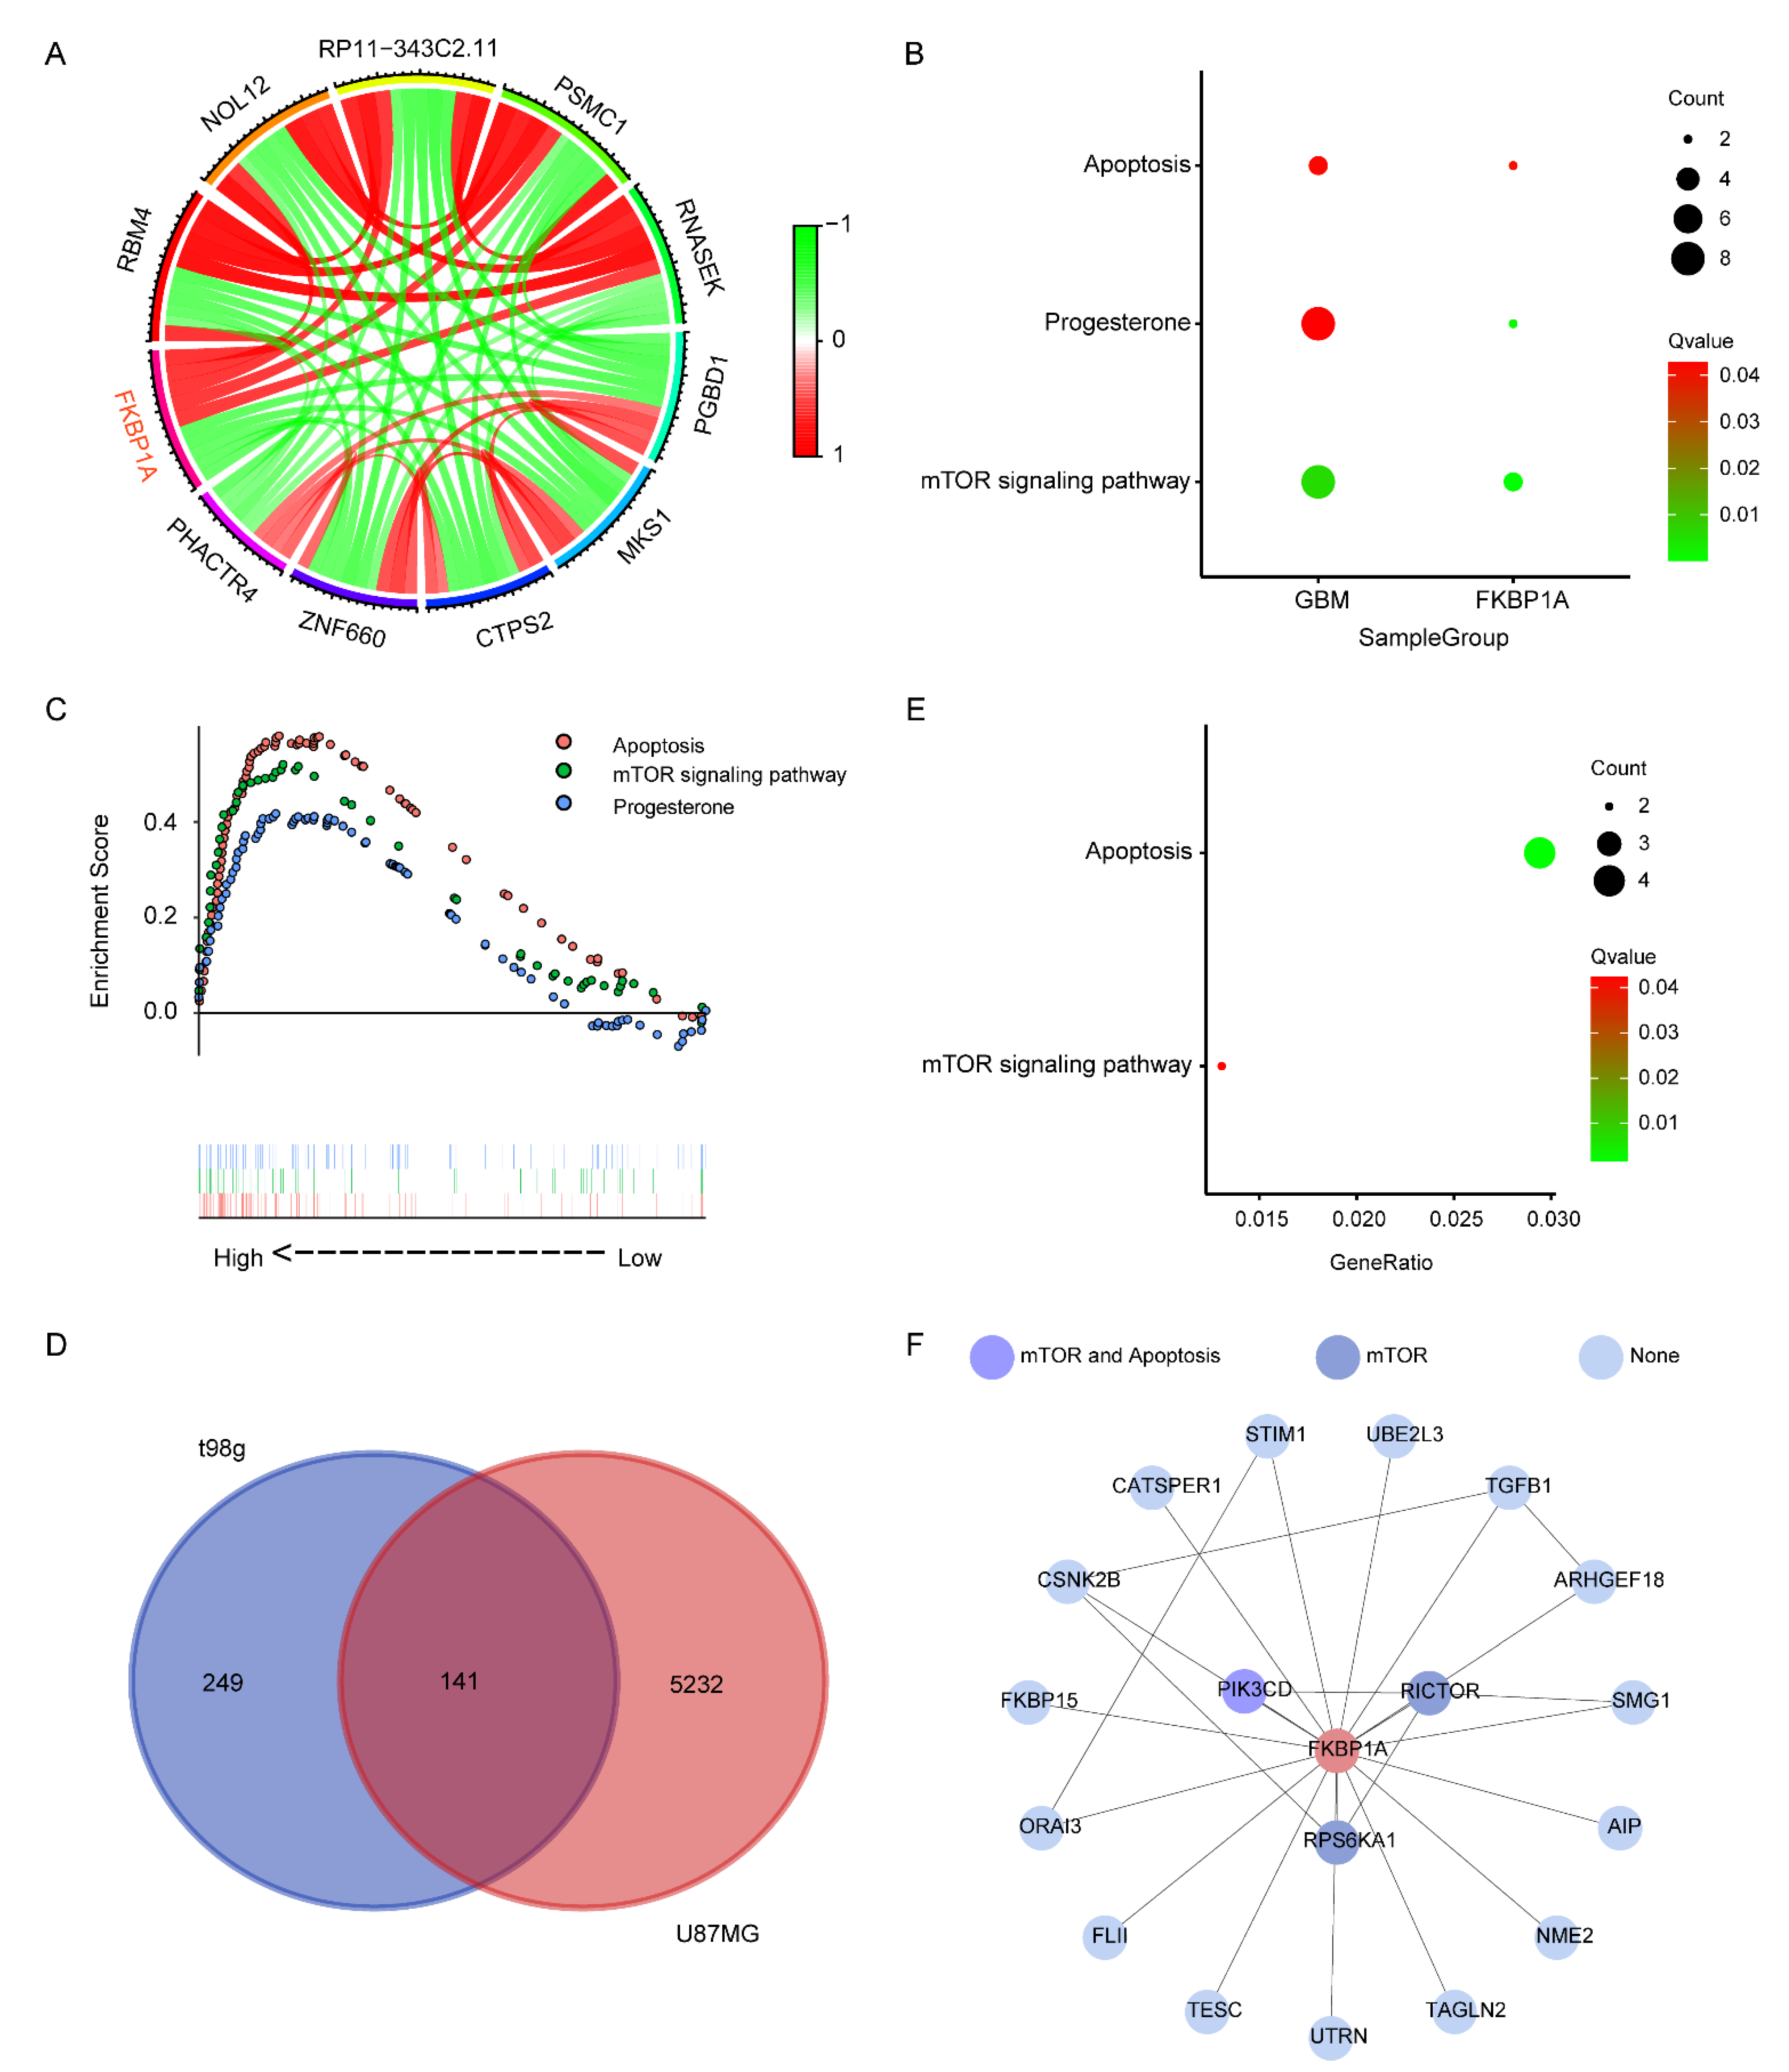
2.2. Exploring the Pathways of FKBP1A Involved in GBM
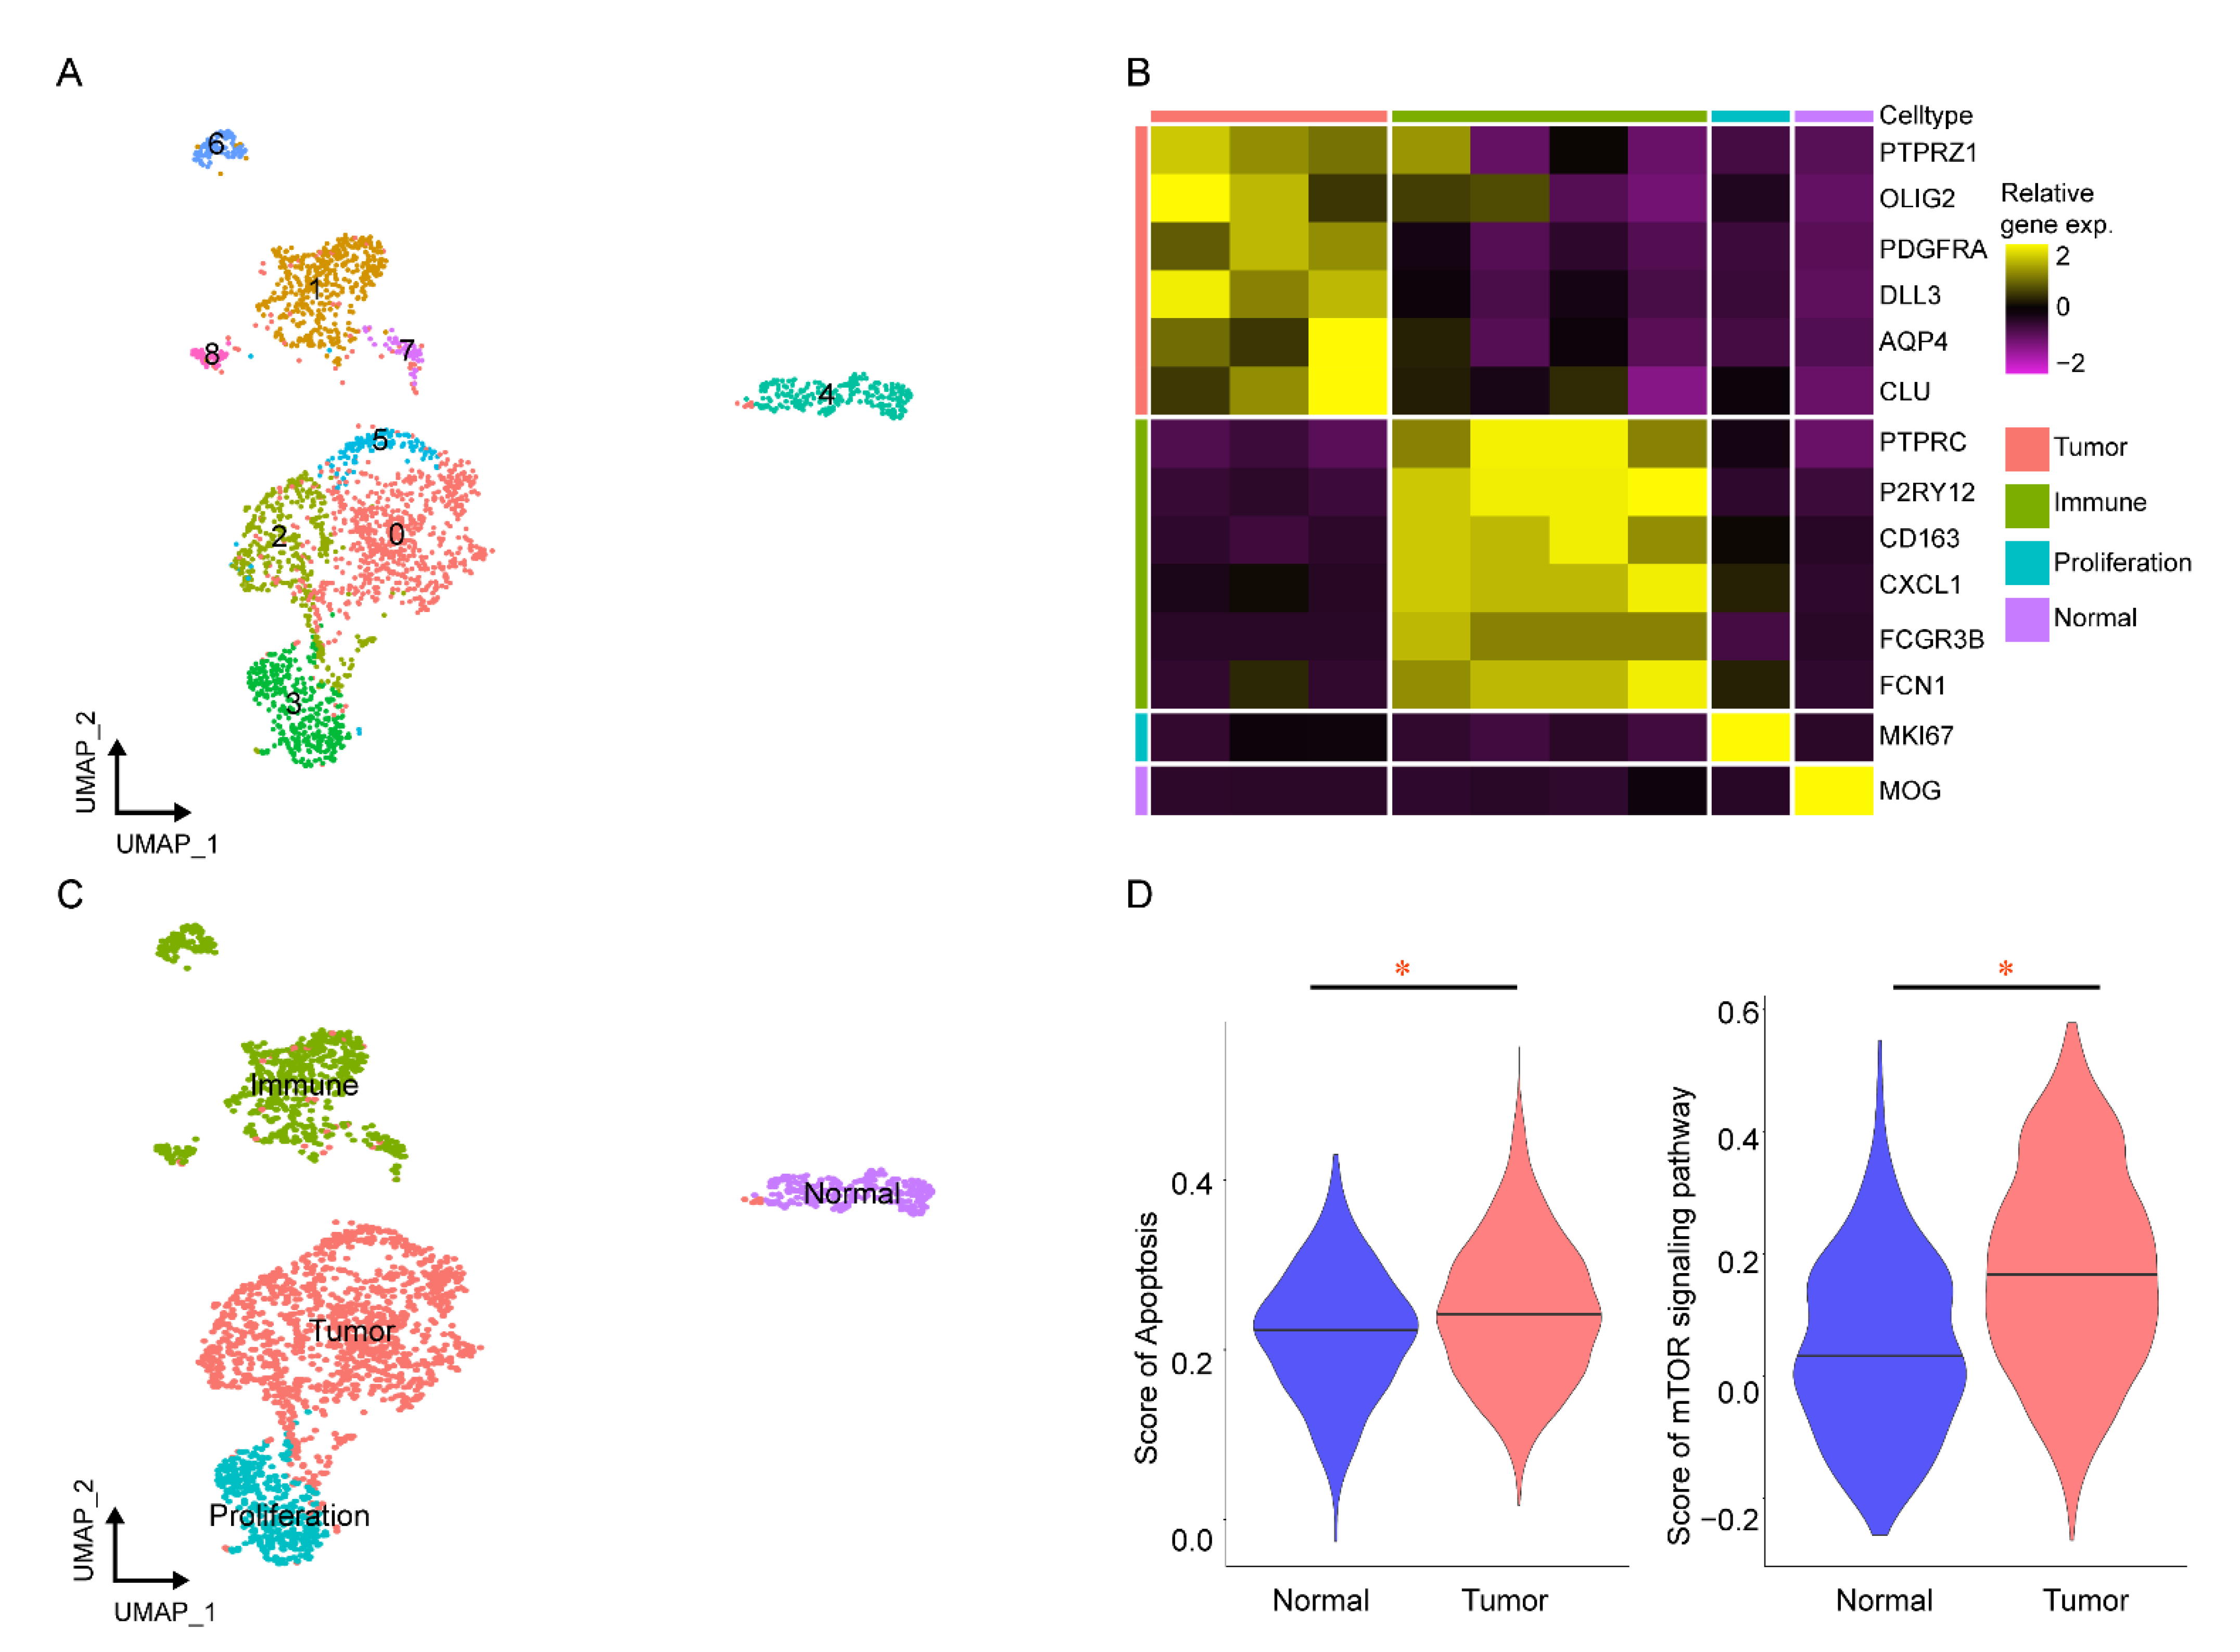
2.3. Verifying the Key Pathways in scRNA-seq of GBM
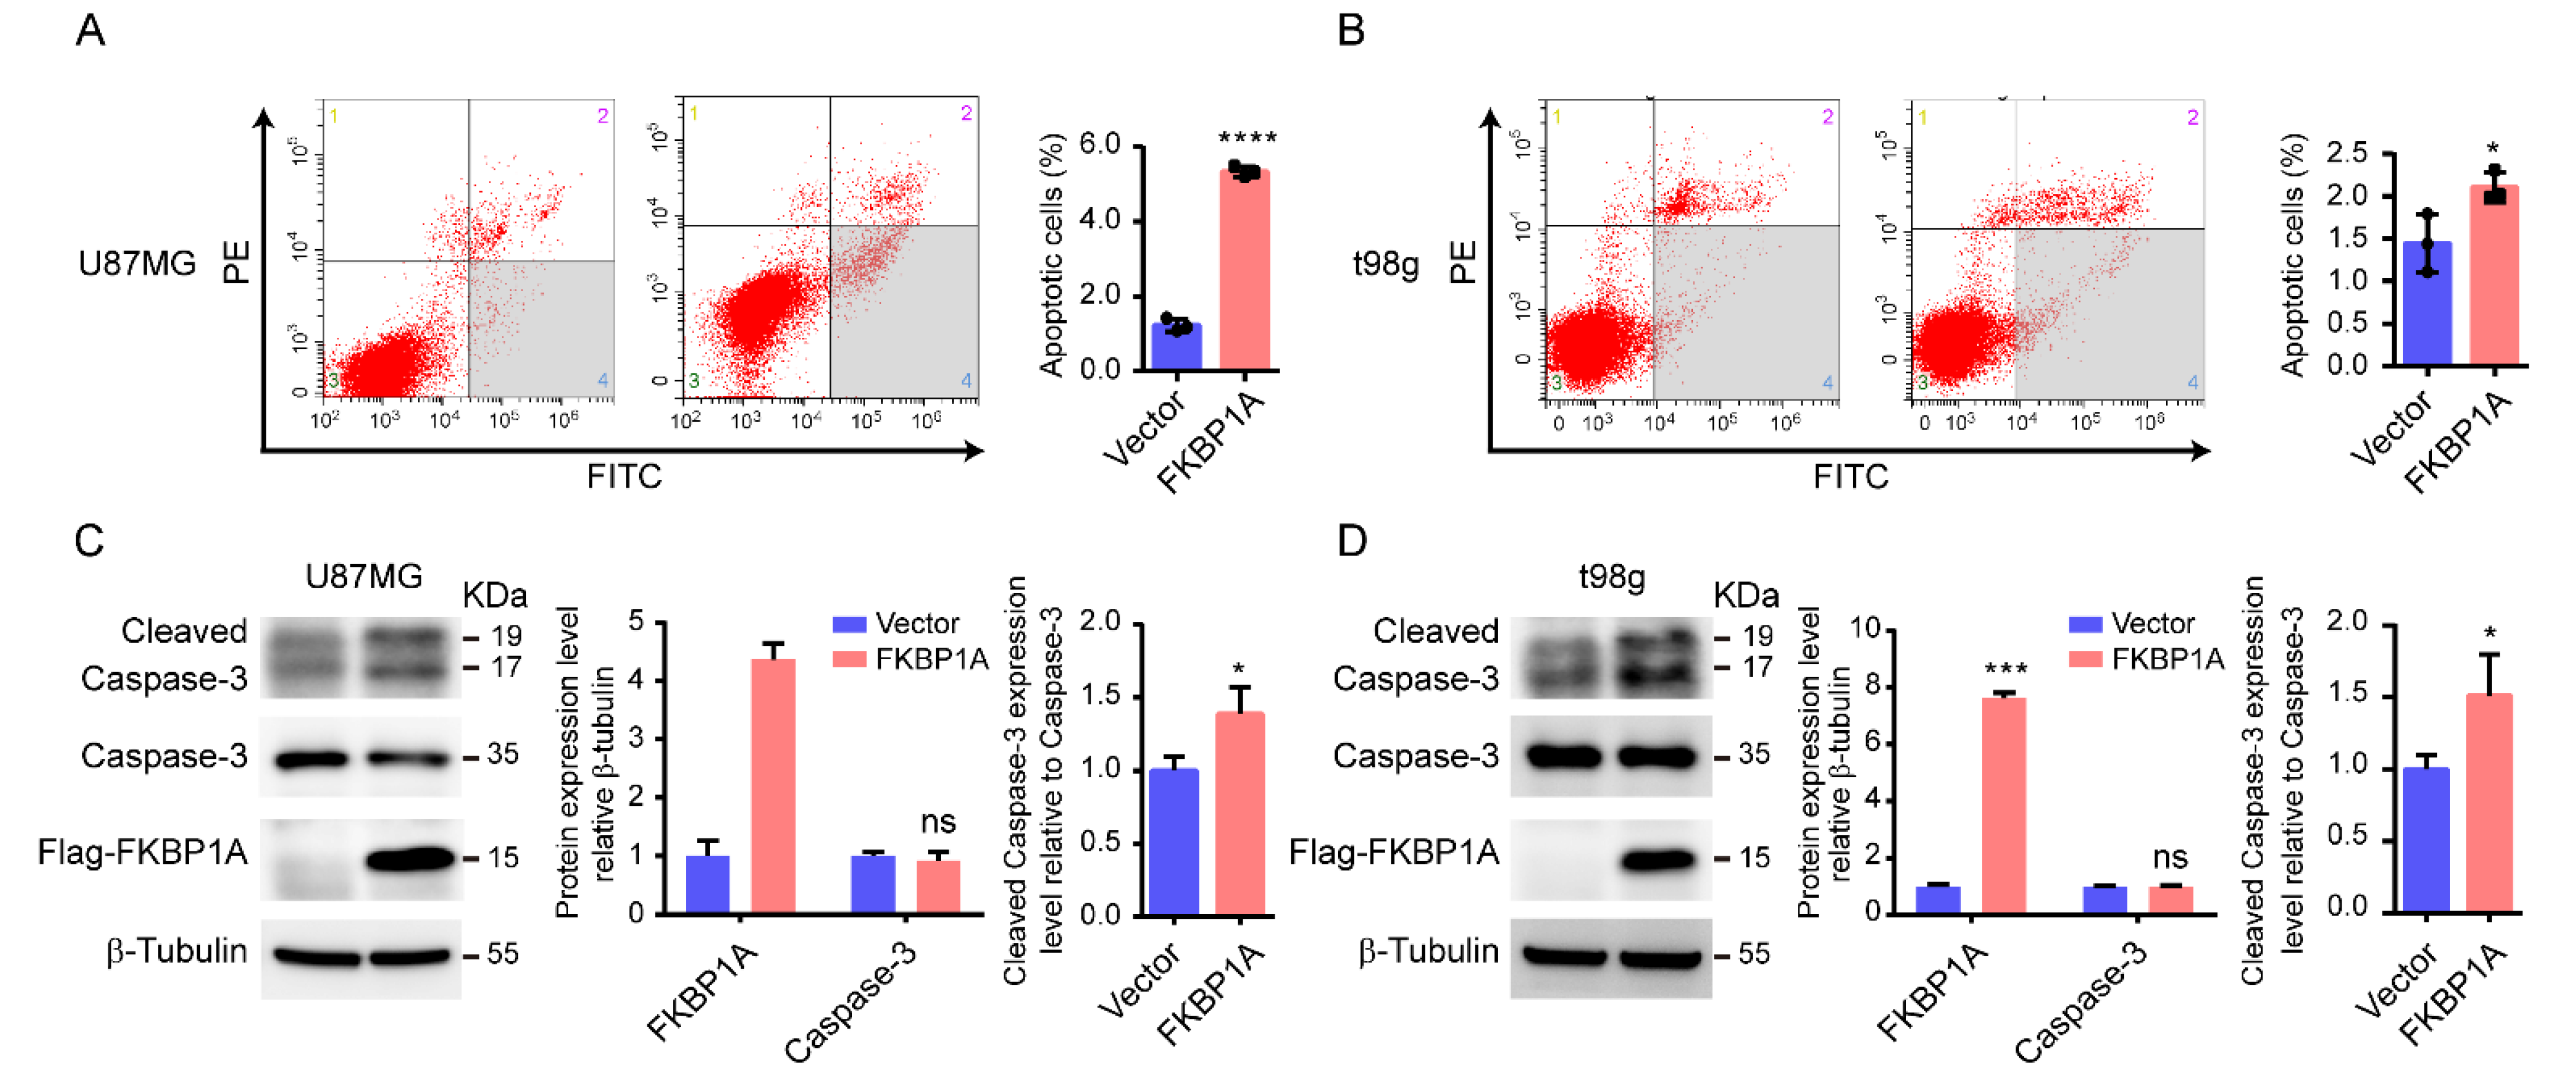
2.4. Experimentally Validating the Key Pathways
3. Discussion
4. Materials and Methods
4.1. Experiment Design
4.2. Identification of Gene Sets Related to GBM
4.3. Differential Expression Genes between GBM and Normal Groups
4.4. Identification of FKBP1A Signaling Pathways Involved in GBM
4.5. ScRNA-Seq Data Collection
4.6. Potential Connections between FKBP1A and Critical Pathways
4.7. Cell Culture and Plasmids Transfection
4.8. Cell Proliferation Assay
4.9. RNA Isolation, Sequencing, and Analysis
4.10. Cell Apoptosis Analysis
4.11. Western Blot
4.12. Statistical Analysis
5. Conclusions
Supplementary Materials
Author Contributions
Funding
Institutional Review Board Statement
Informed Consent Statement
Data Availability Statement
Conflicts of Interest
References
- McKinnon, C.; Nandhabalan, M.; Murray, S.A.; Plaha, P. Glioblastoma: Clinical presentation, diagnosis, and management. BMJ 2021, 374, n1560. [Google Scholar] [CrossRef] [PubMed]
- Tan, A.C.; Ashley, D.M.; Lopez, G.Y.; Malinzak, M.; Friedman, H.S.; Khasraw, M. Management of glioblastoma: State of the art and future directions. CA Cancer J. Clin. 2020, 70, 299–312. [Google Scholar] [CrossRef] [PubMed]
- Brodbelt, A.; Greenberg, D.; Winters, T.; Williams, M.; Vernon, S.; Collins, V.P.; National Cancer Information Network Brain Tumour Group. Glioblastoma in England: 2007-2011. Eur. J. Cancer 2015, 51, 533–542. [Google Scholar] [CrossRef]
- Stupp, R.; Mason, W.P.; van den Bent, M.J.; Weller, M.; Fisher, B.; Taphoorn, M.J.; Belanger, K.; Brandes, A.A.; Marosi, C.; Bogdahn, U.; et al. Radiotherapy plus concomitant and adjuvant temozolomide for glioblastoma. N. Engl. J. Med. 2005, 352, 987–996. [Google Scholar] [CrossRef] [PubMed]
- Tong, M.; Jiang, Y. FK506-Binding Proteins and Their Diverse Functions. Curr. Mol. Pharmacol. 2015, 9, 48–65. [Google Scholar] [CrossRef]
- Fong, S.; Mounkes, L.; Liu, Y.; Maibaum, M.; Alonzo, E.; Desprez, P.Y.; Thor, A.D.; Kashani-Sabet, M.; Debs, R.J. Functional identification of distinct sets of antitumor activities mediated by the FKBP gene family. Proc. Natl. Acad. Sci. USA 2003, 100, 14253–14258. [Google Scholar] [CrossRef]
- Liu, T.; Xiong, J.; Yi, S.; Zhang, H.; Zhou, S.; Gu, L.; Zhou, M. FKBP12 enhances sensitivity to chemotherapy-induced cancer cell apoptosis by inhibiting MDM2. Oncogene 2017, 36, 1678–1686. [Google Scholar] [CrossRef]
- Xing, M.; Wang, J.; Yang, Q.; Wang, Y.; Li, J.; Xiong, J.; Zhou, S. FKBP12 is a predictive biomarker for efficacy of anthracycline-based chemotherapy in breast cancer. Cancer Chemother. Pharmacol. 2019, 84, 861–872. [Google Scholar] [CrossRef]
- Fan, Q.; Aksoy, O.; Wong, R.A.; Ilkhanizadeh, S.; Novotny, C.J.; Gustafson, W.C.; Truong, A.Y.; Cayanan, G.; Simonds, E.F.; Haas-Kogan, D.; et al. A Kinase Inhibitor Targeted to mTORC1 Drives Regression in Glioblastoma. Cancer Cell 2017, 31, 424–435. [Google Scholar] [CrossRef]
- Stark, R.; Grzelak, M.; Hadfield, J. RNA sequencing: The teenage years. Nat. Rev. Genet. 2019, 20, 631–656. [Google Scholar] [CrossRef]
- Hwang, B.; Lee, J.H.; Bang, D. Single-cell RNA sequencing technologies and bioinformatics pipelines. Exp. Mol. Med. 2018, 50, 1–14. [Google Scholar] [CrossRef] [PubMed]
- Mathea, S.; Li, S.; Schierhorn, A.; Jahreis, G.; Schiene-Fischer, C. Suppression of EGFR autophosphorylation by FKBP12. Biochemistry 2011, 50, 10844–10850. [Google Scholar] [CrossRef] [PubMed]
- Lopez-Ilasaca, M.; Schiene, C.; Kullertz, G.; Tradler, T.; Fischer, G.; Wetzker, R. Effects of FK506-binding protein 12 and FK506 on autophosphorylation of epidermal growth factor receptor. J. Biol. Chem. 1998, 273, 9430–9434. [Google Scholar] [CrossRef]
- Wang, G.; Zhao, H.; Duan, X.; Ren, Z. CircRNA pappalysin 1 facilitates prostate cancer development through miR-515-5p/FKBP1A axis. Andrologia 2021, 53, e14227. [Google Scholar] [CrossRef] [PubMed]
- Leng, W.; Liu, Q.; Zhang, S.; Sun, D.; Guo, Y. LncRNA AFAP1-AS1 modulates the sensitivity of paclitaxel-resistant prostate cancer cells to paclitaxel via miR-195-5p/FKBP1A axis. Cancer Biol. Ther. 2020, 21, 1072–1080. [Google Scholar] [CrossRef] [PubMed]
- Zhang, Y.; Zhang, D.; Lv, J.; Wang, S.; Zhang, Q. LncRNA SNHG15 acts as an oncogene in prostate cancer by regulating miR-338-3p/FKBP1A axis. Gene 2019, 705, 44–50. [Google Scholar] [CrossRef] [PubMed]
- Langfelder, P.; Horvath, S. WGCNA: An R package for weighted correlation network analysis. BMC Bioinform. 2008, 9, 559. [Google Scholar] [CrossRef] [PubMed]
- Xie, Z.; Li, X.; He, Y.; Wu, S.; Wang, S.; Sun, J.; He, Y.; Lun, Y.; Zhang, J. Immune Cell Confrontation in the Papillary Thyroid Carcinoma Microenvironment. Front. Endocrinol. 2020, 11, 570604. [Google Scholar] [CrossRef]
- Ritchie, M.E.; Phipson, B.; Wu, D.; Hu, Y.; Law, C.W.; Shi, W.; Smyth, G.K. limma powers differential expression analyses for RNA-sequencing and microarray studies. Nucleic Acids Res. 2015, 43, e47. [Google Scholar] [CrossRef]
- Kanehisa, M.; Goto, S. KEGG: Kyoto encyclopedia of genes and genomes. Nucleic Acids Res. 2000, 28, 27–30. [Google Scholar] [CrossRef]
- Subramanian, A.; Tamayo, P.; Mootha, V.K.; Mukherjee, S.; Ebert, B.L.; Gillette, M.A.; Paulovich, A.; Pomeroy, S.L.; Golub, T.R.; Lander, E.S.; et al. Gene set enrichment analysis: A knowledge-based approach for interpreting genome-wide expression profiles. Proc. Natl. Acad. Sci. USA 2005, 102, 15545–15550. [Google Scholar] [CrossRef] [PubMed]
- Yu, K.; Hu, Y.; Wu, F.; Guo, Q.; Qian, Z.; Hu, W.; Chen, J.; Wang, K.; Fan, X.; Wu, X.; et al. Surveying brain tumor heterogeneity by single-cell RNA-sequencing of multi-sector biopsies. Natl. Sci. Rev. 2020, 7, 1306–1318. [Google Scholar] [CrossRef] [PubMed]
- Hao, Y.; Hao, S.; Andersen-Nissen, E.; Mauck, W.M., 3rd; Zheng, S.; Butler, A.; Lee, M.J.; Wilk, A.J.; Darby, C.; Zager, M.; et al. Integrated analysis of multimodal single-cell data. Cell 2021, 184, 3573–3587.e29. [Google Scholar] [CrossRef]
- Hanzelmann, S.; Castelo, R.; Guinney, J. GSVA: Gene set variation analysis for microarray and RNA-seq data. BMC Bioinform. 2013, 14, 7. [Google Scholar] [CrossRef] [PubMed]
- von Mering, C.; Jensen, L.J.; Snel, B.; Hooper, S.D.; Krupp, M.; Foglierini, M.; Jouffre, N.; Huynen, M.A.; Bork, P. STRING: Known and predicted protein-protein associations, integrated and transferred across organisms. Nucleic Acids Res. 2005, 33, D433-7. [Google Scholar] [CrossRef] [PubMed]
- Rostovskaya, M.; Andrews, S.; Reik, W.; Rugg-Gunn, P.J. Amniogenesis occurs in two independent waves in primates. Cell Stem Cell 2022, 29, 744–759.e6. [Google Scholar] [CrossRef] [PubMed]
- Zhang, Y.; Park, C.; Bennett, C.; Thornton, M.; Kim, D. Rapid and accurate alignment of nucleotide conversion sequencing reads with HISAT-3N. Genome Res. 2021, 31, 1290–1295. [Google Scholar] [CrossRef]
- Xiang, Y.; Wang, Q.; Guo, Y.; Ge, H.; Fu, Y.; Wang, X.; Tao, L. Cx32 exerts anti-apoptotic and pro-tumor effects via the epidermal growth factor receptor pathway in hepatocellular carcinoma. J. Exp. Clin. Cancer Res. 2019, 38, 145. [Google Scholar] [CrossRef]


Publisher’s Note: MDPI stays neutral with regard to jurisdictional claims in published maps and institutional affiliations. |
© 2022 by the authors. Licensee MDPI, Basel, Switzerland. This article is an open access article distributed under the terms and conditions of the Creative Commons Attribution (CC BY) license (https://creativecommons.org/licenses/by/4.0/).
Share and Cite
Cai, S.; Chen, Z.; Tang, H.; Meng, S.; Tao, L.; Wang, Q. Upregulated FKBP1A Suppresses Glioblastoma Cell Growth via Apoptosis Pathway. Int. J. Mol. Sci. 2022, 23, 14935. https://doi.org/10.3390/ijms232314935
Cai S, Chen Z, Tang H, Meng S, Tao L, Wang Q. Upregulated FKBP1A Suppresses Glioblastoma Cell Growth via Apoptosis Pathway. International Journal of Molecular Sciences. 2022; 23(23):14935. https://doi.org/10.3390/ijms232314935
Chicago/Turabian StyleCai, Shaoyi, Zhiyou Chen, Heng Tang, Siyan Meng, Liang Tao, and Qin Wang. 2022. "Upregulated FKBP1A Suppresses Glioblastoma Cell Growth via Apoptosis Pathway" International Journal of Molecular Sciences 23, no. 23: 14935. https://doi.org/10.3390/ijms232314935
APA StyleCai, S., Chen, Z., Tang, H., Meng, S., Tao, L., & Wang, Q. (2022). Upregulated FKBP1A Suppresses Glioblastoma Cell Growth via Apoptosis Pathway. International Journal of Molecular Sciences, 23(23), 14935. https://doi.org/10.3390/ijms232314935