Article

Identification and Characterization of Transcription Factors Involved in Geraniol Biosynthesis in Rosa chinensis

Beijing Key Laboratory of Ornamental Plants Germplasm Innovation & Molecular Breeding, National Engineering Research Center for Floriculture, Beijing Laboratory of Urban and Rural Ecological Environment, Key Laboratory of Genetics and Breeding in Forest Trees and Ornamental Plants of Ministry of Education, School of Landscape Architecture, Beijing Forestry University, Beijing 100083, China
*
Author to whom correspondence should be addressed.
These authors contributed equally to this work.
Int. J. Mol. Sci. 2022, 23(23), 14684; https://doi.org/10.3390/ijms232314684
Submission received: 16 October 2022 / Revised: 18 November 2022 / Accepted: 22 November 2022 / Published: 24 November 2022
(This article belongs to the Special Issue Transcriptional Regulatory Networks in Flowers)

Abstract

:
Fragrance is an important characteristic of rose flowers and is largely determined by the terpenes. Rose has a unique NUDX1 (NUDIX HYDROLASES 1)–dependent monoterpene geraniol biosynthesis pathway, but little is known about its transcriptional regulation. In this study, we characterized two China rose (Rosa chinensis) materials from the ‘Old Blush’ variety with contrasting aromas. We profiled the volatile metabolome of both materials, and the results revealed that geraniol was the main component that distinguishes the aroma of these two materials. We performed a comparative transcriptome analysis of the two rose materials, from which we identified the hydrolase RcNUDX1 as a key factor affecting geraniol content, as well as 17 transcription factor genes co-expressed with RcNUDX1. We also determined that the transcription factor RcWRKY70 binds to four W–box motifs in the promoter of RcNUDX1, repressing RcNUDX1 expression, based on yeast one-hybrid and transient dual-luciferase assays. These results provide important information concerning the transcriptional regulatory framework underlying the control of geraniol production in rose.

1. Introduction

Terpenes are an important category of volatiles that contribute to floral fragrances [1]. Terpenoids are composed of basic five-carbon (C5) units and can be classified as monoterpenoids (C10), sesquiterpenes (C15), and diterpenes (C20) based on the number of isoprenoids [2,3]. In plants, terpenes are synthesized mainly through two metabolic pathways: the methylerythritol phosphate (MEP) pathway and the mevalonate (MVA) pathway. Both pathways use isopentenyl diphosphate (IPP) and dimethylallyl diphosphate (DMAPP) as precursors [4,5]. The MEP pathway takes place in plastids (but also involves the cytosol, endoplasmic reticulum, and peroxisome) and synthesizes IPP and DMAPP from the substrate glyceraldehyde-3-phosphate and pyruvate. Under the action of transferase, IPP and DMAPP with different molecular weights are condensed to provide substrates for the biosynthesis of monoterpenes and diterpenes. The MVA pathway in the cytoplasm uses acetyl-CoA as a substrate, followed by the condensation of two molecules of IPP and one molecule of DMAPP to form one farnesyl diphosphate (FPP) molecule, itself used as a substrate to form sesquiterpenoids [6,7,8]. Terpene synthases (TPSs) are the key enzymes that catalyze the biosynthesis of terpenes. Many terpene synthase genes have been cloned and studied since the first linalool synthase gene was identified in fairy fans (Clarkia breweri) [9]. The research on terpene biosynthesis remains a hot topic.
Rose (Rosa hybrida) is the top ranking cut flower in the flower trade on the basis of acreage, production, and consumption. Gardens exclusively for roses have been made in various parts of the world. Rose is also emerging as a model to clarify the molecular mechanism of floral fragrance in woody plants because of its pleasant flower scent [10,11]. In rose, monoterpene alcohols and other volatile terpene substances are some of the main contributors of rose scent [12,13]. Most terpene compounds (especially monoterpenes) are highly volatile and widely used in essential oil production [14]. A unique terpene biosynthesis pathway was described in rose: The nudix hydrolase RhNUDX1 shows geranyl diphosphate phosphohydrolase activity in vitro and is involved in geraniol biosynthesis [2]. Geraniol, a kind of acyclic isoprenoid monoterpenoid, and its isomer nerol are the main components of rose essential oils and have antimicrobial properties [15]. This special geraniol biosynthesis pathway suggests that a new transcription regulatory mechanism may exist in rose.
Terpene biosynthesis is not only related to key synthases but is also regulated by the activity of transcription factors (TFs) on their downstream target genes. Many TFs involved in the transcriptional regulation of genes involved in the floral aroma have been identified and belong to the bHLH (helix-loop-helix), bZIP (basic leucine zipper), AP2/ERF (APETALA2/ETHYLENE-RESPONSIVE ELEMENT BINDING FACTOR), NAC (NAM, ATAF and CUC), MYB, and WRKY families [16]. Most TFs reported to date that regulate terpenoid metabolism belong to the AP2/ERF, WRKY, and bHLH families. In Arabidopsis (Arabidopsis thaliana), the bHLH member MYC2 positively regulates the expression of TPS11 and TPS21 by binding to the E–box sequence in their promoter regions [17]. In sweet wormwood (Artemisia annua), AaERF1 and AaERF2 are two positive regulators of artemisinin biosynthesis [18]. ZmEREB58 isolated from maize (Zea mays) can bind to the promoter of ZmTPS10 and affect the accumulation of farnesene [19]. LcERF19 from aromatic litsea (Litsea cubeba) and CitERF71 from citrus (Citrus sinensis) positively regulate geraniol biosynthesis [20,21]. However, the transcription factors that regulate geraniol biosynthesis in rose have not been reported.
Flower aroma is an important ornamental trait of rose that greatly improves its garden value and is a major focus in rose breeding. With the continuous development of omics technologies, we can now dissect how the floral aroma phenotype is manifested. The Rosa chinensis ‘Old Blush’ variety has made important contributions to modern rose cultivars, and a high-quality genome assembly was made available [22]. In this study, we employed two ‘Old Blush’ materials (typical ‘Old Blush’, OB, with strong aroma; ‘Old Blush’–like, OBL, with weak aroma) with significant differences in aroma. We characterized the differentially expressed genes and differentially abundant volatiles between these materials, which revealed geraniol as the main difference volatile in OB and OBL. We also constructed a yeast cDNA library for R. chinensis to identify candidate transcription factors that regulate geraniol biosynthesis. The results generated in this study will help further explore the biosynthetic pathway for geraniol in rose.

2. Results

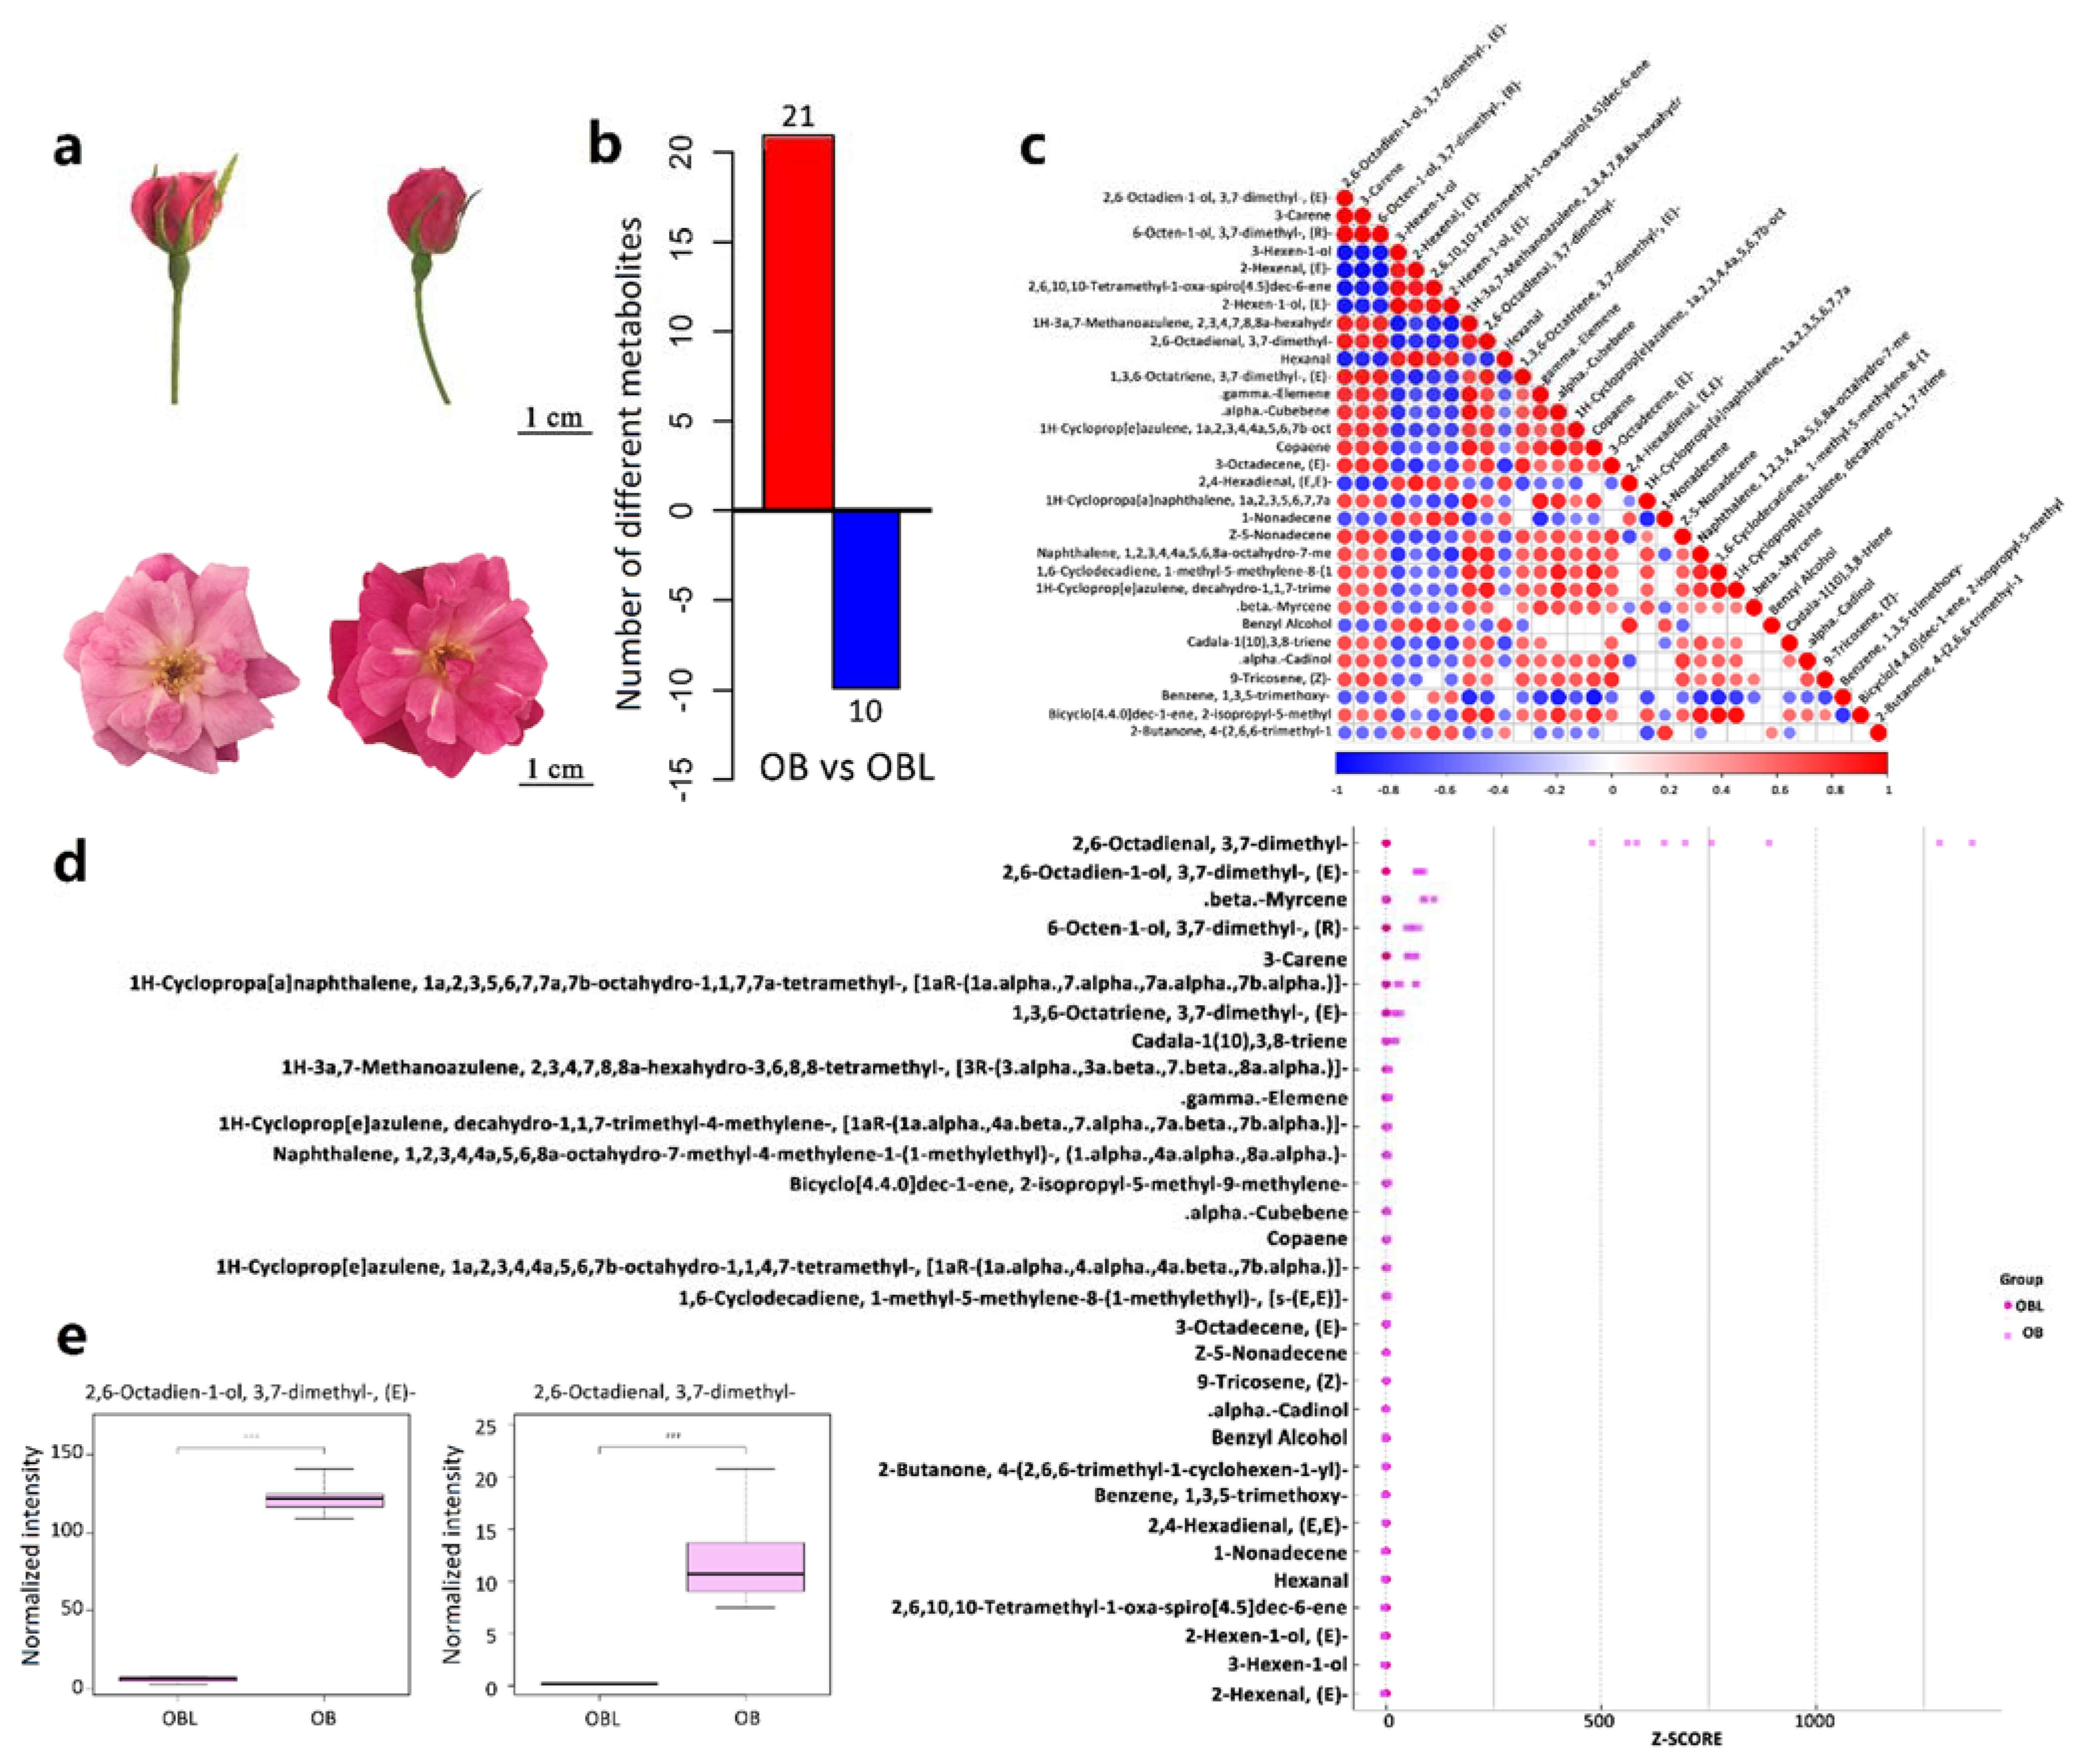
2.1. Geraniol Is the Most Significant Differentially Abundant Volatile in Petals between OB and OBL

Flowers from the two materials OB and OBL have a different smell; the only difference in appearance was that OBL flowers are a darker shade of pink than OB flowers (Figure 1a). We conducted a gas chromatography–mass spectrometry (GC–MS) analysis to investigate changes in floral-scented compounds between OB and OBL. Indeed, we observed significant differences in the volatile profiles of OB and OBL flowers (Figure S1, Table S1). We identified 67 volatiles in OB and OBL samples (Table S2). Using the criteria of p-value ≤ 0.05 and variable importance in projection (VIP) ≥ 1, we detected 31 differentially abundant volatiles between OB and OBL, of which 21 had relatively higher contents in OB petals (Figure 1 and Figure S2, Table S3). These 31 compounds comprised 17 terpenes, 6 volatiles derived from fatty acids, 1 carotene-derived volatile, 2 volatiles related to the shikimic acid pathway, and 5 other types of volatiles (Table S4).
Terpenes accounted for 54.8% of the 31 compounds that were more abundant in OB petals (Figure S3a). Terpenes also represented the highest proportion of detected compounds in OB petals (Figure S3b). By contrast, compounds derived from the shikimic acid pathway were more abundant in OBL petals (36.2%), followed by volatiles derived from fatty acids (33.3%), with terpenes only representing 28.5% of all volatiles detected in these samples (Figure S3c). Using a Z-score normalization to identify the most abundant compounds revealed geraniol (2,6-octadien-1-ol, 3,7-dimethyl-, (E)−) as the top enriched volatile in OB petals, while the second most abundant volatile was citral (2,6-octadienal, 3,7-dimethyl-) (Figure 1d,e). Based on the GC–MS analysis results above, we conclude that the OB and OBL materials and their petals, in particular, are suitable for studying the transcriptional regulation of geraniol biosynthesis.

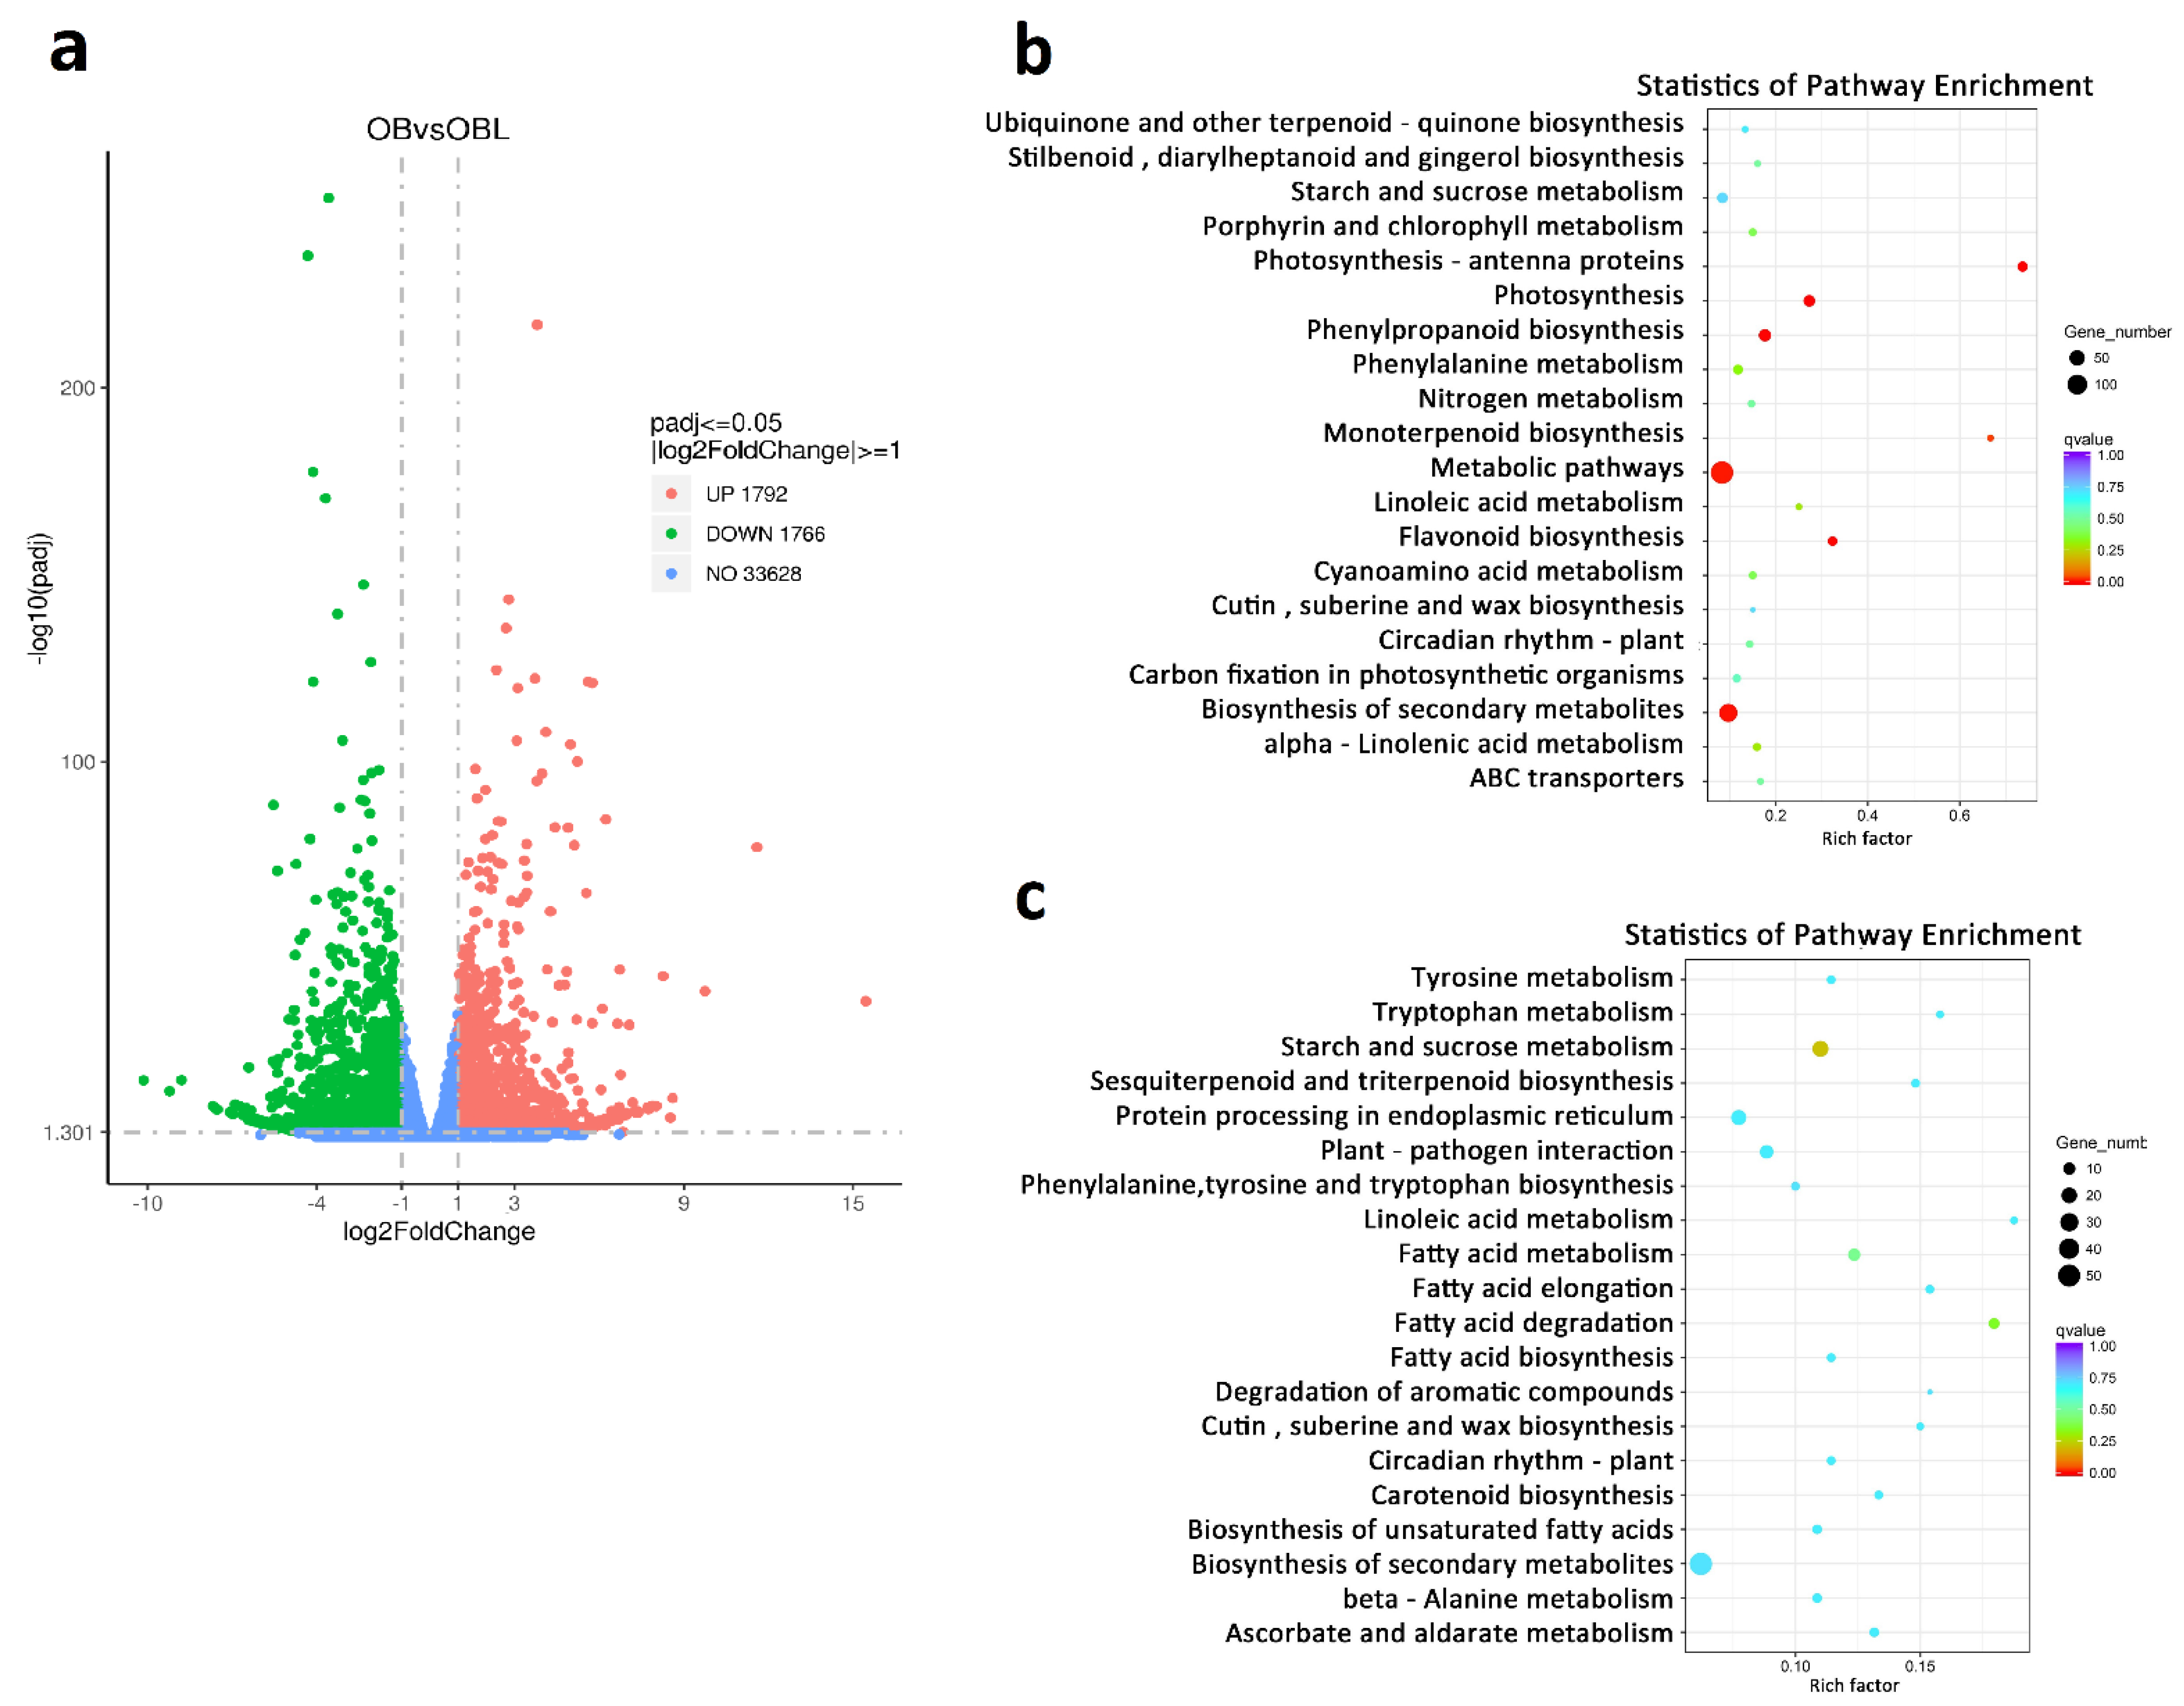
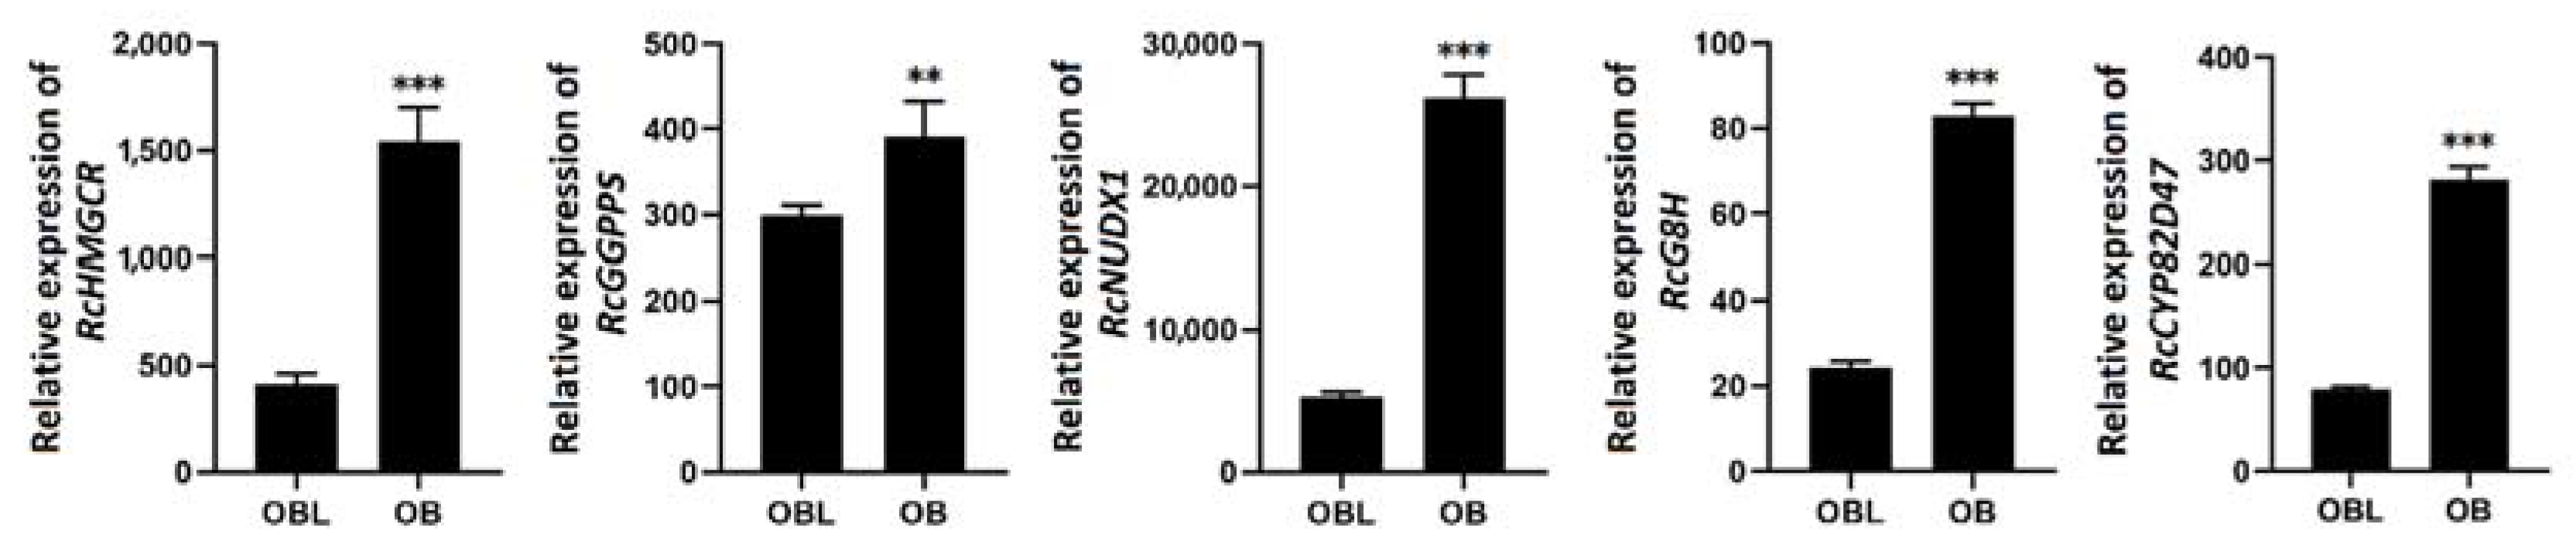
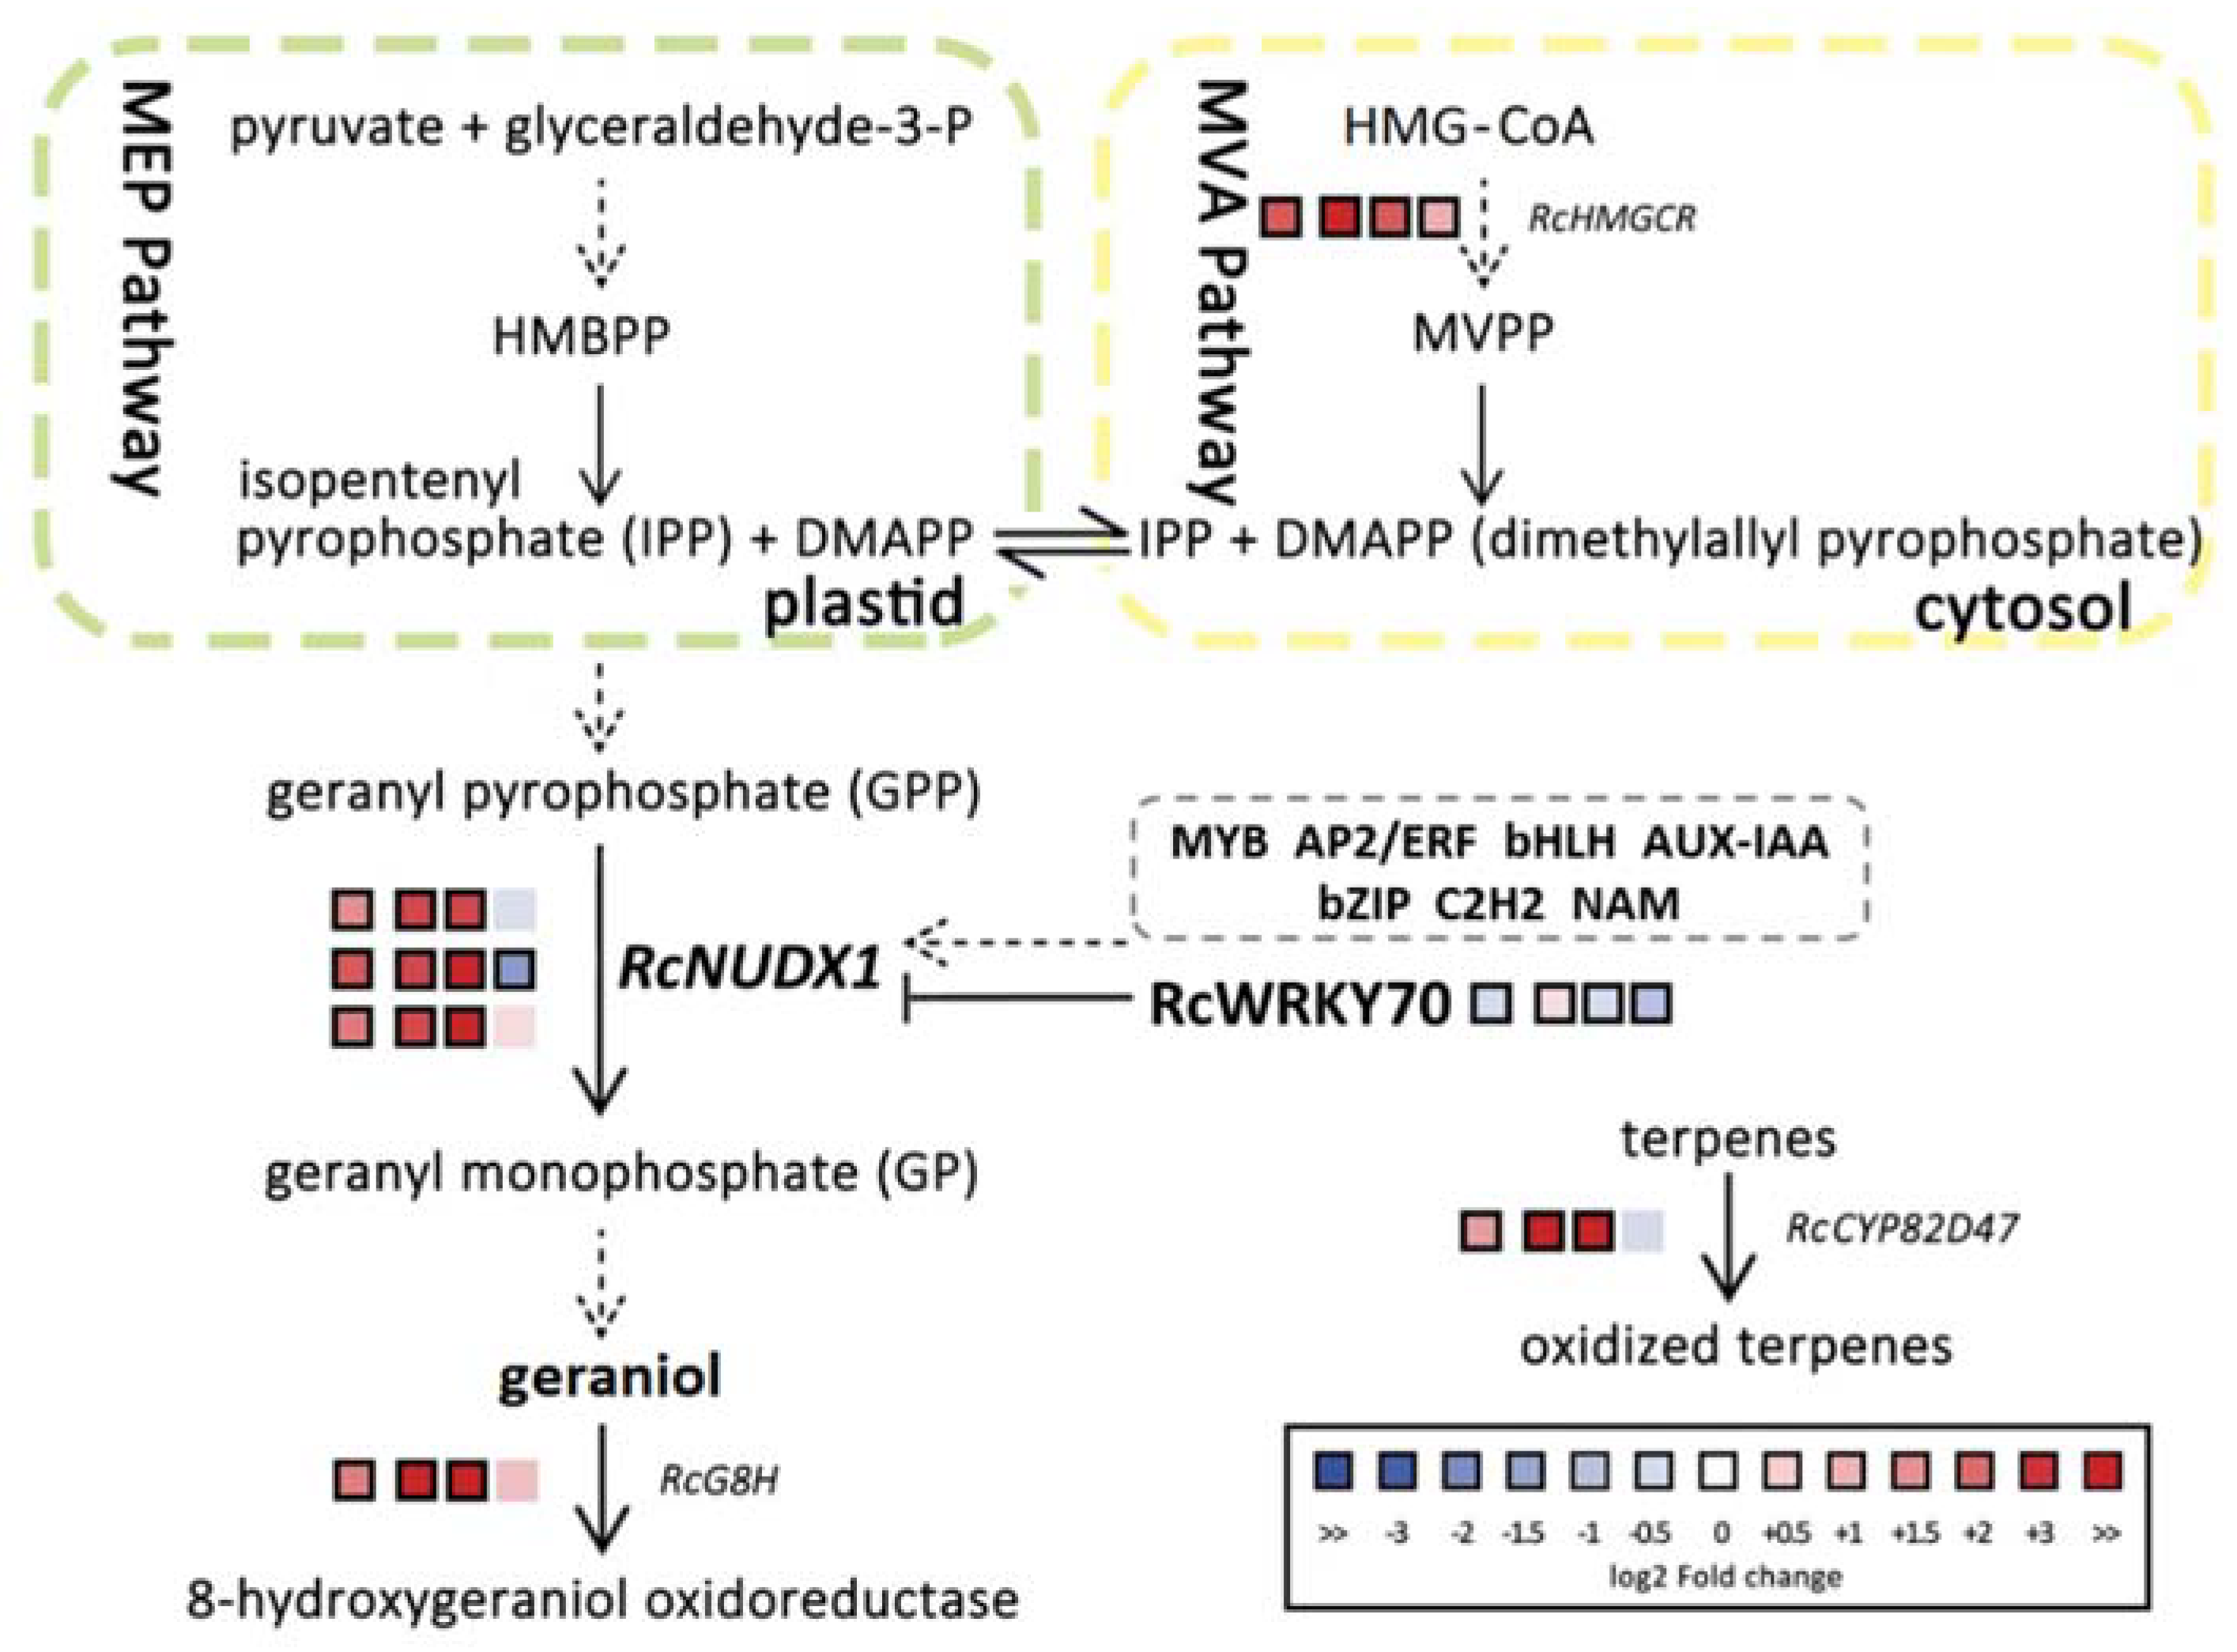
2.2. RcNUDX1 and Geraniol Biosynthesis

To explore genes related to geraniol biosynthesis, we performed a comparative RNA-seq analysis of petals from OB and OBL flowers using an Illumina HiSeq4000 platform (Tables S5 and S6). We identified differentially expressed genes (DEGs) with the DESeq2 software (v.3.11) in R using the criteria |Log2[OB/OBL Ratio]| ≥ 1 and p-value ≤ 0.05. We, thus, obtained 3558 DEGs, with 1766 downregulated genes and 1792 upregulated genes (in OB relative to OBL) (Figure 2a). Kyoto Encyclopedia of Genes and Genomes (KEGG) enrichment analysis indicated that the pathways “metabolic pathways”, “biosynthesis of secondary metabolites”, and “starch and sucrose metabolism” are the most significantly enriched among upregulated DEGs. The most enriched pathway among downregulated genes was “biosynthesis of secondary metabolites” (Figure 2b,c).
To better understand the terpene metabolism pathway of rose, we looked for genes based on functional annotation and sequence homology with related proteins from other plant species. From the first catalytic step executed by 1-deoxy-D-xylulose-5-phosphate synthase (DXS) to the terpene degradation candidate CYP82D47 (cytochrome P450 CYP82D47), we identified 30 members, which are listed in Table S7. Interestingly, only 5 out of these 30 genes were significantly upregulated in OB petals compared to OBL: RcHMGCR (encoding hydroxymethylglutaryl-CoA reductase), RcGGPPS (encoding geranylgeranyl diphosphate synthase), RcNUDX1 (encoding a geranyl diphosphate phosphohydrolase), RcG8H (encoding geraniol 8-hydroxylase), and RcCYP82D47. We hypothesized that RcNUDX1 exerts the same function as RhNUDX1 (GenBank accession number JQ820249), which leads to geraniol production [23]. RcNUDX1 was present as four tandem copies on chromosome 2 of R. chinensis (RchiOBHmChr2g0142071, RchiOBHmChr2g0142081, RchiOBHmChr2g0142111, and RchiOBHmChr2g0142121). The protein encoded by RchiOBHmChr2g0142121 differed by two amino acids compared to the other three NUDX1 copies. We measured the gene expression levels of all five genes in OB and OBL petals by RT–qPCR: RcNUDX1 was the mostly highly expressed (Figure 3).

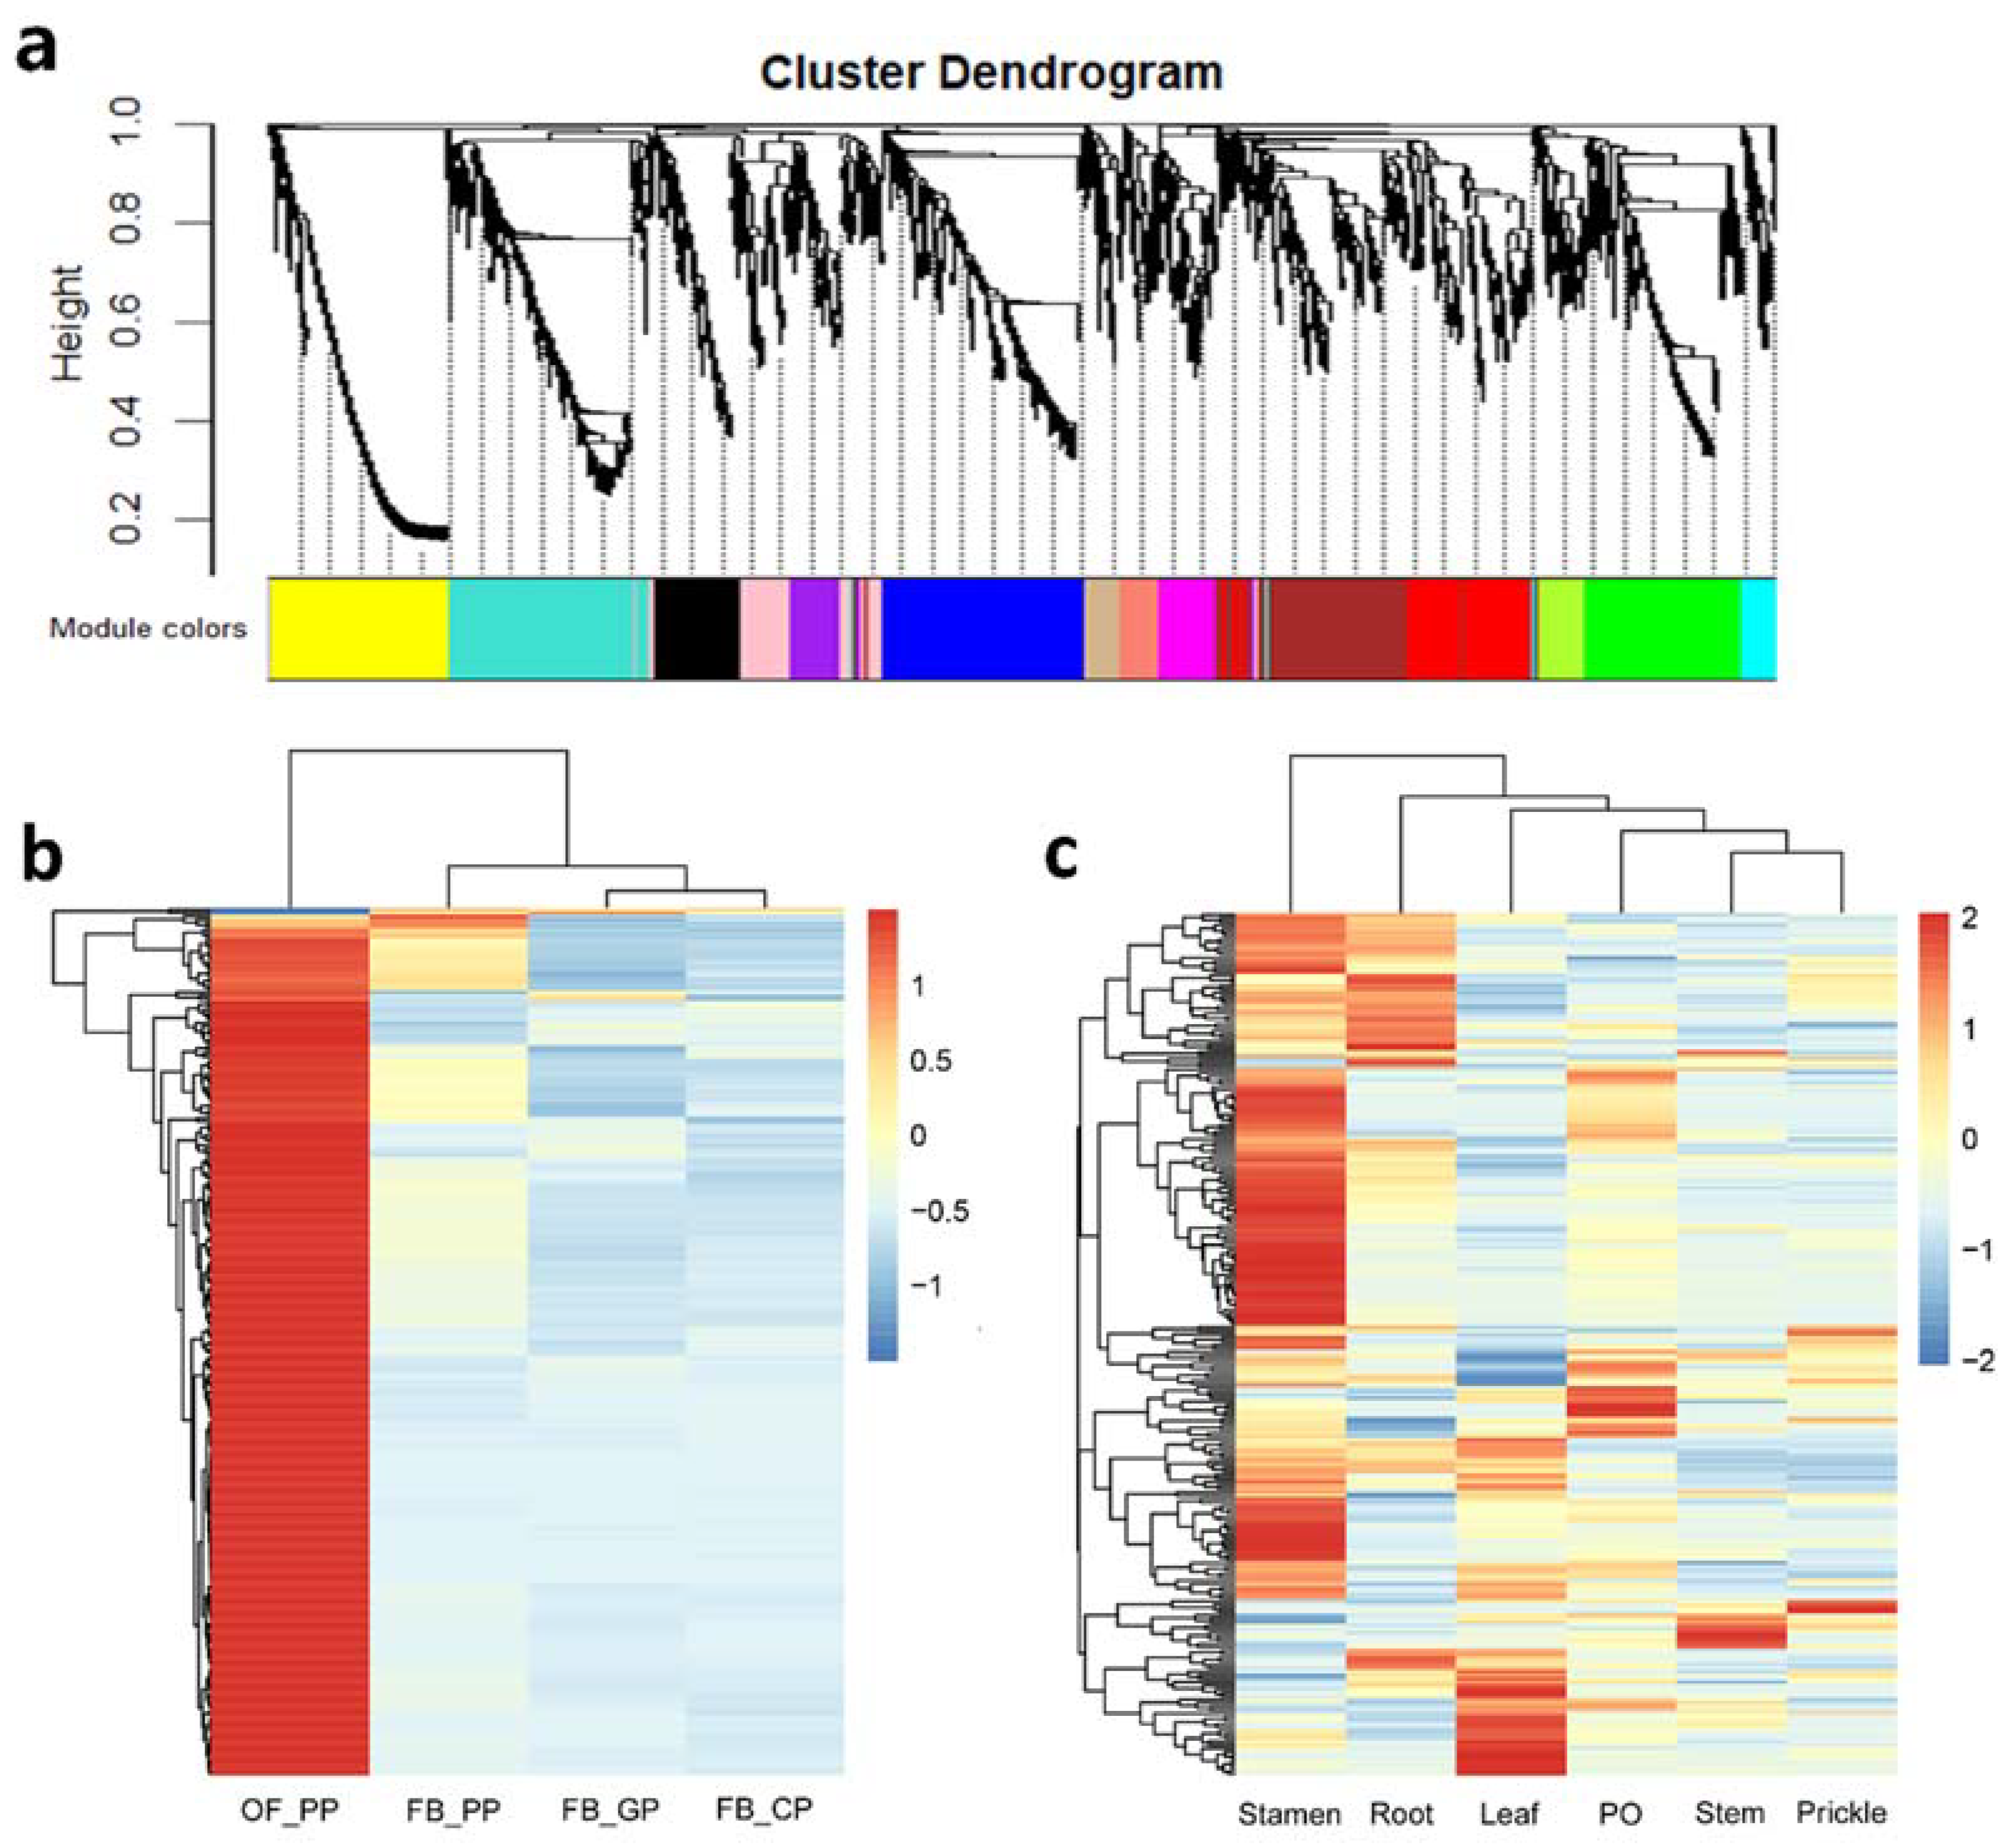
2.3. Prediction of RcNUDX1 Co-Expressed Genes Based on Weighted Gene Co-Expression Network Analysis

To identify genes potentially associated with geraniol biosynthesis, we employed weighted gene co-expression network analysis (WGCNA) using RNA-seq data obtained from the petals of OB and OBL, petals from four different stages of OB, and different tissues of OB. To reduce noise, we only included upregulated genes in OB petals relative to OBL petals, resulting in a set of 3574 genes subjected to WGCNA (Table S8). We detected no outliers in the dataset, based on an analysis of sample clustering (Figure S4a). We set the soft-thresholding power for the analysis of the network topology to 12 (Figure S4b,c). We identified 14 distinct co-expression modules, each labeled with a different color (Figure 4a and Figure S4d,e). The network heatmap plot reveals how the expression of each gene correlates with every other gene (Figure S5).
There were three of the RcNUDX1 genes in the green-module, which caught our attention. To better represent the expression characteristics of genes within the green-module, we generated a heatmap to represent the expression levels of green-module genes at four stages of petal development and different tissues in OB (Figure 4b,c, Tables S9 and S10). The green-module genes were highly expressed in OF_PP (pink petals when the flowers have just fully opened). In addition to petals, most green-module genes were highly expressed in stamens, which together with petals are used as the main fragrance releasing tissue. Among the 258 genes of the green-module, 17 were annotated as encoding TFs from the MYB, bHLH, bZIP, C2H2, and ERF families.

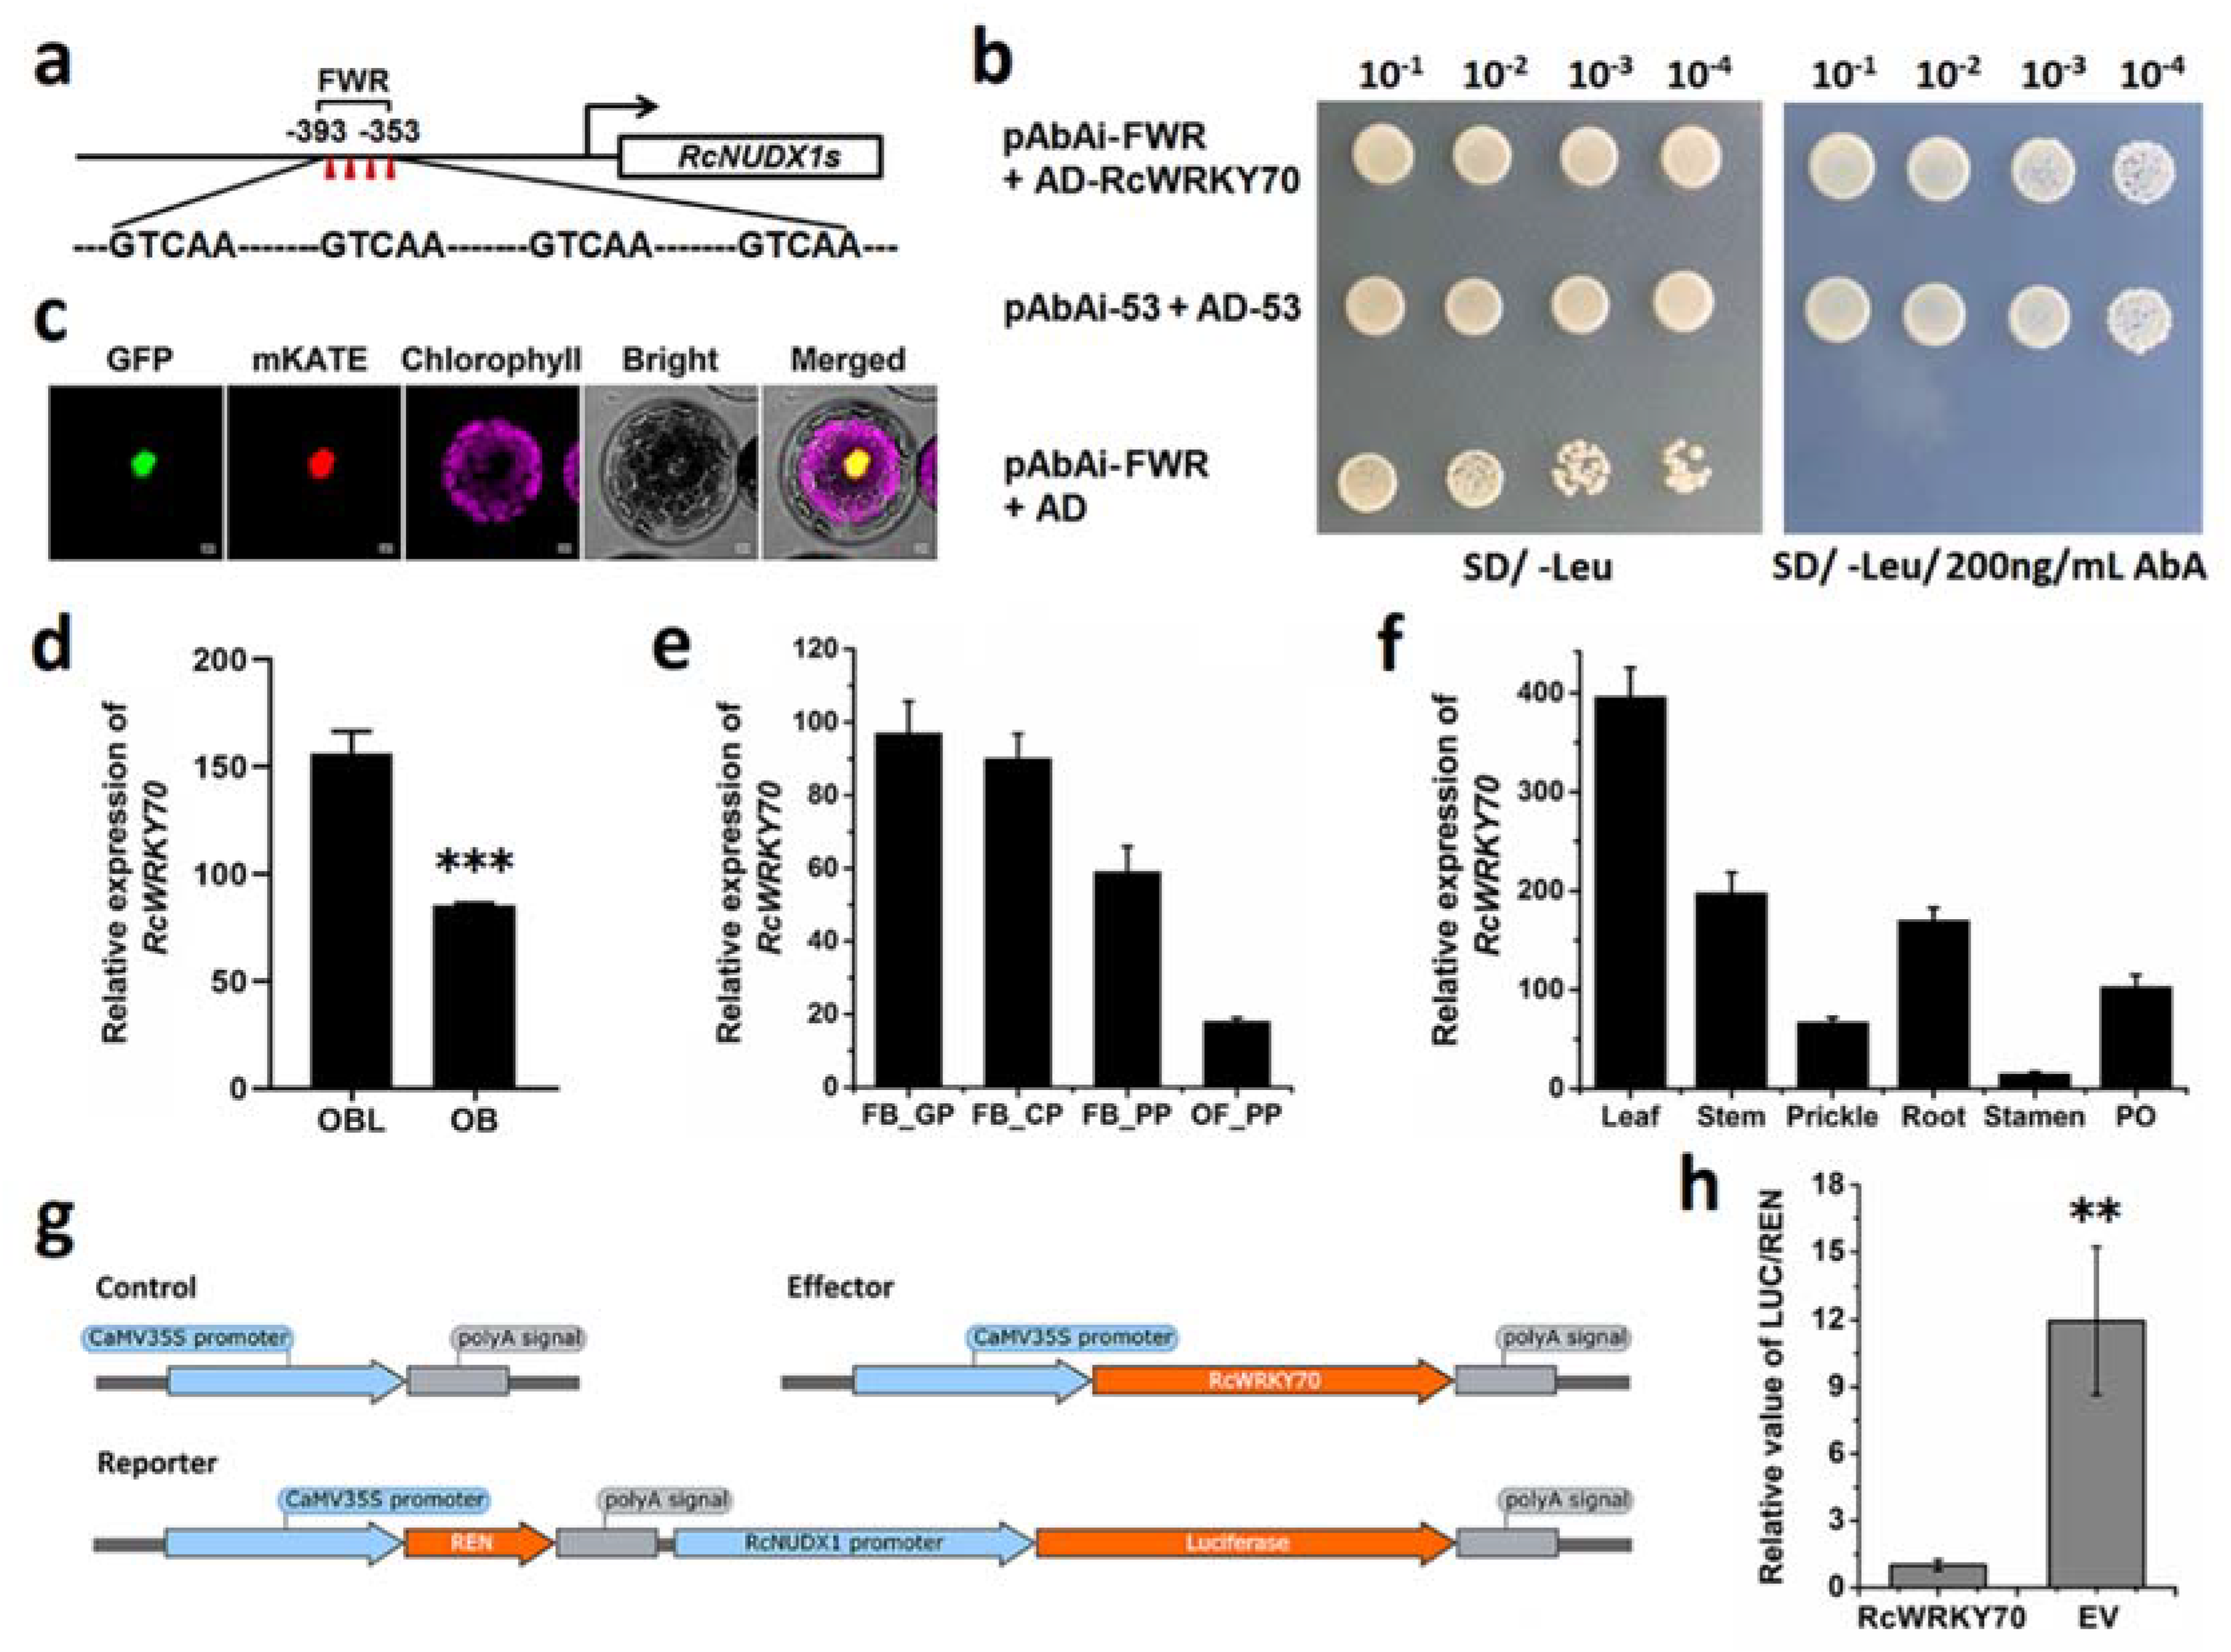
2.4. RcWPKY70 May Be a Transcriptional Repressor of RcNUDX1 Expression

We analyzed the DNA sequence characteristics of the RcNUDX1 genes using the OB genome sequence as a reference [22]. Aside from exhibiting the same exon–intron structures, these RcNUDX1 genes also possessed the same sequence in a part of their promoter regions (Figure S6), which may have arisen during gene duplication. In this conserved promoter region, we detected four W–box tandem repeats (FWR, Figure 5a).
Therefore, we generated a yeast one-hybrid (Y1H) cDNA library of R. chinensis OB and performed a Y1H assay to screen TFs that might bind to the FWR. A concentration of 200 ng/mL of Aureobasidin A (AbA) was sufficient to reduce background in yeast cells harboring the pAbAi–FWR vector (Figure S7). After an initial screening of the cDNA library, we confirmed each positive clone by testing their interaction with pAbAi–FWR again. Sequencing of all positive clones revealed one TF gene, which we named RcWRKY70 (Figure 5b). We determined that RcWRKY70 localizes to the nucleus, as evidenced by the localization of a RcWRKY70-GFP (green fluorescent protein) fusion and co-localization with the nuclear marker protein mKATE (Figure 5c). To further understand the relationship between RcWRKY70 and RcNUDX1, we investigated their expression levels by RT–qPCR. As shown in Figure 5d,f, RcWRKY70 was highly expressed in OBL petals and downregulated with the progression of petal development. RcWRKY70 showed its lowest expression in stamens. The expression pattern of RcNUDX1 was published [22] and was almost completely opposite that of RcWRKY70. To test if RcWRKY70 may regulate expression of RcNUDX1, we conducted a dual-luciferase assay in Nicotiana benthamiana leaves. Indeed, the expression of RcWRKY70 repressed RcNUDX1 transcription (Figure 5g,h). These results indicate that RcWRKY70 can bind to and repress RcNUDX1.

3. Discussion

Geraniol is one of the most important components that defines rose fragrance, making geraniol “a pleasant rose-like aroma” chemical [24]. Geraniol has many important biological properties, for example, as an insect repellent [25], an antimicrobial agent [26], and an anti-inflammatory agent [27]. Research on the biosynthesis of natural geraniol could contribute to the full utilization of this substance.
The typical terpene biosynthetic pathway has been largely elucidated, and the expression and transcriptional regulation of the genes encoding the enzymes acting at each step have been a research hotspot [28]. Rose has a unique geraniol biosynthesis pathway that includes RhNUDX1, an enzyme with geranyl diphosphate diphosphohydrolase activity in vitro that supports geraniol biosynthesis in rose [29]. NUDX1 in rose can convert GPP to GP, thereby participating in geraniol biosynthesis. We obtained two kinds of ‘Old Blush’ with different aromas. Metabolomic analysis revealed that geraniol was the main differentially abundant volatile accumulating in OB petals, making OB flowers a good test material for research on the regulation of geraniol biosynthesis. RNA-seq data indicated that not all genes in the geraniol biosynthesis pathway were upregulated in OB. Indeed, only RcHMGCR, RcGGPPS, and RcNUDX1 and two geraniol derivatives-related genes were upregulated in OB relative to OBL. We propose the following model to explain the differences in transcript levels between OB and OBL in the geraniol metabolic pathway (Figure 6). HMGCR catalyzes the NADPH-dependent biosynthesis reaction from HMG-CoA to MVA; since the generation of MVA is irreversible, HMGCR is thought to be the first rate-limiting enzyme in the MVA pathway [30]. Three IPP molecules and one DMAPP molecule form GGPP with a C20 skeleton via catalysis by GGPPS [31]. Geraniol is an acyclic monoterpene alcohol with a C10 skeleton, and its biosynthesis occurs mainly in the plastids and belongs to the MEP pathway. The higher expression of RcHMGCR and RcGGPPS in OB petals did not appear to have a direct effect on the increase in geraniol content. We speculate that the level of geraniol is directly related to the expression of RcNUDX1.
Considering the specificity of the accumulation and release sites of volatiles, we performed WGCNA using published RNA-seq data from OB flowers and the data obtained in this study. We determined that one co-expression module, the green-module, included RcNUDX1 and several geraniol-biosynthetic genes, whose expression profile closely followed that of geraniol accumulation in OB flowers [22]. Among the 17 co-expressed TF genes in this module, AP2/ERF, NAC, bHLH, and MYB members have been reported to regulate terpene biosynthesis [32,33,34,35]. Other TFs also have connections with terpene-related biological functions; for example, C2H2 TFs participate in biotic/abiotic stresses responses [36], and bZIP TFs are responsible for plant immunity and abiotic stress responses [37]. However, the possible relationship between RcNUDX1 and the remaining TFs is not clear. These co-expressed TF genes lay the foundation for further studies on the transcriptional regulation of geraniol biosynthesis. We suggest these TFs as candidates for follow-up studies on the transcriptional regulation of geraniol biosynthesis in rose.
TFs are DNA-binding proteins that activate or repress transcription [38]. In addition to activating gene expression, some TFs can also inhibit the expression of target genes. The W–box is the cognate cis-element for WRKY TFs [16]. Some WRKYs were shown to be involved in the transcriptional regulation of plant terpene biosynthesis [39]; the green-module contained no WRKY members. However, the presence of the four tandem W–box repeats suggested some connection between WRKY and RcNUDX1 in rose. We showed here that RcWRKY70 can bind to the RcNUDX1 promoter and inhibit RcNUDX1 transcription (Figure 5). Notably, the promoter of several tandemly repeated RcNUDX1 genes shared a sequence, to which the TF RcWRKY70 bound. We speculate that RcNUDX1 retained a part of the same promoter sequence (conserved promoter, Figure S6) during gene duplication, which helped maintain the RcNUDX1 expression pattern. Recent studies have found that the AP2/ERF TFs LcERF19 and CitERF71 can positively regulate geraniol biosynthesis in aromatic litsea and citrus respectively [20,21]. There are still no reports on the transcriptional regulation of WRKY involved in geraniol synthesis. Furthermore, there are few reports of TFs that regulate NUDX/NUDT genes. In Arabidopsis, ERF1 binds to the AtNUDT7 promoter, and ERF1 is co-expressed with AtNUDT7 in response to ozone stress [40]. By contrast, RcWRKY70 and RcNUDX1 expression levels were negatively correlated. RcWRKY70 can inhibit RcNUDX1 expression and, thus, geraniol biosynthesis. WRKYs are not constitutively expressed in plants but instead are induced by various environmental stresses, such as pathogens, drought, low temperature, or mechanical stress. WRKYs also participate in various physiological processes in plants [41,42,43]. RcWRKY70 may serve as an entry point to study the association between geraniol biosynthesis and other biological events. In the breeding of roses based on floral volatiles, not only a good scent but also the biological characteristics of the volatiles themselves must be considered. Here, we proposed a brief model of the transcriptional regulation of the geraniol metabolism pathway in R. chinensis to provide support for molecular breeding of rose fragrance.

4. Materials and Methods

4.1. Plant Materials and Sample Collection

R. chinensis plants were grown in the artificial climate greenhouse at Beijing Forestry University (Beijing, China, located at 116°20′ E and 40°0′ N) under a 25 °C day/18 °C night temperature regime and a 12-h-light/12-h-dark photoperiod with 60% relative humidity. Rose petals were collected at stage 5 (preliminarily opened flower) from 3-year-old R. chinensis ‘Old Blush’ (OB) and R. chinensis ‘Old Blush’-like (OBL, a natural mutant of OB, similar to OB in terms of phenotypes except for aroma and petal color). Ten healthy rose plants each of OB and OBL were prepared for sampling. All samples were frozen immediately in liquid nitrogen and stored at −80 °C until use.

4.2. Gas Chromatography—Mass Spectrometry (GC–MS) Analysis

All stage 5 petals of OB and OBL from three flowers were pooled as one sample; eight biological replicates were collected for GC–MS analysis. The samples were ground to powder, and 0.5 g of powder was quickly transferred into a 20-mL headspace bottle and capped before placing the bottle on a Tray2 tray in a CTC auto-sampler. The needle from the headspace vial completed the solid phase microextraction automatically and inserted the gas extract into the injection port, with the settings 40 min at 80 °C during extracting and 250 °C for 5 min for GC–MS.
The GC system (Agilent 7890A) was coupled to a mass spectrometer (Agilent –5975C Triple Quadrupole, Agilent, Santa Clara, CA, USA). An HB–5MS column (5% phenyl methyl silox: 30 m × 250 µm i.d., 0.25 µm; Agilent J&W scientific, Folsom, CA, USA) was used for all samples. The analytical conditions were set as follows: The initial temperature was held at 50 °C for 1 min and raised to 210 °C for 2 min at 3 °C/min, held for 3 min, and finally, increased to 230 °C at 15 °C/min. GC–MS was conducted in the split-less mode, using helium as the carrier gas with a rate of 1.0 mL/min.
The mass spectrometer was operated in electron-impact (EI) mode at 230 °C, with the electron power set to 70 eV; the auxiliary temperature was set to 280 °C, and the four-stage rod temperature and the quadrupole mass spectrometer were set to 230 °C. The scan range was 80–500 m/z. The analysis of GC–MS results was carried out as previously described [44]. The Agilent MSD ChemStation software (c.01.08) was used to convert the raw data into netCDF format [45] and annotate each sample using the total peak area normalization algorithm to compare the data of different magnitudes.

4.3. Transcriptome Deep Sequencing (RNA-Seq)

Total RNA was extracted using an SV Total RNA Isolation Kit (Promega, Madison, WI, USA) from stage 5 petals following the manufacturer’s instructions. All petals from three flowers for OB or OBL each were pooled as one sample, and three biological replicates were examined. Library construction, sequencing, functional annotation, and analysis of differentially expressed genes (DEGs) were performed according to a previous study [46]. The raw sequencing data were deposited as BioProject PRJNA851232 in the NCBI Sequence Read Archive (National Center for Biotechnology Information). A summary of all reads quantified with StringTie [47] is shown in Table S5. HTSeq v0.9.1 was used to count the number of reads mapped to the rose reference genome (Table S6) [22,48]. Genes with an adjusted p-value < 0.05 were considered differentially expressed. Kyoto Encyclopedia of Genes and Genomes (KEGG) enrichment analysis was performed using KOBAS v2.0 (corrected p-value < 0.05; http://www.genome.jp/kegg/, accessed on 16 February 2020).

4.4. Weighted Gene Co-Expression Network Analysis (WGCNA)

The 3574 upregulated DEGs in OB compared to OBL were used as input for WGCNA (Table S7) [49]. The RNA-seq data from rose petals at different stages of development (BioProject PRJNA351281) and those from different rose tissues (root, stem, leaf, prickle, stamen, pistil, and ovary tissue; BioProject PRJNA546486) were also combined in Table S7 for WGCNA. The removeBatchEffect function in Limma was used to adjust for batch effects [50]. The soft threshold power was calculated using the pickSoftThreshold function in R package WGCNA. Co-expression modules were obtained using the automatic network construction function blockwiseModules of WGCNA with the following settings: power = 12, TOM-Type = unsigned, minModuleSize = 30, and mergeCutHeight = 0.25. The green-module containing RcNUDX1 (RchiOBHmChr2g0142071, RchiOBHmChr2g0142081, and RchiOBHmChr2g0142111) was selected for further study. Heatmaps representing gene expression levels were drawn with the R package pheatmap (Tables S8 and S9).

4.5. RT–qPCR Validation

Stage 5 petals and different tissues from OB and OBL were collected and processed for total RNA extraction and first-strand cDNA synthesis as previously described [51]. The key DEGs involved in the terpenoid metabolic pathway and RcWRKY70 were subjected to validation by RT–qPCR using RcACTIN as the reference transcript. Primer sequences are provided in Table S11. qPCR was performed with a Green® Premix Ex Taq™ II (RR420Q, Takara, Tokyo, Japan) and the CFX Connect Real-Time PCR Detection System (Bio–Rad, Hercules, CA, USA). Each sample was tested as three technical replicates. Relative gene expression levels were obtained by the comparative 2−ΔΔCt method [52]. All results were plotted in Origin9 (OriginLab, Northampton, MA, USA).

4.6. Subcellular Localization

The coding sequence of RcWRKY70 was amplified by PCR under the following conditions: 94 °C for 2 min, followed by 35 cycles of 94 °C for 10 s, 60 °C for 15 s, and 72 °C for 2 min, with a final extension of 72 °C for 5 min (KOD–Plus–Neo DNA Polymerase Reaction System, TOYOBO Co., Ltd. Life Science Department, Osaka, Japan). Primer sequences are provided in Table S11. The PCR product was cloned into the pEZS–NL vector (Dr Ehrhardt, Carnegie Institution, Stanford, CA, USA) digested with KpnI and XhoI. A. thaliana protoplast isolation and transfection were carried out according to a standard protocol [53]. The nuclei were labeled with the fluorescent marker mKATE, with excitation at 588 nm and emission at 635 nm [54]. The transfected protoplasts were incubated at 23 °C for 16 h and observed under a confocal microscope (Leica TCS SP8, Leica Microsystems, Mannheim, Germany) to detect fluorescence; GFP was excited at 488 nm and its emission wavelength was 507 nm.

4.7. Cloning of the RcNUDX1 Promoter

Genomic DNA was isolated from ‘Old Blush’ petals using an E.Z.N.A.® Plant DNA Kit (Omega Bio–tek, Norcross, GA, USA) according to the manufacturer’s instructions. A 1207-bp promoter fragment of RcNUDX1 was amplified using KOD plus DNA polymerase (TOYOBO Co., Ltd. Life Science Department, Osaka, Japan). Primer sequences are provided in Table S11. The cis-motifs in the promoter were analyzed by the online software PlantCARE (http://bioinformatics.psb.ugent.be/webtools/plantcare/html/, accessed on 2 September 2021) and New PLACE (https://www.dna.affrc.go.jp/PLACE/?action=newplace, accessed on 2 September 2021).

4.8. Yeast One-Hybrid cDNA Library Creation

Total RNA was separately isolated from R. chinensis OB tissues (leaf, flower, stem, and root) using an E.Z.N.A.® Plant RNA Kit (Omega Bio–tek, Norcross, GA, USA) and mixed according to the manufacturer’s instructions. A CloneMiner II cDNA Library Construction Kit (Invitrogen, Carlsbad, CA, USA) was used to generate a cDNA library. The cDNA library was normalized using a Trimmer Direct cDNA Normalization Kit, purified by a TaKaRa MiniBEST DNA Fragment Purification Kit (Takara, Tokyo, Japan), and enriched using a CHROMA SPIN–1000–TE system (Clontech, Mountain View, CA, USA). The enriched cDNA was ligated into the pGADT7–SfiI vector and then the cDNA library was purified with a PureLink™ HQ Mini Plasmid DNA Purification Kit (Invitrogen, Carlsbad, CA, USA).

4.9. Construction of Bait Plasmids Construction and Self-Activation Test

The three tandem repeats of the four W–box region (FWR) promoter sequence were synthesized and sequenced (Sunbiotech Co., Ltd., Beijing, China). The FWR was cloned into the pAbAi vector digested with HindIII and SalI. Primer sequences are provided in Table S11. The resulting pAbAi–FWR plasmid was digested with BstBI and BbsI before integration into the yeast genome of strain Y1H Gold according to the manufacturer’s instructions (Clontech, Mountain View, CA, USA). The bait yeast strains were screened on synthetic defined (SD)-Ura medium with optimal Aureobasidin A (AbA) concentration (0, 100, 150, 200, 300, 500, 700, and 900 ng/mL) to suppress autoactivation after 3 days at 28 °C. The minimum AbA concentration that could completely inhibit strains was determined for library screening.

4.10. Yeast One-Hybrid Screening

The full-length RcWRKY70 coding sequence was cloned into the pGADT7 vector digested with NdeI and BamHI (primers are listed in Table S11). The Matchmaker™ Gold Yeast One-Hybrid System (Clontech, Mountain View, CA, USA) was used to carry out the Y1H assay according to the manufacturer’s protocol. The yeast cells were spread as 100 μL of 1:10, 1:100, 1:1000, and 1:10,000 dilutions on SD/–Leu plates with 200 ng/mL AbA concentration for 3 days. The positive colonies were tested with Matchmaker Insert Check PCR Mix 2 (Clontech, Mountain View, CA, USA) to amplify prey library inserts. A TIANprep Yeast Plasmid DNA Kit (TIANGEN, Beijing, China) was used to extract the plasmids from yeast, and all clones were sequenced (Sunbiotech Co., Ltd., Beijing, China).

4.11. Dual–Luciferase (Dual–LUC) Assay

The full-length RcWRKY70 coding sequence was cloned into the pGreenII62-SK plasmid (effector) digested with XbaI and KpnI, and the RcNUDX1 promoter fragment was cloned into the pGreenII0800–LUC plasmid (reporter) digested with HindIII and BamHI. Primer sequences are provided in Table S11. The empty pGreenII62–SK plasmid was used as control for the effector. The effector and reporter were individually transformed into Agrobacterium (Agrobacterium tumefaciens) strain GV3101. Agrobacterium cultures grown overnight were collected by brief centrifugation and resuspended in infiltration solution (10 mM MES, 10 mM MgCl2, 200 mM acetosyringone, pH 5.8) to an OD600 = 1.2 and incubated for 2 h at 23 °C. The cell suspensions were then mixed (1:1, v/v), harboring the appropriate combination of effector and reporter constructs, and infiltrated into the leaves of 30-day-old Nicotiana benthamiana plants with a needleless syringe. Plants were grown at 23 °C for 48 h under a 12-h-day/12-h-dark photoperiod. LUC and REN enzymatic activities were analyzed with a dual-luciferase assay reagent kit (Promega, Madison, WI, USA).

Supplementary Materials

The following supporting information can be downloaded at: https://www.mdpi.com/article/10.3390/ijms232314684/s1. Figure S1: OPLS–DA, PCA, and PLS–DA of metabolites with permutation test; Figure S2: Hierarchical clustering heatmap of 31 volatiles based on GC–MS results; Figure S3: Comparative analysis of differentially abundant volatiles in OB and OBL petals. (a) Pie charts showing the classification and distribution of differentially abundant volatiles in OB and OBL. (b) Distribution of volatile contents in OB. (c) Distribution of volatile contents in OBL; Figure S4: WGCNA of 3574 DEGs between OB and OBL. (a) A 26-sample clustering analysis to detect outliers. (b) Soft threshold (power) screening. R2 = 0.85. (c) Analysis of the soft threshold and mean connectivity. (d) Branches of the module group together with eigengenes that are positively correlated. (e) Heatmap of the adjacencies in the eigengene network between modules. Red, high adjacency; blue, low adjacency; Figure S5: The heatmap of the Topological Overlap Matrix (TOM) among all genes in WGCNA; Figure S6: Schematic diagram of the distribution of genetic elements from RchiOBHmChr2g0142121 to RchiOBHmChr2g0142051 in the rose genome; Figure S7: Determination of the optimum concentration of AbA for yeast one-hybrid screening; Table S1: The OPLS–DA, PCA, and PLS–DA parameters model for all detected compounds; Table S2: The PLS–DA variable importance in projection scores of 67 compounds; Table S3: The correlation matrix information between 31 compounds; Table S4: List of differential volatile compounds analyzed by GC–MS in petals of OBL and OB; Table S5: Analysis of the read quality for 6 samples. Error (%) represent the error rate of sequenced bases; Table S6: Number of RNA-seq reads sequenced and mapped on the R. chinensis genome; Table S7: Functional annotation and classification of DEGs involved in terpene biosynthesis pathway by RNA-seq analysis (OB vs. OBL); Table S8: FPKMs of the 3574 DEGs across 26 samples used for the WGCNA (|log2Ratio| ≥ 0.5 and p ≤ 0.05, OB vs. OBL); Table S9: DEGs information of the green-module in four stage petals of R. chinensis ‘Old Blush’; Table S10: DEGs information of the green-module in six organs of R. chinensis ‘Old Blush’; Table S11: Primer sequences used in this study.

Author Contributions

Y.H. and J.Y. conceived and designed the study. J.Y., X.L. and Y.H. performed most of the experiments and wrote the manuscript. Y.P. and Q.L. provided help with the experiments and data analysis. All authors have read and agreed to the published version of the manuscript.

Funding

This research was funded by the Fundamental Research Funds for the Central Universities, grant number 2021ZY43; the National Key Research and Development Program of China, grant number 2019YFD1001001; the National Natural Science Foundation of China, grant number 31800594, the Beijing Natural Science Foundation, grant number 6174045.

Institutional Review Board Statement

Not applicable.

Informed Consent Statement

Not applicable.

Data Availability Statement

The raw sequencing data of RNA-seq in this study were deposited as BioProject PRJNA851232 in the NCBI Sequence Read Archive (National Center for Biotechnology Information).

Conflicts of Interest

The authors declare no conflict of interest.

References

  1. Tholl, D. Biosynthesis and Biological Functions of Terpenoids in Plants. In Biotechnology of Isoprenoids; Schrader, J., Bohlmann, J., Eds.; Advances in Biochemical Engineering/Biotechnology; Springer International Publishing: Cham, Switzerland, 2015; Volume 148, pp. 63–106. ISBN 978-3-319-20106-1. [Google Scholar]
  2. Degenhardt, J.; Köllner, T.G.; Gershenzon, J. Monoterpene and Sesquiterpene Synthases and the Origin of Terpene Skeletal Diversity in Plants. Phytochemistry 2009, 70, 1621–1637. [Google Scholar] [CrossRef] [PubMed]
  3. Yamada, Y.; Kuzuyama, T.; Komatsu, M.; Shin-Ya, K.; Omura, S.; Cane, D.E.; Ikeda, H. Terpene Synthases Are Widely Distributed in Bacteria. Proc. Natl. Acad. Sci. USA 2015, 112, 857–862. [Google Scholar] [CrossRef] [PubMed] [Green Version]
  4. McGarvey, D.J.; Croteau, R. Terpenoid Metabolism. Plant Cell 1995, 7, 1015–1026. [Google Scholar] [CrossRef] [Green Version]
  5. Suire, C.; Bouvier, F.; Backhaus, R.A.; Bégu, D.; Bonneu, M.; Camara, B. Cellular Localization of Isoprenoid Biosynthetic Enzymes in Marchantia Polymorpha. Uncovering a New Role of Oil Bodies. Plant Physiol. 2000, 124, 971–978. [Google Scholar] [CrossRef] [Green Version]
  6. Denbow, C.J.; Lång, S.; Cramer, C.L. The N-Terminal Domain of Tomato 3-Hydroxy-3-Methylglutaryl-CoA Reductases. J. Biol. Chem. 1996, 271, 9710–9715. [Google Scholar] [CrossRef] [PubMed] [Green Version]
  7. Carrie, C.; Murcha, M.W.; Millar, A.H.; Smith, S.M.; Whelan, J. Nine 3-Ketoacyl-CoA Thiolases (KATs) and Acetoacetyl-CoA Thiolases (ACATs) Encoded by Five Genes in Arabidopsis Thaliana Are Targeted Either to Peroxisomes or Cytosol but Not to Mitochondria. Plant Mol. Biol. 2007, 63, 97–108. [Google Scholar] [CrossRef] [PubMed]
  8. Chandler, S.F.; Brugliera, F. Genetic Modification in Floriculture. Biotechnol. Lett 2011, 33, 207–214. [Google Scholar] [CrossRef]
  9. Dudareva, N.; Cseke, L.; Blanc, V.M.; Pichersky, E. Evolution of Floral Scent in Clarkia: Novel Patterns of S-Linalool Synthase Gene Expression in the C. Breweri Flower. Plant Cell 1996, 8, 1137–1148. [Google Scholar] [CrossRef] [Green Version]
  10. Cairns, T.; American Rose Society. Modern Roses XI: The World Encyclopedia of Roses; Academic Press: San Diego, CA, USA, 2000; ISBN 978-0-12-155053-0. [Google Scholar]
  11. Foucher, F.; Hibrand-Saint Oyant, L.; Hamama, L.; Sakr, S.; Nybom, H.; Baudino, S.; Caissard, J.P.; Byrne, D.M.; Smulder, J.M.S.; Desnoyé, B.; et al. Towards the rose genome sequence and its use in research and breeding. Acta Hortic. 2015, 2064, 167–175. [Google Scholar] [CrossRef]
  12. Joichi, A.; Yomogida, K.; Awano, K.; Ueda, Y. Volatile Components of Tea-Scented Modern Roses and Ancient Chinese Roses. Flavour Fragr. J. 2004, 20, 152–157. [Google Scholar] [CrossRef]
  13. Jin, Y.; Cui, H.; Yuan, X.; Liu, L.; Liu, X.; Wang, Y.; Ding, J.; Xiang, H.; Zhang, X.; Liu, J.; et al. Identification of the Main Aroma Compounds in Chinese Local Chicken High-Quality Meat. Food Chem. 2021, 359, 129930. [Google Scholar] [CrossRef] [PubMed]
  14. Gupta, P.; Taneja, S.C.; Shah, B.A.; Sethi, V.K.; Qazi, G.N. Lipase-Catalyzed Separation of Geometrical Isomers: Geraniol–Nerol. Chem. Lett. 2007, 36, 1110–1111. [Google Scholar] [CrossRef]
  15. Paroul, N.; Grzegozeski, L.P.; Chiaradia, V.; Treichel, H.; Cansian, R.L.; Oliveira, J.V.; de Oliveira, D. Solvent-Free Geranyl Oleate Production by Enzymatic Esterification. Bioprocess. Biosyst. Eng. 2011, 34, 323–329. [Google Scholar] [CrossRef] [PubMed]
  16. Ramya, M.; Kwon, O.K.; An, H.R.; Park, P.M.; Baek, Y.S.; Park, P.H. Floral Scent: Regulation and Role of MYB Transcription Factors. Phytochem. Lett. 2017, 19, 114–120. [Google Scholar] [CrossRef]
  17. Hong, G.-J.; Xue, X.-Y.; Mao, Y.-B.; Wang, L.-J.; Chen, X.-Y. Arabidopsis MYC2 Interacts with DELLA Proteins in Regulating Sesquiterpene Synthase Gene Expression. Plant Cell 2012, 24, 2635–2648. [Google Scholar] [CrossRef] [Green Version]
  18. Yu, Z.-X.; Li, J.-X.; Yang, C.-Q.; Hu, W.-L.; Wang, L.-J.; Chen, X.-Y. The Jasmonate-Responsive AP2/ERF Transcription Factors AaERF1 and AaERF2 Positively Regulate Artemisinin Biosynthesis in Artemisia annua L. Mol. Plant 2012, 5, 353–365. [Google Scholar] [CrossRef] [Green Version]
  19. Li, S.; Wang, H.; Li, F.; Chen, Z.; Li, X.; Zhu, L.; Wang, G.; Yu, J.; Huang, D.; Lang, Z. The Maize Transcription Factor EREB58 Mediates the Jasmonate-Induced Production of Sesquiterpene Volatiles. Plant J. 2015, 84, 296–308. [Google Scholar] [CrossRef] [Green Version]
  20. Li, X.; Xu, Y.; Shen, S.; Yin, X.; Klee, H.; Zhang, B.; Chen, K. Transcription Factor CitERF71 Activates the Terpene Synthase Gene CitTPS16 Involved in the Synthesis of E–Geraniol in Sweet Orange Fruit. J. Exp. Bot. 2017, 68, 4929–4938. [Google Scholar] [CrossRef] [Green Version]
  21. Wang, M.; Gao, M.; Zhao, Y.; Chen, Y.; Wu, L.; Yin, H.; Yang, J.; Xiong, S.; Wang, S.; Wang, J.; et al. LcERF19, an AP2/ERF Transcription Factor from Litsea Cubeba, Positively Regulates Geranial and Neral Biosynthesis. Hortic. Res. 2022, 9, uhac093. [Google Scholar] [CrossRef]
  22. Raymond, O.; Gouzy, J.; Just, J.; Badouin, H.; Verdenaud, M.; Lemainque, A.; Vergne, P.; Moja, S.; Choisne, N.; Pont, C.; et al. The Rosa Genome Provides New Insights into the Domestication of Modern Roses. Nat. Genet. 2018, 50, 772–777. [Google Scholar] [CrossRef]
  23. Conart, C.; Saclier, N.; Foucher, F.; Goubert, C.; Rius-Bony, A.; Paramita, S.N.; Moja, S.; Thouroude, T.; Douady, C.; Sun, P.; et al. Duplication and Specialization of NUDX1 in Rosaceae Led to Geraniol Production in Rose Petals. Mol. Biol. Evol. 2022, 39, msac002. [Google Scholar] [CrossRef] [PubMed]
  24. Mączka, W.; Wińska, K.; Grabarczyk, M. One Hundred Faces of Geraniol. Molecules 2020, 25, 3303. [Google Scholar] [CrossRef] [PubMed]
  25. Papachristos, D.P.; Karamanoli, K.I.; Stamopoulos, D.C.; Menkissoglu-Spiroudi, U. The Relationship between the Chemical Composition of Three Essential Oils and Their Insecticidal Activity AgainstAcanthoscelides Obtectus(Say). Pest. Manag. Sci. 2004, 60, 514–520. [Google Scholar] [CrossRef] [PubMed]
  26. Sato, K.; Krist, S.; Buchbauer, G. Antimicrobial Effect of Vapours of Geraniol, (R)-(–)-Linalool, Terpineol,γ-Terpinene and 1,8-Cineole on Airborne Microbes Using an Airwasher. Flavour Fragr. J. 2007, 22, 435–437. [Google Scholar] [CrossRef]
  27. de Cássia da Silveira e Sá, R.; Andrade, L.; de Sousa, D. A Review on Anti-Inflammatory Activity of Monoterpenes. Molecules 2013, 18, 1227–1254. [Google Scholar] [CrossRef] [PubMed]
  28. Nagegowda, D.A.; Gupta, P. Advances in Biosynthesis, Regulation, and Metabolic Engineering of Plant Specialized Terpenoids. Plant Sci. 2020, 294, 110457. [Google Scholar] [CrossRef]
  29. Magnard, J.-L.; Roccia, A.; Caissard, J.-C.; Vergne, P.; Sun, P.; Hecquet, R.; Dubois, A.; Hibrand-Saint Oyant, L.; Jullien, F.; Nicolè, F.; et al. Biosynthesis of Monoterpene Scent Compounds in Roses. Science 2015, 349, 81–83. [Google Scholar] [CrossRef] [Green Version]
  30. Bach, T.J. Hydroxymethylglutaryl-CoA Reductase, a Key Enzyme in Phytosterol Synthesis? Lipids 1986, 21, 82–88. [Google Scholar] [CrossRef]
  31. Lange, B.M.; Ghassemian, M. Genome organization in Arabidopsis thaliana: A survey for genes involved in isoprenoid and chlorophyll metabolism. Plant Mol. Biol. 2003, 51, 925–948. [Google Scholar] [CrossRef]
  32. Zvi, M.M.B.; Shklarman, E.; Masci, T.; Kalev, H.; Debener, T.; Shafir, S.; Ovadis, M.; Vainstein, A. PAP1 Transcription Factor Enhances Production of Phenylpropanoid and Terpenoid Scent Compounds in Rose Flowers. New Phytol. 2012, 195, 335–345. [Google Scholar] [CrossRef]
  33. Nieuwenhuizen, N.J.; Chen, X.; Wang, M.Y.; Matich, A.J.; Perez, R.L.; Allan, A.C.; Green, S.A.; Atkinson, R.G. Natural Variation in Monoterpene Synthesis in Kiwifruit: Transcriptional Regulation of Terpene Synthases by NAC and ETHYLENE-INSENSITIVE3-Like Transcription Factors. Plant Physiol. 2015, 167, 1243–1258. [Google Scholar] [CrossRef] [Green Version]
  34. Liu, F.; Xiao, Z.; Yang, L.; Chen, Q.; Shao, L.; Liu, J.; Yu, Y. PhERF6, Interacting with EOBI, Negatively Regulates Fragrance Biosynthesis in Petunia Flowers. New Phytol. 2017, 215, 1490–1502. [Google Scholar] [CrossRef] [Green Version]
  35. Chuang, Y.-C.; Hung, Y.-C.; Tsai, W.-C.; Chen, W.-H.; Chen, H.-H. PbbHLH4 Regulates Floral Monoterpene Biosynthesis in Phalaenopsis Orchids. J. Exp. Bot. 2018, 69, 4363–4377. [Google Scholar] [CrossRef] [PubMed] [Green Version]
  36. Yin, J.; Wang, L.; Zhao, J.; Li, Y.; Huang, R.; Jiang, X.; Zhou, X.; Zhu, X.; He, Y.; He, Y.; et al. Genome-Wide Characterization of the C2H2 Zinc-Finger Genes in Cucumis Sativus and Functional Analyses of Four CsZFPs in Response to Stresses. BMC Plant Biol. 2020, 20, 359. [Google Scholar] [CrossRef] [PubMed]
  37. Moreno, A.A.; Mukhtar, M.S.; Blanco, F.; Boatwright, J.L.; Moreno, I.; Jordan, M.R.; Chen, Y.; Brandizzi, F.; Dong, X.; Orellana, A.; et al. IRE1/BZIP60-Mediated Unfolded Protein Response Plays Distinct Roles in Plant Immunity and Abiotic Stress Responses. PLoS ONE 2012, 7, e31944. [Google Scholar] [CrossRef] [PubMed] [Green Version]
  38. Meshi, T.; Iwabuchi, M. Plant Transcription Factors. Plant Cell Physiol 1995, 36, 1405–1420. [Google Scholar] [PubMed]
  39. Schluttenhofer, C.; Yuan, L. Regulation of Specialized Metabolism by WRKY Transcription Factors. Plant Physiol. 2015, 167, 295–306. [Google Scholar] [CrossRef] [Green Version]
  40. Muthuramalingam, M.; Zeng, X.; Iyer, N.J.; Klein, P.; Mahalingam, R. A GCC-Box Motif in the Promoter of Nudix Hydrolase 7 (AtNUDT7) Gene Plays a Role in Ozone Response of Arabidopsis Ecotypes. Genomics 2015, 105, 31–38. [Google Scholar] [CrossRef]
  41. Rushton, P.J.; Somssich, I.E.; Ringler, P.; Shen, Q.J. WRKY Transcription Factors. Trends Plant Sci. 2010, 15, 247–258. [Google Scholar] [CrossRef]
  42. Chen, L.; Song, Y.; Li, S.; Zhang, L.; Zou, C.; Yu, D. The Role of WRKY Transcription Factors in Plant Abiotic Stresses. Biochim. Biophys. Acta (BBA)-Gene Regul. Mech. 2012, 1819, 120–128. [Google Scholar] [CrossRef]
  43. Chi, Y.; Yang, Y.; Zhou, Y.; Zhou, J.; Fan, B.; Yu, J.-Q.; Chen, Z. Protein–Protein Interactions in the Regulation of WRKY Transcription Factors. Mol. Plant 2013, 6, 287–300. [Google Scholar] [CrossRef] [PubMed] [Green Version]
  44. Lv, S.; Wu, Y.; Zhou, J.; Lian, M.; Li, C.; Xu, Y.; Liu, S.; Wang, C.; Meng, Q. The Study of Fingerprint Characteristics of Dayi Pu-Erh Tea Using a Fully Automatic HS-SPME/GC-MS and Combined Chemometrics Method. PLoS ONE 2014, 9, e116428. [Google Scholar] [CrossRef] [PubMed]
  45. Smith, C.A.; Want, E.J.; O’Maille, G.; Abagyan, R.; Siuzdak, G. XCMS: Processing Mass Spectrometry Data for Metabolite Profiling Using Nonlinear Peak Alignment, Matching, and Identification. Anal. Chem. 2006, 78, 779–787. [Google Scholar] [CrossRef]
  46. Han, Y.; Yong, X.; Yu, J.; Cheng, T.; Wang, J.; Yang, W.; Pan, H.; Zhang, Q. Identification of Candidate Adaxial–Abaxial-Related Genes Regulating Petal Expansion During Flower Opening in Rosa Chinensis “Old Blush”. Front. Plant Sci. 2019, 10, 1098. [Google Scholar] [CrossRef] [PubMed] [Green Version]
  47. Pertea, M.; Pertea, G.M.; Antonescu, C.M.; Chang, T.-C.; Mendell, J.T.; Salzberg, S.L. StringTie Enables Improved Reconstruction of a Transcriptome from RNA-Seq Reads. Nat. Biotechnol. 2015, 33, 290–295. [Google Scholar] [CrossRef] [PubMed] [Green Version]
  48. Anders, S.; Pyl, P.T.; Huber, W. HTSeq—A Python Framework to Work with High-Throughput Sequencing Data. Bioinformatics 2015, 31, 166–169. [Google Scholar] [CrossRef] [Green Version]
  49. Langfelder, P.; Horvath, S. WGCNA: An R Package for Weighted Correlation Network Analysis. BMC Bioinform. 2008, 9, 559. [Google Scholar] [CrossRef] [Green Version]
  50. Ritchie, M.E.; Phipson, B.; Wu, D.; Hu, Y.; Law, C.W.; Shi, W.; Smyth, G.K. Limma Powers Differential Expression Analyses for RNA-Sequencing and Microarray Studies. Nucleic Acids Res. 2015, 43, e47. [Google Scholar] [CrossRef]
  51. Han, Y.; Wan, H.; Cheng, T.; Wang, J.; Yang, W.; Pan, H.; Zhang, Q. Comparative RNA-Seq Analysis of Transcriptome Dynamics during Petal Development in Rosa Chinensis. Sci. Rep. 2017, 7, 43382. [Google Scholar] [CrossRef] [Green Version]
  52. Rao, X.; Huang, X.; Zhou, Z.; Lin, X. An Improvement of the 2ˆ(−Delta Delta CT) Method for Quantitative Real-Time Polymerase Chain Reaction Data Analysis. Biostat. Bioinform. Biomath. 2013, 3, 71–85. [Google Scholar]
  53. Abel, S.; Theologis, A. Transient Transformation of Arabidopsis Leaf Protoplasts: A Versatile Experimental System to Study Gene Expression. Plant J. 1994, 5, 421–427. [Google Scholar] [CrossRef] [PubMed]
  54. Zhao, F.; Zhao, T.; Deng, L.; Lv, D.; Zhang, X.; Pan, X.; Xu, J.; Long, G. Visualizing the Essential Role of Complete Virion Assembly Machinery in Efficient Hepatitis C Virus Cell-to-Cell Transmission by a Viral Infection-Activated Split-Intein-Mediated Reporter System. J. Virol. 2017, 91, e01720-16. [Google Scholar] [CrossRef] [PubMed]
Figure 1. Analysis of differentially abundant volatile compounds between OB and OBL flowers by GC–MS. (a) Representative stage 5 flowers (top) from ‘Old Blush’ (OB, left) and ‘Old Blush’-like (OBL, right) used for RNA-seq and GC–MS analyses. Completely open flowers are shown as well (bottom). Scale bars, 1 cm. (b) Number of differentially abundant volatiles detected by GC–MS between OB and OBL. (c) Correlation matrix between the concentrations of various volatiles among samples. The extent of correlation follows the indicated scale from −1 (blue, negative correlation) to +1 (red, positive correlation). The full names of all volatiles are shown in (d). (d) Significant differentially abundant compounds, identified based on their Z-score, reordered from (c) based on decreasing Log2 (Fold-change between OB and OBL). OB and OBL are shown as pink circles and darker pink circles. (e) Normalized abundance of geraniol (2,6-octadien-1-ol, 3,7-dimethyl-, (E)−) and citral (2,6-octadienal, 3,7-dimethyl-), shown as boxplots.
Ijms 23 14684 g001
Figure 2. The RNA-seq analysis of stage–5 petals between OB and OBL. (a) The volcano map of upregulated (red) and downregulated (green) DEGs between OB vs. OBL. (b,c) Statistics of KEGG pathway enrichment for upregulated DEGs and downregulated DEGs.
Ijms 23 14684 g002
Figure 3. RT–qPCR analysis of geraniol metabolism-related genes. Data are means ± standard deviation of three biological replicates. ** p < 0.01, *** p < 0.001 (Student’s t-test).
Ijms 23 14684 g003
Figure 4. WGCNA of the geraniol biosynthesis-related module. (a) Hierarchical cluster tree showing the co-expression modules identified by WGCNA. Each tree leaf represents one gene. (b) Heatmap representation of gene expression levels for green-module genes differentially expressed during the following four petal developmental stages of Old Blush: FB_GP, green petals in the flower bud; FB_CP, petals changing colors in the flower bud; FB_PP, pink petals in the flower bud; OF_PP, pink petals on the open flower. (c) Heatmap representation of gene expression levels for green-module genes differentially expressed in other tissues of Old Blush plants (stamen, root, leaf, pistil and ovary [PO], stem, and prickle).
Ijms 23 14684 g004
Figure 5. RcWRKY70 binds to and inhibits RcNUDX1 promoter activation. (a) Schematic diagram of the region of four W–box tandem repeats (FWR) in the RcNUDX1 promoter. (b) RcWRKY70 binds to the FWR regions, as shown by Y1H assays. pAbAi–53 + AD–53 represents the negative control; pAbAi–FWR + AD–RcWRKY70 represents the positive control. (c) Subcellular localization of RcWRKY70 in Arabidopsis protoplasts. mKATE served as nuclear marker. Scale bars, 10 µm. (df) RT–qPCR analysis of RcWRKY70 expression. OB, stage 4 petals of Old Blush, OBL, stage 4 petals of Old Blush-like. FB_GP, green petals in the flower bud; FB_CP, petals changing colors in the flower bud; FB_PP, pink petals in the flower bud; OF_PP, pink petals on the open flower. PO, pistil and ovary of ‘Old Blush’. Data are means + SD of three biological replicates. *** p < 0.001 (Student’s t-test). (g) Schematic diagrams of vectors used in the dual–LUC assay. (h) In vivo interactions between RcWRKY70 and the RcNUDX1 promoter as tested by transient assays in N. benthamiana leaves. EV, empty vector (Control). Data are means ± SE of three biological replicates. ** p < 0.01 (Student’s t-test).
Ijms 23 14684 g005
Figure 6. Proposed model of transcriptional regulation of the geraniol metabolic pathway in R. chinensis. Each row of the heatmap from left to right represents Log2 (Fold-change) in different developmental stages (FB_CP vs. FB_GP, FB_PP vs. FB_CP, and OF_PP vs. FB_PP) and different samples (OB vs. OBL). The color of each box indicates downregulation (blue) or upregulation (red). Bold margins identify significant differences (p ≤ 0.05) between treatments. MVPP, mevalonate-5-pyrophosphate; HMBPP, (E)-4-hydroxy-3-methyl-but-2-enyl pyrophosphate; HMG–CoA, 3-hydroxy-3-methylglutaryl-CoA; NUDX, nudix hydrolase; TPS, terpene synthase; G8H, geraniol 8-hydroxylase. Transcript levels for each gene are reported in Table S7.
Ijms 23 14684 g006
Publisher’s Note: MDPI stays neutral with regard to jurisdictional claims in published maps and institutional affiliations.

