Article

Study on the Flower Induction Mechanism of Hydrangea macrophylla

1
Beijing Key Laboratory of Ornamental Plants Germplasm Innovation & Molecular Breeding, China National Engineering Research Center for Floriculture, College of Landscape Architecture, Beijing Forestry University, Beijing 100083, China
2
Beijing Flower Engineering Technology Research Center, Plant Institute, China National Botanical Garden North Park, Beijing 100093, China
*
Author to whom correspondence should be addressed.
These authors contributed equally to this work.
Int. J. Mol. Sci. 2023, 24(9), 7691; https://doi.org/10.3390/ijms24097691
Submission received: 2 March 2023 / Revised: 15 April 2023 / Accepted: 20 April 2023 / Published: 22 April 2023
(This article belongs to the Special Issue Transcriptional Regulatory Networks in Flowers)

Abstract

:
The flower induction of Hydrangea macrophylla “Endless Summer” is regulated by a complex gene network that involves multiple signaling pathways to ensure continuous flowering throughout the growing season, but the molecular determinants of flower induction are not yet clear. In this study, genes potentially involved in signaling pathway mediating the regulatory mechanism of flower induction were identified through the transcriptomic profiles, and a hypothetical model for this regulatory mechanism was obtained by an analysis of the available transcriptomic data, suggesting that sugar-, hormone-, and flowering-related genes participated in the flower induction process of H. macrophylla “Endless Summer”. The expression profiles of the genes involved in the biosynthesis and metabolism of sugar showed that the beta-amylase gene BAM1 displayed a high expression level at the BS2 stage and implied the hydrolysis of starch. It may be a signaling molecule that promotes the transition from vegetative growth to reproductive growth in H. macrophylla “Endless Summer”. Complex hormone regulatory networks involved in abscisic acid (ABA), auxin (IAA), zeatin nucleoside (ZR), and gibberellin (GA) also induced flower formation in H. macrophylla. ABA participated in flower induction by regulating flowering genes. The high content of IAA and the high expression level of the auxin influx carrier gene LAX5 at the BS2 stage suggested that the flow of auxin between sources and sinks in H. macrophylla is involved in the regulation of floral induction as a signal. In addition, flowering-related genes were mainly involved in the photoperiodic pathway, the aging pathway, and the gibberellin pathway. As a result, multiple pathways, including the photoperiodic pathway, the aging pathway, and the gibberellin pathway, which were mainly mediated by crosstalk between sugar and hormone signals, regulated the molecular network involved in flower induction in H. macrophylla “Endless Summer”.

1. Introduction

In higher plants, the transition from the vegetative to reproductive stage occurs during flower induction. Morphogenesis is a complex process that is affected by genes, the developmental stage, physiological signals and external conditions [1]. In Arabidopsis, flowering is regulated by multiple pathways, such as the photoperiodic pathway, the vernalization pathway, the ambient temperature pathway, the gibberellin pathway, the autonomous pathway, and the aging pathway [2]. It has been reported that hormones and sugar induce flower formation processes [3]. Flowering is a very important trait in ornamental plants which determines their ornamental value. However, the regulatory mechanism of flower induction in H. macrophylla “Endless Summer” is still unclear. Studies have shown that flowering and development in plants are relatively genetically conserved. This study explored the molecular mechanism of flower induction in H. macrophylla “Endless Summer”, which is significant for understanding the flowering mechanism of woody plants, with the model plant Arabidopsis thaliana as a reference.
In the photoperiodic pathway, leaves respond to changes in day length through specific photoreceptors and the central oscillator [4]. The central oscillator is composed of a negative feedback loop, including CCA1, TOC1, LHY, ELF4, PRR9, and LUX [5]. Different oscillatory rhythms are generated, based on changes in the external photoperiod. The circadian expression of the output genes GI and CO converts the photoperiod signal into a flowering signal, ultimately inducing flowering in plants [6,7]. In the gibberellin pathway, GA signals can inhibit the expression of SVP genes, thereby relieving the inhibition of FT genes in the photoperiodic pathway [8]. On the other hand, GA promotes flowering by stimulating the transcription and expression of the floral tissue-determining gene LFY [9]. The aging pathway mainly relies on miR156 and miR172 to negatively regulate their target transcription factor genes and play a role in the transition from vegetative growth to reproductive growth [10]. The target genes of miR156 are members of the SPL gene family, which mainly exist as flowering promoting factors and can promote the expression of flowering integrators [11,12]. The target genes for miR172 are members of the AP2 transcription factor family, which are inhibitory factors of flowering that can delay flowering [13]. Moreover, studies have shown that the aging pathway can induce flower bud differentiation independently of other flower induction pathways [14]. Flowering signals from various pathways are integrated into the flowering integrators FT, LFY, and SOC1, affecting the expression of the MADS-box transcription factor genes AP1 and FUL, thereby regulating floral transformation and floral organ development [15].
Under specific circumstances, the control of hormone signals is frequently accomplished by alterations in the expression level of important flowering genes after the accumulation of various hormone signals. Gibberellin (GA), the primary signaling molecule in the gibberellin pathway, plays a crucial role in the blooming process, and other hormones, including IAA, CTK, and ABA, are also essential components of the hormone control network. To finish the flowering process, genes from several pathways converge on the flowering integron and support the development of floral organs [16].
H. macrophylla “Endless Summer” was used as the experimental material in order to explore the mechanism of the flower induction pathways. Phenotypic observations and determination of the endogenous hormones were implemented, and candidate genes related to flowering were screened using transcriptome sequencing.

2. Results

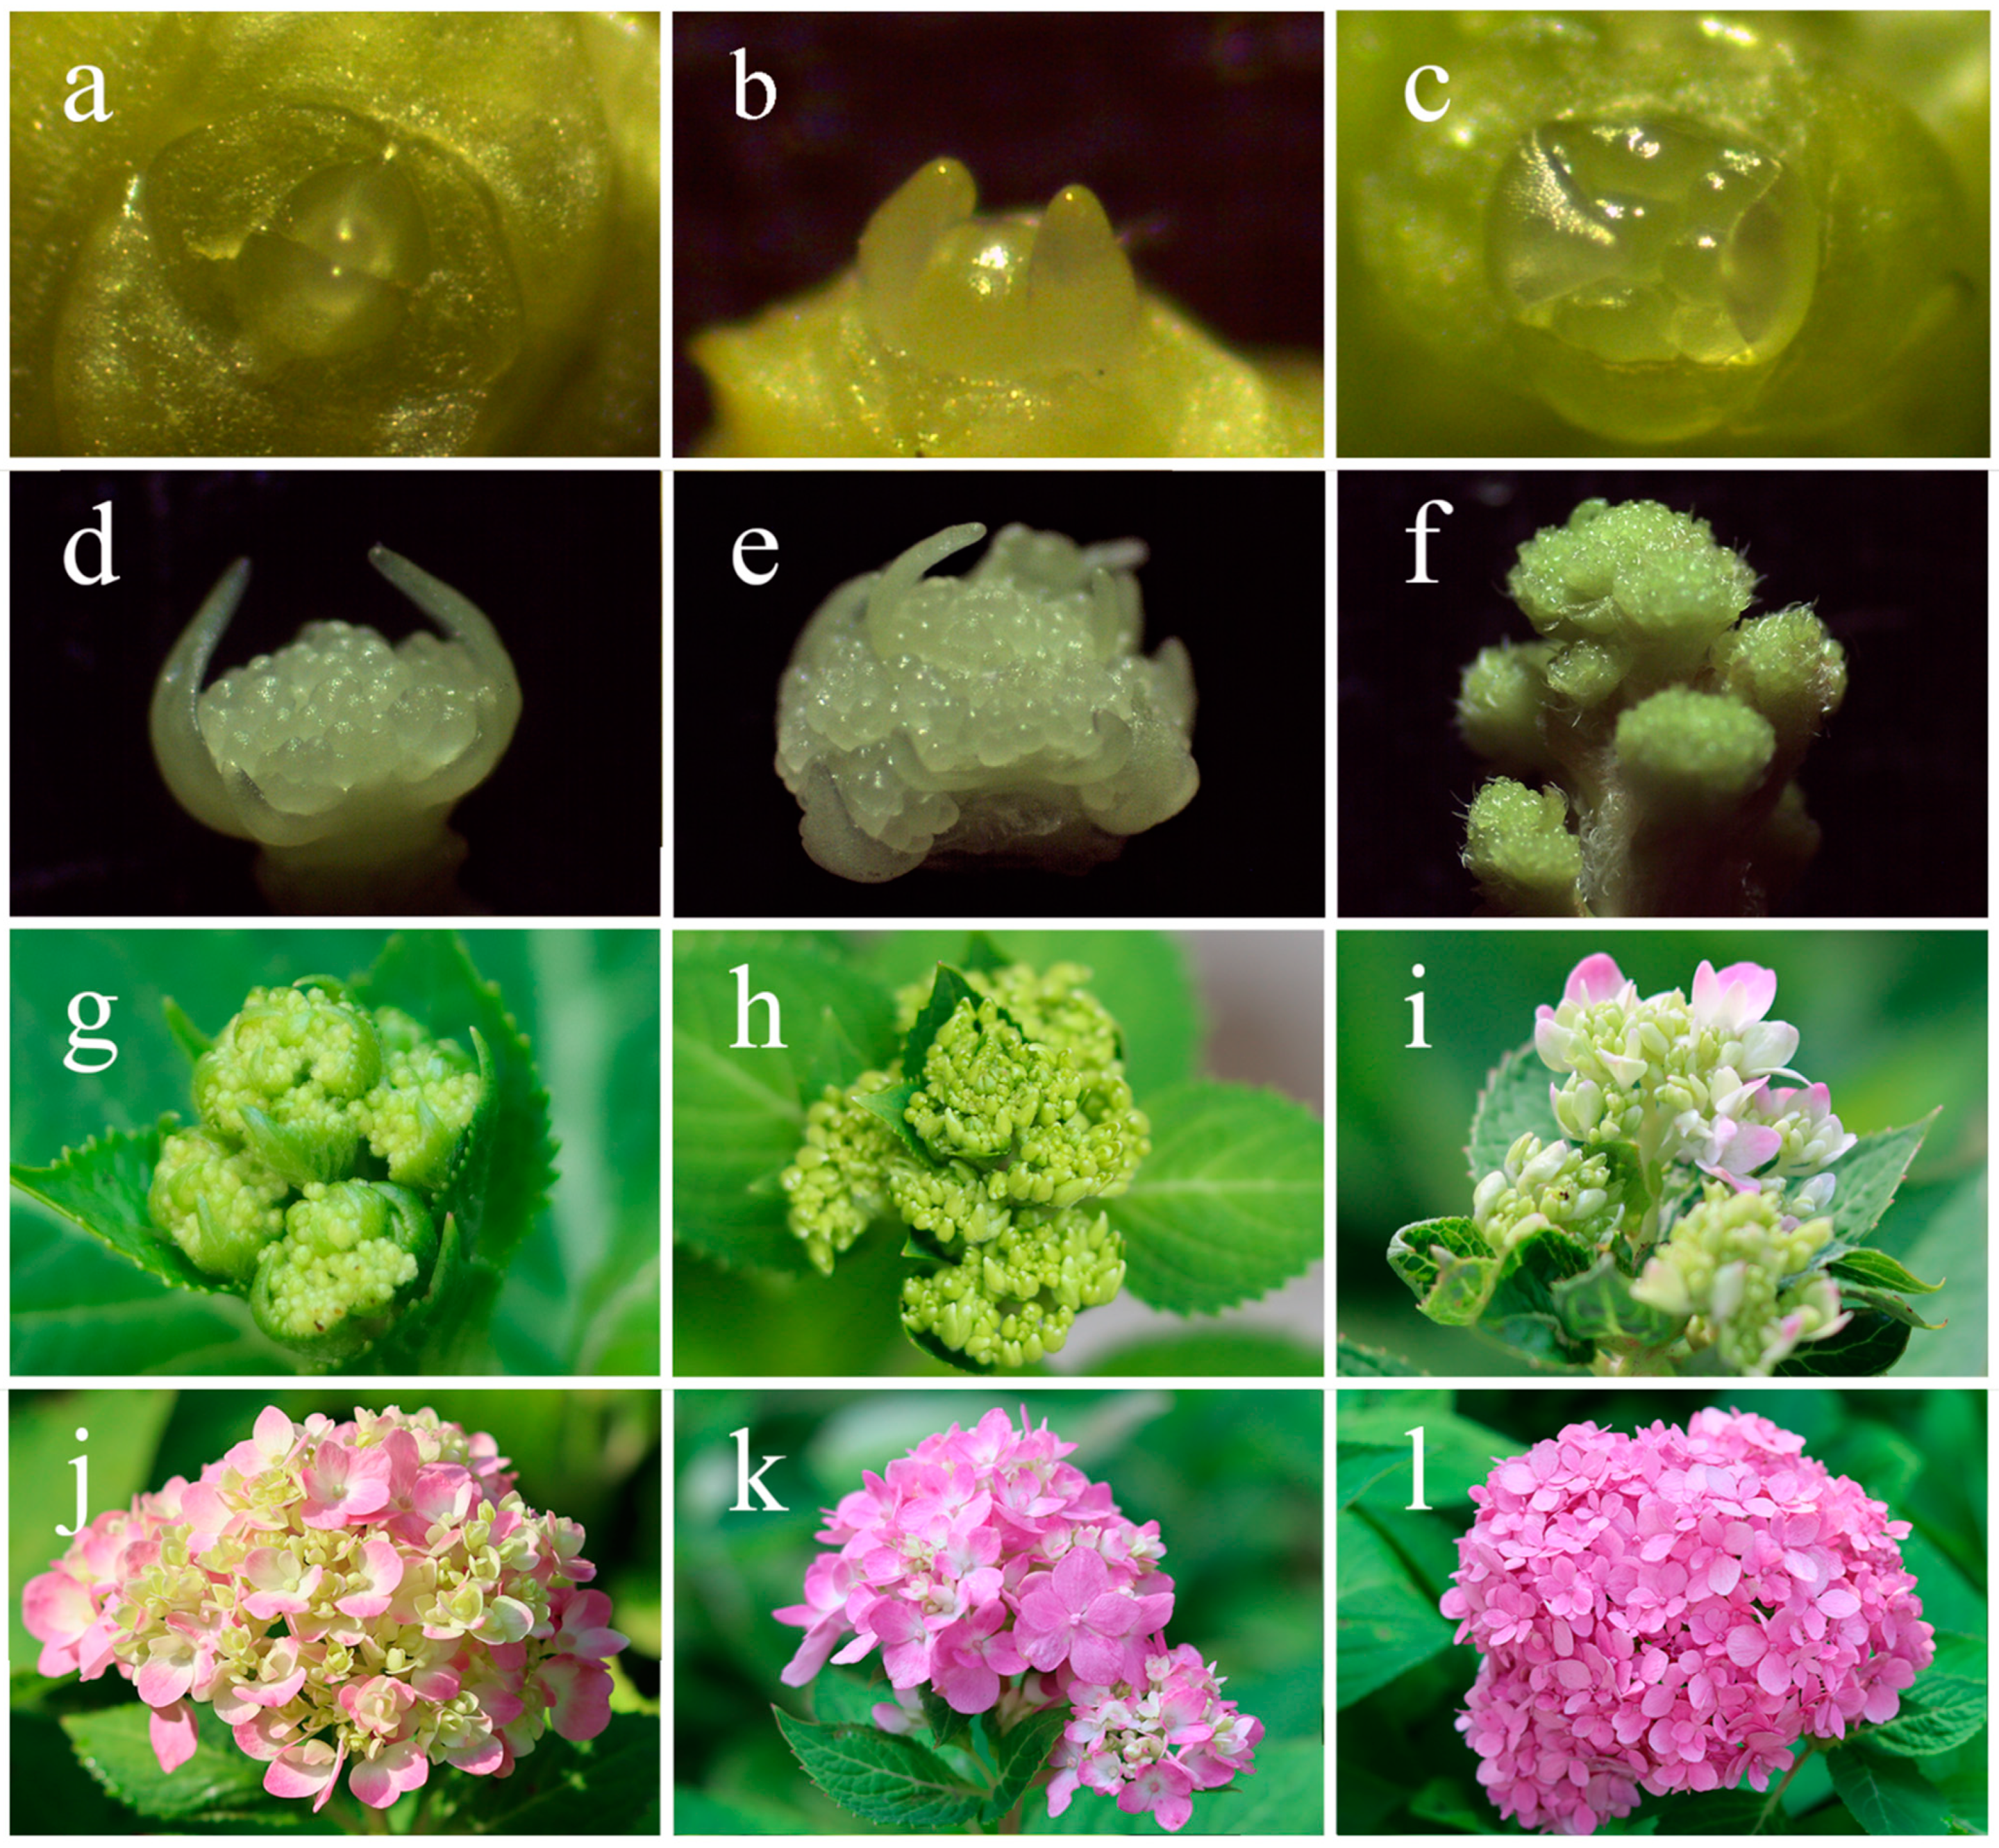
2.1. Phenotypic Observations during Flowering

Due to the cold temperatures in Beijing, the previously formed shoots and buds of H. macrophylla “Endless Summer” were destroyed. Basal shoots sprouted from the plant’s base in the spring once the temperature rose. In this study, which began on 20 March 2021, morphological observations of the shoot apical meristem (SAM) of several differentiation phases of basal shoots were carried out to clarify the flower development process. As seen in Figure 1a, during the vegetative period, the top of the growth point was flat, the outside contour was spindle-shaped, and then the stem tip started to expand, producing a dome in the middle (Figure 1b). Then it moved into the stage of meristem differentiation, going from three meristems (Figure 1c) to five meristems, and to nine meristems. The margin of the growing cone gradually broadened with the expansion of the meristem, and the differentiation of the floral primordium started (Figure 1d). The buds progressively grew larger and transitioned from a spindle form to a spherical shape (Figure 1e). The differentiation period was short, and there was no clear distinction in time between the aforementioned types. Following that, there were primary inflorescence branches (Figure 1f). Flower induction was completed and went into the stage of floral organ development when secondary inflorescence branches formed (Figure 1g). In Figure 1h, a few ornamental flower sepals developed first. As the sepals gradually expanded, the color changed to varying degrees (Figure 1i,j). The non-decorative blooms in Figure 1k were still green, but the sepals of the decorative flowers had fully opened and changed color. Both decorative and non-decorative flowers changed color and had partly unfolded petals at the peak flowering stage, as seen in Figure 1l.

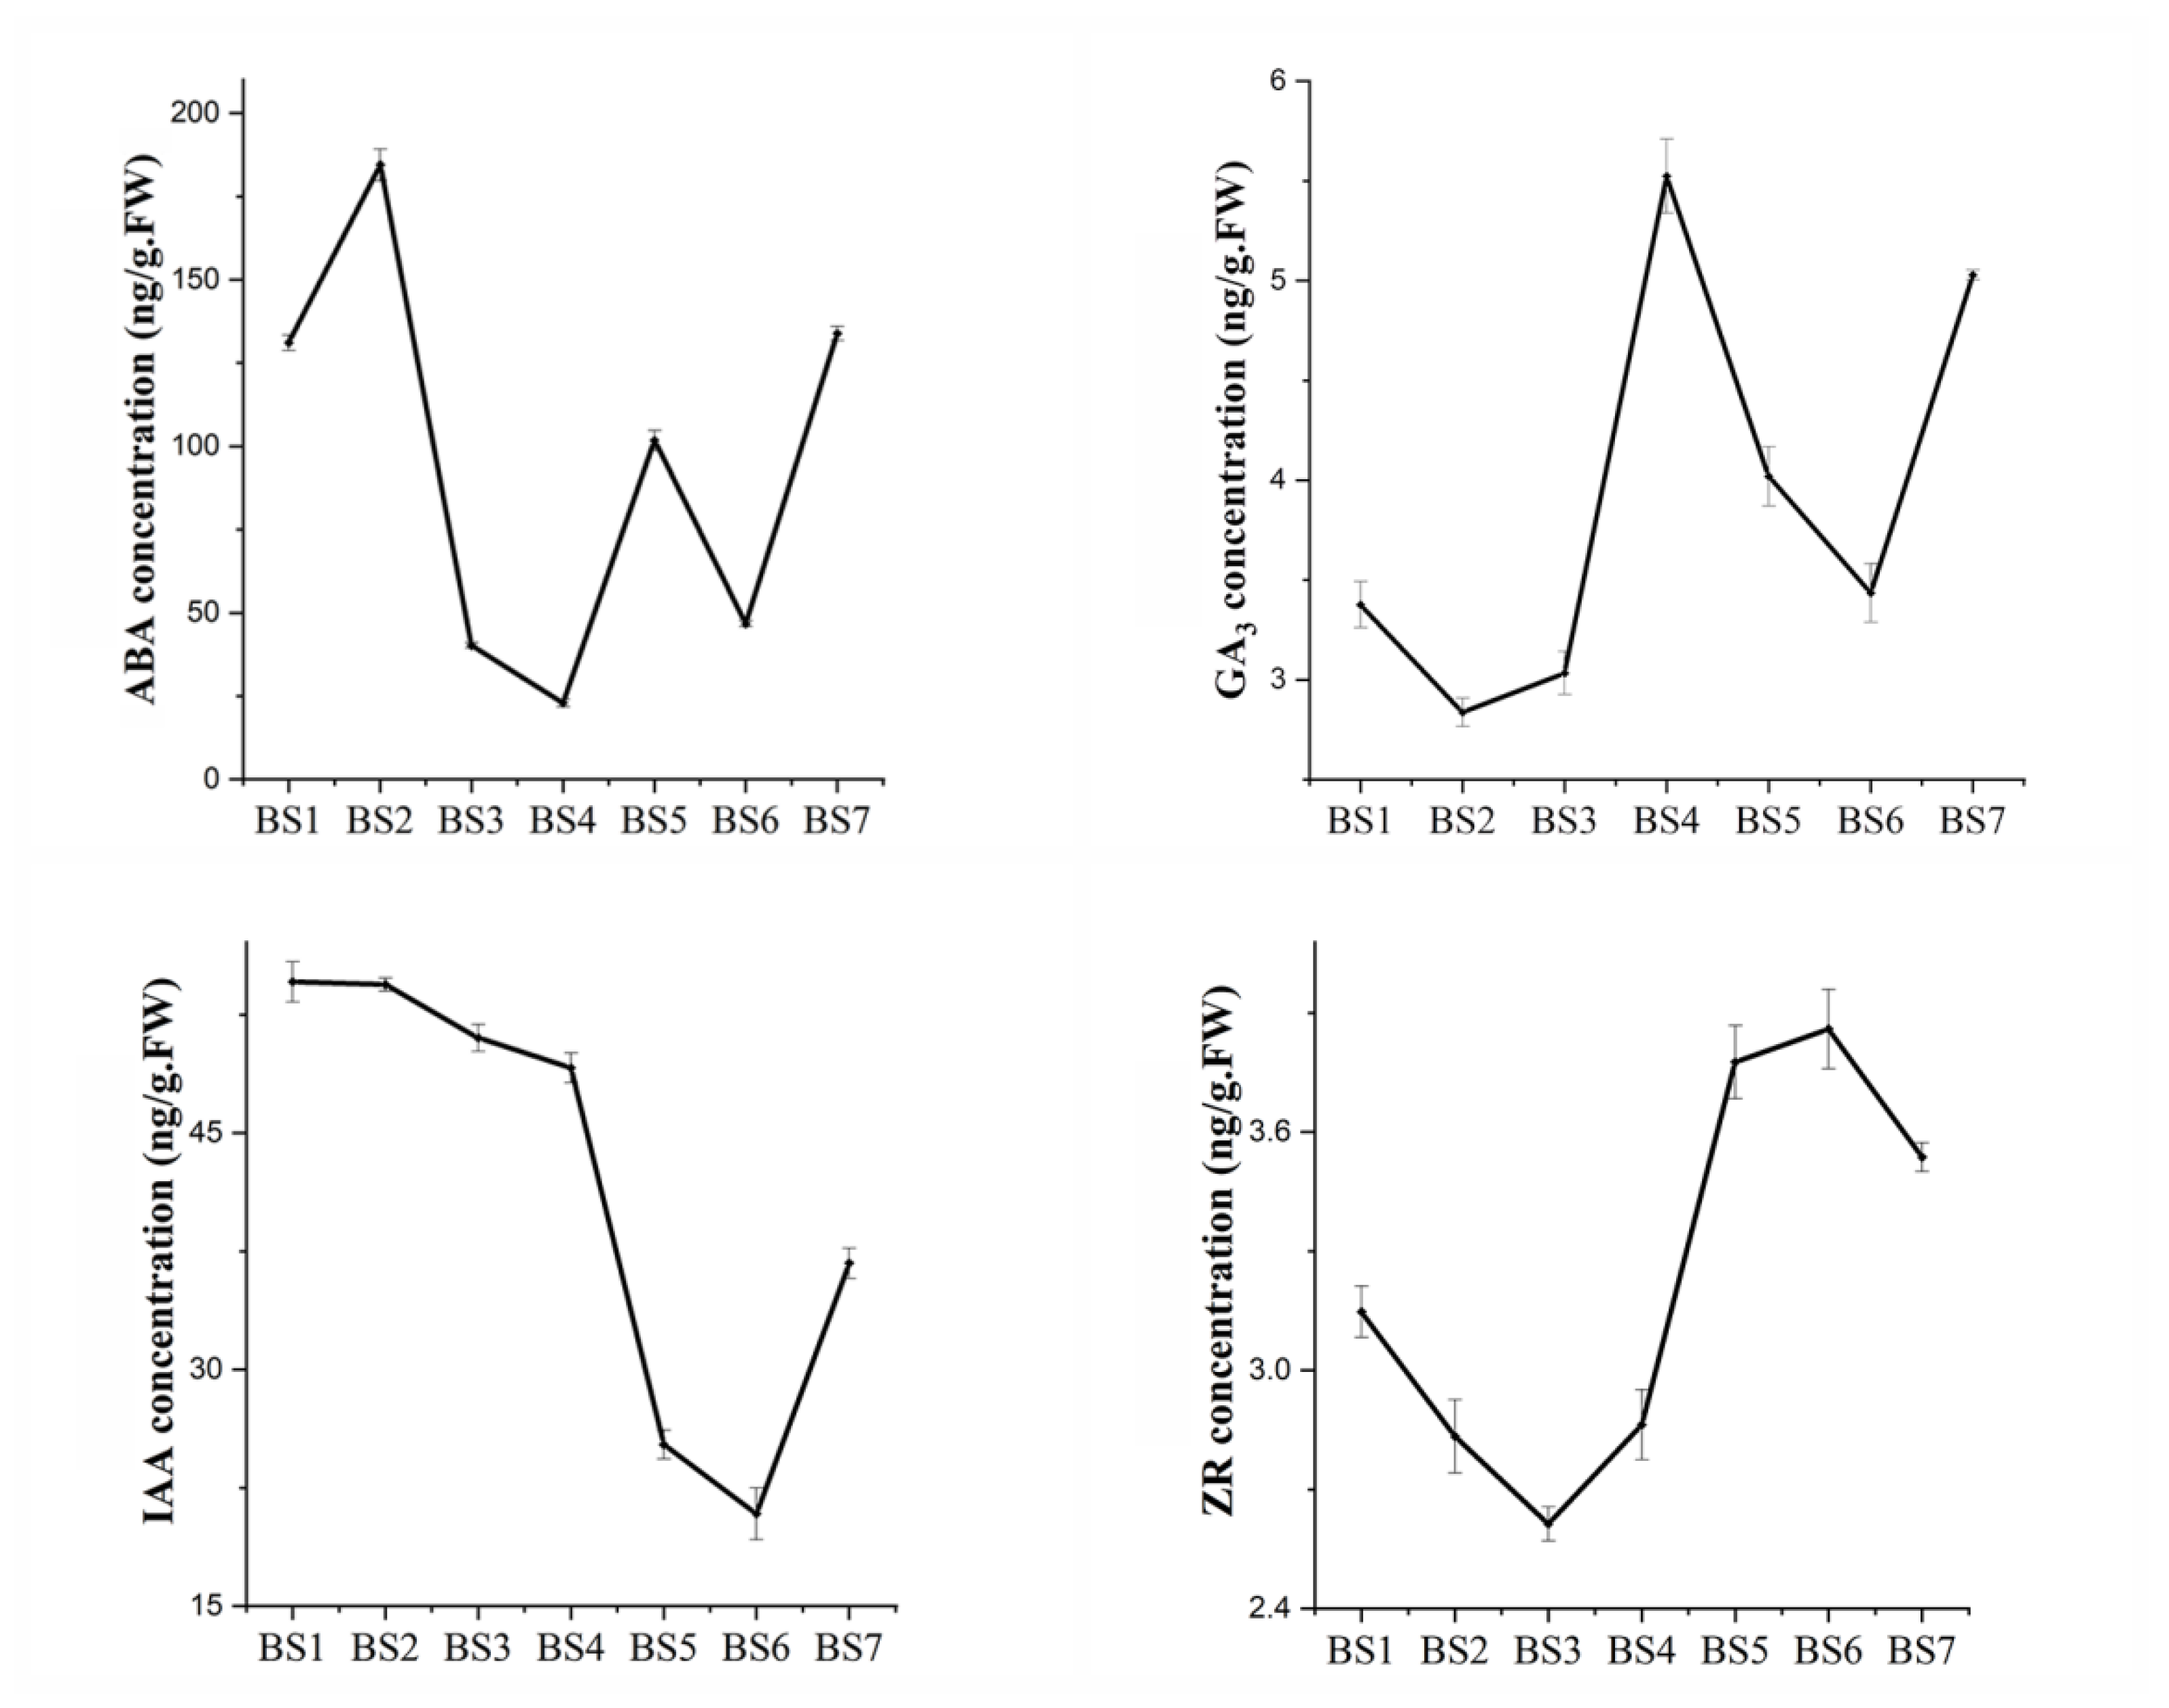
2.2. Endogenous Hormone Response during Flowering

The contents of endogenous hormones such as ABA, IAA, GA3, and ZR in the seven development phases of BS1–BS7 were measured in order to examine the role of endogenous hormones in the flowering process of H. macrophylla “Endless Summer”. The levels of hormone content fluctuated significantly over the whole flowering process, as seen in Figure 2. After achieving the highest level in BS2, the concentration of ABA gradually fell, while BS4 had the lowest content: only 12.4% of the highest level. When the decorative flower sepals started to change color, the ABA content rose; following the complete color change, it subsequently significantly declined. The concentration of ABA present at full bloom was nearly identical to that in vegetative buds. At BS2 and BS3, the concentration of GA3 was lower before rising quickly. The maximum concentration of GA3 was found at BS4, which was 1.9 times higher than BS2’s lowest point. While the sepals of decorative flowers were becoming colored, the content of GA3 continued to drop, but as the flowers began to bloom, it began to rise. ZR was not highly expressed throughout flower induction from BS1 to BS4, and its concentration was lowest at BS3, rising quickly from BS4 to BS5. At the stage of blooming, the concentration of ZR was slightly lower than it had been during the coloring of decorative flowers.

2.3. Quality Assessment of Transcriptome Sequencing

By comparing the transcriptomes of H. macrophylla “Endless Summer” at seven different developmental stages, the cDNA library was created. Among them, BS1 and BS2 represented mixed samples of vegetative and induced buds, respectively, while BS3 through BS7 represented mixed samples of decorative flowers gathered during the growth season. In total, 49.2 G of clean data were produced in this investigation. The effective data volume of each sample was 6.79–7.36 G, the Q30 base distribution ranged from 88.66% to 91.86%, and the average GC content was 45.48% (Table 1). These results showed that the transcriptome sequencing was of a high standard and satisfied the criteria for subsequent data processing.
The statistical analysis of the genes expressed in seven samples yielded a total of 47,793 unigenes. The N50 length was 1785 bp, while the average length was 1177.32 bp (Table 2). This implied that the high assembly integrity of the transcriptome sequencing data satisfied the standards for data analysis.

2.4. Analysis of KEGG Metabolic Pathways and GO Functional Classifications

To understand the specific functions of the unigenes obtained by transcriptome sequencing during the development of H. macrophylla “Endless Summer” and the metabolic pathways the genes are involved in, the unigenes were mapped to the KEGG database. The statistical analysis resulted in a total of 5583 unigenes that were involved in 133 metabolic pathways. DEGs were enriched in carbohydrate metabolism and plant hormone signal transduction pathways (Table 3). The GO enrichment analysis resulted in flower-related GO terms (Table 4), such as flower development (GO:0009908), circadian rhythm (GO:0007623), and pollen development (GO:0009555).

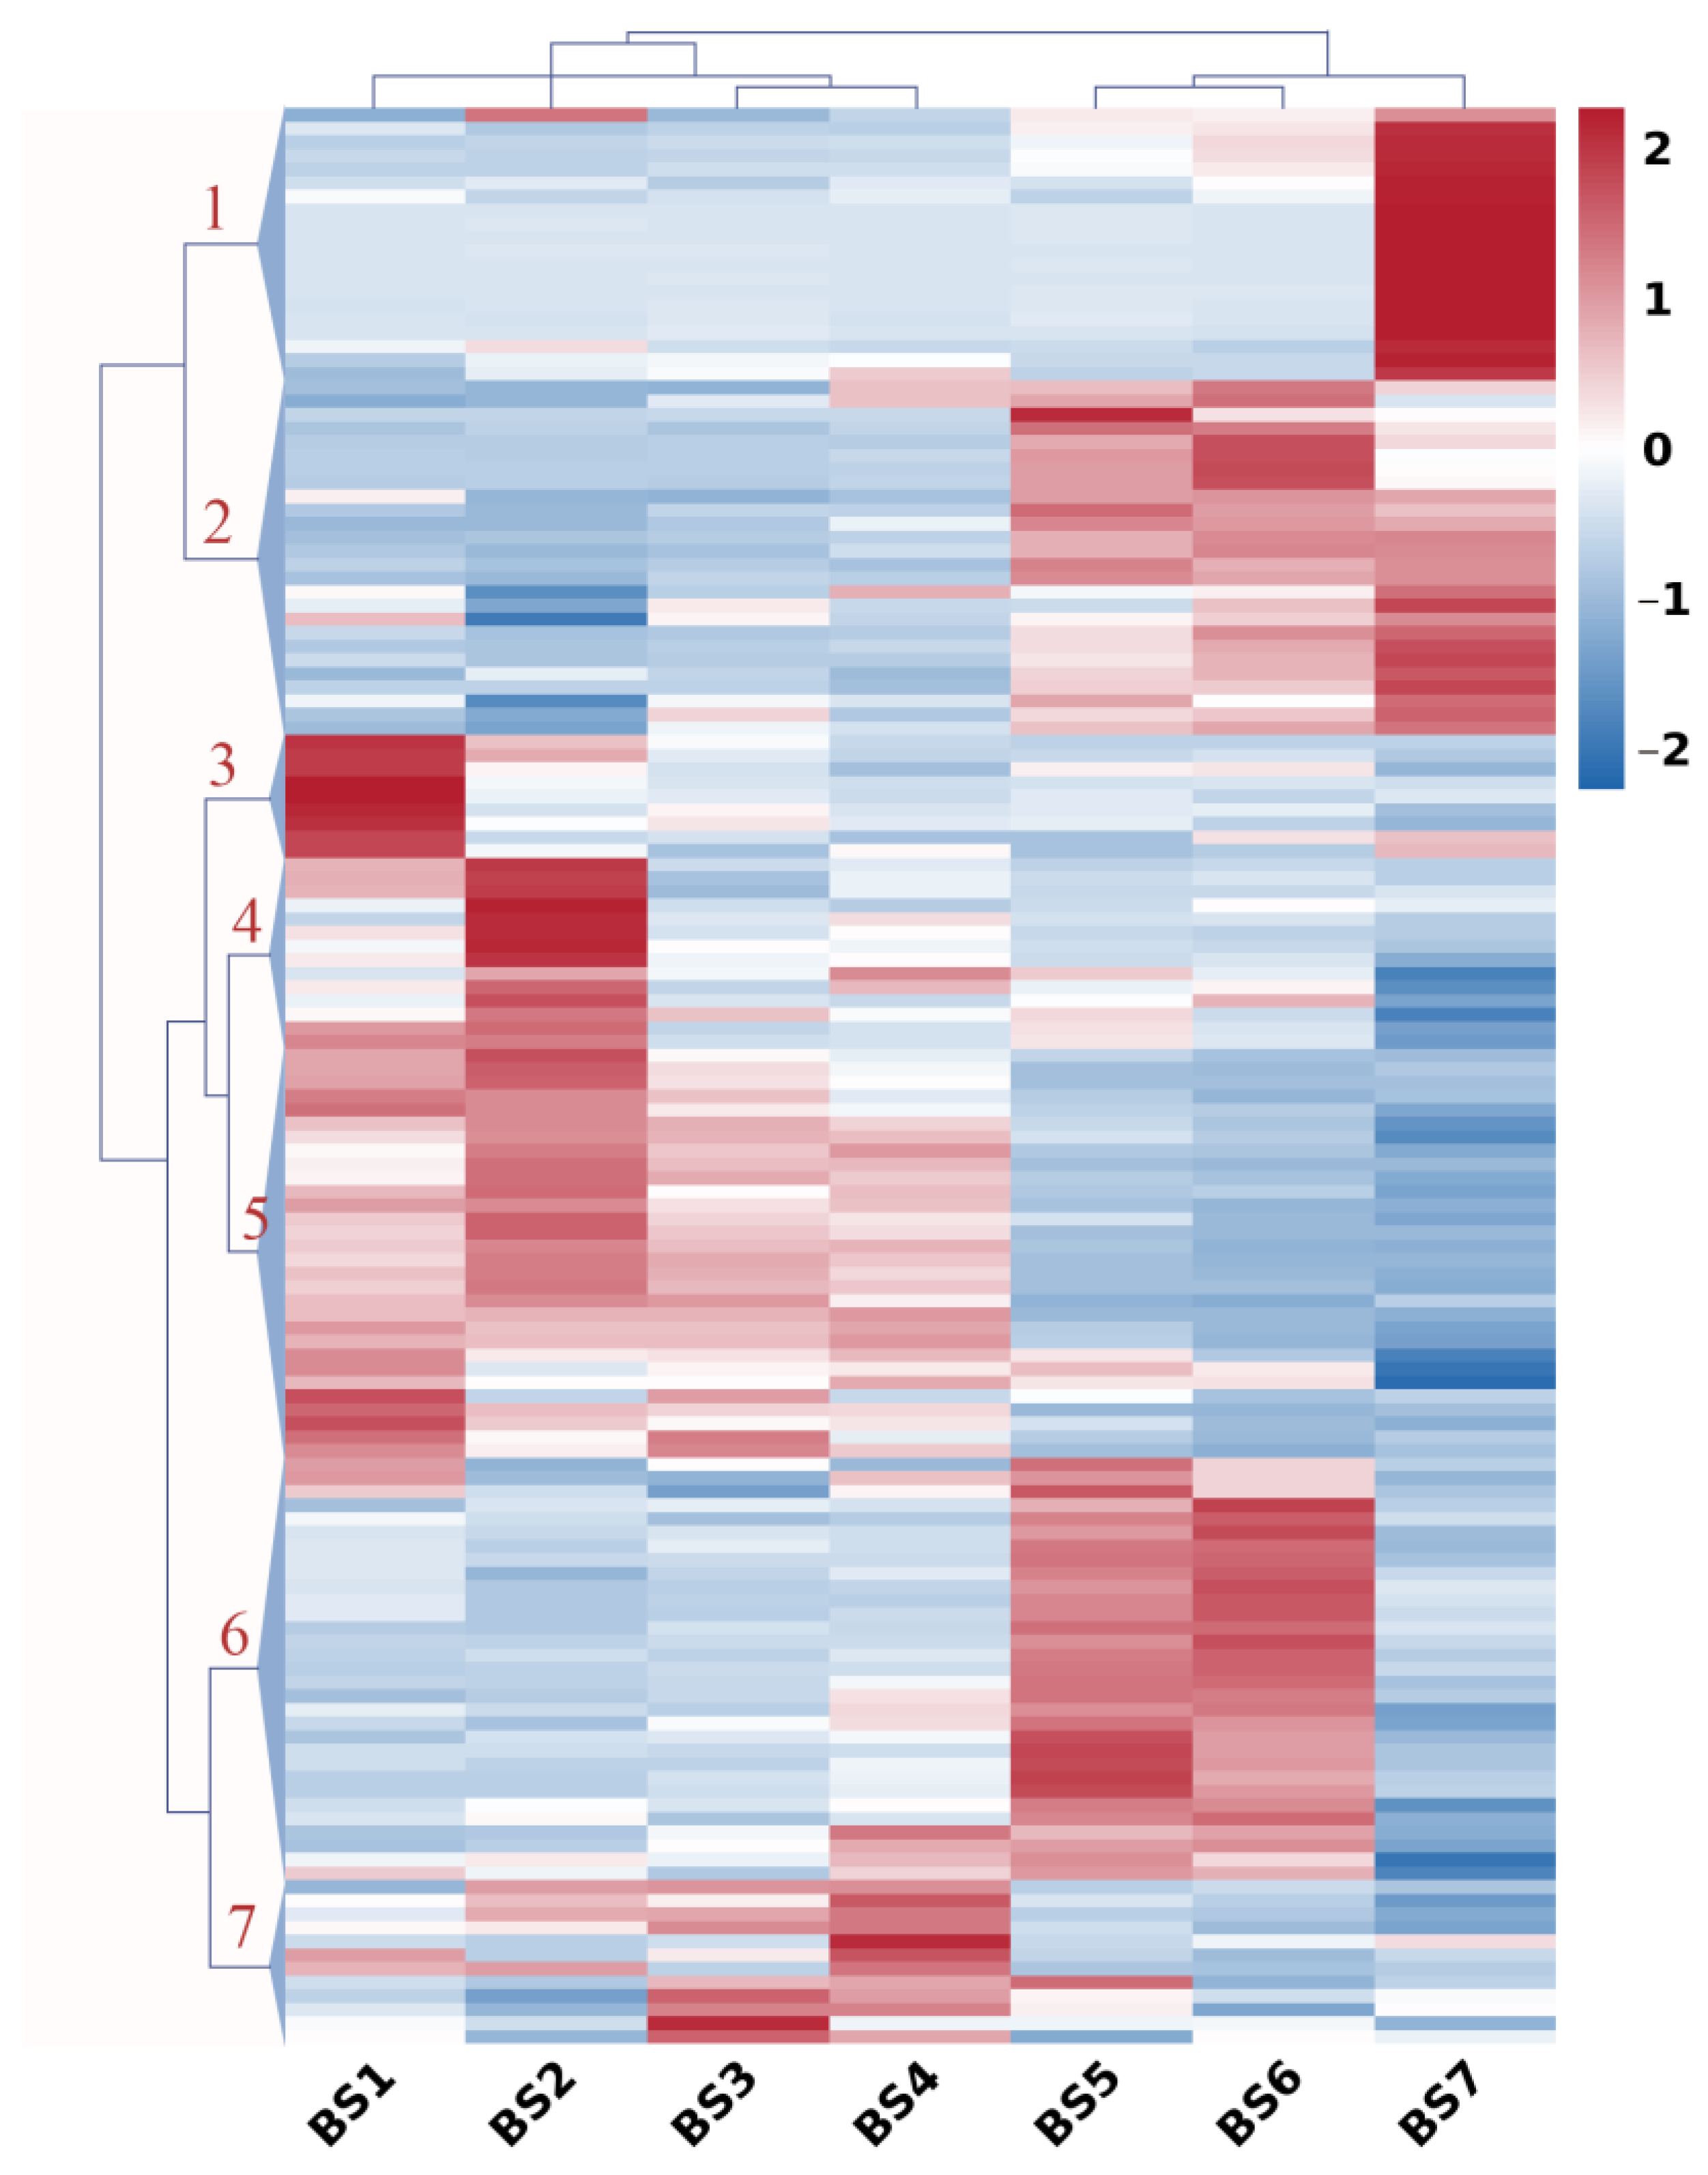
2.5. Expression Profiles of Sugar-Related Genes during Flower Development

Genes representing carbohydrate metabolism and sugar transport during flower development were clustered, as shown in Figure 3. A hierarchical cluster analysis grouped these genes into seven major clusters. Cluster 1 included 20 genes that had increased expression levels from BS6 to BS7 and were mainly related to the interconversion of pentose and glucuronate, as well as sucrose synthase, such as SUS1. Genes in Cluster 2 (26 genes) typically showed low expression in the BS1–BS4 stage and then increased gradually until the BS7 stage. Among them, the pectate lyase 5 and pectinesterase 41 genes were involved in pentose and glucuronate interconversions, and the glyceraldehyde 3-phosphate dehydrogenase gene was involved in glycolysis. In addition, the sugar transporter gene ESL1 and the bidirectional sugar transporter gene SWEET1 also exhibited this expression profile. The expression profiles of nine genes in Cluster 3 typically displayed a sharp decrease between the BS1 and BS2 stages, and then remained constant or slightly declined during the BS2–BS7 stages. These genes were involved in the metabolism of amino sugar and nucleotide sugar, such as CHI5 and CHLY, and the metabolism of starch and sucrose, such as AMYB. The expression profiles of 14 genes in Cluster 4 typically displayed an increase between the BS1 and BS2 stages, and then declined between the BS2 and BS3 stages and remained constant thereafter. These genes were involved in the metabolism of starch and sucrose, such as beta-amylase 1 (BAM1) and trehalose 6-phosphate phosphatase (TPPJ, TPPA), and in pentose and glucuronate interconversions, the metabolism of glyoxylate and dicarboxylate and so on. Interestingly, the genes in Cluster 5 (31 genes) displayed the completely opposite expression profile compared with the genes in Cluster 2, which showed high expression during BS1–BS4. The genes were involved in the metabolism of starch and sucrose, such as glucose-1-phosphate adenylyltransferase (GLGL2) and endoglucanase 24 (GUN24), and in the metabolism of amino sugars and nucleotide sugars. Genes in Cluster 6 (30 genes) displayed low expression during BS1–BS4, then increased until BS6 and decreased between BS and BS7. Among them, the pectate lyase genes PLY5/8/11/22 and the pectinesterase gene PME were involved in pentose and glucuronate interconversions, as well as GUN6/17, which was involved in the metabolism of starch and sucrose. Cluster 7 included 12 genes that had increased in expression levels between BS3 and BS4 and were involved in multiple processes, such as pentose and glucuronate interconversions, glycolysis and the metabolism of amino sugars and nucleotide sugars, and so on. In general, sugar plays an important role in the entire flower development process.

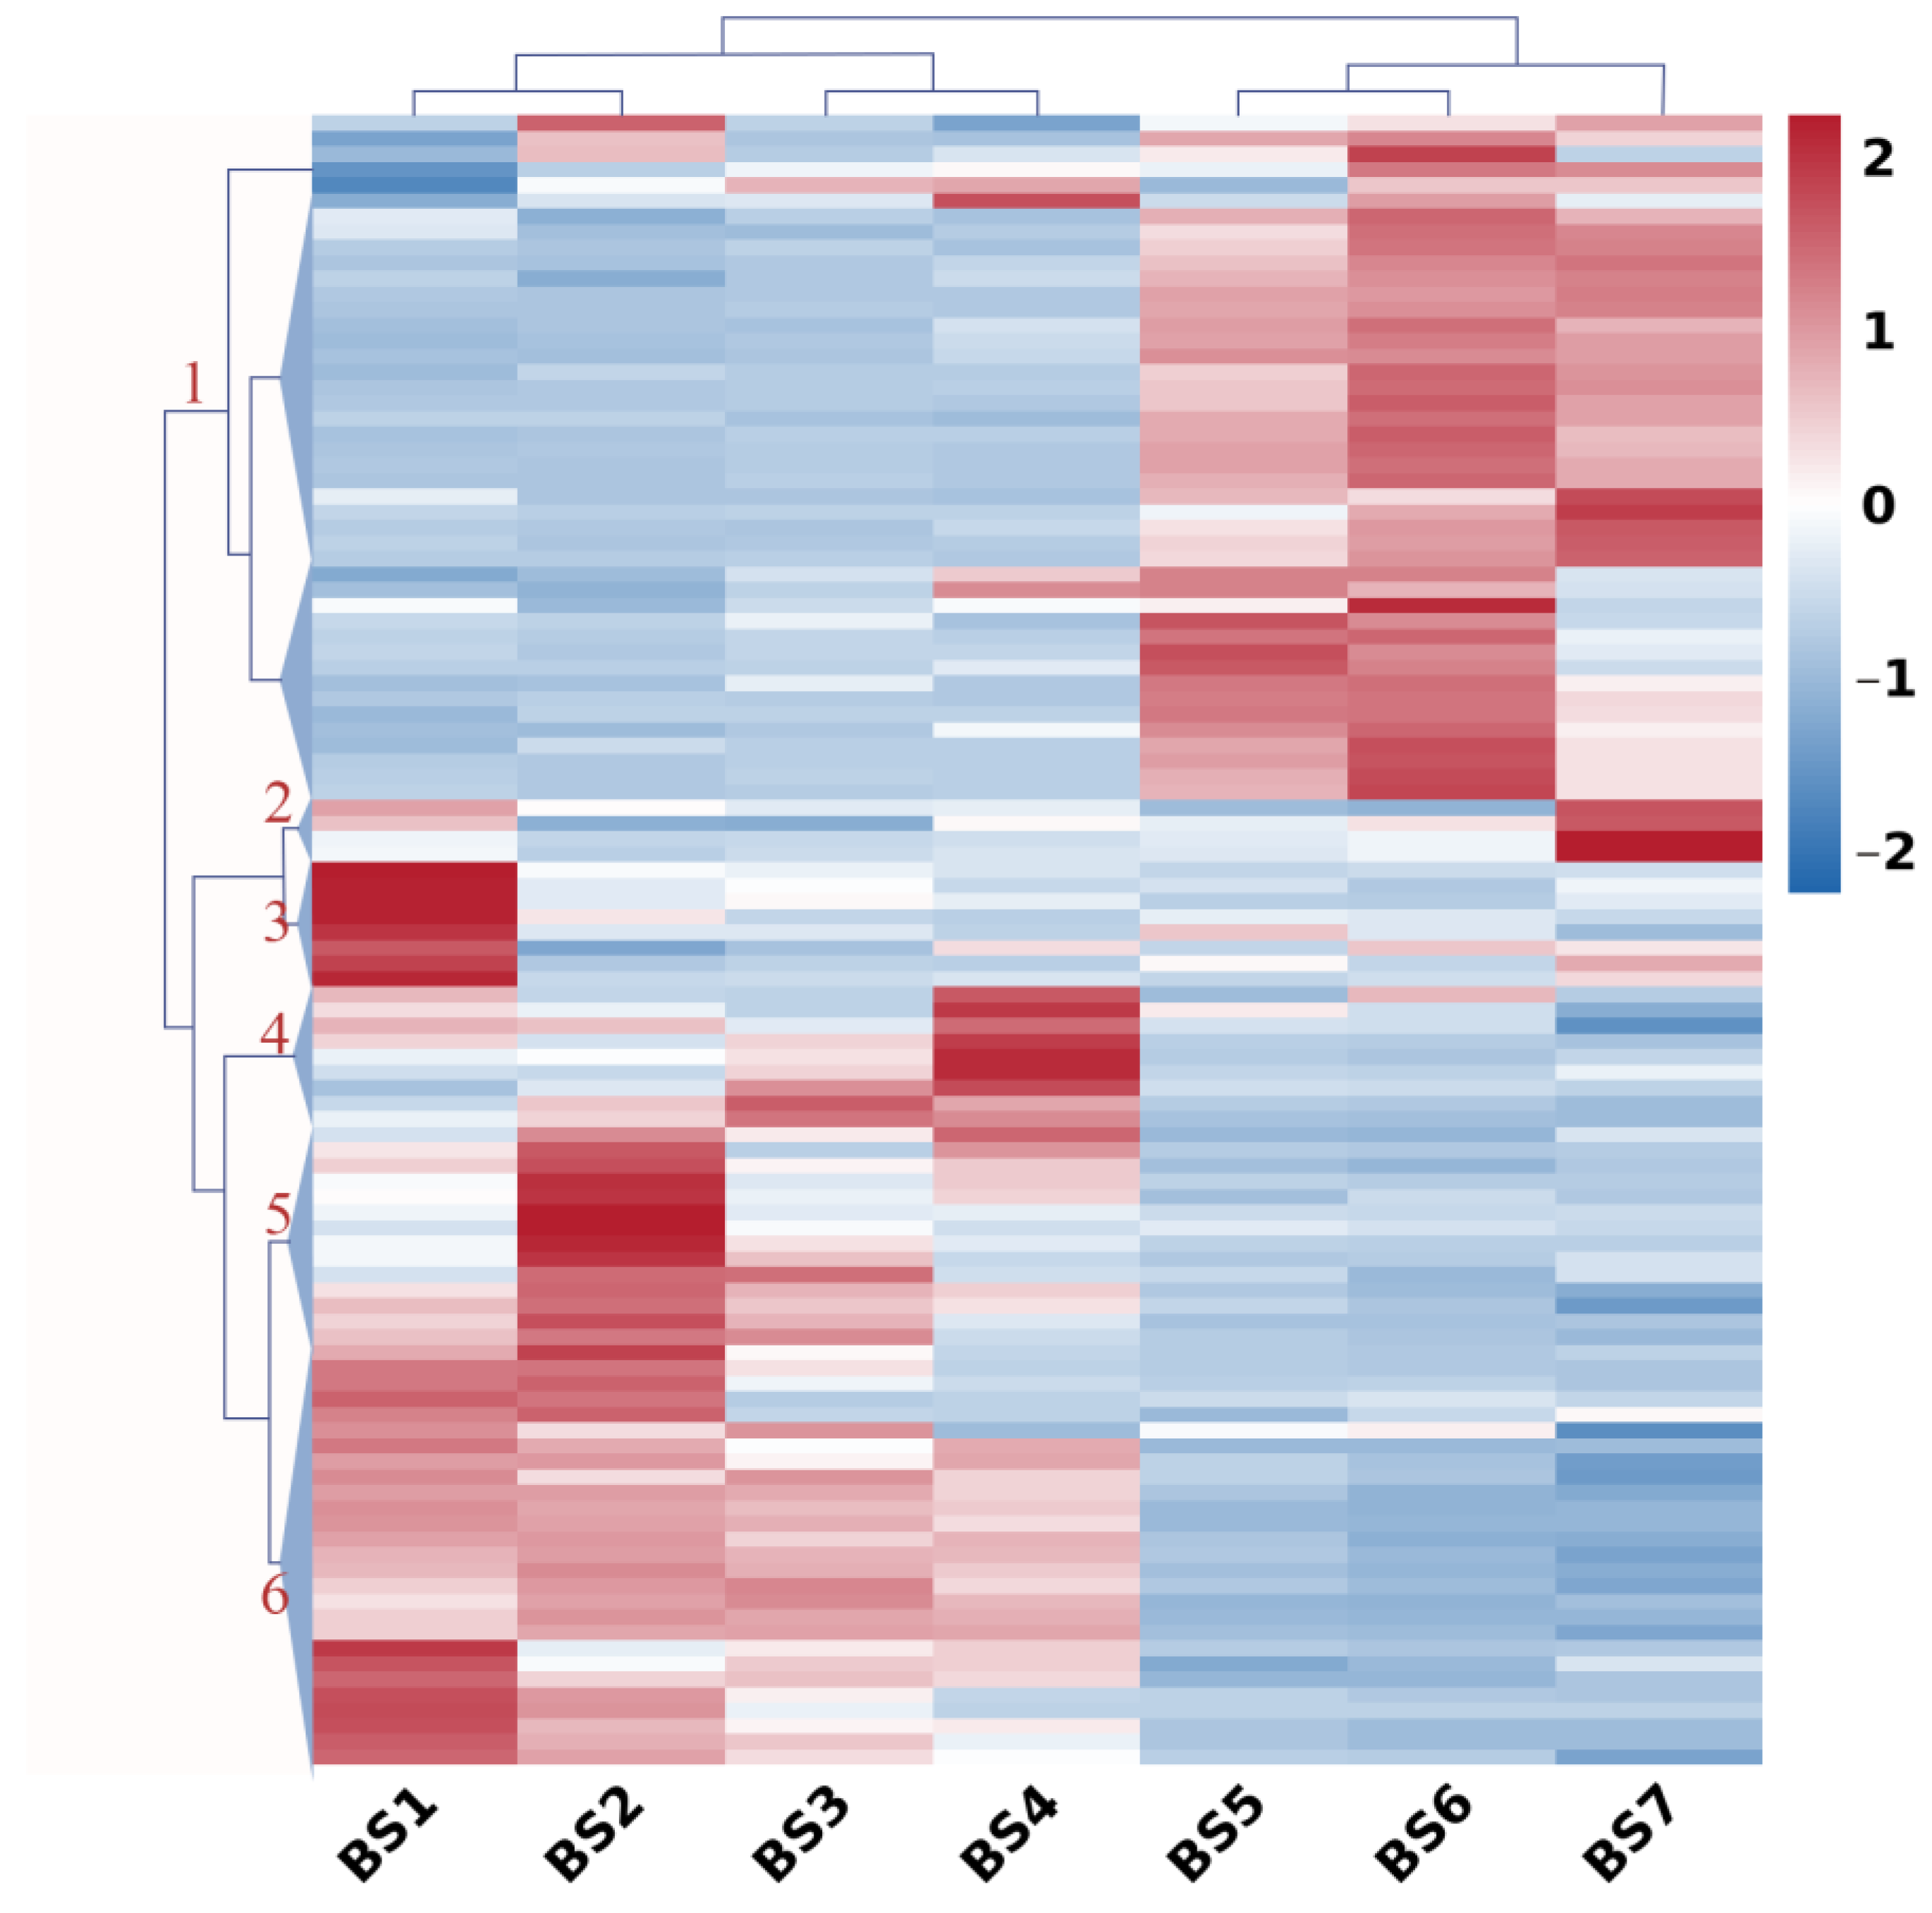
2.6. Expression Profiles of Hormone-Regulatory Genes during Flower Development

Genes encoding plant hormone signal transduction pathways were analyzed and showed a significant change in their expression levels (Figure 4) of at least twofold among the different stages of flower development. Six main gene clusters were determined by hierarchical clustering based on their expression profiles during flower development. Genes in Cluster 1 (44 genes) typically displayed low expression during the BS1–BS4 stages and then increased gradually until the BS7 stage. The genes that respond to auxin, such as SAU20, SAU24, SAU50, and IAA14; auxin transport-related genes, such as LAX2; and auxin-activated signaling pathway genes, such as AX22D, AX10A, and A10A5, belonged to this cluster. In addition, the gene that responds to cytokinin (ARR-A) and the key gene related to ABA synthesis (nine-cis-epoxycarotenoid dioxygenase (NCED)) had the same expression profiles. The auxin-responsive protein genes SAUR36 and SAUR32, and the gibberellin receptor gene GID1B were the members of Cluster 2 (four genes). The cytokinin-activated signaling pathway genes AHP and ARR-A, and the abscisic acid receptor gene PYL belonged to the third cluster (eight genes). The expression profiles of nine genes in Cluster 4 displayed a sharp increase between BS3 and BS4, decreased between BS4 and BS5, and then remained constant during other stages. The genes were mainly the abscisic acid receptor genes PYL3, PYL4, and PYL8, and the indole-3-acetic acid-amido synthetase gene GH3. Genes within Cluster 5 (14 genes) peaked at the BS2 stage and maintained low expression levels during the other stages. Genes associated with auxin-response, such as SAU36 and ARFA; auxin transport, such as LAX5; and the reception of abscisic acid, such as PYL4, appeared in this cluster. In addition, DELLA protein genes and the two-component response regulator gene ORR4 also grouped in this cluster. Interestingly, the genes in Cluster 6 (31 genes) displayed the complete opposite expression profile compared with the genes in Cluster 1, which showed high expression during BS1–BS4. The genes that respond to auxin, such as IAA32 and ARFE, and auxin transport-related genes, such as LAX1, belonged to this cluster. In addition, the abscisic acid receptor gene PYL8 and the gibberellin receptor gene GID1B were present in this cluster.

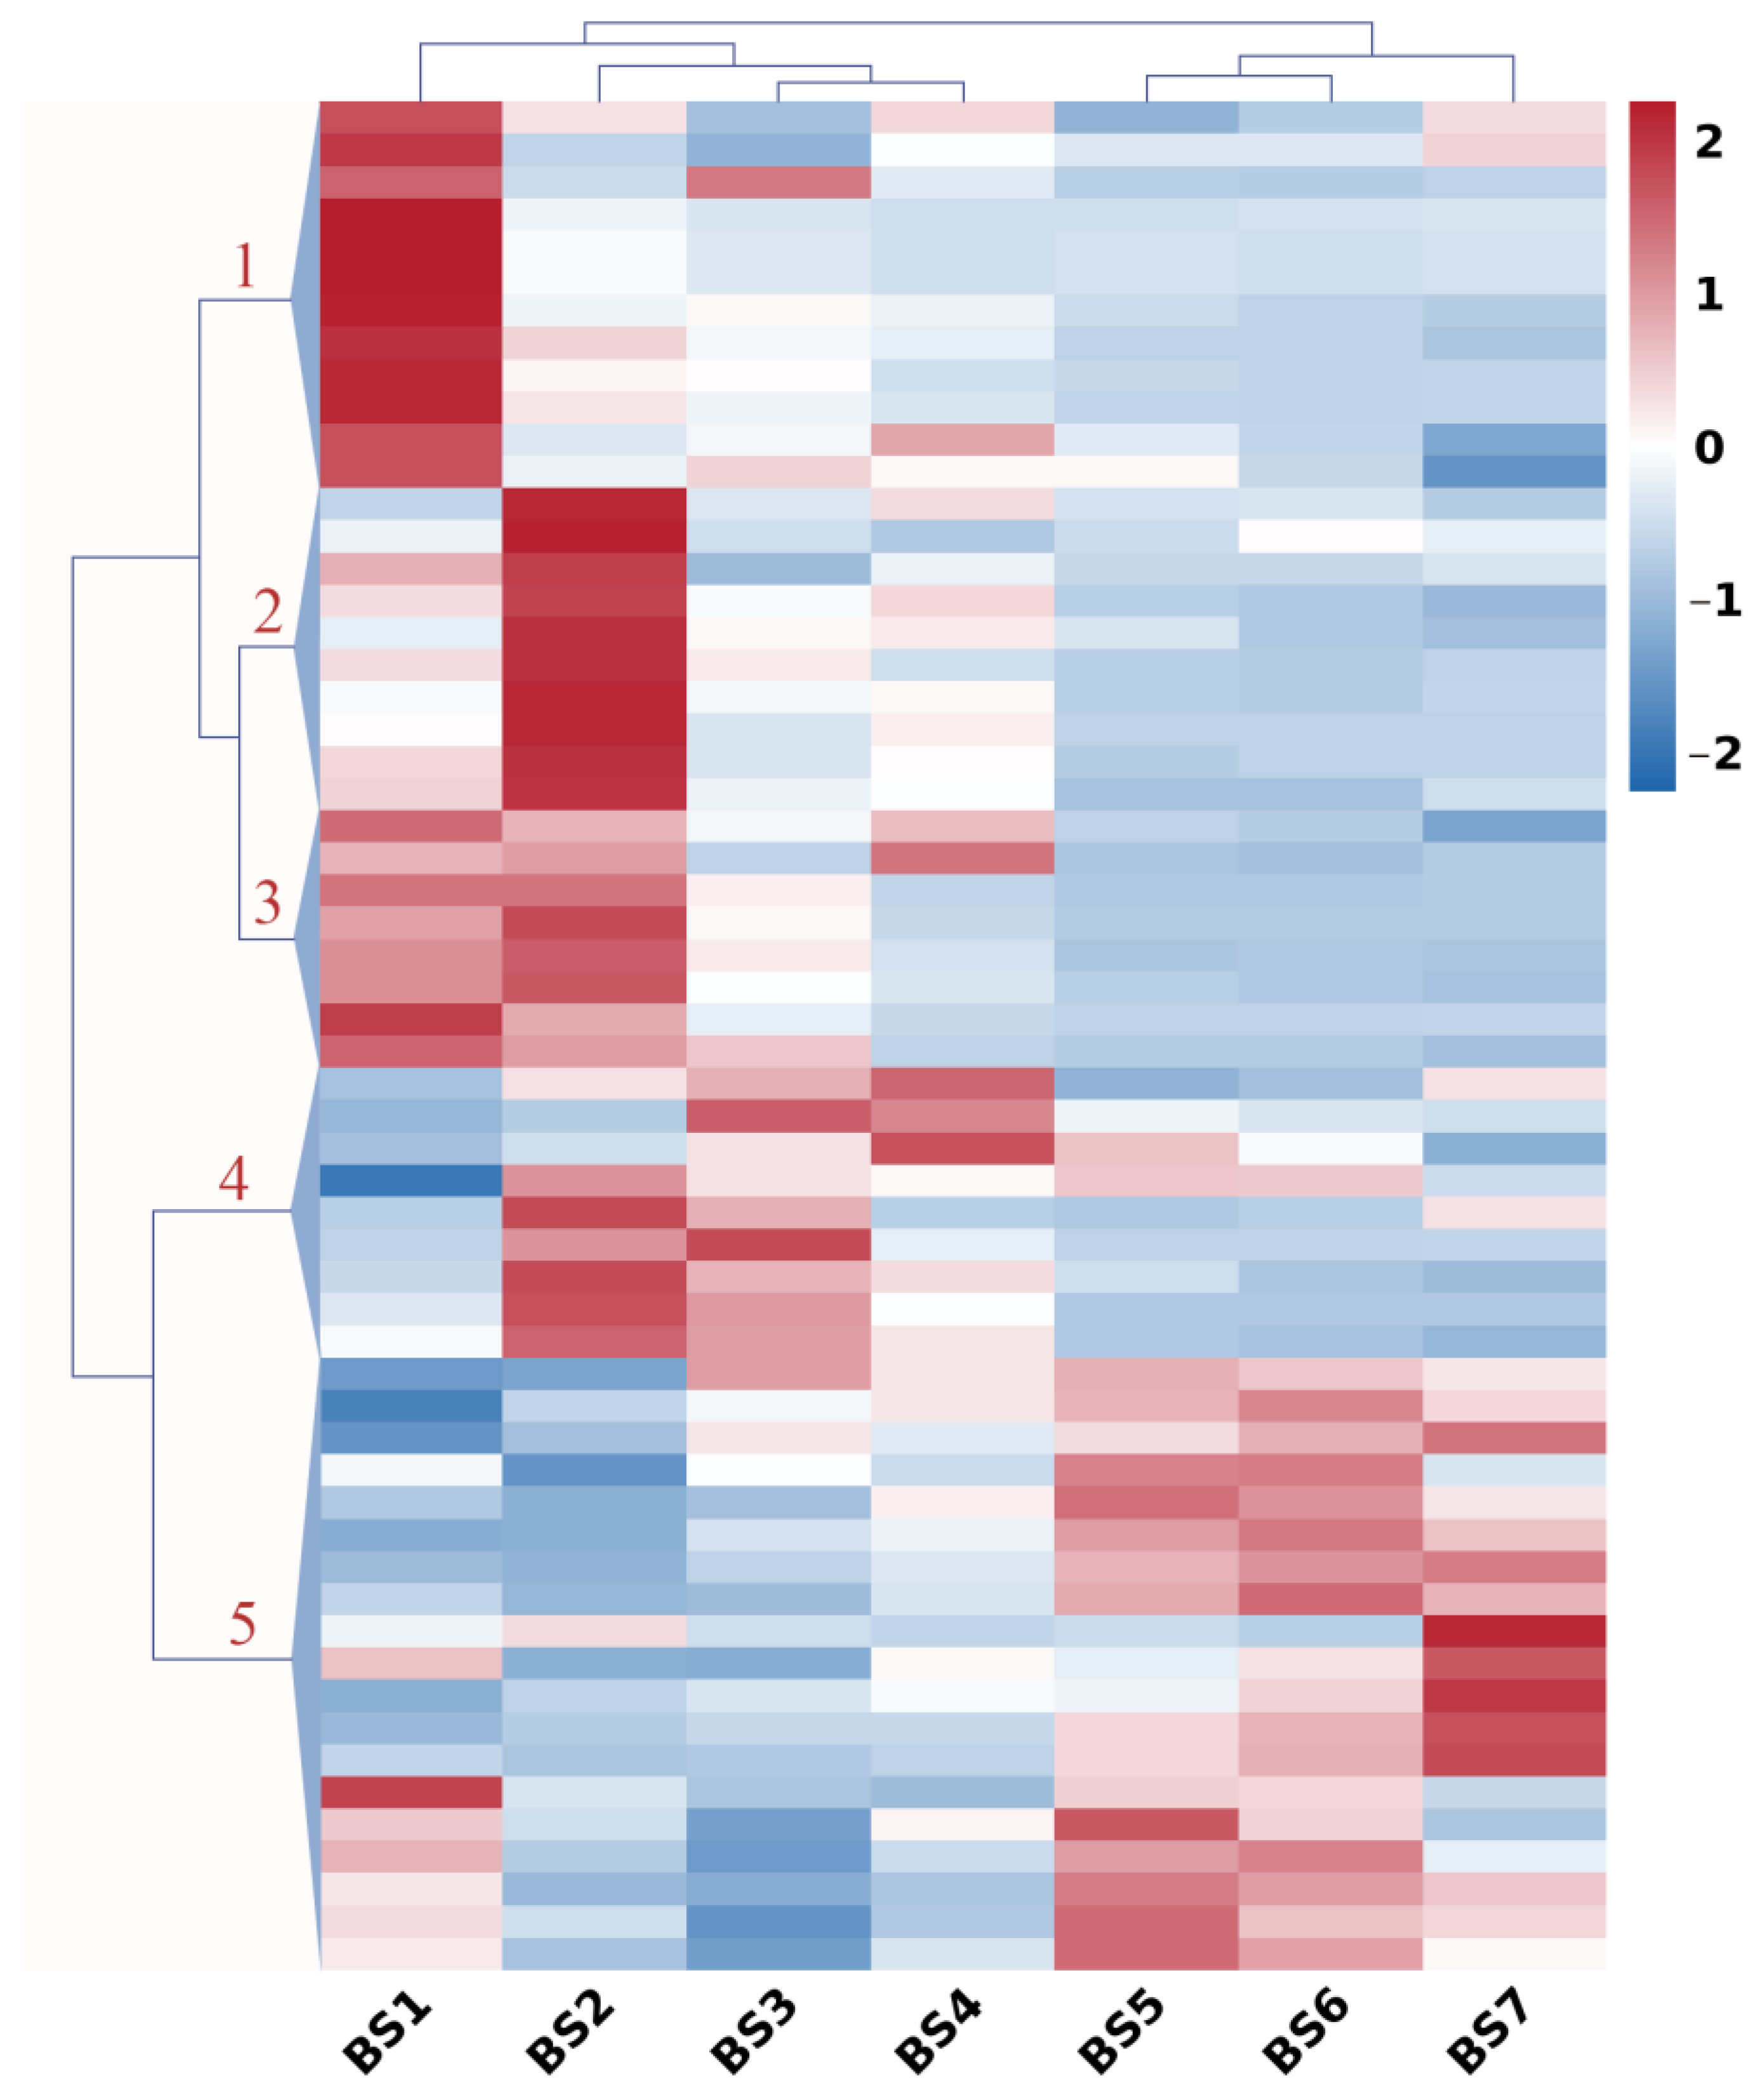
2.7. Expression Profiles of Flowering Genes during Flower Development

The expression profiles of flowering genes during flower development were analyzed by hierarchical clustering, which grouped these genes into five clusters (Figure 5). Cluster 1 included 12 genes that decreased in expression from the BS1 to BS2 stages, then remained constant or slightly decreased during BS2–BS7. Genes associated with the vegetative to reproductive phase transition of the meristem, such as TPS1 and TCP3; axial regulation, such as YAB5; and SPL4 and SPL13 of the squamosa-promoter binding protein-like gene family, displayed this expression profile. MADS-box family members genes, such as AGL24 and SVP; the early flowering gene ELF4; and the phytochrome gene PHYB, which regulates flower development, were grouped in this cluster. Genes within Cluster 2 (10 genes) peaked at the BS2 stage and maintained low expression levels during other stages. These genes were involved in the metabolism of starch and sucrose, such as trehalose 6-phosphate phosphatase (TPPA and TPPJ) and beta-amylase (BAM1). In addition, genes associated with the vegetative to reproductive phase transition of the meristem, such as FLP2, as well as TI10A and PAT1, which are involved in flower development, also displayed in this profile. Genes in Cluster 3 (eight genes) typically displayed high expression levels during the BS1–BS2 stages and then decreased gradually until the BS7 stage. MADS-box transcription factor family protein genes associated with flower development and floral meristem determinacy, such as SVP and SOC1; flower development and regulation genes, such as FD; and SPL7 and SPL17, which are members of the SBP family, exhibited this expression pattern. The genes in Cluster 4 (nine genes) displayed high expression levels during the BS2–BS4 stages and low expression during the other stages. These genes were mainly involved in flower development, such as FLO and UFO, and in floral organ formation, such as AP1, AP2, and FUL. In addition, a circadian rhythm-related gene (PRR5) and a squamosa promoter-binding-like protein gene (SPL3) also exhibited this expression pattern. Cluster 5 included 19 genes, some that increased in expression during the whole process of flower development and some that displayed low expression levels during BS2–BS4 and high expression during BS5–BS7. Genes associated with floral organ development, such as AG, EJ2, and TM6, and with cell differentiation, such as TCP2/4/13 were grouped within this cluster. In addition, circadian rhythm-related genes, such as CRY1, RVE8 and LHY; flower development genes, such as CDF2/3; and the centrally regulated genes of the photoperiod pathway, such as GI and COL9, also exhibited this expression pattern.

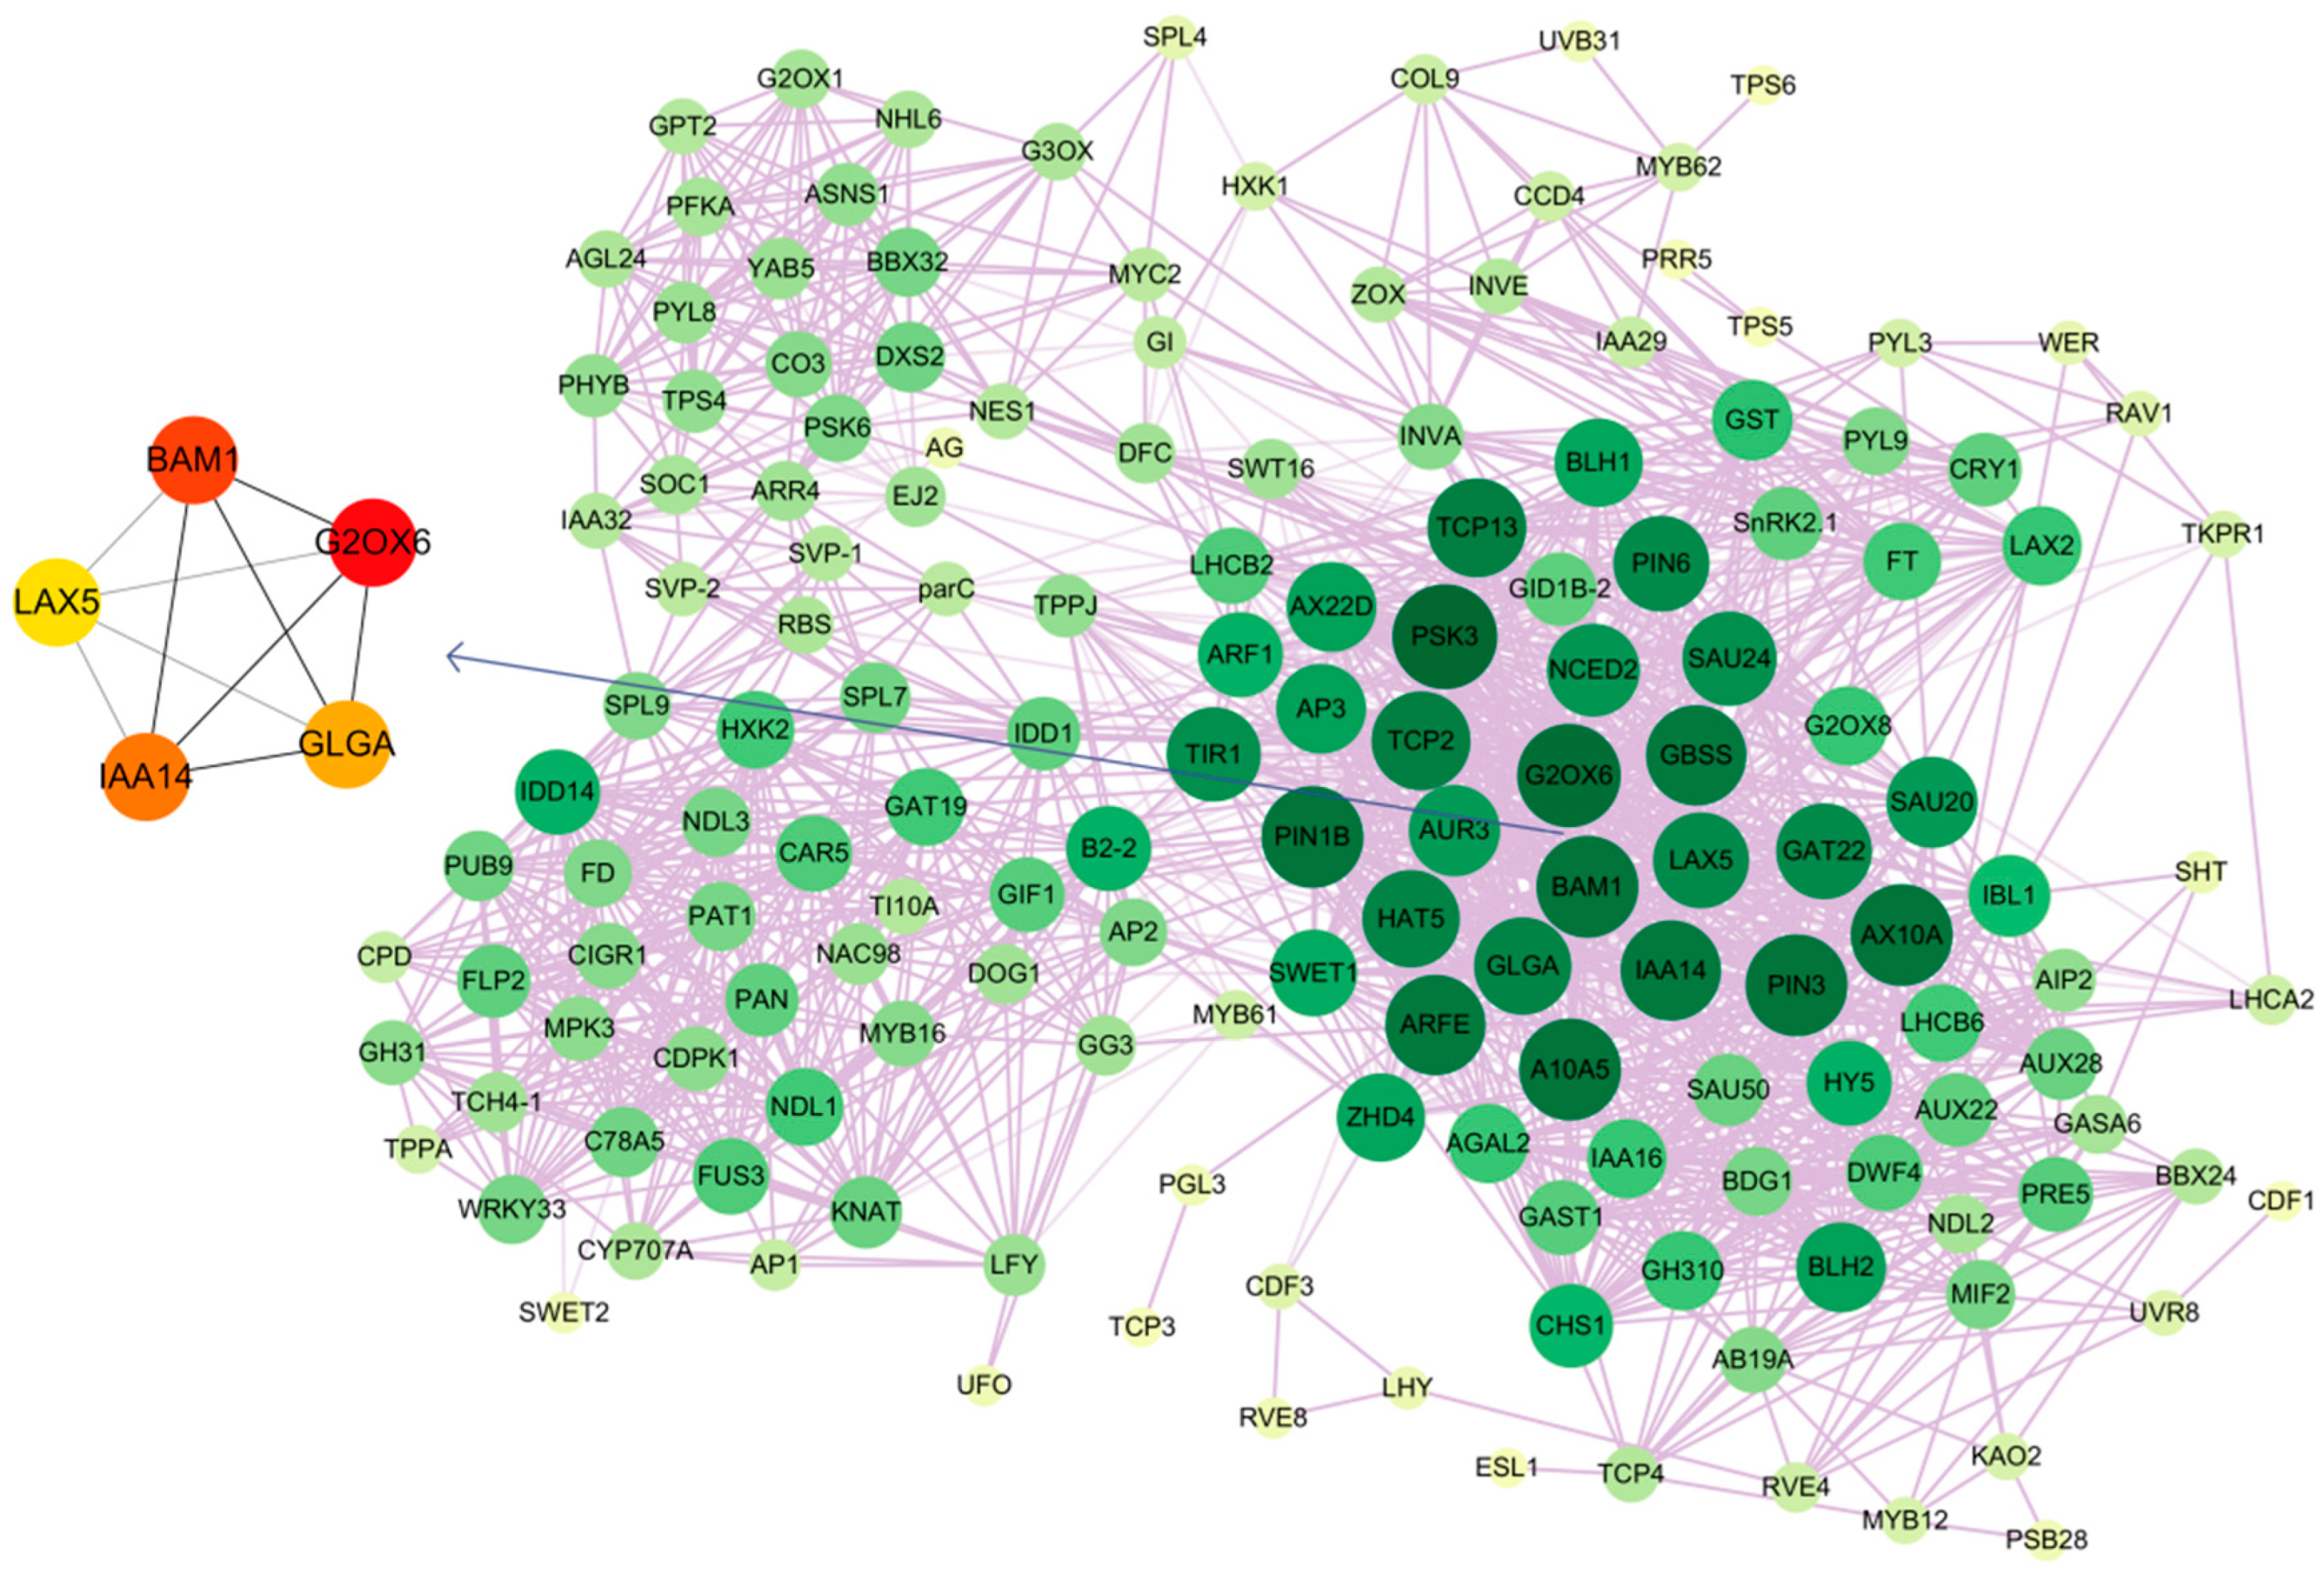
2.8. Co-Expression Pattern Analysis

By performing a correlation analysis of the genes associated with plant hormone signal transduction, synthesis and transport of sugars, and flowering, a co-expression network with 158 nodes and 1586 edges was generated (shown in Figure 6). The edges between the nodes indicated a gene interaction. In contrast to tiny yellow nodes, which indicated that the gene was weakly connected, huge dark green nodes indicated that the gene was strongly connected. The auxin transporter-like protein gene LAX5; the auxin response genes ARFE, SAU24, SAU20, and IAA14; the auxin-inducible protein genes A10A5 and AX10A; the auxin efflux carrier protein genes PIN6, PIN3, and PIN1B; and GBSS, GLGA, and BAM1, which are involved in the metabolism of starch and sucrose, are some of those with strong linkage. Five hub genes were identified using Cytoscape’s Cytohubba plug-in, including BAM1, IAA14, G2OX6, LAX5, and GLGA. The high expression levels of BAM1 and IAA14 in BS2–BS4 suggested that they playean important role in the flower induction, whereas the expression of G2OX6, LAX5, and GLGA in BS5–BS7 indicated that they were involved in the flowering period.

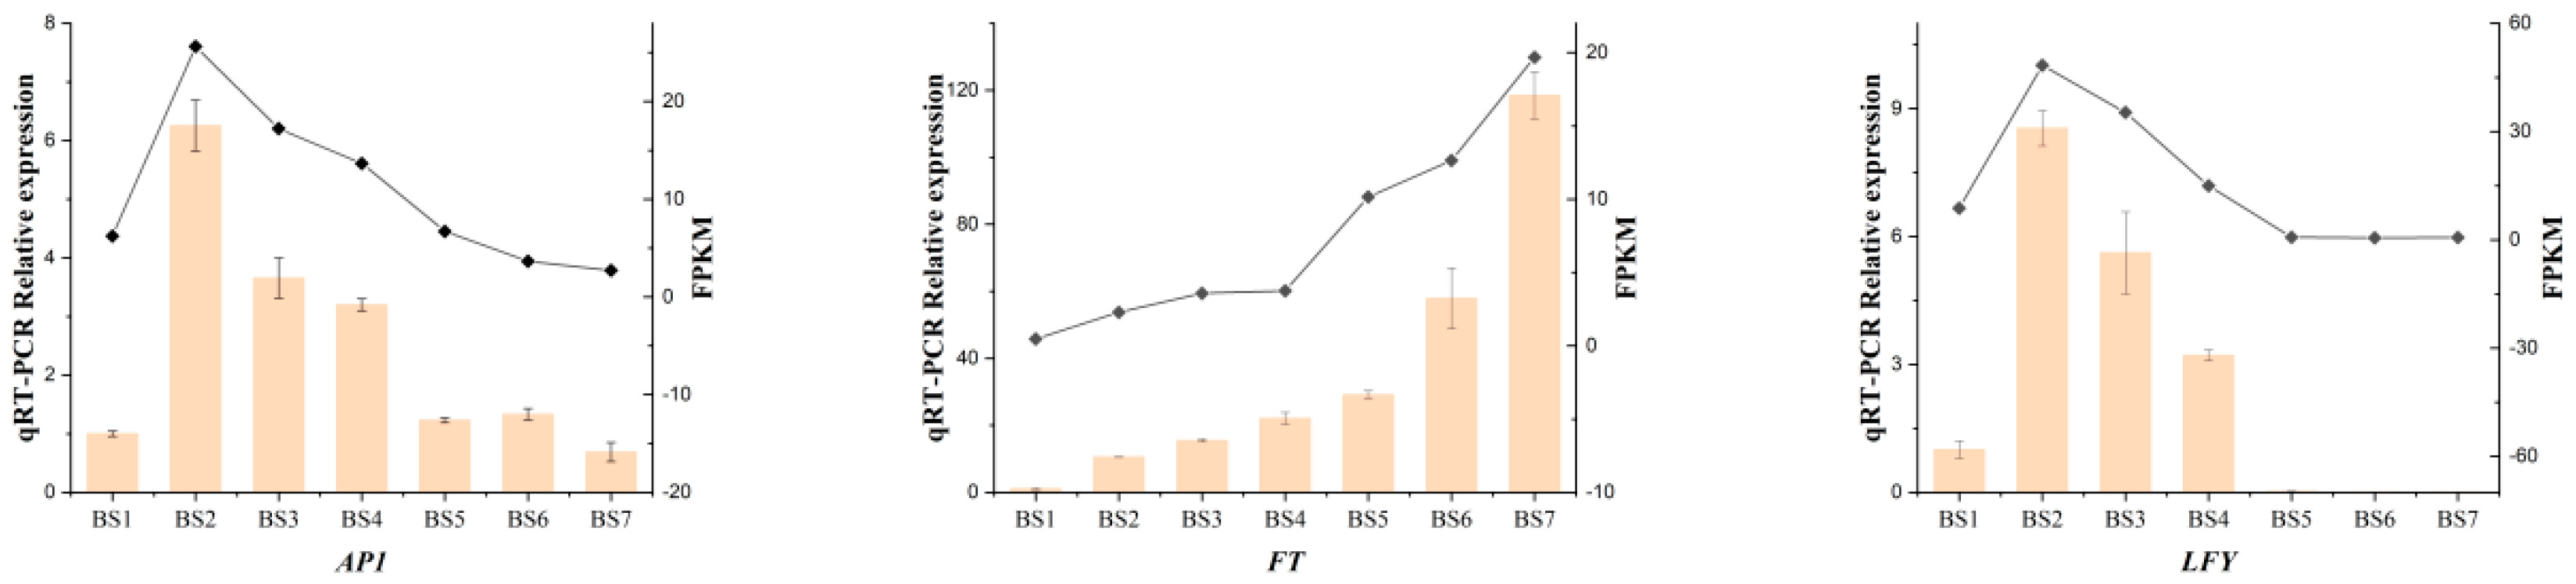
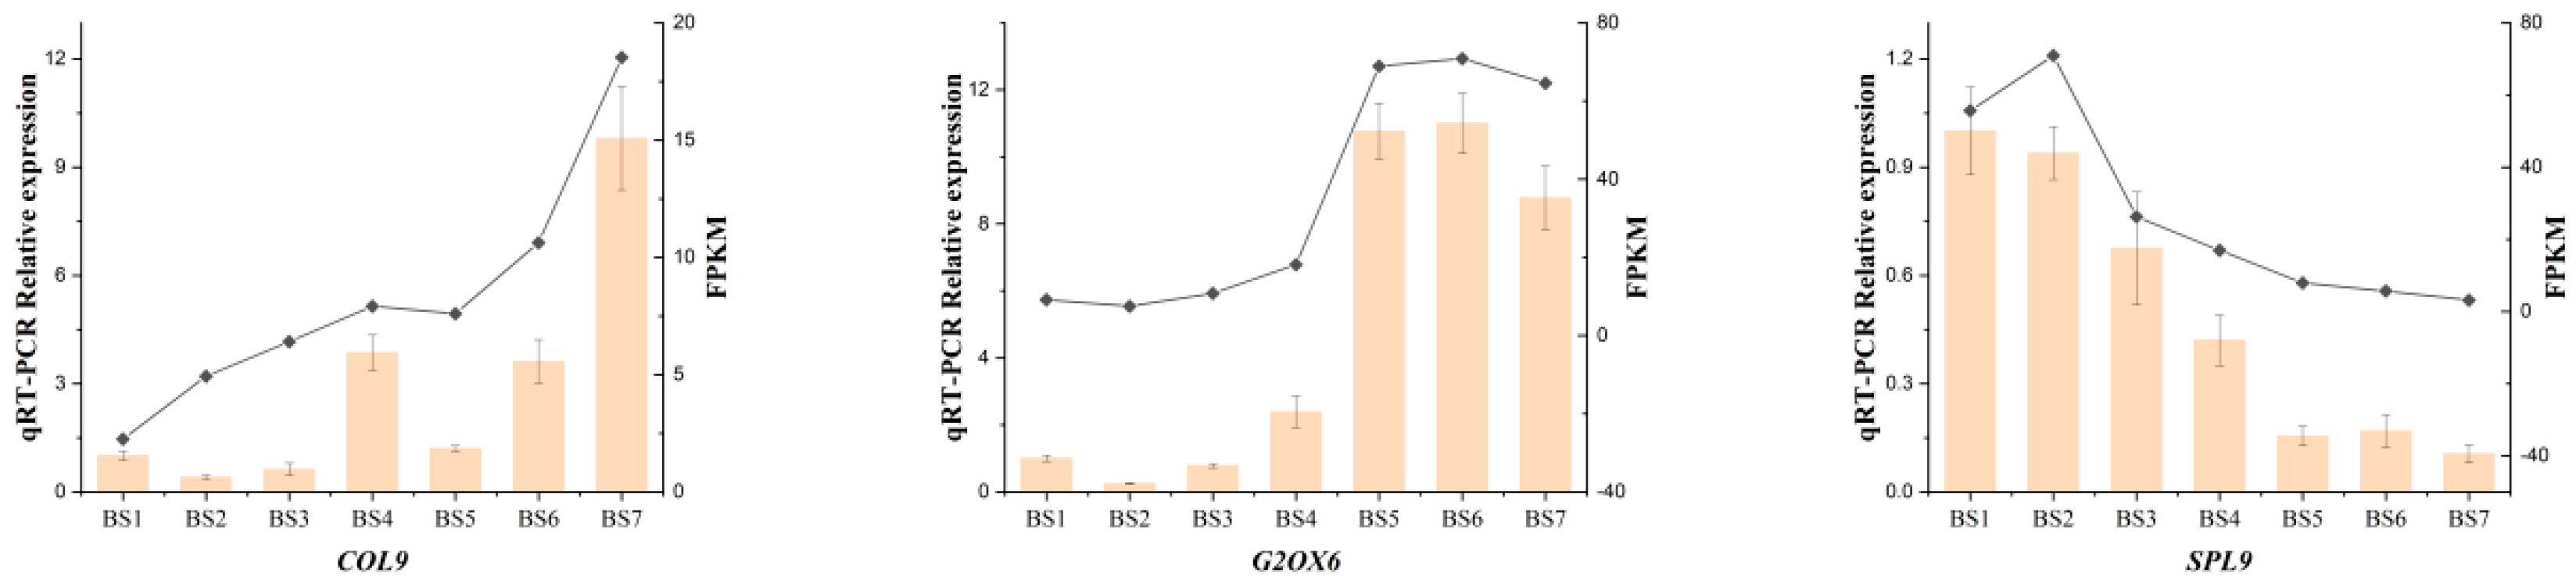
2.9. Real-Time Quantitative PCR Verification of Differentially Expressed Genes

Six genes related to flower induction in H. macrophylla “Endless Summer” were selected, namely AP1, FT, LFY, COL9, GAOX2, and SPL9, and their expression patterns were verified by qRT-PCR, as shown in Figure 7. The reliability of the transcriptome data was demonstrated by the correlation coefficient between their expression levels and transcriptome data, which was higher than 0.9.

3. Discussion

3.1. Sugar Signaling Mediates Flower Induction in H. macrophylla “Endless Summer”

Studies have shown that carbohydrates play an important role in plant growth and the flowering process. Sugar is not only an important energy source in the process of flower buds’ differentiation, but is also a key floral signal that initiates flower induction [17]. However, limited information is available on the specific effects of sugars on flower induction in perennial woody plants, especially H. macrophylla. Our results showed that the gene expression levels of the sucrose synthase gene SUS1; the amylase genes BAM1 and AMY3; and the soluble starch synthase gene GLGA in the SAM of H. macrophylla “Endless Summer” significantly changed during the flower development stage, which may be due to their involvement as an energy source in the regulation of flower induction. The high expression of the amylase gene BAM1 (one of the hub genes) at the BS2 stage implied the hydrolysis of starch, and it may be a signaling molecule that promotes the transition from vegetative growth to reproductive growth in H. macrophylla “Endless Summer”. Similar results were reported in Arabidopsis thaliana by Matsoukas [18]. In Arabidopsis, HEXOKINASE 1 (AtHXK1) is a glucose receptor that integrates signal transduction pathways such as nutrients and hormones, and plays a crucial role in plant growth and development [19]. Different sugar signals are sensed and transduced through HXK1. In this study, HXK1 was highly expressed in BS2, suggesting a high sugar level in the SAM during flower bud differentiation, which promoted flower induction. It has been reported that there is a significant correlation between the expression of flowering genes and sugar-related genes [20]. Currently, it is generally accepted that the signal molecule trehalose-6-phosphate (T6P) is crucial for the regulation of flowering and operates as a proxy for carbohydrate status in plants [21]. The expression of TPPA and TPPJ was high in the BS1–BS2 stages, while the sucrose synthase gene SUS1 was highly expressed in the BS5–BS7 stages, indicating that T6P and sucrose are both indicators of plant carbohydrate status. Some studies have shown that sucrose and T6P levels are tightly associated, and elevating the expression of sucrose in plants can also raise the levels of T6P, which can affect the transduction and metabolism of sugar signals and initiate flower induction [22]. In addition, sucrose can promote the positive expression of GI, thereby participating in floral induction [23]. The expression levels of GI in the transcriptome data were higher during the BS5–BS7 stages. In addition, some members of the SBP transcription factor gene family, such as SPL7 and SPL9, as miR156 target genes involved in the aging process, showed high expression levels in BS2 and decreased with bud growth, similar to the situation observed in Arabidopsis [24]. This suggests that the sugars involved in the induction of flowering in H. macrophylla are involved in the aging pathway of flower induction, as shown in Figure 8.

3.2. Hormone Signal-Mediated Flower Induction in H. macrophylla “Endless Summer”

As an important endogenous signal, plant hormones play an important role in the flowering process. Endogenous plant hormones can regulate plants’ growth and development by binding to specific protein receptors and regulate the process of bud differentiation in woody plants [25]. In this study, we identified the hormone levels during flower development and the expression levels of genes associated with hormone regulation and responses in order to understand the role of hormones in flower induction and flowering. Abscisic acid is an important hormone that plays a key regulatory role in different stages of plant development and in plants’ responses to environmental stresses [26]. Our results showed that abscisic acid exhibited a high expression level and reached the highest expression level at the BS2 stage during the induction of flowering. At the end of flower induction, the ABA content decreased, and then rose again at the blooming stage. According to our results, the expression patterns of NECD (involved in ABA biosynthesis) and of homologous ABA signal transduction genes, such as PYL and SNRK2, displayed similar changes to the ABA content in the SAM, showing high expression levels at the BS2 stage of flower induction, and then another increase at the flowering stage. This indicated that this change may mediate the initiation of flower formation and the regulation of the flowering process in H. macrophylla, shown in Figure 8. In Arabidopsis thaliana, the activation of flower induction requires the photoperiodic response gene GI and the florigen gene FT, and the ABA-dependent activation of FT requires CO for promoting the transcriptional upregulation of the florigen genes [27]. In addition, studies have shown that ABA induces flower induction by promoting the expression level of AP1 [28]. In our study, the change trend of the expression levels of AP1 was similar to that of ABA. Our results shows that ABA participated in the regulation of flower induction in H. macrophylla “Endless Summer” through various pathways.
Cytokinin controls many aspects of growth and development in woody plants. Zeatin nucleoside is the main type of CTK transport in the xylem, and is important for the differentiation of flower buds [29]. In fact, our results showed that the expression level of ZR in SAM continued to decrease from BS1 to BS3 until the flowering induction process was completed, and significantly increased during the flowering process. The key genes of ZR synthesis, ZOX and ZOG, also showed the same change trend, while the key genes for the CTK signal transduction pathway, such as ARR and AHP, were highly expressed in the BS1–BS2 stages. This indicated that ZR may participate in the flower induction process as a signal molecule during the first stage of flower induction. Studies have shown that AUXIN RESPONSE FACTOR (ARF) integrates the activities of AGAMOUS (AG) and auxin to control the biosynthesis and signaling of cytokinin, thereby coordinately regulating the maintenance and termination of the floral meristem [30]. In our study, the expression of ARF was high at the BS2 stage while the content of zeatin nucleoside decreased from the BS1 to BS3 stages, suggesting that ARF regulates the floral meristem’s determinacy by repressing the biosynthesis and signaling of cytokinin. In addition, it was reported that ZR can downregulate the expression level of miR172 and promote the expression of AP2 protein (shown in Figure 8), thereby promoting the regulation of the flowering process of H. macrophylla “Endless Summer” [31].
Gibberellin plays a role in flower induction in model plants such as Arabidopsis through the gibberellin pathway [32]. Our results showed that the expression of gibberellin in flower induction was low, and the expression of gibberellin in the flowering stage was high, and the key gene for gibberellin biosynthesis G2OX6 had the same expression trend. In addition, GAs can activate the expression of LFY through cis-acting elements that are different from those that respond to daylength [33], indicating that the environmental and intrinsic signals that control flowering can be integrated on the LFY promoter.
Auxin affects the elongation, differentiation, and floral induction processes of plants, and was the earliest identified plant hormone [34]. Our results exhibited a high expression level of auxin in the SAM during flower induction, while the differential expression of genes related to the auxin biosynthesis process was not significant. At the same time, the auxin influx carrier gene LAX5 was highly expressed during flower induction, while LAX2 was highly expressed during the flowering stage. This indicated that the flow of auxin between sources and sinks in H. macrophylla acts as a signal, which was involved in the regulation of flower induction. Kiyotaka’s research showed that the normal level of the auxin polar transport system is necessary for the development of inflorescences and flower buds [35]. In this study, the expression of the auxin polar transport gene PIN6 was high at the BS2 stage, indicating that it provided conditions for the development of inflorescences and flower buds in H. macrophylla. Flower primordia arose in the periphery of the inflorescence meristem at the sites of auxin maxima during the reproductive stage in Arabidopsis thaliana. At these sites, ARF5/MP upregulated the expression of LFY, via evolutionarily conserved and biologically important cis-regulatory motifs in the LFY promoter to specify these primordia as flowers and promote their outgrowth (shown in Figure 8) [36]. In addition, IAA can also participate in the processes of GA biosynthesis and signal transduction by promoting the expression of G2OXs and inhibiting the expression of DELLA protein [37].

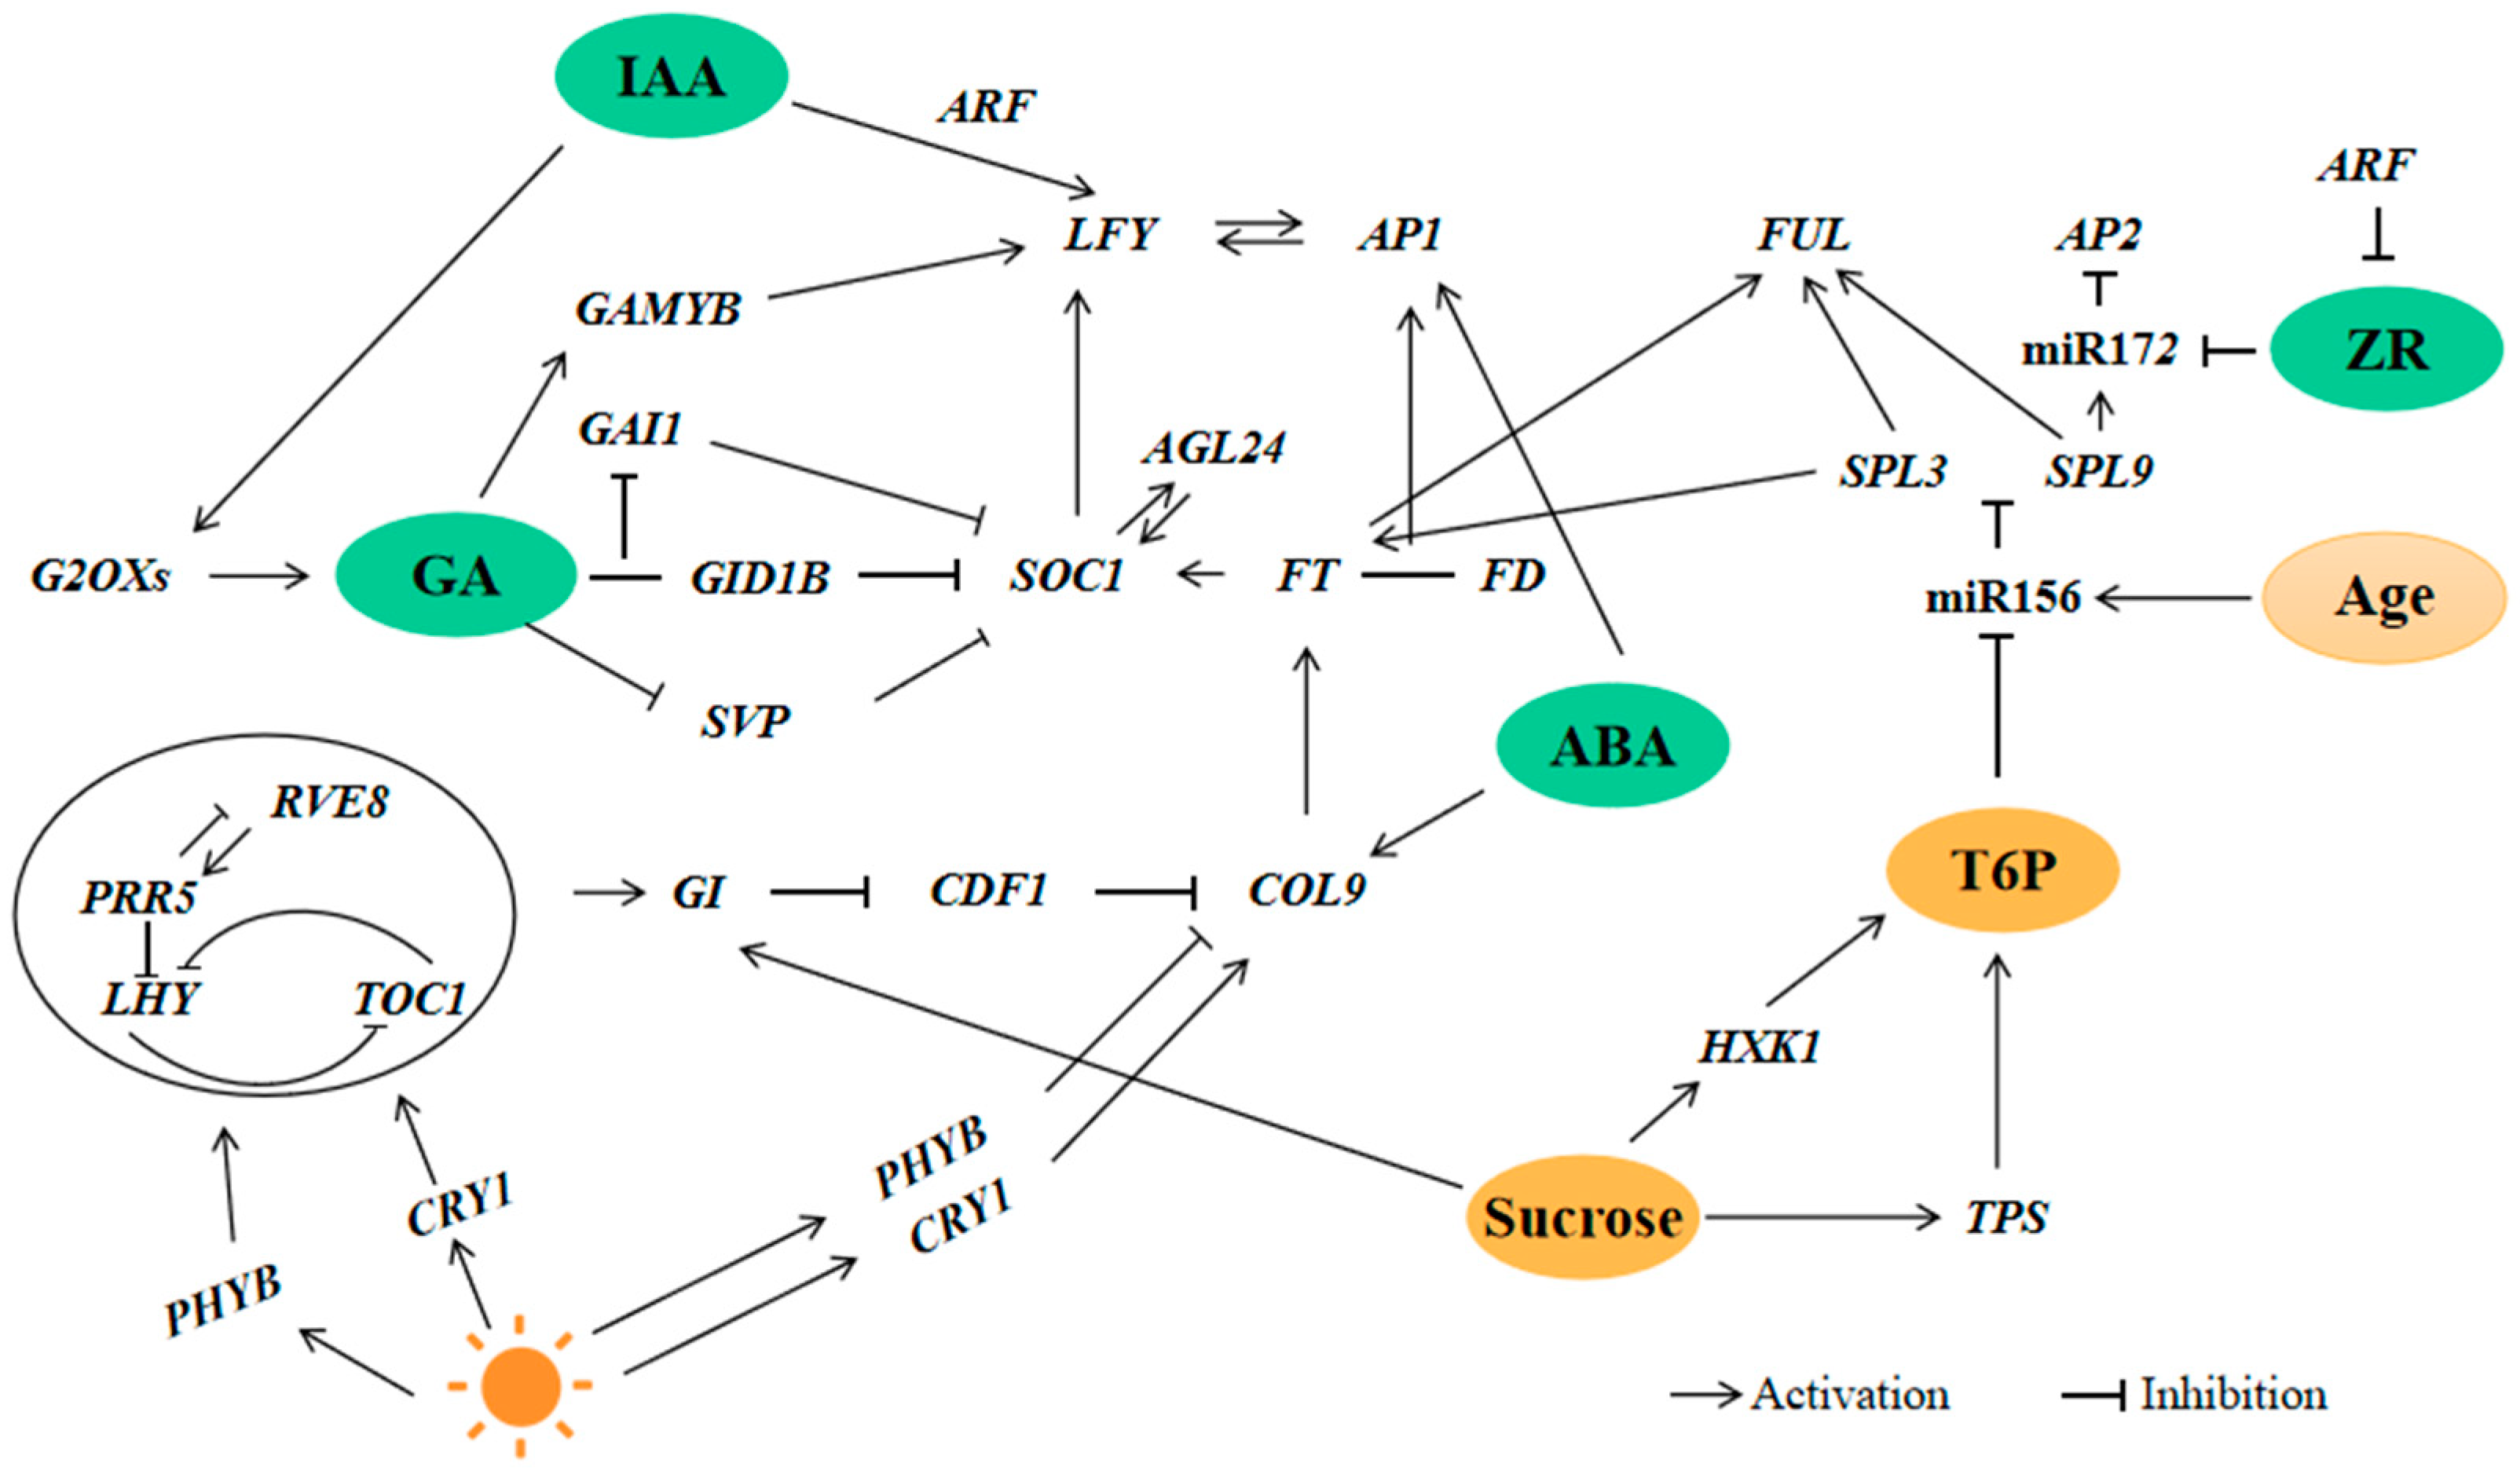
3.3. Flower Induction Pathway in H. macrophylla “Endless Summer”

Several environmental signals, such as daylength (photoperiod), winter (vernalization), high ambient temperatures, and endogenous signals, including plant age (aging), the plant hormone GA, and other factors all influence flower induction in the model plant Arabidopsis thaliana [38]. Flowering signals from different flower induction pathways are integrated into the flower integrator, such as FT, LFY, and SOC1, thereby regulating the determination of the floral meristem and the development of floral organs, and completing the regulation of flower induction [39]. The hypothetical model of a complex gene network of the regulatory mechanism of sugars, hormones, and multiple pathways, including the photoperiodic pathway, the gibberellin pathway, and the aging pathway, which mediate and regulate flower induction in H. macrophylla “Endless Summer”, can be seen in Figure 8. In this study, we used clustering methods and analyzed the expression profiles of flowering genes involved in the flower induction pathway during the flowers’ development (Figure 5). Our results showed that ELF4, PRR5, LHY, and RVE8 participated in the circadian rhythm. The photosensitive photoreceptor pigment PHYB and the cryptochrome promoting flowering CRY1 sense the photoperiod by absorbing red and far red light, thereby transmitting signals to the circadian clock [40]. GI is an output gene of the circadian clock. In our study, the expression of GI continuously increased to promote flowering. The circadian clock further transmitted signals of photoperiodic changes to COL9 through CDFs, while PHYB and CRY1 also promoted the expression of COL9. COL9 transmitted signals to FT, which upregulated the expression level of FT to control the transition to flowering in the photoperiodic pathway [41]. In addition, FD, a bZIP transcription factor interacted with FT, forming a complex that activated AP1, completing flower induction [42]. In our study, the expression levels of MADS family members such as AGL24, SOC1, etc., were higher at the early stages of flower induction and then gradually decreased. Studies have shown that genes related to the GA pathway are mainly divided into two categories: one group includes biosynthesis-related genes, such as G2OX1, G2OX6, and so on [32]. The other category includes key genes for GA signal transduction, such as GAI [43]. Our results showed that the binding of GA to the receptor GID1B mediates the ubiquitination and degradation of the growth-inhibitory factor of DELLA protein, relieving its inhibitory effect on flower induction and promoting flowering [9]. In our study, GAI was a negative regulator of the GA pathway, and its expression gradually decreased during the whole flower induction process. It has been reported that GA promotes the expression of LFY by binding the GAMYB protein to its promoter, and affects floral transformation by regulating SOC1 in the SAM [44]. In addition, GA can also inhibit the expression of the flowering inhibitory gene SVP in the SAM, promoting the expression of the flower integrator FT, thereby directly inducing flowering [45]. The aging pathway can regulate flower formation independently of the photoperiodic pathway and the gibberellin pathway, as it is only related to the plant’s age and includes two important regulators, miR156 and miR172 [46]. In this study, multiple SPLs genes regulated by miR156 were identified and classified into two categories. SPL9 was highly expressed in the BS2 stage and was closely related to floral transformation, while SPL3/4 promoted the identity of the floral meristem. In addition, SPL can co-activate the expression of FUL with SOC1 [47]. Our results showed that FUL was highly expressed during the BS2–BS6 stages, not only promoting the formation of inflorescence meristems, but also regulating the development of flower organs.
In summary, the hydrolysis of starch may be a signaling molecule that promotes the transition from vegetative growth to reproductive growth in H. macrophylla “Endless Summer”. Sucrose can promote the positive expression of GI and increase T6P levels, thereby participating in flower induction. ABA promotes flower induction by promoting the expression of COL9 and participating in the photoperiodic pathway, as well as promoting the expression of AP1, which promotes the development of floral organs. ARF downregulates the synthesis and signal transduction of ZR, thus regulating the maintenance and termination of flower meristems. GA promotes the expression of LFY and affects the transformation of flowers by regulating SOC1 in the SAM. The flow of auxin between sources and sinks in H. macrophylla is involved in the regulation of flower induction as a signal. In addition, IAA participates in the signal transduction process of GA by promoting the expression of G2OXs and inhibiting the expression of DELLA. As a result, multiple pathways, including the photoperiodic pathway, the aging pathway, and the gibberellin pathway, which are mainly mediated by crosstalk between sugar and hormone signals, regulate the molecular network involved in flower induction in H. macrophylla “Endless Summer”. The period of flower induction varies according to the physiological condition and development of the basal shoots sprouted in the spring, presenting a landscape of continuous flowering.

4. Materials and Methods

4.1. Plant Materials

Beijing Forestry University provided the research materials used in this study. H. macrophylla “Endless Summer”, which had been grown in the open air grown and showed typical healthy flowering, was chosen as the test subject. The terminal buds and inflorescences were monitored and photographed every 5 to 10 days from 20 March 2021 to 30 September 2021. Fresh samples were utilized for the phenotypic observations, while frozen samples were kept in a standby ultra-low temperature refrigerator at −80 °C after being frozen using liquid nitrogen. Seven experimental materials were selected, as shown in Figure 1a,e,g,h,i,k,l, which ranged from vegetative buds (BS1) to inflorescences (BS7) at the full flowering stage.

4.2. Measurement of Hormone Content during Flower Development

The extraction, purification, and determination of endogenous levels of IAA, GA3, ABA, and ZR were performed by an indirect ELISA technique as described by He [48] and Yang et al. [49]. After being homogenized in liquid nitrogen, samples from the 7 stages (BS1-BS7) were extracted in cold 80% (v/v) methanol with butylated hydroxytoluene (1 mmol/L) for 5 h at 4 °C. The extracts were collected after centrifugation at 3500 r/min (4 °C) for 8 min. The supernatant was passed through Chromosep C18 columns (C18 Sep-Park Cartridge, Waters Corp., Millford, MA, USA). The hormone fractions were prewashed with 1 mL of 80% (v/v) methanol and eluted with 5 mL of 100% (v/v) methanol, 5 mL of ether, and 5 mL of 100% (v/v) methanol from the columns. Then they were dried under N2 and dissolved in 2 mL of phosphate-buffered saline (PBS) containing 0.1% (v/v) Tween 20 and 0.1% (w/v) gelatin for analysis by ELISA. The samples were diluted an appropriate amount of the standard sample with PBS to 8 concentrations (including 0 ng/mL). These series of standard samples and test samples were added to the 96-well ELISA plate, then antibodies were added and incubated at 37 °C for 30 min. After the samples had been washed four times with a PBS + Tween 20 (0.1% (v/v)) buffer, 10 mL of the diluted enzyme-linked secondary antibody was added and the samples were incubated at 37 °C for 30 min and then washed as above. Finally, the buffered enzyme substrate (orthophenylenediamino) was added, and the enzyme reaction was carried out in the dark at 37 °C for 15 min then terminated using 50 μL of 2 mol/L H2SO4. As described by Weiler et al., calculations of the enzyme immunoassay data were made [50]. The results are the means ± SE of at least three replicates.

4.3. Transcriptome Sequencing

Total RNA was extracted from the samples at 7 stages during flower development using the mirVana TM miRNA ISOlation Kit, Ambion-1561 (Shanghai, China). The integrity, purity, and concentration of the total RNA were determined using a gel imaging system (Tanon 2500, Shanghai, China) and an ultraviolet spectrophotometer (NanoDrop 2000, Thermo, Waltham, MA, USA). A further RNA high-throughput sequencing library was built using the qualifying samples. Shanghai Ouyi Biotechnology Co., Ltd (Shanghai, China). was the sequencing unit.
The mRNA was enriched from the total RNA by using magnetic beads. An interruption reagent was added to fragment the mRNA into smaller pieces. Short-segment mRNA was used as a template to create the first strand of cDNA using random primers. DNA polymerase I, RNase H, dNTP, and s buffer were used to create the second strand. The steps of end repair, the addition Poly A, and sequence connection were all completed after the double-stranded cDNA had been purified. The library was then created by PCR amplification after the size of the fragments had been screened. The created library was utilized for double-ended sequencing on the Illumina sequencer (Genedenovo Biotechnology, Guangzhou, China) after passing the quality assessment using the Agilent 2100 Bioanalyzer (Agilent Technologies, Santa Clara, CA, USA).
We removed the joints and carried out quality control using Trimmatic software. On this basis, we filtered out low-quality bases and N-bases, and finally obtained high-quality clean reads. The transcript was reconstructed and assembled by Trinity (version: 2.4) and CD-HIT software via de novo assembly to obtain the final unigenes.

4.4. Functional Annotation of Unigenes and Screening for Differentially Expressed Genes

The derived unigenes’ functions were annotated using Diamond software [51] and compared with the NR, KOG, GO, SwissProt, eggNOG, and KEGG databases. We used the HMMER program for a comparison with the Pfam database [52]. To determine the number of reads matched to the unigenes in each sample, the sequence similarity comparison technique and the Bowite2 program [53] were used, with the spliced unigene database. The value of fragments per kilobase of the exon model per million mapped fragments (FPKM) of each unigene in each sample was calculated using the eXpress program [54]. DESeq2 software was used to normalize the counts for each sample gene, according to the FPKM [55]. DEGs were selected with a |log2 fold change| ≥ 1 and a p-value of < 0.05 as the threshold by computing the multiple differences and running the significant difference test. GO and KEGG functional pathway enrichment analyses were used to screen the flowering-related DEGs. The time-series cluster method was used to analyze the expression profiles of DEGs involved in sugar, hormone, and flowering process. Pearson’s correlation coefficient (r) was used to determine the similarities among the genes (|r| ≥ 0.9) based on the FPKM of the DEGs. The visualization of the gene co-expression network was constructed using Cytascape 3.8.2 [56]. Basic parameter analysis was performed using the Network Analyzer plug-in, and cytoHubba created the co-expression network of flower induction in H. macrophylla “Endless Summer”. The remaining parameters had the default system settings.

4.5. Real-Time Quantitative Polymerase Chain Reaction

Six DEGs associated with flower development were randomly chosen for the qRT-PCR investigation to confirm the correctness of the transcriptome data. RNA was reverse-transcribed into cDNA using the HiScript III RT SuperMix for qPCR (+gDNA wiper) from Vazyme Biotech, Nanjing, China. The particular primers (Table 5) of each candidate gene were created using the program Primer Premier 5 (Premier Biosoft, San Francisco, CA, USA) and produced by Bioengineering Co., Ltd. (Shanghai, China) in accordance with the design principles of qRT-PCR primers. The reaction system was set up with TB Green® Premix Ex TaqTM II (Takara, Shiga, Japan), following the manufacturers’ instructions, and PCR amplification was carried out using RPL34 as the internal reference gene [57]. The reaction system and reaction processes are shown in Table 6. The expression levels of the DEGs were normalized and mapped by using the 2−ΔΔCT method.

Author Contributions

Y.L. (Yingmin Lyu) and T.L. conceptualized and designed the experiment; Y.L. (Yun Liu) and T.L. performed the laboratory experiments and statistical analysis; Y.L. (Yun Liu) and T.L. wrote the original draft and revised the manuscript; T.L. and Y.L. (Yun Liu) were responsible for funding acquisition and supervision. All authors have read and agreed to the published version of the manuscript.

Funding

This work was supported by the project supported by the Beijing Municipal Park Management Center (grant No. 2019-ZX-13) and China’s National Natural Science Foundation (grant No. 31872138 and grant No. 31672190), the National Key R&D Program of China (grant number 2019YFD1000404-2 and 2018YFD1000402).

Institutional Review Board Statement

Not applicable.

Informed Consent Statement

Not applicable.

Data Availability Statement

All data generated or analyzed during this study are available.

Conflicts of Interest

The authors declare no conflict of interest.

References

  1. Zhou, Q.; Zhang, S.; Bao, M.; Liu, G. Advances on molecular mechanism of floral initiation in higher plants. Mol. Plant Breed. 2018, 16, 3681–3692. [Google Scholar]
  2. Shu, H.; Hao, Y.; Cai, Q.; Wang, Z.; Zhu, G.; Chen, S.; Zhou, Y.; Wang, Z. Recent research progress on the molecular regulation of flowering time in Arabidopsis thaliana. Plant Sci. J. 2017, 35, 603–608. [Google Scholar]
  3. Xing, L.B.; Zhang, D.; Li, Y.M.; Shen, Y.W.; Zhao, C.P.; Ma, J.J.; An, N.; Han, M.Y. Transcription Profiles Reveal Sugar and Hormone Signaling Pathways Mediating Flower Induction in Apple (Malus domestica Borkh.). Plant Cell Physiol. 2015, 56, 2052–2068. [Google Scholar] [CrossRef] [PubMed]
  4. Zhou, Y.; Sun, X.D.; Ni, M. Timing of photoperiodic flowering: Light perception and circadian clock. J. Integr. Plant Biol. 2007, 49, 28–34. [Google Scholar] [CrossRef]
  5. Rawat, R.; Takahashi, N.; Hsu, P.Y.; Jones, M.A.; Schwartz, J.; Salemi, M.R.; Phinney, B.S.; Harmer, S.L. REVEILLE8 and PSEUDO-REPONSE REGULATOR5 Form a Negative Feedback Loop within the Arabidopsis Circadian Clock. PloS Genet. 2011, 7, e1001350. [Google Scholar] [CrossRef] [PubMed]
  6. Li, C.; Li, Y.H.; Li, Y.; Lu, H.; Hong, H.; Tian, Y.; Li, H.; Zhao, T.; Zhou, X.; Liu, J.; et al. A Domestication-Associated Gene GmPRR3b Regulates the Circadian Clock and Flowering Time in Soybean. Mol. Plants Engl. Version 2020, 13, 15. [Google Scholar] [CrossRef]
  7. Ren, Y.; Gao, Y.; Gao, S.; Yuan, L.; Wang, X.; Zhang, Q. Genetic characteristics of circadian flowering rhythm in Hemerocallis. Sci. Hortic. 2019, 250, 19–26. [Google Scholar] [CrossRef]
  8. Yamane, H.; Kashiwa, Y.; Ooka, T.; Tao, R.; Yonemori, K. Suppression Subtractive Hybridization and Differential Screening Reveals Endodormancy-associated Expression of an SVP/AGL24-type MADS-box Gene in Lateral Vegetative Buds of Japanese Apricot. J. Am. Soc. Hortic. Sci. 2008, 133, 708–716. [Google Scholar] [CrossRef]
  9. Fukazawa, J.; Ohashi, Y.; Takahashi, R.; Nakai, K.; Takahashi, Y. DELLA degradation by gibberellin promotes flowering via GAF1-TPR-dependent repression of floral repressors in Arabidopsis. Plant Cell 2021, 7, 2258–2272. [Google Scholar] [CrossRef] [PubMed]
  10. Wu, G.; Park, M.Y.; Conway, S.R.; Wang, J.W.; Weigel, D.; Poethig, R.S. The Sequential Action of miR156 and miR172 Regulates Developmental Timing in Arabidopsis. Cell 2009, 138, 750–759. [Google Scholar] [CrossRef]
  11. Gou, J.; Tang, C.; Chen, N.; Wang, H.; Debnath, S.; Sun, L.; Flanagan, A.; Tang, Y.; Jiang, Q.; Allen, R.D.; et al. SPL7 and SPL8 represent a novel flowering regulation mechanism in switchgrass. New Phytol. 2019, 222, 1610–1623. [Google Scholar] [CrossRef]
  12. Jiang, Y.; Peng, J.; Wang, M.; Su, W.; Gan, X.; Jing, Y.; Yang, X.; Lin, S.; Gao, Y. The Role of EjSPL3, EjSPL4, EjSPL5, and EjSPL9 in Regulating Flowering in Loquat (Eriobotrya japonica Lindl.). Int. J. Mol. Sci. 2019, 21, 248. [Google Scholar] [CrossRef]
  13. Tripathi, R.K.; Bregitzer, P.; Singh, J. Genome-wide analysis of the SPL/miR156 module and its interaction with the AP2/miR172 unit in barley. Sci. Rep. 2018, 8, 7085. [Google Scholar] [CrossRef]
  14. Moon, J.; Lee, H.; Kim, M.; Lee, I. Analysis of flowering pathway integrators in Arabidopsis. Plant Cell Physiol. 2005, 46, 292–299. [Google Scholar] [CrossRef]
  15. Wei, Q.; Ma, C.; Xu, Y.; Wang, T.; Chen, Y.; Lü, J.; Zhang, L.; Jiang, C.-Z.; Hong, B.; Gao, J. Control of chrysanthemum flowering through integration with an aging pathway. Nat. Commun. 2017, 8, 829. [Google Scholar] [CrossRef]
  16. Zou, L.; Pan, C.; Wang, M.X.; Cui, L.; Han, B.Y. Progress on the mechanism of hormones regulating plant flower formation. Yi Chuan = Hered. 2020, 42, 739–751. [Google Scholar]
  17. Lu, J.C. Comparative transcription profiles reveal that carbohydrates and hormone signalling pathways mediate flower induction in Juglans sigillata after girdling. Ind. Crops Prod. 2020, 153, 112556. [Google Scholar] [CrossRef]
  18. Matsoukas, I.G.; Massiah, A.J.; Thomas, B. Starch metabolism and antiflorigenic signals modulate the juvenile-to-adult phase transition in Arabidopsis. Plant Cell Environ. 2013, 36, 1802–1811. [Google Scholar] [CrossRef]
  19. Liu, Y.; Bai, Y.; Li, N.; Li, M.; Liu, W.; Yun, D.J.; Liu, B.; Xu, Z.Y. HEXOKINASE1 forms a nuclear complex with the PRC2 subunits CURLY LEAF and SWINGER to regulate glucose signaling. J. Bot. Engl. Ed. 2022, 64, 13. [Google Scholar] [CrossRef] [PubMed]
  20. Seo, P.J.; Ryu, J.; Kang, S.K.; Park, C.M. Modulation of sugar metabolism by an INDETERMINATE DOMAIN transcription factor contributes to photoperiodic flowering in Arabidopsis. Plant J. Cell Mol. Biol. 2011, 65, 418–429. [Google Scholar] [CrossRef] [PubMed]
  21. Wahl, V.; Ponnu, J.; Schlereth, A.; Arrivault, S.; Langenecker, T.; Franke, A.; Feil, R.; Lunn, J.E.; Lunn, M.; Schmid, M. Regulation of Flowering by Trehalose-6-Phosphate Signaling in Arabidopsis thaliana. Science 2013, 339, 704–707. [Google Scholar] [CrossRef]
  22. Paul, M.; Paul, M.J. Trehalose 6-phosphate: A signal of sucrose status. Biochem. J. 2008, 412, e1. [Google Scholar] [CrossRef]
  23. Wingler, A.; Henriques, R. Sugars and the speed of life—Metabolic signals that determine plant growth, development and death. Physiol Plant 2022, 174, e13656. [Google Scholar]
  24. Zhou, Q.; Shi, J.; Li, Z.; Zhang, S.; Zhang, S.; Zhang, J.; Bao, M.; Liu, G. miR156/157 targets SPLs to regulate flowering transition, plant architecture and flower organ size in petunia. Plant Cell Physiol. 2021, 62, 839–857. [Google Scholar] [CrossRef]
  25. Pallardy, S.G. Plant Hormones and Other Signaling Molecules—ScienceDirect. In Physiology of Woody Plants, 3rd ed.; Elsevier: Amsterdam, The Netherlands, 2008; pp. 367–377. [Google Scholar]
  26. Zheng, C.; Yang, Y.; Luo, X.; Liu, W.; Yang, W.; Shu, K. Current understanding of the roles of phytohormone abscisic acid in the regulation of plant root growth. Plant Sci. J. 2019, 37, 690–698. [Google Scholar]
  27. Riboni, M.; Robustelli Test, A.; Galbiati, M.; Tonelli, C.; Conti, L. ABA-dependent control of GIGANTEA signalling enables drought escape via up-regulation of FLOWERING LOCUS T in Arabidopsis thaliana. J. Exp. Bot. 2016, 67, 6309–6322. [Google Scholar] [CrossRef]
  28. Cui, Z.; Zhou, B.; Zhang, Z.; Hu, Z. Abscisic acid promotes flowering and enhances LcAP1 expression in Litchi chinensis Sonn. S. Afr. J. Bot. 2013, 88, 76–79. [Google Scholar] [CrossRef]
  29. Chickarmane, V.S.; Gordon, S.P.; Tarr, P.T.; Heisler, M.G.; Meyerowitz, E.M. Cytokinin signaling as a positional cue for patterning the apical–basal axis of the growing Arabidopsis shoot meristem. Proc. Natl. Acad. Sci. USA 2012, 109, 4002–4007. [Google Scholar] [CrossRef]
  30. Aukerman, M.J.; Sakai, H. Regulation of Flowering Time and Floral Organ Identity by a MicroRNA and Its APETALA2-Like Target Genes. Plant Cell 2003, 15, 2730–2741. [Google Scholar] [CrossRef]
  31. Zhang, K.; Wang, R.; Zi, H.; Li, Y.; Cao, X.; Li, D.; Guo, L.; Tong, J.; Pan, Y.; Jiao, Y.; et al. AUXIN RESPONSE FACTOR3 Regulates Floral Meristem Determinacy by Repressing Cytokinin Biosynthesis and Signaling. Plant Cell 2018, 30, 324–346. [Google Scholar] [CrossRef]
  32. Sheng, J.; Li, X.; Zhang, D. Gibberellins, brassinolide, and ethylene signaling were involved in flower differentiation and development in Nelumbo nucifera. Hortic. Plant J. 2022, 8, 243–250. [Google Scholar] [CrossRef]
  33. Sumitomo, K.; Li, T.; Hisamatsu, T. Gibberellin promotes flowering of chrysanthemum by upregulating CmFL, a chrysanthemum FLORICAULA/LEAFY homologous gene. Plant Sci. 2009, 176, 643–649. [Google Scholar] [CrossRef]
  34. Krizek, B.A.; Eaddy, M. AINTEGUMENTA-LIKE6 regulates cellular differentiation in flowers. Plant Mol. Biol. 2012, 78, 199–209. [Google Scholar] [CrossRef]
  35. Okada, K.; Ueda, J.; Komaki, M.K.; Bell, C.J.; Shimura, Y. requirement of the auxin polar transport system in early stages of arabídopsis floral bud formation. Plant CelL 2018, 3, 677–684. [Google Scholar] [CrossRef]
  36. Yamaguchi, N.; Wu, M.F.; Winter, C.M.; Berns, M.C.; Nole-Wilson, S.; Yamaguchi, A.; Coupland, G.; Krizek, B.A.; Wagner, D. A Molecular Framework for Auxin-Mediated Initiation of Flower Primordia. Dev. Cell 2013, 24, 271–282. [Google Scholar] [CrossRef]
  37. Frigerio, M.; Alabadí, D.; Pérez-Gómez, J.; García-Cárcel, L.; Phillips, A.L.; Hedden, P.; Blázquez, M.A. Transcriptional regulation of gibberellin metabolism genes by auxin signaling in Arabidopsis. Plant Physiol 2006, 142, 553–563. [Google Scholar] [CrossRef]
  38. Ó’Maoiléidigh, D.S.; Graciet, E.; Wellmer, F. Gene networks controlling Arabidopsis thaliana flower development. N. Phytol. 2013, 201, 16–30. [Google Scholar] [CrossRef]
  39. Das, A.; Geetha, G.A.; Ravishankar, K.V.; Shivashankara, K.S.; Roy, T.K.; Dinesh, M.R. Interrelations of growth regulators, carbohydrates and expression of flowering genes (FT, LFY, AP1) in leaf and shoot apex of regular and alternate bearing mango (Mangifera indica L.) cultivars during flowering—ScienceDirect. Sci. Hortic. 2019, 253, 263–269. [Google Scholar] [CrossRef]
  40. Balcerowicz, M.; Mahjoub, M.; Nguyen, D.; Lan, H.; Stoeckle, D.; Conde, S.; Jaeger, K.E.; Wigge, P.A.; Ezer, D. An early-morning gene network controlled by phytochromes and cryptochromes regulates photomorphogenesis pathways in Arabidopsis. Mol. Plants Engl. Version 2021, 14, 983–996. [Google Scholar] [CrossRef]
  41. Harmon, F.G.; Chen, J.; Xin, Z. GIGANTEA promotes sorghum flowering by stimulating floral activator gene expression. bioRxiv 2018, 427–492. [Google Scholar] [CrossRef]
  42. LLi, D.; Zhang, H.; Mou, M.; Chen, Y.; Xiang, S.; Chen, L.; Yu, D. Arabidopsis Class II TCP Transcription Factors Integrate with the FT–FD Module to Control Flowering 1. Plant Physiol. 2019, 181, 97–111. [Google Scholar] [CrossRef] [PubMed]
  43. Galvão, V.C. Regulation of flowering time by DELLA proteins in Arabidopsis thaliana; Eberhard-Karls-Universitaet Tuebingen: Baden-Württemberg, Germany, 2013. [Google Scholar]
  44. Woodger, F.J.; Millar, A.; Murray, F.; Jacobsen, J.V.; Gubler, F. The Role of GAMYB Transcription Factors in GA-Regulated Gene Expression. J. Plant Growth Regul. 2003, 22, 176–184. [Google Scholar] [CrossRef]
  45. Li, D.; Liu, C.; Shen, L.; Wu, Y.; Chen, H.; Robertson, M.; Helliwell, C.A.; Ito, T.; Meyerowitz, E.; Yu, H. A repressor complex governs the integration of flowering signals in Arabidopsis. Dev. Cell 2008, 15, 110–120. [Google Scholar] [CrossRef] [PubMed]
  46. Roussin-Léveillée, C.; Silva-Martins, G.; Moffett, P. ARGONAUTE5 Represses Age-Dependent Induction of Flowering through Physical and Functional Interaction with miR156 in Arabidopsis. Plant Cell Physiol. 2020, 61, 957–966. [Google Scholar] [CrossRef] [PubMed]
  47. Fujiwara, S.; Oda, A.; Kamada, H.; Coupland, G.; Mizoguchi, T. Circadian clock components in Arabidopsis II. LHY/CCA1 regulate the floral integrator gene SOC1 in both GI-dependent and -independent pathways. Plant Biotechnol. 2006, 22, 319–325. [Google Scholar] [CrossRef]
  48. He, Z. (Ed.) Guidance to experiment on chemical control in crop plants. In Guidance to Experiment on Chemical Control in Crop Plants; Beijing Agricultural University Publishers: Beijing, China, 1993; pp. 60–68. [Google Scholar]
  49. Yang, J. Hormonal Changes in the Grains of Rice Subjected to Water Stress during Grain Filling. Plant Physiol. 2001, 127, 315–323. [Google Scholar] [CrossRef]
  50. Weiler, E.W.; Jourdan, P.S.; Conrad, W. Levels of indole-3-acetic acid in intact and decapitated coleoptiles as determined by a specific and highly sensitive solid-phase enzyme immunoassay. Planta 1981, 153, 561–571. [Google Scholar] [CrossRef]
  51. Tränkner, C.; Krüger, J.; Wanke, S.; Naumann, J.; Wenke, T.; Engel, F. Rapid identification of inflorescence type markers by genotyping-by-sequencing of diploid and triploid F1 plants of Hydrangea macrophylla. BMC Genet. 2019, 20, 60. [Google Scholar] [CrossRef]
  52. Mistry, J.; Finn, R.D.; Eddy, S.R.; Bateman, A.; Punta, M. Challenges in homology search: HMMER3 and convergent evolution of coiled-coil regions. Nucleic Acids Res. 2013, 41, e121. [Google Scholar] [CrossRef]
  53. Langmead, B.; Salzberg, S.L. Fast gapped-read alignment with Bowtie 2. Nat. Methods 2012, 9, 357–359. [Google Scholar] [CrossRef]
  54. Roberts, A. Ambiguous Fragment Assignment for High-Throughput Sequencing Experiments. Diploma Thesis, University of California, Berkeley, CA, USA, 2013. [Google Scholar]
  55. Love, M.I.; Huber, W.; Anders, S. Moderated estimation of fold change and dispersion for RNA-seq data with DESeq2. Genome Biol. 2014, 15, 550. [Google Scholar] [CrossRef] [PubMed]
  56. Franz, M.; Lopes, C.T.; Huck, G.; Dong, Y.; Sumer, O.; Bader, G.D. Cytoscape.js: A graph theory library for visualisation and analysis. Bioinformatics 2015, 32, 309–311. [Google Scholar] [CrossRef] [PubMed]
  57. Zhang, G. Cloning and Expression Analysis of the pH-Regulating Gene NHX1 in Sepals of Hydrangea Macrophylla Vacuole; Chinese Academy of Agricultural Sciences: Beijing, China, 2021. [Google Scholar]
Figure 1. Phenotypic observations of different development stages of H. macrophylla “Endless Summer”. (a) Vegetative bud; (b) flower bud expansion; (c) meristem division; (d) differentiation of the floral primordia; (e) differentiation of floral organs; (f) primary inflorescence branches, (g) secondary inflorescence branches, (h) the appearance of decorative sepals, (i) a few colored decorative sepals, (j) partly colored decorative sepals; (k) fully colored decorative sepals; (l) all decorative and non-decorative flowers were colored.
Ijms 24 07691 g001
Figure 2. Changes in the endogenous hormones of H. macrophylla “Endless Summer”. The horizontal axis in the figure represents the seven periods of flower development, and the vertical axis represents changes in the hormone content at different periods. Error bars show the standard error of three biological replicates (n = 3).
Ijms 24 07691 g002
Figure 3. Expression profiles of sugar-related genes during flower development (BS1–BS7) in H. macrophylla “Endless Summer”. Hierarchical cluster analysis was performed on sugar-related genes with similar expression patterns. Fragments per kilobase of the exon model per million mapped fragments (FPKM) were used for the cluster analysis. Expression data for a given gene are shown relative to its expression during the BS1 to BS7 stages of flower development. Numbers assigned to the major clusters are indicated on the dendrogram.
Ijms 24 07691 g003
Figure 4. Expression profiles of hormone-related genes during flower development (BS1−BS7) in H. macrophylla “Endless Summer”. Hierarchical cluster analysis was performed on hormone-related genes with similar expression patterns. FPKM values were used for the cluster analysis. Expression data for a given gene are shown relative to its expression during the BS1 to BS7 stages of flower development. Numbers assigned to the major clusters are indicated on the dendrogram.
Ijms 24 07691 g004
Figure 5. Expression profiles of flower-related genes during flower development (BS1−BS7) in H. macrophylla “Endless Summer”. Hierarchical cluster analysis was performed on flower-related genes with similar expression patterns. FPKM values were used for the cluster analysis. The expression data for a given gene are shown relative to its expression during the BS1 to BS7 stages of flower development. Numbers assigned to the major clusters are indicated on the dendrogram.
Ijms 24 07691 g005
Figure 6. Co-expression network of DEGs related to flower development in seven stages. Colors ranging from yellow (lowest degree) to dark green (highest degree) represent the level of connectivity. The network was visualized in Cytoscape. Spheres (nodes) represent genes, and the transparency of the lines (edges) represents the strength of the correlations between genes.
Ijms 24 07691 g006
Figure 7. qRT−PCR validation of the expression patterns of six DEGs. The x−axis represents the seven developmental stages; the left y−axis represents the relative expression levels in the qRT−PCR results; the right y−axis represents the FPKM values from RNA−seq. Error bars show the standard error of three biological replicates (n = 3).
Ijms 24 07691 g007aIjms 24 07691 g007b
Figure 8. Hypothetical model of the complex gene network of the regulatory mechanism of sugars, hormones, and multiple pathways including the photoperiodic pathway, the gibberellin pathway, and the aging pathway, which mediate and regulate flower induction in H. macrophylla “Endless Summer”.
Ijms 24 07691 g008
Table 1. Statistics of the quality of the sequencing data.
SampleRaw ReadsRaw BasesClean ReadsClean BasesValid BasesQ30GC
BS151.67 M7.75 G50.52 M7.36 G94.96%88.66%45.55%
BS247.87 M7.18 G46.82 M6.84 G95.22%91.14%45.52%
BS348.92 M7.34 G47.94 M6.95 G94.68%91.03%45.38%
BS450.73 M7.61 G49.60 M7.25 G95.34%90.85%45.37%
BS549.45 M7.42 G48.24 M7.06 G95.14%91.86%45.60%
BS648.66 M7.30 G47.60 M6.95 G95.22%90.84%45.57%
BS747.49 M7.12 G46.46 M6.79 G95.31%91.69%45.38%
Table 2. Assembly statistics of the clean reads.
TermAllN50Total LengthMax LengthMin LengthAverage Length
Unigene47,793178556,267,84615,8273011177.32
Table 3. KEGG pathways for the flowering of H. macrophylla “Endless Summer”.
Pathway DefinitionPathwayGene Number
Glycolysis/gluconeogenesisko00010165
Starch and sucrose metabolismko00500159
Amino sugar and nucleotide sugar metabolismko00520133
Pentose and glucuronate interconversionsko0004086
Citrate cycle (TCA cycle)ko0002069
Pentose phosphate pathwayko0003066
Plant hormone signal transductionko04075274
Table 4. Flowering-related GO terms of H. macrophylla “Endless Summer”.
GO IDTermGene Number
GO:0009908Flower development234
GO:0030154Cell differentiation183
GO:0040008Regulation of growth172
GO:0009555Pollen development146
GO:0007623Circadian rhythm104
GO:0009909Regulation of flower development104
GO:0009860Pollen tube growth86
GO:0009846Pollen germination76
GO:0048573Photoperiodism, flowering52
GO:0009911Positive regulation of flower development41
GO:0042752Regulation of circadian rhythm41
GO:0080092Regulation of pollen tube growth33
GO:0010073Meristem maintenance32
GO:0010584Pollen exine formation32
GO:0048653Anther development28
GO:0048443Stamen development25
GO:0010229Inflorescence development21
GO:0010228Vegetative to reproductive phase transition of meristem87
GO:0009910Negative regulation of flower development38
GO:2000028Regulation of photoperiodism, flowering37
Table 5. The primer sequences used in qRT-PCR.
Gene NameForward Primer Sequence (5′–3′)Reverse Primer Sequence (5′–3′)
RPL34ACCCCCGGTGGAAAGCTAGTACGGTTCACAGTCCTCCGGT
AP1GGCAATCCAAGACCAGAATGGCAGCAGGAATGAAGATG
FTCCTAGTGACCCGAACCTTAGACAGTCTGACGACCCAAC
LFYTGAGCAGTGCCGTGATTTGCCTTCTTGGCATACCTG
COL9CTATAAACTCGGTGGCTGACTGACACGACCACATCTCACT
G2OX6GAACCCTACACTGAGTCTTACCGGAGGTCGATTACAGGAAG
SPL9TCTATTGTCATCTCGCTACGGTGCTCTGCCAAGGATGTGG
Table 6. The reaction system and program for qRT-PCR.
The Reaction SystemThe Reaction Process
TB Green Premix Ex Taq II10 μLPre-denaturation95 °C30 s1 cycle
Forward Primer4 μLPCR reaction95 °C5 s40 cycles
Reverse Primer4 μL60 °C30 s
cDNA2 μL72 °C30 s
Total volume20 μLMelting curve60–95 °C15 s
Disclaimer/Publisher’s Note: The statements, opinions and data contained in all publications are solely those of the individual author(s) and contributor(s) and not of MDPI and/or the editor(s). MDPI and/or the editor(s) disclaim responsibility for any injury to people or property resulting from any ideas, methods, instructions or products referred to in the content.

