Article

Thiosemicarbazones Can Act Synergistically with Anthracyclines to Downregulate CHEK1 Expression and Induce DNA Damage in Cell Lines Derived from Pediatric Solid Tumors

1
Department of Experimental Biology, Faculty of Science, Masaryk University, 61137 Brno, Czech Republic
2
International Clinical Research Center, St. Anne’s University Hospital, 65691 Brno, Czech Republic
*
Authors to whom correspondence should be addressed.
These authors contributed equally to this work.
Int. J. Mol. Sci. 2022, 23(15), 8549; https://doi.org/10.3390/ijms23158549
Submission received: 1 July 2022 / Revised: 28 July 2022 / Accepted: 29 July 2022 / Published: 1 August 2022
(This article belongs to the Special Issue Novel Therapeutic Strategies for Cancer)

Abstract

:
Anticancer therapy by anthracyclines often leads to the development of multidrug resistance (MDR), with subsequent treatment failure. Thiosemicarbazones have been previously suggested as suitable anthracycline partners due to their ability to overcome drug resistance through dual Pgp-dependent cytotoxicity-inducing effects. Here, we focused on combining anthracyclines (doxorubicin, daunorubicin, and mitoxantrone) and two thiosemicarbazones (DpC and Dp44mT) for treating cell types derived from the most frequent pediatric solid tumors. Our results showed synergistic effects for all combinations of treatments in all tested cell types. Nevertheless, further experiments revealed that this synergism was independent of Pgp expression but rather resulted from impaired DNA repair control leading to cell death via mitotic catastrophe. The downregulation of checkpoint kinase 1 (CHEK1) expression by thiosemicarbazones and the ability of both types of agents to induce double-strand breaks in DNA may explain the Pgp-independent synergism between anthracyclines and thiosemicarbazones. Moreover, the concomitant application of these agents was found to be the most efficient approach, achieving the strongest synergistic effect with lower concentrations of these drugs. Overall, our study identified a new mechanism that offers an avenue for combining thiosemicarbazones with anthracyclines to treat tumors regardless the Pgp status.

1. Introduction

Anthracyclines belong to a class of natural cytotoxic antibiotics and represent highly potent antineoplastic agents widely used to treat a variety of tumor types [1]. Since the early 1970s, when the first compounds from the anthracycline class—doxorubicin (DOX) and daunorubicin (DAU)—were approved for clinical use, anthracyclines have been therapeutically used as potent anticancer drugs [1,2,3]. Their cytotoxic and cytostatic effects result from the combination of different mechanisms, i.e., intercalation into DNA, induction of oxidative stress, and poisoning of the topoisomerase II enzyme (TOP2) [4,5]. In general, DOX is usually indicated for treating lymphomas, sarcomas, and other solid tumors (bone tumors, lung carcinoma, bladder carcinoma, breast carcinoma, and cervical carcinoma), whereas DAU is more active on lymphoblastic and acute myeloblastic leukemia [1].
Despite its efficacy, anthracycline therapy is associated with cumulative dose-dependent cardiotoxic side effects, such as ventricular contractility and cardiomyopathy, leading to heart failure [6]. The other common side effects include acute nausea and vomiting, stomatitis, gastrointestinal disturbances, baldness, alopecia, neurologic disturbances (dizziness, hallucinations, and vertigo), and bone marrow aplasia [7]. Because of this toxicity, anthracyclines are often used in lower concentrations as a component in combination therapies [3]. To improve the therapeutic profile of anthracyclines, a synthetic anthracenedione—mitoxantrone (MIT)—was developed. This drug is routinely used in the treatment of lymphomas, leukemias, breast carcinoma, and prostate carcinoma [8].
In addition to the cardiotoxicity of anthracyclines, chemoresistance is a major reason for the failure of anthracycline therapy [9]. In general, the emergence of resistance to anthracyclines in malignant cells is a multifactorial process [9]. One of the main mechanisms is often associated with the acquisition of multidrug resistance (MDR) conferred by overexpression of permeability glycoprotein-1 (Pgp) [10,11,12]. Pgp is an efflux pump induced by drugs, heat shock, some natural products, environmental stress, and other nonspecific stress factors [9]. To date, several approaches have been explored to overcome MDR induced by Pgp [9], e.g., formulation of nanodelivery systems for anthracyclines [13,14,15], anthracycline derivatives with improved properties [16,17,18,19,20,21], and gene-targeted downregulation or pharmacological inhibition of Pgp [22,23,24,25,26].
Another promising strategy for overcoming Pgp-mediated drug resistance is based on combining DOX with thiosemicarbazones—di-2-pyridylketone 4-cyclohexyl-4-methyl-3-thiosemicarbazone (DpC) and di-2-pyridylketone 4,4-dimethyl-3-thiosemicarbazone (Dp44mT)—to directly leverage lysosomal Pgp transport activity [27,28]. Previously, Pgp was shown to be topologically inverted during the endocytic process, thus facing into lysosomes, leading to lysosomal loading of Pgp substrates [29,30,31]. Therefore, in cells with high Pgp expression, Pgp mediates not only drug efflux through the plasma membrane [32], but also increased drug trapping within lysosomes, creating drug “safe houses”, which can be observed [29]. DOX, DAU, and MIT were defined as lysosomotropic drugs on the basis of their pKa values, i.e., at acidic pH, these compounds are protonated and trapped in lysosomes, preventing their distribution to major targets in the nucleus [29]. DpC and Dp44mT are also Pgp substrates, and, in cells with MDR, they are transported via Pgp into lysosomes, where they are trapped due to protonation in a manner identical to anthracycline trapping [30,33,34,35]. However, positively charged thiosemicarbazones can bind copper and enter redox cycles to generate reactive oxygen species (ROS) that induce lysosomal membrane permeabilization (LMP) and subsequent proapoptotic signaling [27,30,33,34,35]. Moreover, LMP enables the release of stored anthracyclines from lysosomes, leading to restoration of their cytotoxic activity [27]. According to this mechanism, synergistic interactions between anthracyclines and thiosemicarbazones are expected to be beneficial predominantly in MDR malignant cells with typically high Pgp expression.
In this study, we focused for the first time on the combination of anthracyclines with thiosemicarbazones in pediatric solid tumors. Due to the improvement of therapeutic strategies, from aggressive surgical approaches to multimodal approaches with neoadjuvant chemotherapeutic treatments, almost 83% of children with a diagnosis of cancer become long-term survivors [36,37]. However, the use of new drugs has led to malignant acquisition of MDR, which is currently the leading cause of treatment failure in pediatric oncology [37]. Here, we aimed to address this problem and we present results that revealed a previously unrecognized mode of synergistic interaction between anthracyclines and thiosemicarbazones in model cell lines derived from pediatric solid tumors.

2. Results

2.1. SH-SY5Y Cells: The Only Tested Cell Line with High Pgp Expression

The first step in our study was to determine Pgp expression in untreated cell lines. For correct evaluation, two cervical carcinoma cell lines were used: KB-V1 cells with typical high Pgp expression were used as positive controls and KB-3-1 cells with minimal Pgp expression were used as negative controls. Analysis by qPCR revealed high ABCB1 (the gene encoding Pgp) expression only in the SH-SY5Y neuroblastoma cells (Figure 1A). ABCB1 mRNA level in the SK-N-BE(2) neuroblastoma, Saos-2 osteosarcoma, and Daoy medulloblastoma cells was lower than it was in the SH-SY5Y cells, whereas ABCB1 expression in the RD rhabdomyosarcoma cell line was comparable with that in the negative control cells (Figure 1A). The results obtained using immunoblotting proved that the Pgp level was high only in the SH-SY5Y cells (Figure 1B, Supplementary Figure S1). Moreover, to verify the obtained results, Pgp immunofluorescence staining was performed, and the results confirmed that Pgp signals were high only in the positive control and SH-SY5Y cells (Figure 2).

2.2. Thiosemicarbazones Acted Mainly Synergistically with Anthracyclines

The investigation continued with the quantification of the synergy between the thiosemicarbazones (DpC and Dp44mT) and anthracyclines (DOX, DAU, and MIT) using MTT assays with a subsequent analysis performed using Calcusyn software (Figure 3). The hypothesis on the synergy between these compounds was based on previously published findings [27,28] that described the synergistic effect of thiosemicarbazones and anthracyclines in overcoming Pgp-mediated multidrug resistance.
First, the treatment was applied in the consecutive design treatment (Figure 3A). IC50 dose of DpC and Dp44mT (for 24 h) was determined according to the micromolar concentration (Table 1), whereas the IC50 dose of all the anthracyclines (used for 72 h) varied according to the nanomolar concentrations (Table 1).
The computational analyses of synergy showed that the combination of a thiosemicarbazone and anthracycline acted synergistically in four cell lines: SH-SY5Y, SK-N-BE(2), Daoy, and RD cells (Table 2). In the Saos-2 cell line, the analysis revealed moderate antagonism for each compound combination (Table 2).
In the next step, 200 nM Valspodar (VAL), a selective inhibitor of Pgp, was added to the consecutive design treatment to verify whether the mechanism of synergy was based on lysosomal sequestration of the compounds via Pgp (Figure 3B). We expected to observe a change in the compound interactions because of a synergistic, an additive, or even an antagonistic effect. The results did not confirm this expectation—synergistic effects were observed even after Pgp inhibition (Table 2). Moreover, treatment with VAL changed the moderate antagonistic effect of all compound groups in Saos-2 cells to a synergistic effect (Table 2).
As an additional analysis of anthracycline sequestration into lysosomes, fluorescence microscopy was performed. DOX is an autofluorescent compound, which allowed us to observe its effect on cells 2 h after its addition to the culture medium. For this purpose, the DOX concentration was increased to 10 µM. The lysosomes were visualized by indirect staining using an anti-LAMP-2 antibody. KB-V1 cells served as positive controls for the expected lysosomal sequestration of DOX (Figure 4A, Supplementary Figure S2A), whereas KB-3-1 cells served as negative controls (Figure 4B, Supplementary Figure S2B).
In general, this analysis showed that DOX did not colocalize with LAMP-2 but was primarily localized to the nucleus in all five tested cell types (Figure 4C–G, Supplementary Figure S2C–G). Therefore, we rejected the hypothesis that lysosomal sequestration of anthracyclines via Pgp played a major role in the synergistic effect of thiosemicarbazones and anthracyclines in the tested cell types derived from pediatric solid tumors.
Because the initial hypothesis explaining the mechanism of synergy was rejected, we changed the design to the concomitant treatment (Figure 3C), which allowed us to use markedly lower concentrations of thiosemicarbazones necessary to achieve the same effects as those achieved with micromolar concentrations in the consecutive design. The IC50 dose (for 72 h) for both DpC and Dp44mT varied in the nanomolar range (Table 1). Moreover, synergistic interactions between thiosemicarbazones and anthracyclines after concomitant treatment were observed in all five tested cell types (Table 2). Overall, the obtained data suggested that the concomitant design of treatment was more effective, enabling usage of lower drug doses than the consecutive design of treatment. Given the serious side effects associated with anthracycline therapy, approaches that would minimize concentrations of anthracyclines while maintaining their anticancer activity are needed. Therefore, in the subsequent analyses, we focused solely on the effects of the concomitant drug application given its apparent potential to reduce nonselective toxicity of the drugs.

2.3. Thiosemicarbazones Downregulated CHEK1 Expression, Leading to Mitotic Catastrophe after These Drugs Were Combined with Anthracyclines

As synergy between both thiosemicarbazones (DpC and Dp44mT) and all three anthracyclines (DOX, DAU, and MIT) was observed in all evaluated cell lines (SH-SY5Y, SK-N-BE(2), Saos-2, Daoy, and RD cells) after both combined treatments (consecutive and concomitant designs), the possible mechanism of synergistic interaction between these compounds seemed to be universal. Therefore, we predominantly focused on the common mechanisms of action of both types of compounds used.
The first of the main effects of anthracyclines is the production of double-strand breaks (DSBs) in DNA molecules, which are associated with cell cycle arrest in the G2/M phase. To confirm this effect in our tested cell lines, propidium iodide staining with subsequent flow cytometry analysis was performed to identify the changes in the cell cycle after 3 days of treatment with IC50 doses of DOX, DAU, and MIT. Cell cycle arrest in the G2/M phase was detected in four of the tested cell lines: SK-N-BE(2), Saos-2, Daoy, and RD cells (Figure 5, Supplementary Table S1). For the SH-SY5Y cells, only an increased proportion of cells in the sub-G1 phase, which is associated with formation of apoptotic bodies, was detected (Figure 5, Supplementary Table S1). Arrest in the G2/M phase would likely have been observed in an earlier phase of treatment, i.e., after 24 or 48 h.
For apoptosis induction based on the production of DSBs in DNA, it is essential to force cells with damaged DNA to bypass cell cycle arrest in the S/G2 phase and enter mitosis, which can lead to mitotic catastrophe [38,39]. Therefore, we investigated the ability of thiosemicarbazones, DOX, or their combinations to downregulate the expression of checkpoint kinase 1 and 2 (CHEK1 and CHEK2) at IC50 doses after 3 days. Immunoblotting revealed that both thiosemicarbazones effectively decreased CHEK1 levels in the SH-SY5Y, Saos-2, and Daoy cell lines, and a slight decrease in CHEK1 levels was also observed in the SK-N-BE(2) and RD cells (Figure 6A–E, Supplementary Figure S3A–E). DOX reduced the levels of CHEK1 less effectively than the thiosemicarbazones in all of the tested cell lines, and combined treatment caused a greater decrease in CHEK1 levels compared with single-compound treatments only in the SH-SY5Y cells (Figure 6A, Supplementary Figure S3A). In contrast, CHEK2 levels were almost completely abrogated in all the tested cell lines after treatment with DOX (Figure 6A–E, Supplementary Figure S3A–E). DpC and Dp44mT also decreased the CHEK2 levels in SH-SY5Y, SK-N-BE(2), Saos-2, and Daoy cells but less effectively than DOX (Figure 6A–D, Supplementary Figure S3A–D). The combined treatment did not achieve any enhanced effects considering the very strong inhibitory effect of DOX (Figure 6A–E, Supplementary Figure S3A–E). Regarding the obtained results, we can assume that downregulation of both checkpoint kinases by combined treatment with thiosemicarbazones and DOX can lead to the effective abrogation of the cell cycle checkpoint and the subsequent induction of mitotic catastrophe in cancer cells with damaged DNA.

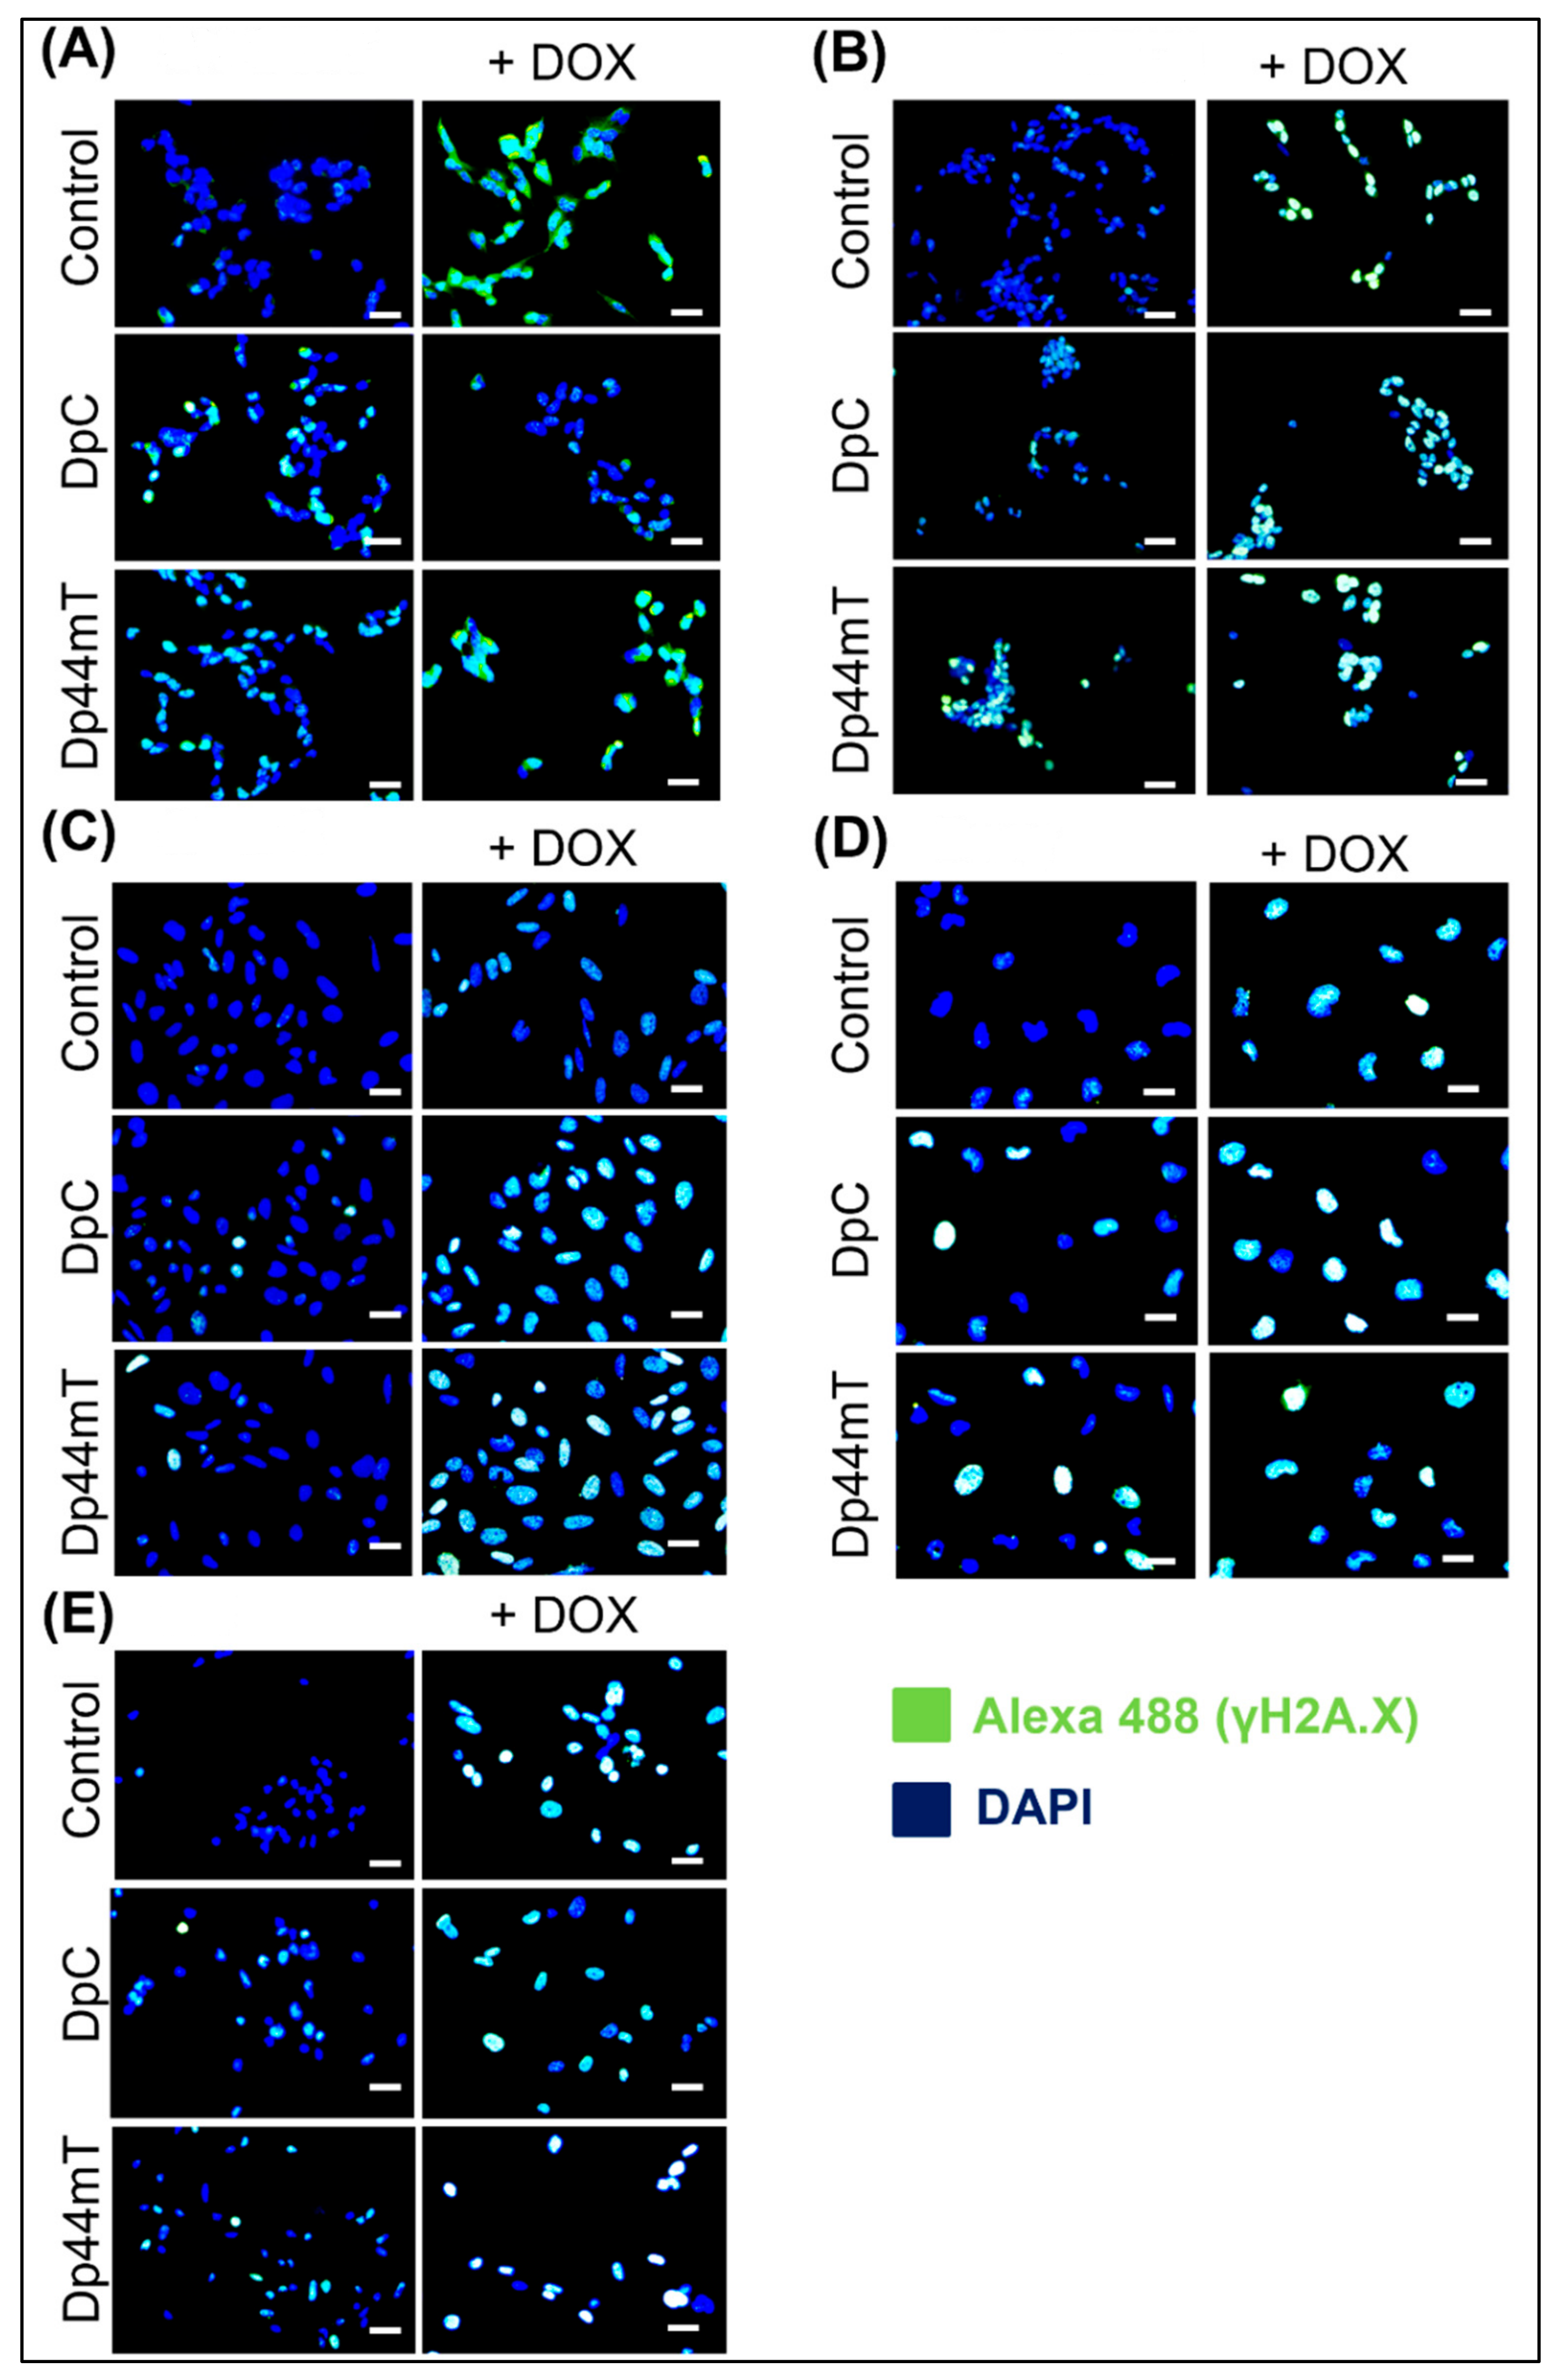
2.4. Thiosemicarbazones Can Induce DSBs in DNA

In addition, the ability of thiosemicarbazones to produce DSBs in DNA (similar to anthracyclines) was investigated as a possible mechanism contributing to combination treatment synergy. The generation of DSBs after the selected treatment was verified by indirect immunofluorescence staining of the phosphorylated γ-H2AX protein, which is considered a biomarker of DSBs [40]. Staining was performed after 2 days of treatment with DpC, Dp44mT, or DOX alone and with their combinations (DpC + DOX or Dp44mT + DOX). The results obtained after 2 days showed that the IC50 doses of thiosemicarbazones caused γ-H2AX activation in all tested cell lines (Figure 7A–E, Supplementary Figure S4A–E). In general, the rate of DNA damage was apparently more intense after DOX treatment than after thiosemicarbazone treatment (Figure 7A–E, Supplementary Figure S4A–E). Enhanced DNA damage after administration of the DpC + DOX and Dp44mT + DOX combinations, compared to that after each compound was administered alone, was observed only in the Saos-2 cells (Figure 7C, Supplementary Figure S4C). Nevertheless, this method demonstrated that even nanomolar concentrations of DpC and Dp44mT induce DSBs in DNA.

3. Discussion

The obtained results proved the synergism of the combined thiosemicarbazone and anthracycline treatments in all chosen cell lines derived from pediatric solid tumors but also demonstrated that overcoming drug resistance mediated by Pgp is not the main mechanism of the observed synergism, as initially hypothesized. Accordingly, another synergistic mechanism based on enhanced DNA damage and the inhibition of checkpoint kinases was suggested.
Considering previous studies that demonstrated a positive correlation between Pgp expression and the synergistic action of thiosemicarbazones in combination with DOX [27,30,33,41], we started the investigation with Pgp screening in the chosen cell lines derived from childhood tumors. High Pgp expression at the mRNA and protein levels was found only in the SH-SY5Y cells. In the other cell lines, Pgp expression was very similar to that in the negative control cells. Therefore, the synergy of anthracycline and thiosemicarbazone treatments was expected only in SH-SY5Y cells.
To evaluate interactions between compound combinations, we first used a consecutive design of treatment, which was reported as effective in the literature [27]. Contrary to the predictions, synergistic action of thiosemicarbazones and anthracyclines in combination was found for four of the five cell lines. Therefore, to verify the main role of Pgp in the synergistic mechanism, VAL, a selective inhibitor of Pgp, was added to the consecutive design of treatment. In this regimen for compound application, we expected to see a change from synergistic action to an additive effect or even antagonism. Interestingly, the synergy between the thiosemicarbazones and anthracyclines was found in all five cell lines. Moreover, the analysis using fluorescence microscopy demonstrating primary localization of DOX to the nucleus in all cell lines contributed to the definitive rejection of the initial hypothesis stating that the main synergistic mechanism in chosen cell lines is based on lysosomal sequestration of Pgp.
To explore the least toxic regimen of treatment, we decided to change the combined treatment design from a consecutive to concomitant application of the drugs. With this change, we were not only able to reduce the thiosemicarbazone IC50 doses from the micromolar to nanomolar level, but were also able to observe synergistic action of the compound treatments in all five cell lines. Therefore, it can be concluded that concomitant application is the most convenient administration regimen for the combined treatment of anthracyclines and thiosemicarbazones in the tested cell lines.
Since the suitable application of the selected compounds was determined, the next objective was to describe the possible mechanism of the observed synergy. The mechanism seemed to be universal because all the combinations of DpC or Dp44mT with DOX, DAU, or MIT acted synergistically in four different cell types (neuroblastoma, medulloblastoma, osteosarcoma, and rhabdomyosarcoma cells). Therefore, we focused on the common features of thiosemicarbazone and anthracycline mechanisms of action.
The cytotoxic activity of anthracyclines is exerted through several mechanisms. In addition to their ability to intercalate between base pairs of DNA and induce ROS generation, anthracyclines can inhibit TOP2 activity by covalently binding to the DNA–TOP2 complex [5]. The potential lethality of stabilized DNA–TOP2 complexes is markedly increased during DNA replication, when the replication fork attempts to traverse this structure and convert transient single- or double-strand breaks into permanent double-stranded fractures [42]. Stalled DNA replication activates ataxia telangiectasia, Rad3-related (ATR) kinase, and, subsequently, CHEK1, which leads to cell cycle arrest mediated by cyclin A-Cdk2 inhibition [43,44].
In addition, ROS generated by anthracyclines cause DSBs in DNA and activate ATM-dependent pathways [45]. ATM kinase phosphorylates CHEK2, resulting in the inhibition of cyclin E-Cdk2 complexes and subsequent cell cycle arrest [46].
There is evidence of cross-talk and functional redundancy between ATR-CHEK1 and ATM-CHEK2 after anthracycline treatment. It was proven that DNA damage caused by DOX elicits both check kinase pathways [47].
The stabilization of the DNA–TOP2 complex, manifesting as DNA breaks, was observed after treatment with Dp44mT in a breast cancer cell type [48]. According to the observed expression of γH2A.X—a specific reporter of DSBs [49,50,51], our results indicate that both DpC and Dp44mT caused DNA damage in the neuroblastoma, medulloblastoma, osteosarcoma, and rhabdomyosarcoma cell types. This analysis revealed that both thiosemicarbazones can induce DSBs but with much less efficiency than DOX.
One promising strategy for enhancing the effect of anthracyclines is based on their combined application with drugs targeting cell cycle checkpoints (CHEK1 and CHEK2). In general, cell cycle arrest is a major mechanism of cellular resistance to drugs that cause DNA damage [52,53]. Therefore, TOP2 inhibitors can be combined with drugs inhibiting the checkpoint kinase pathways and administered to force cancer cells to bypass cell cycle arrest and enter mitosis with DNA damage, which leads to mitotic catastrophe [38,39]. For drug combinations with DOX, it was previously demonstrated that the double inhibition of CHEK1 and CHEK2 did not achieve better efficacy than inhibition of CHEK1 alone. Thus, only inhibition of CHEK1 abolishes DOX-induced cell cycle arrest followed by mitotic catastrophe [54]. Our investigations proved that both DpC and Dp44mT can downregulate CHEK1 in all tested cell lines derived from the most frequent pediatric solid tumors.
Regarding the obtained results, we can assume that the observed synergy between the selected thiosemicarbazones and anthracyclines is based on the following mechanism. Both types of compounds, thiosemicarbazones and anthracyclines, cause DNA damage by inducing replication fork stalling and ROS production. Therefore, their combined treatment leads to an increase in DSB induction. Moreover, thiosemicarbazones decrease CHEK1 expression and, thus, help cells with damaged bypass arrest, increasing the rate of cells undergoing mitotic catastrophe. Together, our results suggest a new mechanism of synergism between thiosemicarbazones and anthracyclines that is effective in tumor cells regardless of the Pgp expression.

4. Materials and Methods

4.1. Chemicals

The selected thiosemicarbazones Dp44mT (Cat. No. SML0186) and DpC (Cat. No. SML0483), the DOX (Cat. No. D2975000), DAU (Cat. No. D0125000), and MIT (Cat. No. M2305000), and Pgp inhibitor VAL (Cat. No. SML0572) were obtained from Sigma-Aldrich (St. Louis, MO, USA). All chemicals were prepared as stock solutions in DMSO (Cat. No. D8418, Sigma-Aldrich) and then diluted in cell culture medium to achieve a DMSO concentration < 0.5% (v/v), which has been shown to have no effect on cell proliferation relative to the control medium [55]. To prepare the stock solution, DpC, Dp44mT, MIT, and VAL were dissolved to reach a concentration of 100 mM; similarly, the DOX and DAU concentrations were each 10 mM.

4.2. Cell Culture

RD rhabdomyosarcoma cell line (Cat. No. 85111502), SH-SY5Y (Cat. No. 94030304), and the SK-N-BE(2) (Cat. No. 95011815) neuroblastoma cell lines were purchased from the European Collection of Authenticated Cell Cultures (Salisbury, UK). The Daoy medulloblastoma cell line (Cat. No. HTB-186) and Saos-2 osteosarcoma cell line (Cat. No. HTB-85) were purchased from the American Type Culture Collection (Manassas, VA, USA). The KB-3-1 and KB-V1 cervical carcinoma cell lines were gifts from Prof. Nóra Kucsma (Szakács Gergely’s Laboratory, Budapest, Hungary). The selected cell lines were cultured in various culture media, as shown in Table 3, and maintained under standard cell culture conditions: 37 °C in an atmosphere of 95% air and 5% CO2. All reagents for cell culture were purchased from Biosera (Nuaille, France).

4.3. Treatment Protocol

MTT proliferation assays were used to determine the IC50 values for the anthracyclines and thiosemicarbazones in the SH-SY5Y, SK-N-BE(2), Saos-2, Daoy, and RD cell lines. The cells were seeded in 96-well plates at a density of 5 × 10³ cells/well (SH-SY5Y, SK-N-BE(2), Saos-2, and RD cells) or 2 × 10³ cells/well (Daoy cells) in 100 µL of complete DMEM, and then allowed to adhere overnight. Different seeding densities for the cell lines were chosen to ensure that the cells remained in the log phase of growth during all 3 days of treatment. The IC50 values for the individual compounds were calculated from the growth inhibition curves obtained after treatment with increasing compound concentrations based on the initial estimated IC50 values (⅛-, ¼-, ½-, 1-, 2-, 4-, and 8-fold of the estimated initial IC50). The IC50 values for both anthracyclines and thiosemicarbazones were obtained after 3 days of treatment. For thiosemicarbazones only, the IC50 values were also obtained after 1 day of treatment.
To determine the combination index (CI) value, three different experimental designs of compound application were chosen (Figure 3). The “consecutive design” (Figure 3A) included the pretreatment of cells with an anthracycline (DOX, DAU, or MIT) only. After 48 h, DpC or Dp44mT was added to the cells undergoing anthracycline treatment. Proliferation was evaluated after 24 h using MTT assay. The second experimental design, labeled “+ Valspodar” (Figure 3B), was the same as the “consecutive design” with the addition of 200 nM VAL along with the anthracycline in the first treatment step. In the “concomitant design” (Figure 3C), both anthracyclines and thiosemicarbazones were added in combination to the cells. Proliferation was evaluated using MTT assay after 72 h of culture. Growth inhibition curves for compound combinations were constructed for increasing drug concentrations based on previously determined IC50 values (⅛-, ¼-, ½-, 1-, 2-, 4-, and 8-fold of the previously determined IC50).
For direct observation of DOX administration in cells, the cells were seeded onto coverslips in Petri dishes (35 mm in diameter) and allowed to grow to 80% confluence at 37 °C. All the cell lines were then treated with 10 µM DOX and observed after 2 h of incubation at 37 °C.
An indirect immunofluorescence assay was employed to reveal DSBs in DNA by staining for phosphorylated histone γH2AX. The cells were seeded onto coverslips and allowed to grow to 80% confluence as described above. The cell lines were then treated with the respective IC50 doses of DOX, DpC, Dp44mT, or with their combinations (DOX + DpC or DOX + Dp44mT) and incubated at 37 °C for 2 days.
To analyze the cell cycle using propidium iodide staining, all the tested cell lines were seeded in Petri dishes (90 mm in diameter) at a density of 1 × 10⁵/dish. The cells were then treated with the respective IC50 doses of DOX, DAU, and MIT and incubated at 37 °C for 3 days.
Immunoblotting was performed to determine the levels of CHEK1 and CHEK2. The cells were seeded in the same manner as in the cell cycle analysis described above. The cells were then treated with the respective IC50 doses of DOX, DpC, Dp44mT, or with their combinations DOX + DpC or DOX + Dp44mT and incubated at 37 °C for 3 days.

4.4. Cell Proliferation

A colorimetric MTT assay was performed to evaluate the cell proliferation rate as previously described [56]. Briefly, the treated cells were incubated with MTT (0.5 mg/mL; Sigma-Aldrich) at 37 °C for 3 h. The formed formazan crystals were dissolved in 200 μL of DMSO. The absorbance was read at 570 nm with a reference absorbance of 620 nm using a Sunrise Absorbance Reader (Tecan, Männedorf, Switzerland).

4.5. Calculation of the CI

The CI values for the compound combinations were calculated to quantitatively compare the dose–effect relationship of each compound individually and in combination to determine whether a selected combination acts synergistically. CI values were obtained from growth inhibition curves using the constant ratio of the compounds in combination (1:1) as previously described [57]. The CI values were calculated using CalcuSyn software (version 2.0, Biosoft, Cambridge, UK). The Chou Talalay method was adopted to identify antagonism (CI > 1.1), additive effects (CI = 0.9–1.1), or synergism (CI < 0.9) [58].

4.6. RT-qPCR

The relative expression of selected genes was determined using RT-qPCR. Total RNA was isolated using a GenElute Mammalian Total RNA Miniprep Kit (Sigma-Aldrich) and reverse transcribed into cDNA as described previously [56]. qPCR was performed in a 10-μL volume using a Kapa Biosystems Quantitative Real-Time PCR kit (Kapa Biosystems, Wilmington, MA, USA) and analyzed using a 7500 Fast Real-Time PCR System and 7500 Software v. 2.0.6 (both obtained from Life Technologies, Carlsbad, CA, USA). To detect differences in the transcript levels among the cell types or after the treatment, Cq values normalized to the endogenous reference control (the GAPDH gene) were compared. The primer sequences used for the ABCB1 and GAPDH genes are provided in Table 4.

4.7. Immunoblotting

Protein extracts were obtained using LB1 lysis buffer (50 mM HEPES-KOH, pH 7.5; 140 mM NaCl; 1 mM EDTA; 10% glycerol; 0.5% NP-40; and 0.25% Triton X-100). Total proteins (25 μg/well) were loaded onto 8% (for Pgp analysis) or 10% (for CHEK1 and CHEK2 analysis) polyacrylamide gels and electrophoresed. The separated proteins were then blotted onto PVDF membranes (Bio-Rad Laboratories, Munich, Germany). The membranes were blocked with 5% nonfat dry milk in PBS with 0.1% Tween-20 at RT for 1 h. Subsequently, the blocked membranes were incubated overnight with primary monoclonal antibodies. The following day, the membranes were washed in TBS-Tween and incubated with secondary antibodies at RT for 1 h. The primary and secondary antibodies are listed in Table 5. ECL-Plus detection was performed according to the manufacturer’s instructions (GE Healthcare, Little Chalfont, UK). The obtained protein bands were analyzed using ImageJ software (NIH, MD, USA).

4.8. Indirect Immunofluorescence

Indirect fluorescence analysis was performed as described previously [59]. The cells on coverslips were fixed with 3% paraformaldehyde (Sigma-Aldrich) at RT for 20 min. The samples were then permeabilized with 0.2% Triton X-100 (Sigma-Aldrich) in PBS at RT for 1 min. For the DOX and LAMP-2 colocalization analysis, 0.2% Triton was replaced with 100 µM digitonin (Sigma-Aldrich), and the cells were permeabilized at RT for 10 min. The primary and secondary antibodies used for indirect fluorescence staining are listed in Table 6. Coverslips used as negative controls were prepared by omitting the primary antibody. The cell nuclei were counterstained with 0.05% Hoechst 33342 (Life Technologies, Carlsbad, CA, USA). The coverslips with stained cells were mounted using ProLong Diamond Antifade Mountant (Thermo Fisher Scientific, Waltham, MA, USA). For fluorescence evaluation, an Olympus BX-51 microscope was used; the micrographs were captured using an Olympus DP72 CCD camera and analyzed using a Cell^P imaging system (Olympus, Tokyo, Japan).

4.9. Cell Cycle Analysis Using Propidium Iodide Staining

The treated cells were harvested from Petri dishes using Accutase (Biosera, Nuaille, France) and fixed in cold 70% ethanol (Sigma-Aldrich) at 4 °C for 30 min. The fixed cells were washed with PBS, and the pellets were carefully resuspended in 100 µL of Vindelov’s staining solution (1 M Tris pH 8 (Sigma-Aldrich); 10 mM NaCl (Sigma-Aldrich); 5 µM ribonuclease A (Sigma-Aldrich); and 75 µM PI) [60]. After 30 min of incubation in Vindelov’s solution at 37 °C, the stained cells were analyzed in a FACSCanto TMII flow cytometer using BD FACS DIVA Software (Beckton Dickinson, CA, USA). The fluorescence of 10,000 cells in each sample was evaluated.

4.10. Statistical Analyses

All experiments were performed in biological triplicates (unless otherwise specified). Numerical data are presented as the means ± standard deviation (SD). The data obtained by qPCR or immunoblotting were analyzed using SPSS Statistics software (version 25.0, IBM, New York, NY, USA) by unpaired Welch’s t-test followed by the Games–Howell post hoc test. * p < 0.05 indicates significant differences compared with the respective control group.

Supplementary Materials

The supporting information can be downloaded at: https://www.mdpi.com/article/10.3390/ijms23158549/s1.

Author Contributions

Conceptualization, S.P., J.S. and R.V.; methodology, S.P., M.K., P.C., J.N. and J.S.; formal analysis, S.P.; investigation, S.P., M.K. and P.C.; resources, R.V.; data curation, S.P.; writing—original draft, S.P.; writing—review and editing, M.K., P.C., J.N., J.S. and R.V.; visualization, S.P. and P.C.; supervision, J.S. and R.V.; project administration, R.V.; funding acquisition, R.V. All authors have reviewed the manuscript and agreed to their individual contributions. All authors have read and agreed to the published version of the manuscript.

Funding

This work was supported by the Ministry of Health of the Czech Republic (project no. 17-33104A), by the Masaryk University (projects nos. MUNI/A/1522/2020 and MUNI/A/1325/2021), by the European Regional Development Fund—Project ENOCH (No. CZ.02.1.01/0.0/0.0/16_019/0000868), and by the project National Institute for Cancer Research (Programme EXCELES, ID Project No. LX22NPO5102)—Funded by the European Union—Next Generation EU.

Institutional Review Board Statement

Not applicable.

Informed Consent Statement

Not applicable.

Data Availability Statement

The data presented in this study are available in the article and the Supplementary Materials.

Acknowledgments

The authors thank Johana Maresova for her technical assistance.

Conflicts of Interest

The authors declare no conflict of interest.

References

  1. Martins-Teixeira, M.B.; Carvalho, I. Antitumour Anthracyclines: Progress and Perspectives. Chem. Med. Chem. 2020, 15, 933–948. [Google Scholar] [CrossRef] [PubMed]
  2. Nadas, J.; Sun, D. Anthracyclines as effective anticancer drugs. Expert Opin. Drug Discov. 2006, 1, 549–568. [Google Scholar] [CrossRef] [PubMed]
  3. Cortés-Funes, H.; Coronado, C. Role of anthracyclines in the era of targeted therapy. Cardiovasc. Toxicol. 2007, 7, 56–60. [Google Scholar] [CrossRef]
  4. Gewirtz, D.A. A critical evaluation of the mechanisms of action proposed for the antitumor effects of the anthracycline antibiotics adriamycin and daunorubicin. Biochem. Pharmacol. 1999, 57, 727–741. [Google Scholar] [CrossRef]
  5. Marinello, J.; Delcuratolo, M.; Capranico, G. Anthracyclines as Topoisomerase II Poisons: From Early Studies to New Perspectives. Int. J. Mol. Sci. 2018, 19, 3480. [Google Scholar] [CrossRef] [PubMed] [Green Version]
  6. Menna, P.; Paz, O.G.; Chello, M.; Covino, E.; Salvatorelli, E.; Minotti, G. Anthracycline cardiotoxicity. Expert Opin. Drug Saf. 2012, 11 (Suppl. S1), S21–S36. [Google Scholar] [CrossRef] [PubMed]
  7. Carvalho, C.; Santos, R.X.; Cardoso, S.; Correia, S.; Oliveira, P.J.; Santos, M.S.; Moreira, P.I. Doxorubicin: The good, the bad and the ugly effect. Curr. Med. Chem. 2009, 16, 3267–3285. [Google Scholar] [CrossRef]
  8. Evison, B.J.; Sleebs, B.E.; Watson, K.G.; Phillips, D.R.; Cutts, S.M. Mitoxantrone, More than Just Another Topoisomerase II Poison. Med. Res. Rev. 2016, 36, 248–299. [Google Scholar] [CrossRef] [PubMed]
  9. Capelôa, T.; Benyahia, Z.; Zampieri, L.X.; Blackman, M.C.N.M.; Sonveaux, P. Metabolic and non-metabolic pathways that control cancer resistance to anthracyclines. Semin. Cell Dev. Biol. 2020, 98, 181–191. [Google Scholar] [CrossRef]
  10. Raviv, Y.; Pollard, H.B.; Bruggemann, E.P.; Pastan, I.; Gottesman, M.M. Photosensitized labeling of a functional multidrug transporter in living drug–resistant tumor cells. J. Biol. Chem. 1990, 265, 3975–3980. [Google Scholar] [CrossRef]
  11. Nielsen, D.; Maare, C.; Poulsen, F.; Lauridsen, S.T.; Skovsgaard, T. Relationship between resistance, P-glycoprotein content and steady-state accumulation in five series of Ehrlich ascites tumour cell lines selected for resistance to daunorubicin. Cell Pharmacol. 1994, 1, 127–135. [Google Scholar]
  12. Nielsen, D.; Maare, C.; Skovsgaard, T. Kinetics of daunorubicin transport in Ehrlich ascites tumor cells with different expression of P-glycoprotein. Biochem. Pharmacol. 1994, 47, 2125–2135. [Google Scholar] [CrossRef]
  13. Shieh, M.J.; Hsu, C.Y.; Huang, L.Y.; Chen, H.Y.; Huang, F.H.; Lai, P.S. Reversal of doxorubicin-resistance by multifunctional nanoparticles in MCF-7/ADR cells. J. Control Release 2011, 152, 418–425. [Google Scholar] [CrossRef] [PubMed]
  14. Cheah, H.Y.; Šarenac, O.; Arroyo, J.J.; Vasić, M.; Lozić, M.; Glumac, S.; Hoe, S.Z.; Hindmarch, C.C.; Murphy, D.; Kiew, L.V.; et al. Hemodynamic effects of HPMA copolymer based doxorubicin conjugate: A randomized controlled and comparative spectral study in conscious rats. Nanotoxicology 2017, 11, 210–222. [Google Scholar] [CrossRef]
  15. Ma, P.; Mumper, R.J. Anthracycline Nano-Delivery Systems to Overcome Multiple Drug Resistance: A Comprehensive Review. Nano Today 2013, 8, 313–331. [Google Scholar] [CrossRef] [PubMed] [Green Version]
  16. Akasov, R.; Drozdova, M.; Zaytseva-Zotova, D.; Leko, M.; Chelushkin, P.; Marc, A.; Chevalot, I.; Burov, S.; Klyachko, N.; Vandamme, T.; et al. Novel Doxorubicin Derivatives: Synthesis and Cytotoxicity Study in 2D and 3D in Vitro Models. Adv. Pharm. Bull. 2017, 7, 593–601. [Google Scholar] [CrossRef]
  17. Weiss, R.B. The anthracyclines: Will we ever find a better doxorubicin? Semin. Oncol. 1992, 19, 670–686. [Google Scholar]
  18. Chhikara, B.S.; Mandal, D.; Parang, K. Synthesis, anticancer activities, and cellular uptake studies of lipophilic derivatives of doxorubicin succinate. J. Med. Chem. 2012, 55, 1500–1510. [Google Scholar] [CrossRef]
  19. Yu, S.; Zhang, G.; Zhang, W.; Luo, H.; Qiu, L.; Liu, Q.; Sun, D.; Wang, P.G.; Wang, F. Synthesis and biological activities of a 3′-azido analogue of Doxorubicin against drug-resistant cancer cells. Int. J. Mol. Sci. 2012, 13, 3671–3684. [Google Scholar] [CrossRef] [Green Version]
  20. Piorecka, K.; Stanczyk, W.; Florczak, M. NMR analysis of antitumor drugs: Doxorubicin, daunorubicin and their functionalized derivatives. Tetrahedron Lett. 2017, 58, 152–155. [Google Scholar] [CrossRef]
  21. Kratz, F.; Beyer, U.; Roth, T.; Tarasova, N.; Collery, P.; Lechenault, F.; Cazabat, A.; Schumacher, P.; Unger, C.; Falken, U. Transferrin conjugates of doxorubicin: Synthesis, characterization, cellular uptake, and in vitro efficacy. J. Pharm. Sci. 1998, 87, 338–346. [Google Scholar] [CrossRef] [PubMed]
  22. Callaghan, R.; Luk, F.; Bebawy, M. Inhibition of the multidrug resistance P-glycoprotein: Time for a change of strategy? Drug Metab. Dispos. 2014, 42, 623–631. [Google Scholar] [CrossRef] [PubMed] [Green Version]
  23. Ozols, R.F.; Cunnion, R.E.; Klecker, R.W., Jr.; Hamilton, T.C.; Ostchega, Y.; Parrillo, J.E.; Young, R.C. Verapamil and adriamycin in the treatment of drug-resistant ovarian cancer patients. J. Clin. Oncol. 1987, 5, 641–647. [Google Scholar] [CrossRef] [PubMed]
  24. List, A.F.; Kopecky, K.J.; Willman, C.L.; Head, D.R.; Persons, D.L.; Slovak, M.L.; Dorr, R.; Karanes, C.; Hynes, H.E.; Doroshow, J.H.; et al. Benefit of cyclosporine modulation of drug resistance in patients with poor-risk acute myeloid leukemia: A Southwest Oncology Group study. Blood 2011, 98, 3212–3220. [Google Scholar] [CrossRef] [PubMed]
  25. Dalton, W.S.; Grogan, T.M.; Meltzer, P.S.; Scheper, R.J.; Durie, B.G.; Taylor, C.W.; Miller, T.P.; Salmon, S.E. Drug-resistance in multiple myeloma and non-Hodgkin’s lymphoma: Detection of P-glycoprotein and potential circumvention by addition of verapamil to chemotherapy. J. Clin. Oncol. 1989, 7, 415–424. [Google Scholar] [CrossRef]
  26. Kim, H.G.; Hien, T.T.; Han, E.H.; Hwang, Y.P.; Choi, J.H.; Kang, K.W.; Kwon, K.I.; Kim, B.H.; Kim, S.K.; Song, G.Y.; et al. Metformin inhibits P-glycoprotein expression via the NF-κB pathway and CRE transcriptional activity through AMPK activation. Br. J. Pharmacol. 2011, 162, 1096–1108. [Google Scholar] [CrossRef] [Green Version]
  27. Seebacher, N.A.; Richardson, D.R.; Jansson, P.J. A mechanism for overcoming P-glycoprotein-mediated drug resistance: Novel combination therapy that releases stored doxorubicin from lysosomes via lysosomal permeabilization using Dp44mT or DpC. Cell Death Dis. 2016, 7, e2510. [Google Scholar] [CrossRef] [Green Version]
  28. Seebacher, N.; Lane, D.J.R.; Richardson, D.R.; Jansson, P.J. Turning the gun on cancer: Utilizing lysosomal P-glycoprotein as a new strategy to overcome multi-drug resistance. Free Radic. Biol. Med. 2016, 96, 432–445. [Google Scholar] [CrossRef]
  29. Yamagishi, T.; Sahni, S.; Sharp, D.M.; Arvind, A.; Jansson, P.J.; Richardson, D.R. P-glycoprotein mediates drug resistance via a novel mechanism involving lysosomal sequestration. J. Biol. Chem. 2013, 288, 31761–31771. [Google Scholar] [CrossRef] [Green Version]
  30. Jansson, P.J.; Yamagishi, T.; Arvind, A.; Seebacher, N.; Gutierrez, E.; Stacy, A.; Maleki, S.; Sharp, D.; Sahni, S.; Richardson, D.R. Di-2-pyridylketone 4,4-dimethyl-3-thiosemicarbazone (Dp44mT) overcomes multidrug-resistance by a novel mechanism involving the hijacking of lysosomal P-glycoprotein (Pgp). J. Biol. Chem. 2015, 290, 9588–9603. [Google Scholar] [CrossRef] [Green Version]
  31. Seebacher, N.A.; Lane, D.J.R.; Jansson, P.J.; Richardson, D.R. Glucose modulation induces lysosome formation and increases lysosomotropic drug sequestration via the P-glycoprotein drug transporter. J. Biol. Chem. 2016, 291, 3796–3820. [Google Scholar] [CrossRef] [PubMed] [Green Version]
  32. Gottesman, M.M. Multidrug resistance in cancer: Role of ATP-dependent transporters. Nat. Rev. Cancer 2002, 2, 48–58. [Google Scholar] [CrossRef] [PubMed] [Green Version]
  33. Lovejoy, D.B.; Jansson, P.J.; Brunk, U.T.; Wong, J.; Ponka, P.; Richardson, D.R. Antitumor Activity of Metal-Chelating Compound Dp44mT Is Mediated by Formation of a Redox-Active Copper Complex That Accumulates in Lysosomes. Cancer Res. 2011, 71, 5871–5880. [Google Scholar] [CrossRef] [PubMed] [Green Version]
  34. Gutierrez, E.M.; Seebacher, N.A.; Arzuman, L.; Kovacevic, Z.; Lane, D.J.; Richardson, V.; Merlot, A.M.; Lok, H.; Kalinowski, D.S.; Sahni, S.; et al. Lysosomal membrane stability plays a major role in the cytotoxic activity of the anti-agent, di-2-pyridylketone 4,4-dimethyl-3-thiosemicarbazone (Dp44mT). Biochim. Biophys. Acta 2016, 1863, 1665–1681. [Google Scholar] [CrossRef] [PubMed]
  35. Stacy, A.E.; Palanimuthu, D.; Bernhardt, P.V.; Kalinowski, D.S.; Jansson, P.J.; Richardson, D.R. Zinc(II)-thiosemicarbazone complexes are localized to the lysosomal compartment where they transmetallate with copper ions to induce cytotoxicity. J. Med. Chem. 2016, 59, 4965–4984. [Google Scholar] [CrossRef] [PubMed]
  36. Siegel, R.L.; Miller, K.D.; Jemal, A. Cancer statistics, 2016. CA Cancer J. Clin. 2016, 66, 7–30. [Google Scholar] [CrossRef] [PubMed] [Green Version]
  37. Fruci, D.; Cho, W.C.S.; Nobili, V.; Locatelli, F.; Alisi, A. Drug Transporters and Multiple Drug Resistance in Pediatric Solid Tumors. Curr. Drug Metab. 2016, 17, 308–316. [Google Scholar] [CrossRef]
  38. Vitale, I.; Galluzzi, L.; Castedo, M.; Kroemer, G. Mitotic catastrophe: A mechanism for avoiding genomic instability. Nat. Rev. Mol. Cell Biol. 2011, 12, 385–392. [Google Scholar] [CrossRef] [PubMed]
  39. Chen, Z.; Zhang, D.; Yue, F.; Zheng, M.; Kovacevic, Z.; Richardson, D.R. The Iron Chelators Dp44mT and DFO Inhibit TGF-β-induced Epithelial-Mesenchymal Transition via Up-Regulation of N-Myc Downstream-regulated Gene 1 (NDRG1). J. Biol. Chem. 2012, 287, 17016–17028. [Google Scholar] [CrossRef] [Green Version]
  40. Kuo, L.J.; Yang, L.X. Gamma-H2AX—A novel biomarker for DNA double-strand breaks. In Vivo 2008, 22, 305–309. [Google Scholar]
  41. Stacy, A.E.; Palanimuthu, D.; Bernhardt, P.V.; Kalinowski, D.S.; Jansson, P.J.; Richardson, D.R. Structure-activity relationships of di-2-pyridylketone, 2-benzoylpyridine and 2-acetylpyridine thiosemicarbazones for overcoming Pgp-mediated drug resistance. J. Med. Chem. 2016, 59, 8601–8620. [Google Scholar] [CrossRef] [PubMed]
  42. Hande, K.R. Etoposide: Four decades of development of a topoisomerase II inhibitor. Eur. J. Cancer 1998, 34, 1514–1521. [Google Scholar] [CrossRef]
  43. Kastan, M.B.; Bartek, J. Cell-cycle checkpoints and cancer. Nature 2004, 432, 316–323. [Google Scholar] [CrossRef] [PubMed]
  44. Visconti, R.; Della Monica, R.; Grieco, D. Cell cycle checkpoint in cancer: A therapeutically targetable double-edged sword. J. Exp. Clin. Cancer Res. 2016, 35, 153. [Google Scholar] [CrossRef] [PubMed] [Green Version]
  45. Kurz, E.U.; Douglas, P.; Lees-Miller, S.P. Doxorubicin activates ATM-dependent phosphorylation of multiple downstream targets in part through the generation of reactive oxygen species. J. Biol. Chem. 2004, 279, 53272–53281. [Google Scholar] [CrossRef] [Green Version]
  46. Bartek, J.; Lukas, J. Pathways governing G1/S transition and their response to DNA damage. FEBS Lett. 2001, 490, 117–122. [Google Scholar] [CrossRef] [Green Version]
  47. Mustofa, M.K.; Tanoue, Y.; Tateishi, C.; Vaziri, C.; Tateishi, S. Roles of CHEK2/CHEK2 in guarding against environmentally induced DNA damage and replication-stress. Environ. Mol. Mutagenes. 2020, 61, 730–735. [Google Scholar] [CrossRef] [PubMed]
  48. Rao, V.A.; Klein, S.R.; Agama, K.K.; Toyoda, E.; Adachi, N.; Pommier, Y.; Shacter, E.B. The Iron Chelator Dp44mT Causes DNA Damage and Selective Inhibition of Topoisomerase IIα in Breast Cells. Cancer Res. 2009, 69, 948–957. [Google Scholar] [CrossRef] [PubMed] [Green Version]
  49. Banáth, J.P.; Olive, P.L. Expression of phosphorylated histone H2AX as a surrogate of cell killing by drugs that create DNA double-strand breaks. Cancer Res. 2003, 63, 4347–4350. [Google Scholar]
  50. Olive, P.L. Detection of DNA damage in individual cells by analysis of histone H2AX phosphorylation. Methods Cell Biol. 2004, 75, 355–373. [Google Scholar] [CrossRef]
  51. Takahashi, A.; Ohnishi, T. Does gammaH2AX foci formation depend on the presence of DNA double strand breaks? Cancer Lett. 2005, 229, 171–179. [Google Scholar] [CrossRef] [PubMed]
  52. Hartwell, L.H.; Kastan, M.B. Cell cycle control and cancer. Science 1994, 266, 1821–1828. [Google Scholar] [CrossRef] [PubMed]
  53. Zhou, B.B.; Elledge, S.J. The DNA damage response: Putting checkpoints in perspective. Nature 2000, 408, 433–439. [Google Scholar] [CrossRef] [PubMed]
  54. Xiao, Z.; Xue, J.; Sowin, T.J.; Rosenberg, S.H.; Zhang, H. A novel mechanism of checkpoint abrogation conferred by CHEK1 downregulation. Oncogene 2005, 24, 1403–1411. [Google Scholar] [CrossRef] [PubMed] [Green Version]
  55. Richardson, D.R.; Tran, E.H.; Ponka, P. The potential of iron chelators of the pyridoxal isonicotinoyl hydrazone class as effective antiproliferative agents. Blood 1995, 86, 4295–4306. [Google Scholar] [CrossRef] [Green Version]
  56. Krzyzankova, M.; Chovanova, S.; Chlapek, P.; Radsetoulal, M.; Neradil, J.; Zitterbart, K.; Sterba, J.; Veselska, R. LOX/COX inhibitors enhance the antineoplastic effects of all-trans retinoic acid in osteosarcoma cell lines. Tumor Biol. 2014, 35, 7617–7627. [Google Scholar] [CrossRef]
  57. Lovejoy, D.B.; Sharp, D.M.; Seebacher, N.; Obeidy, P.; Prichard, T.; Stefani, C.; Basha, M.T.; Sharpe, P.C.; Jansson, P.J.; Kalinowski, D.S.; et al. Novel Second-Generation Di-2-Pyridylketone Thiosemicarbazones Show Synergism with Standard Chemotherapeutics and Demonstrate Potent Activity against Lung Cancer Xenografts after Oral and Intravenous Administration in Vivo. J. Med. Chem. 2012, 55, 7230–7244. [Google Scholar] [CrossRef]
  58. Chou, T.C. Theoretical basis, experimental design, and computerized simulation of synergism and antagonism in drug combination studies. Pharmacol. Rev. 2006, 58, 621–681. [Google Scholar] [CrossRef]
  59. Mikulenkova, E.; Neradil, J.; Zitterbart, K.; Sterba, J.; Veselska, R. Overexpression of the ∆Np73 isoform is associated with centrosome amplification in brain tumor cell lines. Tumor. Biol. 2015, 36, 7483–7491. [Google Scholar] [CrossRef]
  60. Vindeløv, L.L.; Christensen, I.J.; Nissen, N.I. A detergent-trypsin method for the preparation of nuclei for flow cytometric DNA analysis. Cytometry 1983, 3, 323–327. [Google Scholar] [CrossRef] [PubMed]
Figure 1. Measuring Pgp in the selected cell lines. KB-V1 cells were used as positive controls for ABCB1 (gene encoding Pgp) expression, whereas KB-3-1 cells were used as negative controls. All experiments were performed in biological triplicates. (A) The graph shows the mRNA expression of ABCB1 (the gene encoding Pgp) in untreated cell lines. The data were obtained using RT-qPCR. The levels of ABCB1 expression are presented as a log2-fold change based on mRNA expression relative to that of the negative control (y = 0). GAPDH served as the reference control. The data were analyzed by one sample t-test: * p < 0.05 indicates significant differences compared to the respective control group. (B) Immunoblot analysis of the endogenous Pgp level in untreated cell lines. GAPDH served as the loading control. The data are presented as the means ± SD and they were analyzed by unpaired t-test with Welch’s correction: * p < 0.05 indicates significant differences compared to the respective control group.
Ijms 23 08549 g001
Figure 2. Pgp expression in the untreated cell lines. The expression of Pgp analyzed in the untreated cell lines was visualized by indirect immunofluorescence using an anti-Pgp primary antibody and an Alexa-488-conjugated secondary antibody (green signal). Nuclei were labeled by DAPI (blue signal). KB-V1 cells served as positive controls for Pgp expression, whereas KB-3-1 cells served as negative controls. The scale bars represent 50 µm.
Ijms 23 08549 g002
Figure 3. The three different combination treatment designs used in this study. (A) The design of consecutive treatment included the pretreatment of cells for 48 h with an anthracycline/anthracenedione (either DOX, DAU, or MIT), and then either DpC or Dp44mT was added to the cells undergoing anthracycline/anthracenedione treatment for a period of 24 h. (B) To examine whether the mechanism of synergy was based on Pgp transport activity, Valspodar, a selective inhibitor of Pgp, was added to the design of consecutive treatment. (C) In the design of concomitant treatment, both anthracycline/anthracenedione (either DOX, DAU, or MIT) and thiosemicarbazones (either DpC or Dp44mT) were added in combination to the cells and proliferation was evaluated after 72 h. (D) Structure of di-2-pyridylketone 4-cyclohexyl-4-methyl-3-thiosemicarbazone (DpC) and di-2-pyridylketone 4,4-dimethyl-3-thiosemicarbazone (Dp44mT).
Ijms 23 08549 g003
Figure 4. DOX localization in cells. All cell lines were treated with 10 µM doxorubicin (DOX). The localization of DOX (red fluorescence) within cells after 2 h of treatment was observed using fluorescence microscopy. Additionally, the target organelles, lysosomes, and nuclei were stained. The lysosomes were visualized by indirect immunofluorescence using an anti-LAMP-2 primary antibody and an Alexa-488-conjugated secondary antibody (green fluorescence). The nuclei were labeled with DAPI (blue fluorescence). The KB-V1 cell line (A) served as a positive control for the lysosomal sequestration of DOX (indicated by arrows: yellow fluorescence—overlap of green and red fluorescence emissions). In contrast, the KB-3-1 cells served as a negative control (B). The analyses were performed with all five selected cell lines: SH-SY5Y (C), SK-N-BE(2) (D), Saos-2 (E), Daoy (F), and RD (G) cells. The scale bars represent 50 µm.
Ijms 23 08549 g004
Figure 5. Analysis of the cell cycle using propidium iodide staining. Cell cycle analysis of selected cell lines (SH-SY5Y, SK-N-BE(2), Saos-2, Daoy, and RD cells) was performed by quantification of the DNA content with propidium iodide staining and subsequent flow cytometry detection. Changes in the cell cycle were obtained after 72 h of treatment with IC50 doses of doxorubicin (DOX), daunorubicin (DAU), or mitoxantrone (MIT). The graphs show the mean proportion of cells (%) in the cell cycle phases: sub G1, G0/G1, S, and G2/M. The detailed table showing the means ± SD is provided in Supplementary Table S1. All experiments were performed in biological triplicates.
Ijms 23 08549 g005
Figure 6. Immunoblotting to determine CHEK1 and CHEK2 levels in selected cell lines. CHEK1 and CHEK2 expression was evaluated in the SH-SY5Y (A), SK-N-BE(2) (B), Saos-2 (C), Daoy (D), and RD (E) cell lines after 3 days of incubation with IC50 doses of DOX, DpC, Dp44mT, or their combinations. GAPDH served as the loading control. The experiments were performed in biological triplicates. The obtained data were analyzed by unpaired Welch’s t-test followed by Games–Howell post hoc test. * p < 0.05 indicates significant differences compared to the respective control group.
Ijms 23 08549 g006
Figure 7. Detection of double-strand breaks (DSBs) in DNA using immunofluorescence staining of phosphorylated γ-H2AX protein. Detection of DSBs in SH-SY5Y (A), SK-N-BE(2) (B), Saos-2 (C), Daoy (D), and RD (E) cells after 48 h of treatment with IC50 doses of DpC, Dp44mT, DOX, or their combination was performed by fluorescence microscopy. Phosphorylated γ-H2AX protein (a DSB marker) was visualized by indirect immunofluorescence using an anti-γ-H2AX primary antibody and Alexa-488-conjugated secondary antibody (green fluorescence). The nuclei were labeled by DAPI (blue fluorescence). The scale bars represent 50 µm.
Ijms 23 08549 g007
Table 1. IC50 values used for subsequent experiments.
Cell LineDOX [nM] 3DDAU [nM] 3DMIT [nM] 3DDpC [nM] 3DDp44m [nM] 3DDpC [µM] 1DDp44mT [µM] 1D
SH-SY5Y29.7 ± 4.940.2 ± 13.920.1 ± 3.63.8 ± 0.31.9 ± 0.811.1 ± 2.230.1 ± 1.5
SK-N-BE(2)40.8 ± 8.131.9 ± 8.727.0 ± 1.77.2 ± 1.24.2 ± 1.114.8 ± 2.331.1 ± 5.2
Saos-223.9 ± 2.820.8 ± 0.96.1 ± 0.64.4 ± 0.96.6 ± 0.920.0 ± 4.261.6 ± 14.9
Daoy9.8 ± 2.017.6 ± 3.37.5 ± 0.217.0 ± 3.47.9 ± 1.93.9 ± 0.60.9 ± 0.1
RD18.2 ± 3.815.7 ± 1.026.3 ± 4.413.8 ± 2.49.4 ± 0.811.5 ± 1.555.8 ± 7.7
3D indicates cultivation with the respective compound for 3 days (72 h), 1D indicates cultivation for 1 day (24 h).
Table 2. Quantitative assessment of the interactions between drugs.
Cell LineDrug CombinationTreatment Design
ConsecutiveConsecutive + ValspodarConcomitant
CISDCISDCISD
SH-SY5YDOXDp44mT0.7390.0640.7950.0620.7790.079
DpC0.7930.1270.4920.0680.6840.062
DAUDp44mT0.6550.1740.8280.0660.8420.124
DpC0.5990.0770.5880.0510.6470.161
MITDp44mT0.5070.0990.7580.1210.9210.091
DpC0.5270.0810.8980.0540.6200.222
SK-N-BE(2)DOXDp44mT0.7220.0530.5670.1170.7120175
DpC0.9740.0500.6350.0620.7950,161
DAUDp44mT0.5620.1180.5340.1170.7320.202
DpC0.6400.1400.4090.0740.6380.154
MITDp44mT0.3040.1070.5240.0490.4580.157
DpC0.5900.1370.5310.1330.5690.177
Saos-2DOXDp44mT1.1050.1020.7100.1250.6570.051
DpC1.2050.0660.5960.0570.8310.101
DAUDp44mT1.2440.2890.7120.1490.8130.135
DpC1.4220.0850.6110.1720.6720.177
MITDp44mT1.1080.1820.6100.0560.8280.112
DpC1.4390.2550.7230.1600.5270.108
DaoyDOXDp44mT0.7200.2100.5910.0781.0550.081
DpC0.5780.1380.6110.0150.6370.113
DAUDp44mT0.4740.0330.6020.1181.2750.280
DpC0.7890.1670.7880.1570.8540.103
MITDp44mT0.6630.2770.5640.1370.5010.238
DpC0.4390.0290.7460.0350.7000.175
RDDOXDp44mT0.8070.1260.4720.1080.6480.043
DpC0.7700.0080.8300.0570.7120.312
DAUDp44mT0.4580.1430.3830.0590.7730.211
DpC0.6090.0970.6710.1730.7640.118
MITDp44mT0.5010.0990.3660.0310.4930.108
DpC0.6410.0810.5410.1340.6380.127
Categories of Interactions
0.31–0.70synergism 0.91–1.10nearly additive
0.71–0.85moderate synergism 1.11–1.20slight antagonism
0.86–0.90slight synergism 1.21–1.45moderate antagonism
Computational analysis of the interaction of doxorubicin (DOX), daunorubicin (DAU), or mitoxantrone (MIT) with thiosemicarbazones (DpC or Dp44mT) was performed using Calcusyn software. The combination index (CI) was calculated from the growth inhibition curves of the compounds alone or their combinations. A ratio of 1:1 was maintained between the drugs added in combination. The method of Chou and Talalay was employed to define synergism, additive effects, or antagonism. The experiments were performed in biological triplicates.
Table 3. Composition of culture media used for culturing the selected cell lines.
Cell LineType of Medium Glucose FCSAtbGluNEAA
DaoyDMEMLow10%+++
KB-3-1DMEMHigh10%++-
KB-V1DMEM + VBLHigh 10%+++
RDDMEMHigh 10%+++
Saos-2DMEMLow 10%++-
SH-SY5YDMEM:F12 (1:1)High 20%+++
SK-N-BE(2)DMEM:F12 (1:1)High 20%+++
DMEM—Dulbecco’s modified Eagle’s medium; low glucose—1000 mg/L; high glucose—4500 mg/L; HVBL—vinblastine 1 µg/mL; FCS—fetal calf serum; Atb—streptomycin (100 μg/mL) and penicillin (100 IU/mL); Glu—2 mM L-glutamine; NEAA—1% nonessential amino acids.
Table 4. Sequences of the primers used for RT-qPCR.
GenePrimer SequenceProduct Length (bp)
ABCB1F: 5′-CTTTAGTGGAAAGACCACAGATGA-3′
R: 5′-CTTTAGTGGAAAGACCACAGATGA-3′
228
GAPDHF: 5′-AGC CAC ATC GCT CAG ACA CC-3′
R: 5′-GTA CTC AGC GCC AGC ATC G-3′
302
F—forward; R—reverse.
Table 5. Primary and secondary antibodies used for immunoblotting.
Primary antibodies
AntigenType/HostCloneCatalog No.ManufacturerDilution
GAPDHMono/Rb14C102118SCST1:10,000
CHEK1Mono/Mo2G1D52360SCST1:1000
CHEK2Mono/RbD9C66334SCST1:1000
PgpMono/MoF4P7965Sigma-Aldrich1:5000
Secondary antibodies
HostSpecificityConjugateCatalog No.ManufacturerDilution
GoatAnti-Rb IgGHRP7074CST1:5000
HorseAnti-Mo IgGHRP7076CST1:5000
Mono—monoclonal; Rb—rabbit; Mo—mouse; CST—Cell Signaling Technology Inc.; Bioss—Bioss Antibodies, Inc.
Table 6. Primary and secondary antibodies used for indirect immunofluorescence staining.
Primary antibodies
AntigenType/HostCloneCatalog No.ManufacturerDilution
PgpMono/MoF4P7965Sigma-Aldrich1:100
LAMP-2Mono/MoH4B4ab25631Abcam1:100
Phospho-γH2A.XMono/Mo3F2MA1-2022Invitrogen1:100
Secondary antibodies
HostSpecificityConjugateCatalog No.ManufacturerDilution
DonkeyAnti-Mo IgGAF-488A21202Invitrogen1:200
Mono—monoclonal; Mo—mouse.
Publisher’s Note: MDPI stays neutral with regard to jurisdictional claims in published maps and institutional affiliations.

