Article

New Insights into the Transcriptional Regulation of Genes Involved in the Nitrogen Use Efficiency under Potassium Chlorate in Rice (Oryza sativa L.)

1
Department of Southern Area Crop Science, National Institute of Crop Science, RDA, Miryang 50424, Korea
2
Molecular Biology Department, Agricultural Genetic Institute, Hanoi 11917, Vietnam
*
Author to whom correspondence should be addressed.
Int. J. Mol. Sci. 2021, 22(4), 2192; https://doi.org/10.3390/ijms22042192
Submission received: 28 January 2021 / Revised: 16 February 2021 / Accepted: 17 February 2021 / Published: 22 February 2021
(This article belongs to the Special Issue Molecular Research in Rice: Agronomically Important Traits 2.0)

Abstract

:
Potassium chlorate (KClO3) has been widely used to evaluate the divergence in nitrogen use efficiency (NUE) between indica and japonica rice subspecies. This study investigated the transcriptional regulation of major genes involved in the NUE in rice treated with KClO3, which acts as an inhibitor of the reducing activity of nitrate reductase (NR) in higher plants. A set of two KClO3 sensitive nitrate reductase (NR) and two nitrate transporter (NRT) introgression rice lines (BC2F7), carrying the indica alleles of NR or NRT, derived from a cross between Saeilmi (japonica, P1) and Milyang23 (indica, P2), were exposed to KClO3 at the seedling stage. The phenotypic responses were recorded 7 days after treatment, and samples for gene expression, physiological, and biochemical analyses were collected at 0 h (control) and 3 h after KClO3 application. The results revealed that Saeilmi (P1, japonica) and Milyang23 (P2, indica) showed distinctive phenotypic responses. In addition, the expression of OsNR2 was differentially regulated between the roots, stem, and leaf tissues, and between introgression lines. When expressed in the roots, OsNR2 was downregulated in all introgression lines. However, in the stem and leaves, OsNR2 was upregulated in the NR introgression lines, but downregulation in the NRT introgression lines. In the same way, the expression patterns of OsNIA1 and OsNIA2 in the roots, stem, and leaves indicated a differential transcriptional regulation by KClO3, with OsNIA2 prevailing over OsNIA1 in the roots. Under the same conditions, the activity of NR was inhibited in the roots and differentially regulated in the stem and leaf tissues. Furthermore, the transcriptional divergence of OsAMT1.3 and OsAMT2.3, OsGLU1 and OsGLU2, between NR and NRT, coupled with the NR activity pattern in the roots, would indicate the prevalence of nitrate (NO3¯) transport over ammonium (NH4+) transport. Moreover, the induction of catalase (CAT) and polyphenol oxidase (PPO) enzyme activities in Saeilmi (P1, KClO3 resistant), and the decrease in Milyang23 (P2, KClO3 sensitive), coupled with the malondialdehyde (MDA) content, indicated the extent of the oxidative stress, and the induction of the adaptive response mechanism, tending to maintain a balanced reduction–oxidation state in response to KClO3. The changes in the chloroplast pigments and proline content propose these compounds as emerging biomarkers for assessing the overall plant health status. These results suggest that the inhibitory potential of KClO3 on the reduction activity of the nitrate reductase (NR), as well as that of the genes encoding the nitrate and ammonium transporters, and glutamate synthase are tissue-specific, which may differentially affect the transport and assimilation of nitrate or ammonium in rice.

1. Introduction

Nitrogen is an essential macronutrient that plays an important role in the growth and development of plants [1]. In soil, about 95–99% of the potentially available nitrogen exists in organic form (plant or animal residues), in the soil organic matter, and in living soil organisms [2]. Most of the nitrogen available to plants is in the inorganic form, such as ammonium (NH4+) and nitrate (NO3) ions [3,4], also called mineral nitrogen [5], while a very small amount of organic compounds, such as urea, may be available to the plant. NH4+ ions have a high affinity for binding to the negatively charged soil cation exchange complex (CEC), and act much like other cations in the soil. In contrast, because soil carries negative charges, NO3 ions do not bind to soil particles, but are dissolved in the soil water, or precipitate in the form of soluble salts under dry conditions.
The nitrogen present in the soil that can be used by plants has two major sources: nitrogen-containing minerals, and the vast storehouse of nitrogen in the atmosphere. The biological conversion of the atmospheric nitrogen gas (N2) to ammonia (NH3+) is exclusively performed by bacterial and archaeal species. It is said that biological nitrogen fixation is specific-dependent, and not limited to particular genera. Therefore, the detection of N2 fixation is perceived as a complex task. For instance, in many legumes, such as legume symbionts, the fixation of nitrogen is strictly symbiotic [6].
The primary step of nitrogen acquisition by roots is the active transport across the plasma membrane of root epidermal and cortical cells. In rice, several members of nitrate transporter gene families (NPFs) have been identified, including 80 NPFs (NRT1/PRTs: NRT1, low-affinity nitrate transporter; PRT, di/tripeptide transporter), 5 NRT2s, 2 NAR2s members, and ammonium (NH4+) transporters (AMTs), and are reported to be involved in nitrogen use efficiency (NUE) [7]. Of this number, a few have been cloned and characterized [8,9,10,11,12,13,14,15,16,17]. Nitrogen assimilation is the formation of organic nitrogen compounds like amino acids from inorganic nitrogen compounds present in the environment. Organisms like fungi, certain bacteria, and the majority of plants that cannot fix nitrogen gas (N2) depend on the ability to assimilate nitrate or ammonia for their needs. Other organisms, like animals, depend entirely on organic nitrogen from their food [18].
Plant growth, development, and productivity require the permanent availability of nutrients, and the plant nutrient needs increase with the growth stage. Nitrogen, a key macronutrient is required in the process, among others. However, external fluctuations in the supply of nitrogen to plants can affect its uptake, and lead to activation of various regulatory networks in order to optimize N uptake and utilization [19]. During these events, nitrate reductase (NR) and nitrite reductase (NiR) convert the exogenous nitrate to ammonium (NH4+). In the process, NH4+ is further assimilated by glutamine synthase and glutamate synthase into amino acids [18]. In addition, it was earlier reported that the activity of a large number of enzymes involved in nitrogen assimilation decreases under long-term abiotic stress conditions [20], while short-term stress increases others [21]. In the chloroplasts [22], glutamine synthase incorporates this ammonia as the amide group of glutamine, using glutamate as a substrate. Glutamate synthase (Fd-GOGAT and NADH-GOGAT) transfers the amide group onto a 2-oxoglutarate molecule producing two glutamates [23].
Nitrogen is also vital because it is the major component of chlorophyll molecules, the key compound by which plants use the energy from sunlight to yield sugars from water and carbon dioxide during photosynthesis.
In our recent study, a novel quantitative trait locus (QTL) for chlorate resistance was identified, and candidate genes were proposed to be associated with chlorate resistance in rice [24]. A study conducted by Gao and his colleagues [25] supported that the indica allele of nitrate reductase (OsNR2) is the major component for the nitrogen biological cycle, and confers a high nitrogen use efficiency (NUE) compared to the japonica allele [26]. In the same way, Duan et al. [27] indicated that the indica allele of NR or NRT confers a high NUE, and a mutation in the NRT1.1B resulted in an impaired NUE. One of the major challenges in crop production and plant biology research is how to maintain a balanced crop productivity and yield, while reducing the application of nitrogen fertilizers and utilization by plants.
Several reports have supported the use of potassium chlorate (KClO3) as an effective and reliable strategy to investigate the nitrogen metabolism in higher plants, through the monitoring of nitrate uptake, transport, and assimilation, and knowing that nitrate is the main source of nitrogen. Chlorate (ClO3) is a substrate for the nitrate reductase (NR) enzyme that reduces ClO3 to the toxic chlorite, leading to a quick degradation of NR [28,29,30]. In wheat [31], ClO3 resistance was used as a means of investigating the effect of NR antisense gene.
Potassium chlorate has been shown to induce stress in plants [24,32,33]. Generally, when plants are exposed to an environmental stimulus, they generate reactive oxygen species (ROS) [34,35] and reactive nitrogen species (RNS) [36]. Over accumulation of ROS or RNS may lead to oxidative damage [37] and lipid peroxidation [38], among other effects.
Therefore, this study aimed at investigating the transcriptional regulation of previously characterized genes reported to play important roles in nitrogen uptake, transport, assimilation, and remobilization; herein referred to as nitrogen use efficiency in rice. For this purpose, a set of nitrate reductase (NR) and nitrate transporter (NRT) introgression rice lines (BC2F7) and their related parental lines were exposed to potassium chlorate (KClO3) at seedling stage, and the phenotypic responses were evaluated in different rice tissues. Additionally, changes in the physiological properties of the parental and NR or NRT introgression rice lines were assessed in response to KClO3. Furthermore, the activity of key antioxidant enzymes and the change in the activity of the nitrate reductase (NR), as well as the extent of cell membrane degradation, were assessed under the same conditions.

2. Results

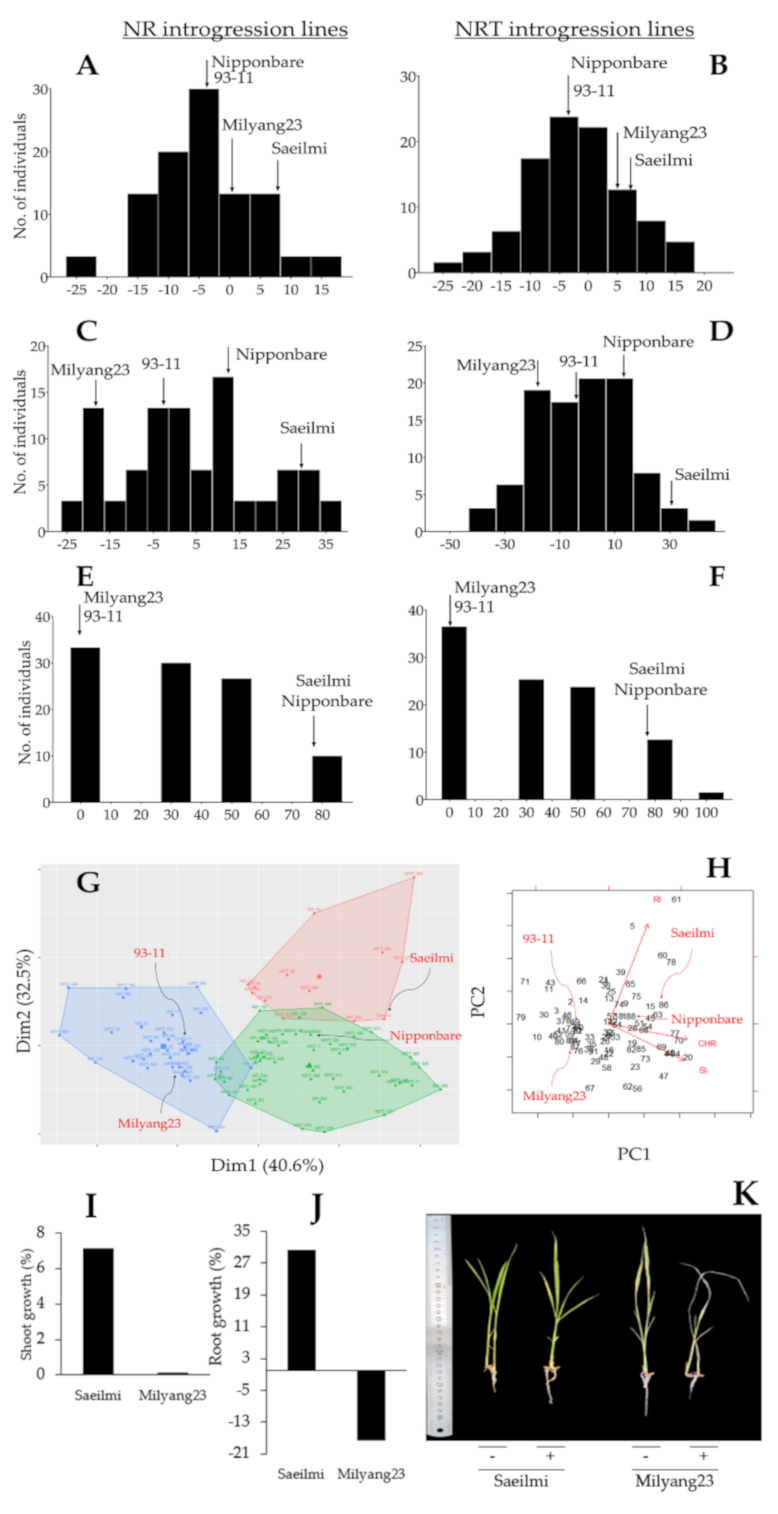
2.1. Distinctive Phenotypic Response between Parental Lines, and Identification of Introgression Lines

Initially, a population of 420 rice lines was screened through genotyping in order to identify NR or NRT introgression rice lines using insertion/deletion (InDel) markers (OsNR-IND2194 for nitrate reductase, and OsNRT-M10-22 for nitrate transporter). The results revealed that 26 lines and 59 lines carried the indica alleles of NR and NRT, respectively (Figure S2). These introgression lines amplified the expected band size of 200 bp for the indica allele of nitrate reductase, and 165 bp specific to the indica allele of nitrate transporter, respectively, on chromosomes 2 and 10, as reported earlier [24]. The indica alleles of the NR and NRT were previously suggested to explain the differences in the nitrogen use efficiency between indica and japonica rice varieties. Based on this evidence, the selected NR and NRT introgression lines (BC2F7) were exposed to 0.05% KClO3 for 7 days. Of this number, the introgression rice lines that exhibited a high sensitivity soon after KClO3 was applied (Figure S3), were used for physiological, biochemical, and molecular analyses.
Our data indicate that about 76.9% and 62.7% of NR and NRT introgression rice lines, showed a reduction in shoot growth, respectively, in response to KClO3 (Figure 1A). Under the same conditions, about 46.2% and 61% of the NR and NRT introgression lines recorded a decrease in root growth, respectively (Figure 1B). In the same way, 96.2% of the NR introgression lines showed a highly sensitive phenotype under KClO3, while for the NRT introgression lines, about 79.7% were KClO3 sensitive. The parental lines, Saeilmi and Milyang23, showed distinctive KClO3 responses. An increase in shoot growth was observed in Saeilmi (about 7.1%) and Milyang23 (about 0.1%) (Figure 1A and Figure 2I,K). Saeilmi exhibited a significant increase in root growth (about 32%), but Milyang23 showed a significant decrease in root growth (17.6%) under the same conditions (Figure 1B and Figure 2J,K).
In addition, panels A and B of Figure 2 revealed a normal distribution of shoot growth for both NR and NRT introgression lines, while the root growth of the same rice lines showed a positive skewness (Figure 2C) and a normal distribution (Figure 2D). However, the recorded frequency distribution of the chlorate response indicated a positive skewness from both the NR and NRT introgression lines (Figure 2E,F). From another perspective, the data in panel G of Figure 2 groups Saeilmi (P1) and Nipponbare (typical japonica) in close clusters (right side of the figure) with regard to their similarity in phenotypic response towards KClO3 treatment, while Milyang23 (P2) and 93-11 (typical indica) were assigned in the same cluster (left side of the figure). Moreover, the results of the principal component analysis (PCA) supported that root growth inhibition (RI) and chlorate were negatively correlated, whereas shoot growth inhibition positively correlated with the chlorate response of the NR and NRT introgression rice lines (Figure 2H). Principal component 1 (PC1) and 2 (PC2) explained 40.6% and 32.5% of the proportion of variance of the observed phenotypes, respectively, resulting in a cumulative proportion of 73.1%.

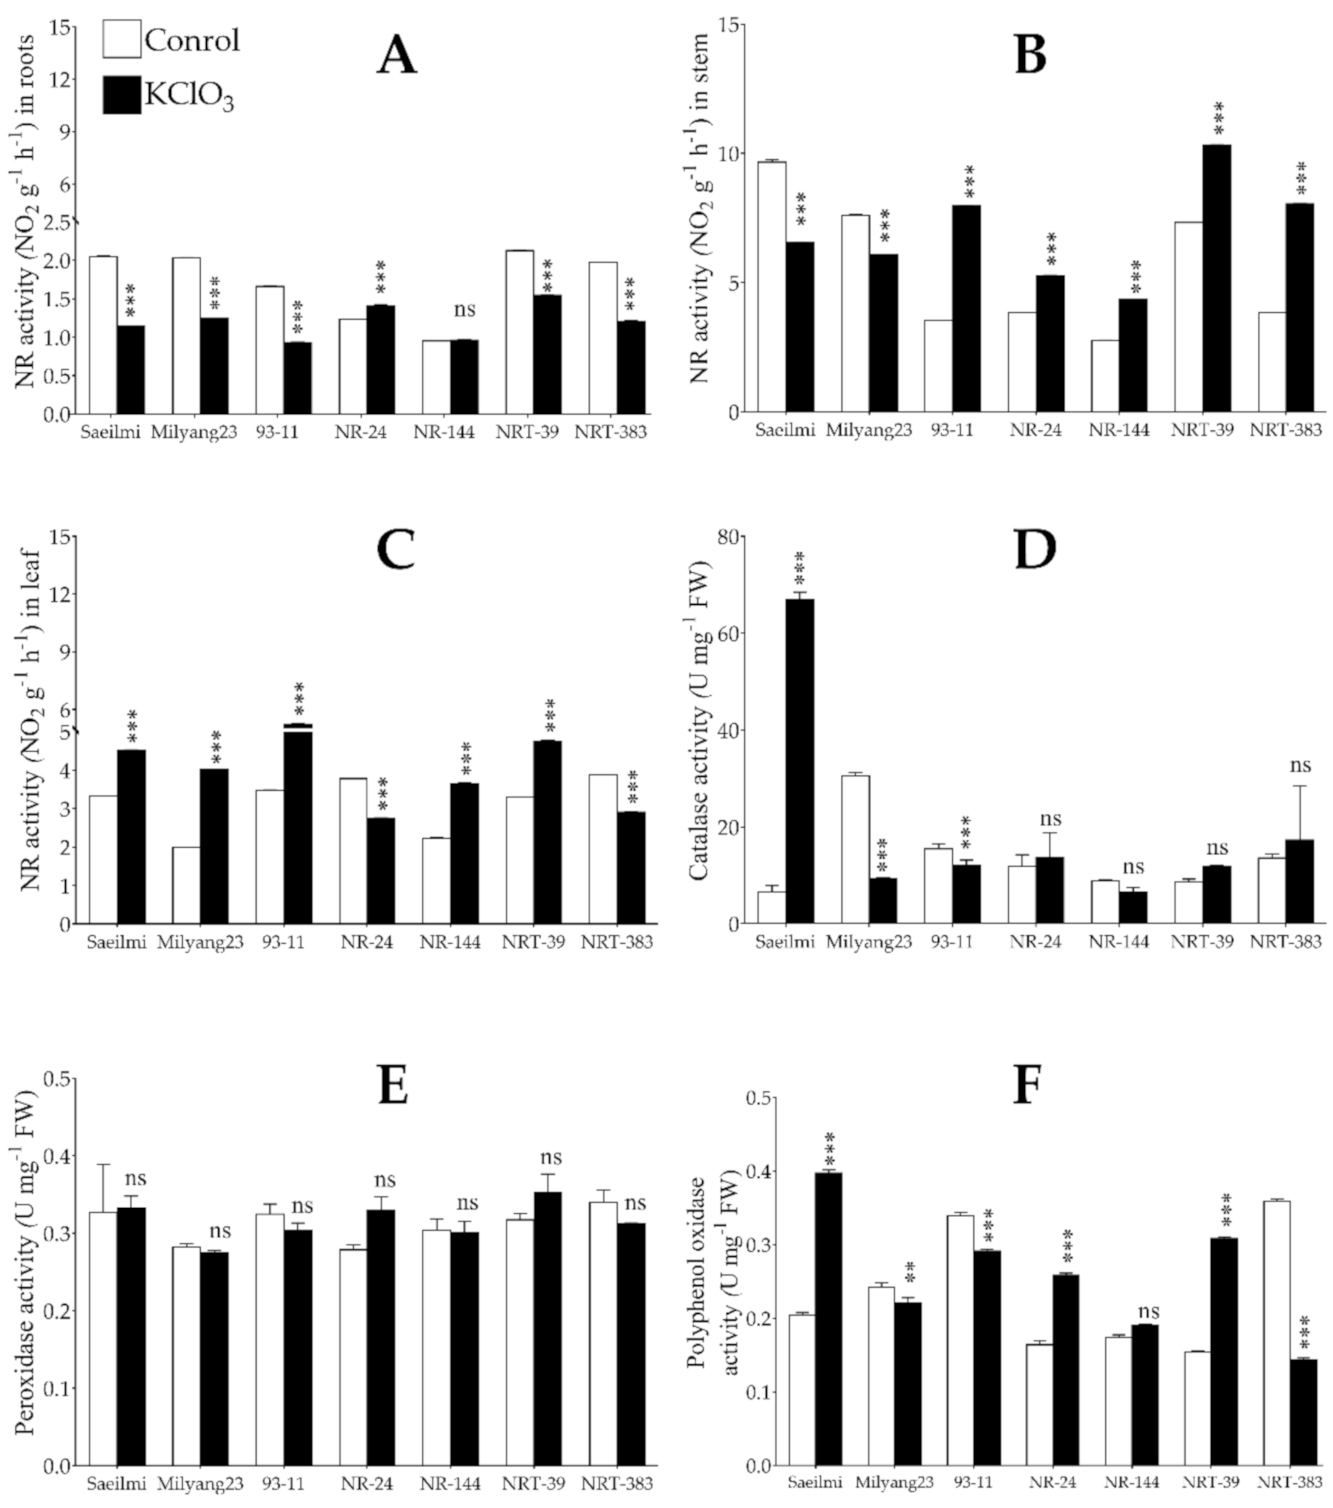
2.2. Exogenous Application of Potassium Chlorate Differentially Controlled the Activity of Nitrate Reductase in a Tissue-Specific Dependent Manner

Chlorates have been reported to have an inhibitory effect on the reducing activity of the nitrate reductase of nitrate (NO3) to nitrite (NO2). As expected, the activity of nitrate reductase (NR) was significantly suppressed by potassium chlorate (KClO3) in the roots of Saeilmi (P1), Milyang23 (P2), and 93-11 (typical indica), as well as in both the NRT introgression lines (NRT39 and NRT383), while in NR24 and NR144, a significant increase and a non-significant change were observed, respectively (Figure 3A). In the stem, the NR activity was suppressed in Saeilmi and Milyang23 soon after KClO3 was supplied, but significantly induced in 93-11 and in all the NR and NRT introgression lines (Figure 3B). Whereas, in the leaf tissues, Saeilmi, Milyang23, and 93-11 showed a similar increasing pattern of NR activity, but NR and NRT introgression lines differentially activated the NR enzyme under the same conditions (Figure 3C).
Upon stress induction, plants initiate an intrinsic adaptive response mechanism to combat the stress. This includes the activation of various antioxidant systems, tending to lower the over accumulation of reactive oxygen species (ROS) and alleviate the oxidative stress. Our data show that catalase (CAT) activity significantly increased in Saeilmi (P1, KClO3 resistant), but decreased in Milyang23 (P2, KClO3 sensitive) and 93-11 (typical indica cultivar). However, no significant change in CAT activity was observed in all NR or NRT introgression rice lines (Figure 3D). Other enzymatic antioxidants that have been shown to be induced by environmental cues are peroxidase (POD) and polyphenol oxidase (PPO). Here, we observed that POD activity did not change significantly in all tested rice lines upon KClO3 treatment (Figure 3E); however, PPO activity significantly increased in the Saeilmi (P1) and decreased in Milyang23 (P2) and 93-11 lines, but increased in the NR and NRT introgression lines, except in NRT383 (Figure 3F).

2.3. Increased Chlorophyll and Carotenoids Content in Response to Potassium Chlorate

Under normal growth conditions, the chloroplast pigments, chlorophyll (Chl) and carotenoids have been shown to play a crucial role in the acquisition and supply of the energy required by plants to complete their life cycle [39]. Several studies have reported a change in the chlorophyll and carotenoids content in response to environmental stimuli [40]. Our findings show that the Chl a (Figure 4A), Chl b (Figure 4B), and total chlorophyll (Figure 5C), as well as the carotenoids relative to the chlorophyll (Cx+c, Figure 4D), significantly increased in all the tested rice lines in response to KClO3 application. Likewise, the pheophytin (Figure 4E–G), known as a derived molecule of chlorophyll lacking the magnesium at the reaction center, as well as the carotenoids relative to the pheophytin (Cph x+c, Figure 4H), showed a similar accumulation pattern to that observed for the Chl, but much more abundant compared to Chl.

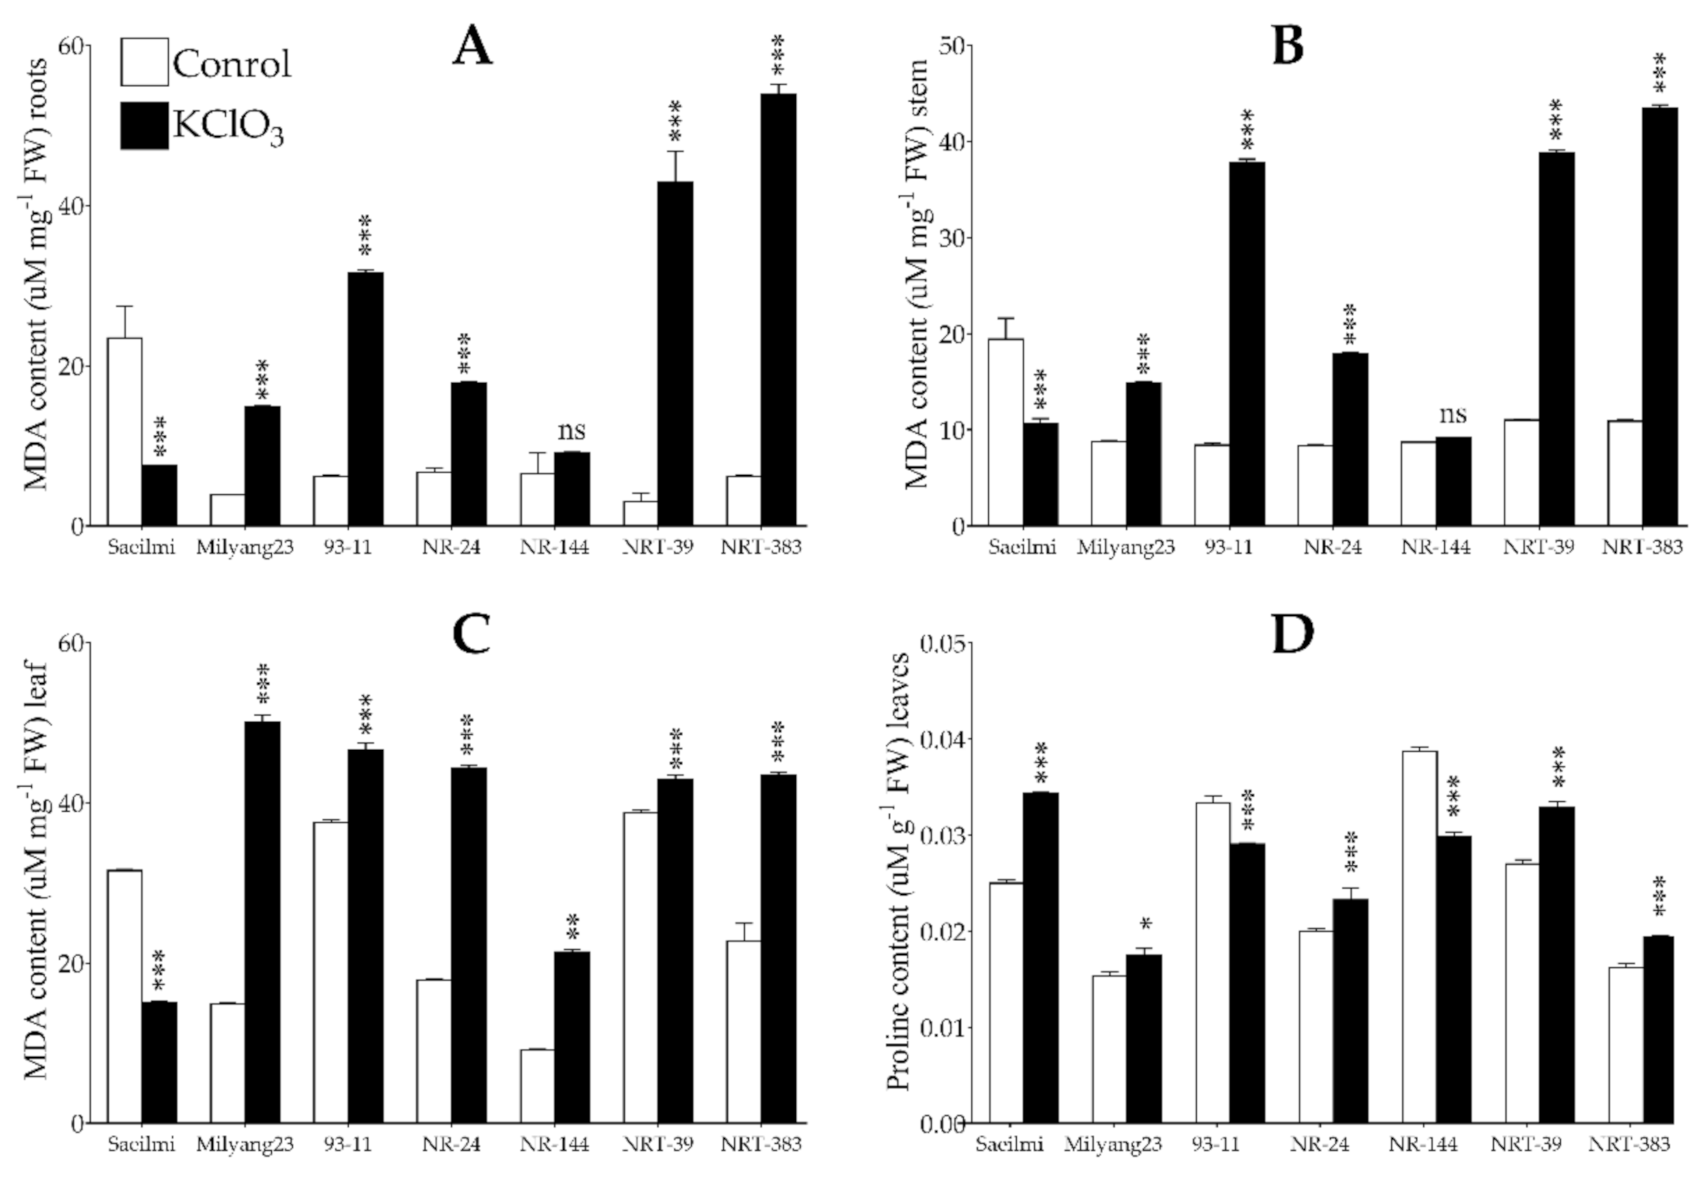
2.4. Potassium Chlorate Treatment Caused Lipid Peroxidation and Changes in Proline Content

Under stressful conditions, particularly caused by an environmental stimulus, various free radicals identified as reactive oxygen species (ROS) are generated. Over accumulation of ROS induces oxidative stress that may result in oxidative damage. In plants, malondialdehyde (MDA) is commonly used as a biomarker to estimate the lipid peroxidation due to damage to the cell membrane integrity. The results indicated that MDA content significantly decreased in the roots of Saeilmi (P1, chlorate resistant), while a significant increase was recorded in Milyang23 (P2, KClO3 sensitive), 93-11 (typical indica), and all the NR and NRT introgression rice lines in response to KClO3 (Figure 5A). A similar pattern of NR activity was observed in the stem (Figure 5B) and the leaf tissues (Figure 5C). Furthermore, proline has been reported to accumulate under abiotic stress in plants, as part of the adaptive response mechanism towards stress tolerance. Here, we observed a significant increase in the proline content in Saeilmi and NR24, as well as in NRT39 and NRT383, soon after KClO3 was applied (Figure 6D). Under the same conditions, 93-11 and NR144 showed a significant reduction in proline content.

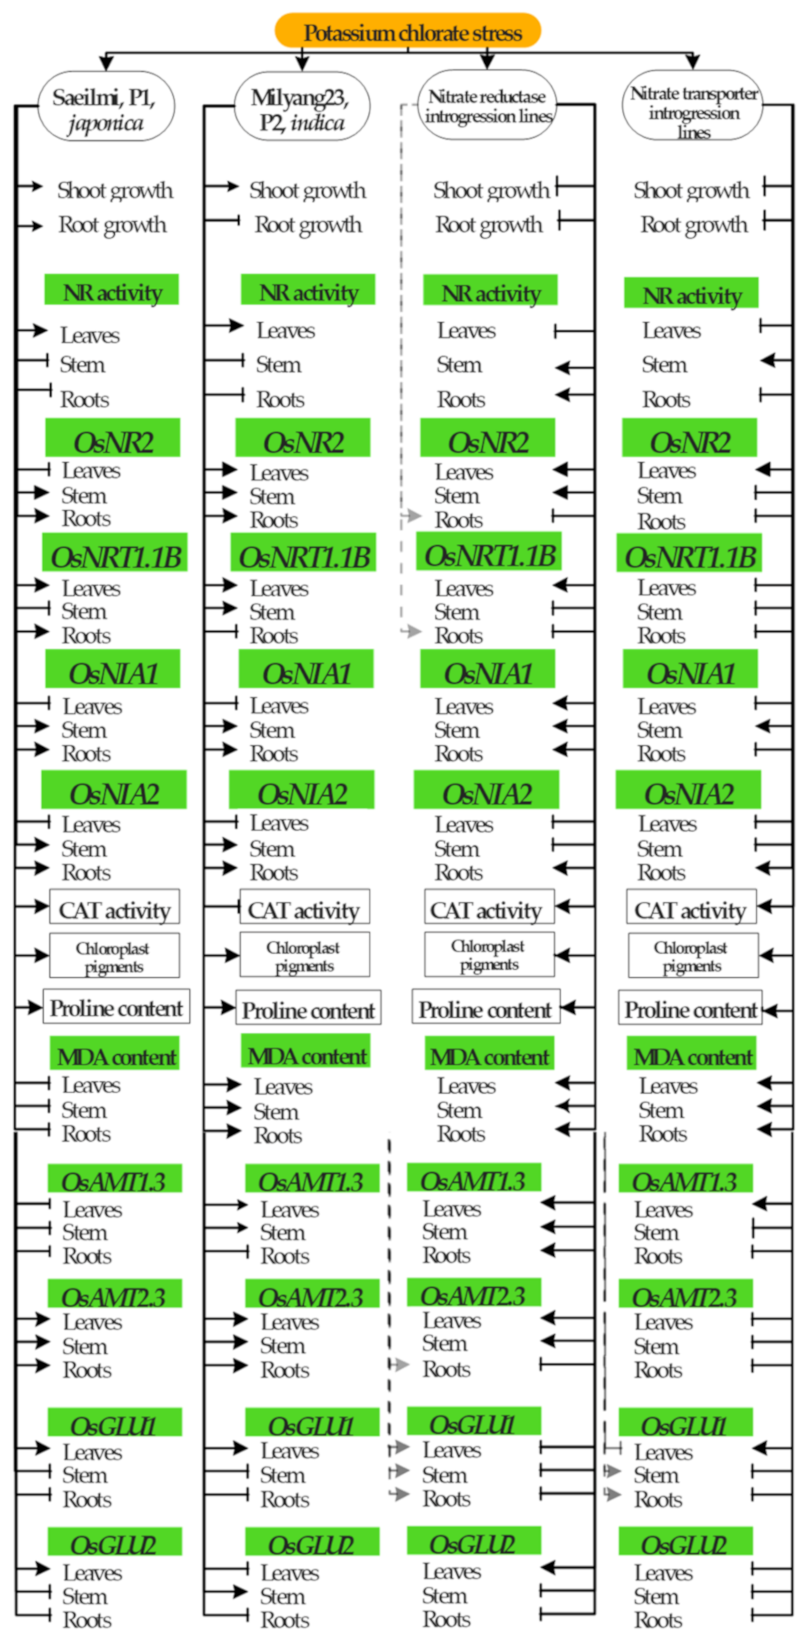
2.5. Potassium Chlorate Differentially Regulated the Expression of Genes Involved in Nitrogen Uptake, Transport, and Assimilation in Roots, Stem, and Leaf Tissues

Four KClO3 sensitive NR (NR24, NR144) and NRT (NRT39 and NRT383) introgression rice lines and the parental lines, as well as 93-11 (the typical indica and KClO3 sensitive), were used to investigate the transcriptional regulation of key genes involved in nitrogen uptake, transport, and assimilation, herein referred to as nitrogen use efficiency (NUE), in different plant organs (roots, stem, and leaf) under potassium chlorate (KClO3) treatment. The relative expression levels of all analyzed genes were normalized to those of the housekeeping gene (OsActin1), and Milyang23 (P2, indica) was used to assess the statistical significance of the transcripts accumulation of the target genes in different rice lines. Our data showed that OsNR2 was upregulated in the roots, stem, and leaf of Milyang23 (P2, about 1.5, 2.2, and 2.4-fold changes, respectively), while in Saeilmi (P1), a non-significant change was observed in the roots and leaf tissues (Figure 6A,C), but upregulated in the stem (2.2-fold change) (Figure 6B). When expressed in the NR introgression rice lines, the OsNR2 was shown to be downregulated in the roots; while being upregulated in the stem and leaves. However, the transcripts accumulation of OsNR2 was significantly decreased in all tested plant organs in both NRT39 and NRT383 rice lines, but was upregulated in 93-11 in the roots, and downregulated in the stem and leaves.
After being uptaken, nitrogen (N) is transported into the cell through the cell membrane in two major forms, nitrate (NO3) and ammonium (NH4+). N transport in the form of nitrate, also known as the major form in which nitrogen is carried, is achieved through the combinational action of different enzymes, of which OsNRT1.1B has been suggested to play a preponderant role. Here, the expression of OsNRT1.1B was downregulated in the roots of Milyang23 (about 1-fold change), 93-11 (0.4-fold change), and NR24 (0.5-fold change), as well as in both NRT39 and NRT383 lines (0.4-fold change) (Figure 6D). A similar transcriptional pattern was observed when OsNRT1.1B was expressed in the stem, but in Saeilmi no significant change was recorded between the KClO3 treated and control plants, with an exception being in the leaf tissues, where an increase in the transcripts accumulation was recorded in Saeilmi (0.7-fold change upregulated), Milyang23 (1.6-fold change upregulated), and 93-11 (0.7-fold change), as well as in the NR and NRT introgression lines (Figure 6E,F). However, OsNRT1.1B expression was downregulated in the NRT39 and NRT383 lines.
N transport in the form of NH4+ is facilitated by a group of well-identified NH4+ transporters, including OsAMT1.3 and OsAMT2.3 genes. Our data show that the expression of OsAMT1.3 was downregulated in the roots of Saeilmi (P1, about 1-fold change), while being upregulated in Milyang23 (P2, about a 1.4-fold change) and 93-11 (1.2-fold change). However, OsAMT1.3 was upregulated in the NR (1.0 and 1.1-fold change) and downregulated in the NRT (0.4 and 0.5-fold change) introgression lines (Figure 6G). Similarly, when expressed in the stem, the data in panel H of Figure 3 indicates that OsAMT1.3 was downregulated in Saeilmi (0.4-fold change) and 93-11 (0.6-fold change), while showing an increased transcript accumulation pattern in Milyang23 (2.4-fold change) and NR (1.3 and 1.6-fold change) introgression lines, but being downregulated in the NRT (0.6 and 0.4-fold change) introgression lines (Figure 6H). Meanwhile, OsAMT1.3 transcripts levels decreased in the leaf tissues of Saeilmi (about 1-fold change), while showing an increased pattern in 93-11 (about 1-fold change), as well as in all NR (4.3 and 2.3-fold change) and NRT (about 1.0 and 1.7-fold change) introgression lines, except NRT39 (Figure 6I), in response to KClO3.
The other ammonium transporter of which the transcript accumulation was measured (OsAMT2.3) was shown to be induced by KClO3 in the roots of the Saeilmi (1.1-fold change), Milyang23 (1.3-fold change), and 93-11 (1.7-fold change) cultivars. However, an opposite expression pattern was recorded in the NR (about 1-fold downregulated and 1.2-fold upregulated) and NRT (0.6 and 0.5-fold change, downregulated) introgression lines (Figure 6J). Under the same conditions, the transcripts accumulation of OsAMT2.3 in the stem increased in Saeilmi (2.1-fold change), Milyang23 (1.3-fold change), and 93-11 (1.7-fold change), as well as in both NR introgression lines (1.7 and 1.4-fold change), but a decrease was observed in the NRT (0.7 and 0.8-fold change) introgression lines (Figure 6K). When expressed in the leaf tissues, OsAMT2.3 exhibited a similar transcript accumulation pattern to that observed in the stem (Figure 6L).
The N that is uptaken by the roots, and transported through the vessels into to the leaf tissues via the stem is expected to be assimilated in the form of amino acids. In higher plants, glutamate synthase has been reported as being involved in the initial steps of the N assimilation. Therefore, in order to investigate the possible effect of KClO3 on the N assimilation events, we monitored the transcript accumulation of glutamate synthase (OsGLU1 and OsGLU2) genes. Our data indicate that OsGLU1 was downregulated in the roots and stem of Saeilmi (P1) and Milyang23 (P2), as well as in NR24, NRT39, and NRT383 (Figure 6M,N). Whereas, a non-significant change in OsGLU1 expression was observed (Figure 6O). In the same way, OsGLU2 was downregulated in both the roots (Figure 6P) and the stem (Figure 6Q) of Saeilmi, but a slight increase was recorded in Milyang23 and 93-11, while a downregulation was recorded in the NR and NRT introgression lines. In the stem, OsGLU2 transcript accumulation increased in 93-11 and decreased in Milyang23, as well as in all NR and NRT introgression lines (Figure 6P,Q). Meanwhile, when expressed in the leaves, the expression of OsGLU2 was upregulated in Saeilmi and in the NR introgression lines, while being downregulated in Milyang23, 93-11, and the NRT introgression lines (Figure 6R).
As part of the nitrogen (N) biological cycle, particularly during the denitrification process, where nitrate (NO3) is reduced back to nitrous oxide (N2O) and nitrogen (N2), nitric oxide (NO) is released. For this reason, we investigated the changes in the transcripts accumulation of key NO biosynthetic genes, OsNIA1 and OsNIA2, encoding a nitrate reductase enzyme, in response to KClO3. Our findings revealed, on the one hand, that OsNIA1 was upregulated in the roots of Saeilmi (1.2-fold change), Milyang23 (1.4-fold change), 93-11 (1.2-fold change), NR24, and NR144 (1.6 and 1.3-fold change, respectively), but downregulated by 0.7 and 0.5-fold change in NRT39 and NRT383, respectively (Figure 6S). Similarly, a significant upregulation of OsNIA1 was recorded in the stems of both Saeilmi (P1) and Milyang23 (P2) (1.9 and 2.2-fold change, respectively), and the NR and NRT introgression lines (NR: 5.2 and 1.3-fold change; NRT: 1.1 and 1.2-fold change) (Figure 6T). However, OsNIA1 transcript accumulation decreased in the leaf tissues of both P1 and P2 (0.4 and 0.3-fold change, respectively), and 93-11 (0.3-fold change), while being upregulated by about a 1-fold change in all the NR and NRT introgression lines (Figure 6U). On the other hand, OsNIA2 transcript accumulation increased significantly in the roots of Saeilmi (3.2-fold change), and was much higher in Milyang23 (22.3-fold change) and in the NR (2.8 and 3.9-fold change) and NRT (424.8 and 6948.3-fold change) introgression lines (Figure 6V). The expression of OsNIA2 was upregulated in the stem of Saeilmi (1.0-fold change), Milyang23 (1.9-fold change), but downregulated in 93-11 (0.3-fold change), as well as in NR (0.5 and 0.8-fold change) and NRT (0.8 and 0.7-fold change). Likewise, OsNIA2 expression showed a similar downregulation pattern in the leaf tissues of all tested rice lines (Figure 6W,X).

3. Discussion

3.1. Potassium Chlorate Inhibits Shoot and Root Growth in a Cultivar Dependent Manner

Roots are important plant organs playing an essential role during plant nutrients and water uptake, as well as for anchoring the plant to the soil. Roots also serve as storage organs supporting the whole plants structure and fitness, among other things [41]. In the same way, the shoots (above ground part of the plant, including the stem or tillers and the leaves and grains) are important for the plant architecture, transport of nutrients and water, energy acquisition, and redistribution, and carry the target products of many food crops, such as rice. Nitrate (NO3) and ammonium (NH4+) are widely known as the major forms of nitrogen (N) utilized by plants from the environment (soil) [42]. Under stressful conditions caused by environmental stimuli [43,44,45], roots are the first organs that sense the stress, and the availability of essential nutrients, including nitrogen (N), is affected, leading to impairment of root growth and/or shoot growth and productivity. Here, we recorded that about 46.2% and 61% of the NR or NRT introgression rice lines exhibited a reduction in their roots, and 76.9% and 62.7% showed a reduction in shoot growth, respectively, in response to KClO3, suggesting a strong inhibitory effect of KClO3 on the whole plant growth.

3.2. Potassium Chlorate Differentially Regulates Genes Involved in Nitrate Uptake, Transport, and Assimilation in a Tissue-Specific Dependent Manner

The indica allele of the nitrate reductase encoded by the OsNR2 gene (chromosome 2) and the nitrate transport, OsNRT1.1B (chromosome 10) have been suggested to be key players in explaining the differences in the nitrate assimilation capacity and the nitrogen use efficiency (NUE) between indica and japonica rice subspecies [25]. According to the authors, this difference is conferred by allelic variation at the OsNR2, with the indica allele showing a high nitrate reductase (NR) activity compared to its japonica counterpart. Consequently, the indica allele was suggested to promote NO3 uptake, while interacting with the nitrate transporter encoding gene, OsNRT1.1B. However, NR activity has been reported to be inhibited by chlorates (ClO3), which together with NO3 serve as substrates for the NR enzyme that reduces NO3 to the toxic chlorite [28,29,30,46]. Many studies have used ClO3 to isolate mutant plants that are defective in nitrate reduction [29], while others have suggested that when ClO3 is applied to plants, an increase in NR mRNA level is observed, but not the NR protein content [47]. Zhao and his colleagues [48] observed that a chlorate resistant mutant (lacking the NR activity) of rice exposed to ClO3 showed a similar level of NR activity to the wild type.
Here, the tissue-specific expression of the OsNR2 gene in rice lines carrying the indica alleles of NR or NRT revealed a differential transcriptional regulation by KClO3. When expressed in the roots, the expression of OsNR2 was inhibited in all introgression lines, except in NRT144 line (Figure 6A), but its expression in the stem (Figure 6B) and the leaves (Figure 6C) was shown to be significantly upregulated in the NR introgression lines, while being downregulated in all the NRT introgression lines. Therefore, these results suggest that the previously reported inhibitory effect of ClO3 on the reducing activity of the nitrate reductase (NR) is tissue-specific, rather than systematic to all plant tissues and organs. This is also supported by the differential nitrate reductase activity, which was shown to vary between rice plants’ tissues (roots, stem, and leaf tissues) (Figure 6A–C). In addition, the contrasting expression pattern of the OsNR2 gene in the NRT introgression lines compared to that recorded in the NR introgression background suggests an antagonistic relationship, particularly in the stem and the leaf tissues. Furthermore, the differential transcriptional regulation of OsNR2 in different plant tissues would imply that NR may also be involved in NO3 long-distance signaling and transport across the plant body.
Another set of genes known to code for nitrate reductase enzymes in plants are NIA1 and NIA2. In rice, OsNIA1 and OsNIA2 have been shown to be induced by nitric oxide (NO), one of the compounds that is generated during the nitrogen metabolic process [49]. In Arabidopsis, mutations in the nitrate reductase structural genes AtNIA1 and AtNIA2 have been shown to result in an impairment in NO3 assimilation rate [50]. It could then be said that the recorded significant increase in the transcript accumulation of OsNIA1 in the NR introgression rice lines background in all measured rice tissues, and the downregulation in the NRT introgression rice lines background in response to KClO3 (Figure 6S–U), coupled with the upregulation or downregulation of OsNIA2 expression in a tissue-dependent manner (Figure 6V–X), would suggest a possible role of NO in nitrogen use efficiency.
In the same way, OsNRT1.1B, known to function in NO3 uptake, transport, and signaling [51], exhibited a differential expression between the parental lines Saeilmi and Milyang23, as well as in different tissues of the NR or NRT introgression lines. Furthermore, the transcript accumulation of OsNRT1.1B was significantly lower in the NRT, compared to the NR, introgression line upon KClO3 treatment, which would suggest that the NR enzyme prevails over the NRT in NO3 uptake as part of the NUE. From another perspective, OsNRT1.1B has been shown to be involved in the regulation of root microbiota to facilitate organic nitrogen mineralization in the soil, while mediating plant–microbe interactions [52]. OsNRT1.1B was also reported to transport N under both low and high NO3¯ levels, and had an essential single nucleotide polymorphism (SNP) between indica and japonica rice subspecies [53], where the indica variation was shown to contribute to the NUE divergence between rice indica and japonica, eventually by promoting NO3 uptake and translocation, and upregulation of NO3 response [17].
Likewise, nitrogen is also transported in the form of ammonium (NH4+). In the soil, NH4+ basically results from the mineralization of organic matter, and represents, besides NO3, the quantitatively most important source of N for plant nutrition [54]. The authors supported that despite the low concentrations in soils, the uptake of NH4+ by the plant can be achieved at a very high rate, facilitated by the multiple transporters in the root plasma membrane. A recent report [55] suggested that, in addition to functioning in NH4+ uptake in the roots, OsAMT1.3 may act as a signal sensor to regulate plant growth, carbon, and nitrogen use efficiency (NUE). Similarly, OsAMT1.3 has been suggested as being involved in the adaptation ability of rice to low NH4+ supplies [56]. In the same way, OsAMT2.3 was reported to be affected by N supply [57]. Therefore, the recorded upregulation of OsAMT1.3 in the roots, stem, and leaves of NR introgression lines, and the downregulation in NRT introgression lines (Figure 6G–I) soon after KClO3 was applied, coupled with the transcriptional patterns of OsAMT2.3 under the same conditions (Figure 6J–L), would indicate an antagonistic relationship with NR, while suggesting a co-expression with NRT, in rice.
Glutamate synthase (GOGAT) is involved in the initial steps of nitrogen assimilation in plants. The GS/GOGAT cycle is widely known as the major route of NH4+ assimilation in higher plants [58]. Hence, the recorded transcriptional levels of Glutamate synthase 1 and 2 encoding genes (Figure 6M–O and Figure 2P–R) would imply that OsGLU2 would prevail over OsGLU1 in N assimilation.

3.3. Potassium Chlorate Differentially Regulates Antioxidant Enzymes Between Parental and NR or NRT Introgression Rice Lines

Generally, when plants are exposed to a changing environment, various ROS are generated [59,60]. To cope with the stress, plants activate an array of antioxidant systems as part of their adaptive response mechanism, which include catalase (CAT), peroxidase (POD), and polyphenol oxidase (PPO), in order to maintain a low level of ROS accumulation, and keep a balanced reduction–oxidation state within the cell [61,62]. However, over accumulation of ROS was shown to induce oxidative stress, which may result in oxidative damage, and may culminate in the induction of programmed cell death (PCD) [63,64]. Owing to the recorded increase in CAT and PPO activities in the japonica parental line (Saeilmi, chlorate resistant) and the decrease in the indica parental line (Milyang23, chlorate sensitive), coupled with the differential activity in the NR or NRT introgression lines, this study suggests that CAT and PPO play an important role in the initial adaptive response mechanism towards KClO3 resistance.
During oxidative stress, plants accumulate ROS, which exacerbates oxidative damage [37]. In the process, malondialdehyde (MDA), commonly used as a marker to estimate lipid peroxidation in plant species, accumulates abundantly to the extent of the degradation of the cell membrane [38]. Therefore, the recorded MDA accumulation patterns in different plant organs (roots, stem, and leaf tissues) (Figure 5A–C) indicate the level of oxidative stress caused upon KClO3 application, suggesting that the integrity of the cell membrane might have been affected as a result of oxidative damage.

3.4. Exogenous Application of Potassium Chlorate Triggers the Accumulation of Chloroplast Pigments

Chlorates (ClO3) were earlier reported as potent inhibitors of the reducing activity of NR in plants, which may have a significant effect on N metabolism. As is well known, assimilation of the inorganic form of nitrogen (N) is as of fundamental importance to crop growth, as it is to crop productivity. It is said that N is the main plant mineral nutrient required for the production of chlorophyll (Chl), as well as other components of the plant’s cells, such as proteins, nucleic acids, and amino acids [51]. As ClO3¯ is said to inhibit NR activity, which may impair NUE, and owing to the fact that N is essential for chlorophyll production, we were expecting to see a reduction in the chlorophyll content upon KClO3 application. Rather, we recorded a significant increase in the chlorophyll a and b contents and their immediate precursors and degradation products, pheophytin [65] and carotenoids, in all tested rice lines (parental lines and BC2F7 NR or NRT introgression lines) (Figure 4A–H). In our recent studies, chlorophyll content was shown to be increased in response to abiotic stresses, such as drought stress [62] and salinity [66]. It is then thought that the observed Chl and pheophytin accumulation, as well as the carotenoids content, were a result of the oxidative stress caused by the application of KClO3, which suggests these molecules as emerging biomarkers for assessing the overall plant health status under oxidative stress conditions, and in which proline would contribute as an osmoprotectant [67,68].
Therefore, from the perspective of providing a comprehensive view of the recorded morphological, physiological, and biochemical changes, as well as the molecular responses of the nitrate reductase (NR) or nitrate transporter (NRT) introgression rice lines (BC2F7) relative to their parental lines Saeilmi (P1, japonica) and Milyang23 (P2, indica), moving towards potassium chlorate treatment, in the roots, stem and the leaf tissues, a signaling model is proposed (Figure 7).

4. Materials and Methods

4.1. Plant Materials and Potassium Chlorate Treatment

To perform the experiments, a total of seven rice lines, including two parental lines (Saeilmi: japonica and Milyang23, indica), the indica reference cultivar 93-11, and four introgression lines carrying the indica alleles of nitrate reductase (NR, two lines) or nitrate transporter (NRT, two lines) derived from a cross between Saeilmi and   Milyang 23 , were used as genetic materials. Initially, cv. Nipponbare (typical japonica ssp.) and cv. 93-11 (typical indica ssp.) were used to identify an optimum potassium chlorate (KClO3) concentration. For this purpose, the two cultivars were subjected to a gradient of concentrations of KClO3 (0.01%, 0.025%, 0.05%, 0.07%, and 0.1%) for seven days at seedling stage. The control treatments were supplied with distilled water only. Based on the phenotypic responses, 0.05% KClO3 was selected as the concentration to be used for downstream analyses. At 0.05% KClO3, a significant difference of the shoot (Figure S1A) or root (Figure S1B) inhibition percentage between Nipponbare and 93-11 was obtained. Meanwhile, the gap in the biomass fresh weight (BFW) between Nipponbare and 93-11 was small at 0.05% KClO3 level (Figure S1C). Therefore, 0.05% was used for downstream experiments.
Prior to germination, rice seeds were sterilized with 0.7% nitric acid (HNO3) (CAS: 7697-37-2, Lot No. 2016B3902; Junsei Chemical Co. Ltd., Tokyo, Japan) overnight to break the dormancy [24], followed by incubation for 48 h at 27 °C to induce germination. Germinated seeds were grown in 50-well trays containing an enriched soil, and placed in a greenhouse until three-leaf stage. Seedlings with a uniform height (3-week old, six seedlings per treatment per rice line) were transferred into 50 mL falcon tubes prior to KClO3 treatment. Then, the roots of seedlings were immerged into 5–10 mL of 0.05% potassium chlorate (KClO3) (CAS: 3811-04-9, Lot No. BCBW5513; Sigma-Aldrich, St. Louis, MO, USA) solution (pH 5.6), and placed in a growth chamber under dark conditions for 7 days at ±25 °C [33]. The KClO3 solution was replaced three days after the initial application by irrigation method. The control seedlings were supplemented with distilled water only. The phenotypic response was recorded 7 days after KClO3 application. The chlorate resistance was calculated as the percentage of the ((total number of tested seedlings − number of dead seedlings in KClO3)/total number of tested seedlings) × 100. However, shoot inhibition was estimated as the percentage of the ((shoot length under control (SLC)—shoot length under KClO3 (SL_KClO3)/SLC) × 100. The same formula was used to estimate the roots inhibition percentage. Samples (leaf, stem, and roots) for gene expression, biochemical, and physiological analyses were collected in triplicate at 0 h (untreated control) and 3 h after treatment, and immediately frozen in liquid nitrogen and kept in a −80 °C freezer for further processing.

4.2. Genomic DNA Extraction, Genotyping, and Molecular Marker Analysis

The genomic DNA was extracted from leaf samples using the previously described CTAB method with slight modifications [40]. Briefly, frozen leaf samples were crushed in 1.5 mL Eppendorf tubes (e-tubes). Then, 600 μL of 2× CTAB buffer (D2026, Lot D2618U12K; Biosesang, Seongnam-si, Korea) was added, and the mixture was vortexed and incubated for 30 min at 65 °C in a dry oven. A solution containing 500 μL of PCI (Phenol:Chloroform:Isoamylalcohol, 25:24:1, Batch No. 0888k0774; Sigma-Aldrich, St. Louis, MO, USA) was added, followed by gentle mixing by inversion. The tubes were centrifuged for 15 min at 13,000 rpm, and the supernatant was transferred to fresh e-tubes, followed by the addition of 500 μL of isopropanol (CAS: 67-63-0, Lot No. SHBC3600V; Sigma-Aldrich, St. Louis, MO, USA), mixing by inversion, incubation at −20 °C for 1 h, and centrifugation at 13,000 rpm for 7 min. The supernatant was removed and the pellets were washed with 70% ethanol (1 mL). Samples were centrifuged at 13,000 rpm for 2 min and ethanol was discarded, followed by drying at room temperature and re-suspension in 100 μL 1× TE buffer (Lot No. 0000278325; Promega, Madison, WI, USA).
A population consisting of 420 rice lines was genotyped in order to identify introgression lines carrying the indica alleles of the nitrate reductase (NR) or nitrate transporter (NRT) genes through polymerase chain reaction (PCR) using OsNR-IND2194 and OsNRT-M10-22 insertion/deletion (InDel) markers. The reaction mixture (15 µL) consisted of 1.5 µL 10X reaction buffer, 0.8 µL 10 mM dNTP, 1 µL 10 pM primers (forward and reverse), 0.1 µL Taq polymerase, and adjusted to the final volume with nuclease-free water. A 3-step cycling reaction was performed including polymerase activation at 95 °C for 5 min, strand separation at 94 °C for 20 s, annealing at 56–59 °C for 30 s for 35 cycles, extension at 72 °C for 1 min/kb, and a final extension at 72 °C for 5 min. The amplicons were separated on 3% agarose gel electrophoresis, and the bands were visualized using a gel documentation system. The sequences of InDel primers can be found in Table S1.

4.3. Total RNA Extraction, cDNA Synthesis, and qPCR Analysis

Total RNA was extracted from leaf samples using the TaKaRa MiniBEST Universal Plant RNA Extraction Kit (TAKARA Bio Inc., Cat. No. 9769 v201309Da, Kusatsu, Japan) following the manufacturer’s instructions. Briefly, frozen samples with liquid nitrogen were ground to fine powder, and 450 μL buffer RL (containing 50× dithiothreitol (DTT, 20 μL per 1 mL buffer RL) was added, and the mixture was pipetted up and down for few seconds until the lysate showed no precipitate, followed by centrifugation at 12,000 rpm for 5 min at 4 °C. The supernatant was transferred to fresh 1.5 mL Eppendorf tubes (e-tubes) (step 1). Then, 1 volume of ethanol (100%) was added to the mixture from step 1, followed by pipetting up and down to mix well, and 600 μL were transferred to a spin column with a 2 mL collection tube. The tubes were centrifuged at 12,000 rpm for 1 min, and the flow-through was discarded. Then, 500 μL buffer RWA was added, followed by centrifugation at 12,000 rpm for 30 sec, and the flow-through was discarded. Next, 600 μL buffer RWB was added to the spin column, followed by centrifugation at 12,000 rpm for 30 sec (this step was repeated twice), and the flow-through was discarded. Then, empty spin columns with collection tubes were centrifuges for 2 min at 12,000 rpm, and the spin columns were placed on fresh 1.5 mL e-tubes, followed by the addition of 100 μL RNase free water. Samples were incubated at room temperature for 5 min, followed by centrifugation at 12,000 rpm for 2 min (the elution step was repeated twice).
For cDNA (complementary DNA) synthesis [69], 1 µg of RNA was used as a template and the ProtoScript® II First Strand cDNA Synthesis Kit (New England BioLabs Inc., NEB Labs, MA, USA) was employed, as described by the manufacturer. The cDNA was then used as a template for qPCR (quantitative polymerase chain reaction) to investigate the transcript accumulation of the selected genes (see Table S1).
For gene expression analysis, a reaction mixture comprising 10 μL Prime Q-Master Mix (with SYBR green I), 0.1× ROX (0.1 μL/50×) (GENETBIO Inc., Daejeon, Korea) along with 1 μL of template DNA and 10 pM of each forward and reverse primer in a final volume of 20 µL reaction. A no-template control (NTC) was used. A 3-step reaction including polymerase activation at 95 °C for 10 min, a denaturation at 95 °C for 20 s, annealing at 60 °C for 30 sec and extension at 72 °C for 30 sec was performed in a Real-time PCR machine (QuantStudio™ Design and Analysis Software v.1.3, Applied Biosystems, Thermo Fisher Scientific, Seoul, Korea). Total reaction cycles were 40 and the data were normalized with relative expression of rice Actin1. The list of the genes with their corresponding primers sequences used in the study is given in Table S1.

4.4. Proline Measurement Assay

Proline quantification was done following the colorimetric method described earlier [70]. Approximately 100 mg leaf samples were homogenized in 3% sulfosalicylic acid (5 µL × mg−1 FW) in Eppendorf tubes (e-tube). Then, the homogenate was centrifuged using a benchtop centrifuge at 13,000 rpm for 5 min. Then, 100 µL from the supernatant of the plant extract was added to the reaction mixture (100 µL of 3% sulfosalicylic acid, 200 µL glacial acetic acid, 200 µL acidic ninhydrin (1.25 g ninhydrin (1,2,3-indantrione monohydrate), 30 mL glacial acetic acid, 20 mL of 6 M orthophosphoric acid (H3PO4)), dissolved into double distilled water and stored at 4 °C). The mixture was incubated at 96 °C for 1 h and immediately cooled on ice to terminate the reaction. The samples were extracted with toluene by adding 1 mL toluene to the reaction mixture and vortexing for about 20 s, and then leave for 5 min on the bench in order to allow separation of the organic and water phases. Then the chromophore (upper phase colored light red) containing toluene was moved into the fresh cuvette and the absorbance was read at 520 nm using toluene as reference. The proline concentration was calculated on the fresh weight basis and expressed in µg g−1 FW.

4.5. Catalase, Polyphenol Oxidase, and Peroxidase Activity Assay

The activity of antioxidant enzymes was assayed using the spectrophotometric method as described by Elavarthi and Martin [71]. Briefly, 100 mg of leaves were ground to a fine powder using liquid nitrogen (N2) and immediately homogenized in 50 mM phosphate buffer (pH = 7.5). The mixture was centrifuged for 10 min at 12,000 rpm at 4 °C after being kept on ice for about 10 min. The supernatant was then transferred to fresh 1.5 mL e-tubes. The homogenate was used as a crude enzyme source for catalase (CAT), peroxidase (POD), and polyphenol oxidase (PPO) activities.
Catalase activity was assayed as described earlier [49]. Briefly, a volume of 50 µL H2O2 (50 mM) was added to the crude enzyme extract, and the absorbance of the reaction mixture was measured at 240 nm wavelength after one minute. The activity of catalase was expressed in units per milligram of sample fresh weight [72].
The spectrophotometric method was also used to estimate the activity of peroxidase (POD) and polyphenol oxidase (PPO), as earlier described by Khan, et al. [73]. The supernatant obtained after centrifugation in the previous paragraph was used as crude enzyme source. For POD, the reaction contained 50 µL crude extract, 50 µL pyrogallol (50 µM), 25 µL H2O2 (50 mM), and 10 µL phosphate buffer (0.1 M), and incubated for 5 min in dark conditions. Then, 25 µL H2SO4 (5% v/v) was added to stop the reaction. The absorbance was measured at 420 nm wavelength [74]. For PPO activity analysis, the reaction mixture was composed of 50 μL pyrogallol (50 mM) and 100 μL phosphate buffer (0.1 M). The absorbance of the reaction was read at 420 nm wavelength, and calculations were done as previously described [75].

4.6. Chlorophyll, Pheophytin, and Carotenoids Content Measurements

The photosynthesis process has been shown to be crucial for plant growth and development, and productivity. Chlorophyll, pheophytin, and total carotenoids content were measured as described by Lichtenthaler [76]. About 200 mg leaf tissues were homogenized with acetone (80%), followed by centrifugation for 10 min at 3000 rpm. The supernatant was transferred to fresh falcon tubes, and the centrifugation was repeated until all chlorophyll was harvested in the solvent. The combined supernatant was made up to a known volume with 80% acetone. The absorbance of the extract was read at 645, 663, and 652 nm for chlorophyll a, b, and total chlorophyll; 480 and 510 nm for total carotenoids; and 665, 653, and 470 nm for pheophytin a, b, and total pheophytin. Acetone was used as a blank. The OD values at 645, 663, and 652 were used to calculate chlorophyll contents and total carotenoids as described earlier [77].

4.7. Lipid Peroxidation Assay

The lipid peroxidation level in the leaf tissue mentioned here was measured as the malondialdehyde (MDA) content, determined by thiobarbituric acid (TBARS) reaction [78]. About 200 mg of non-treated and treated samples were homogenized in 4 mL Trichloroacetic acid (TCA) (0.1%) with a porcelain mortar and pestle, followed by centrifugation for 15 min at 10,000 rpm. Then, 1 mL of the supernatant was harvested and 2 mL of TCA (20%) containing 0.5% TBA was added. The supernatant was incubated in a preheated water bath at 95 °C for 30 min and immediately cooled on ice. The reaction mixture was centrifuged for 10 min at 10,000 rpm, and the optical density (OD) was measured at 532 nm and 600 nm wavelength (OD600 as the non-specific absorbance that is subtracted from the OD532 reading). MDA level was calculated using Lambert’s equation (extinction coefficient of MDA 155 nM−1 × cm−1).

4.8. Nitrate Reductase Activity Assay

The nitrate reductase activity was assayed following an in vivo spectrophotometric method, as previously described [79], with slight modifications. NR enzyme activity was determined by measuring the amount of nitrite (NO2) released from plant tissues. Briefly, about 2 g of samples were homogenized into 2 mL reaction buffer composed of 40 mM potassium nitrate (KNO3), 0.08 M Sodium phosphate dibasic (Na2HPO4), 0.02 M Sodium phosphate monobasic (NaH2PO4), and 4% (v/v) n-propanol (CH3CH2CH2OH), with a pH of 7.5. The mixture was centrifuged at 12,000 rpm for 10 min. The supernatant was incubated for 2 h in dark conditions at room temperature, and the reaction was stopped by adding of 200 µL of 1% sulfanilamide (H2NC6H4SO2NH2) dissolved in 3N HCl and 200 µL of 0.05% N-(1-naphthyl) ethylenediamine hydrochloride (C10H7NHCH2CH2NH2 · 2HCl). We, therefore, determined NO2 concentration by reading the absorbance of the solution at A540 nm. In the case the absorbance was greater than 0.5, the reaction solution was diluted 10-fold with the reaction buffer and sulfanilamide.

4.9. Statistical Analysis

All the experiments were performed using a completely randomized design (CRD). The data were collected in triplicates and analyzed statistically with GraphPad Prism software (Version 7.00, 1992–2016 GraphPad, San Diego, CA, USA). Analysis of variance (ANOVA) for CRD was performed, and the Turkey’s multiple comparison was employed at a significance level of 0.05.

5. Conclusions

Understanding nitrogen (N) metabolism in higher plants and all aspects involved in the process is essential to improving nitrogen use efficiency (NUE) and rationalizing N application to plants. Here, a set of potassium chlorate (KClO3) sensitive rice lines (BC2F7) carrying the indica alleles of the nitrate reductase (NR) or the nitrate transporter (NRT), were exposed to KClO3 at seedling stage. The parental lines recorded distinctive phenotypic responses 7 days after treatment. In addition, OsNR2 expression was differentially regulated between the roots, stem, and leaf tissues, and between introgression lines. Similarly, the expression pattern of OsNIA1 and OsNIA2 in the roots, stem, and leaves indicated that they are differentially regulated by KClO3. Furthermore, the transcriptional divergence of the ammonium transporters and that of the glutamate synthase encoding genes and associated with the pattern of NR activity in the roots, would indicate the prevalence of nitrate (NO3) transport over ammonium (NH4+) transport. Moreover, the increase or decrease of catalase (CAT) and polyphenol oxidase (PPO) enzyme activities, coupled with the changes in the chloroplast pigments and proline contents, as well as the accumulation of malondialdehyde (MDA) revealed the extent of the oxidative damage by KClO3, resulting in lipid peroxidation. All results suggest that the inhibitory effect of KClO3 on the reducing activity of the nitrate reductase (NR), as well as that of the genes encoding the ammonium transporters and glutamate synthase are tissue-specific, rather than systematic to all plant tissues or organs in rice.

Supplementary Materials

The following are available online at https://www.mdpi.com/1422-0067/22/4/2192/s1, Figure S1: Optimization of potassium chlorate (KClO3) concentration using Nipponbare and 93-11 rice cultivars, Figure S2: Identified nitrate reductase (NR) and nitrate transporter (NRT) introgression lines, Figure S3: Chord diagram showing the shoot and roots growth patterns of Saeilmi (P1) and Milyang23 (P2), and four BC2F7 introgression lines, Table S1: List of primer sequences for gene expression used in the study.

Author Contributions

Conceptualization, J.-H.L., J.-Y.L. and D.S.; methodology, J.-H.L. and N.R.K.; validation, J.-M.K., J.-H.L. and D.S.; formal analysis, N.R.K., S.-Y.P., S.-M.L., Y.K., J.-K.C. and D.V.D.; investigation, N.R.K., J.-H.L. and S.-Y.P.; resources, J.-M.K., J.-H.L., J.-H.C. and J.-Y.L.; data curation, N.R.K.; writing—original draft preparation, N.R.K.; writing—review and editing, J.-H.L. and D.S.; visualization, and supervision, J.-H.L. and J.-M.K.; project administration, J.-H.L., J.-H.C. and J.-M.K.; funding acquisition, J.-M.K. and J.-H.L. All authors have read and agreed to the published version of the manuscript.

Funding

This work was supported by the Cooperative Research Program for Agriculture Science & Technology Development (Project No. PJ01506901).

Institutional Review Board Statement

Not applicable.

Informed Consent Statement

Not applicable.

Data Availability Statement

The data presented in this study are available in supplementary material.

Acknowledgments

This study was supported by 2021 the RDA Fellowship Program of NICS, Rural Development Administration, Korea.

Conflicts of Interest

The authors declare no conflict of interest.

References

  1. Shi, W.M.; Xu, W.F.; Li, S.M.; Zhao, X.Q.; Dong, G.Q. Responses of two rice cultivars differing in seedling-stage nitrogen use efficiency to growth under low-nitrogen conditions. Plant Soil 2010, 326, 291. [Google Scholar] [CrossRef]
  2. Mustapha, S.; Voncir, N.; Umar, S. Content and distribution of nitrogen forms in some black cotton soils in Akko LGA, Gombe State, Nigeria. Int. J. Soil Sci. 2011, 6, 275–281. [Google Scholar] [CrossRef]
  3. Harmsen, G.; Van Schreven, D. Mineralization of organic nitrogen in soil. In Advances in Agronomy; Elsevier: Amsterdam, The Netherlands, 1955; Volume 7, pp. 299–398. [Google Scholar]
  4. Cameron, R.; Posner, A. Mineralisable organic nitrogen in soil fractionated according to particle size. J. Soil Sci. 1979, 30, 565–577. [Google Scholar] [CrossRef]
  5. Bock, E.; Wagner, M. Oxidation of inorganic nitrogen compounds as an energy source. Prokaryotes 2006, 2, 457–495. [Google Scholar]
  6. Weidner, S.; Pühler, A.; Küster, H. Genomics insights into symbiotic nitrogen fixation. Curr. Opin. Biotechnol. 2003, 14, 200–205. [Google Scholar] [CrossRef]
  7. Wang, J.; Lu, K.; Nie, H.; Zeng, Q.; Wu, B.; Qian, J.; Fang, Z. Rice nitrate transporter OsNPF7. 2 positively regulates tiller number and grain yield. Rice 2018, 11, 1–13. [Google Scholar] [CrossRef] [Green Version]
  8. Xu, G.; Fan, X.; Miller, A.J. Plant nitrogen assimilation and use efficiency. Annu. Rev. Plant Biol. 2012, 63, 153–182. [Google Scholar] [CrossRef] [PubMed] [Green Version]
  9. Tang, Z.; Fan, X.; Li, Q.; Feng, H.; Miller, A.J.; Shen, Q.; Xu, G. Knockdown of a rice stelar nitrate transporter alters long-distance translocation but not root influx. Plant Physiol. 2012, 160, 2052–2063. [Google Scholar] [CrossRef] [PubMed] [Green Version]
  10. Yan, M.; Fan, X.; Feng, H.; Miller, A.J.; Shen, Q.; Xu, G. Rice OsNAR2.1 interacts with OsNRT2.1, OsNRT2.2 and OsNRT2.3a nitrate transporters to provide uptake over high and low concentration ranges. Plant Cell Environ. 2011, 34, 1360–1372. [Google Scholar] [CrossRef] [PubMed]
  11. Fan, X.; Shen, Q.; Ma, Z.; Zhu, H.; Yin, X.; Miller, A.J. A comparison of nitrate transport in four different rice (Oryza sativa L.) cultivars. Sci. China Ser. C Life Sci. 2005, 48, 897–911. [Google Scholar]
  12. Fan, X.; Feng, H.; Tan, Y.; Xu, Y.; Miao, Q.; Xu, G. A putative 6-transmembrane nitrate transporter OsNRT1. 1b plays a key role in rice under low nitrogen. J. Integr. Plant Biol. 2016, 58, 590–599. [Google Scholar] [CrossRef] [Green Version]
  13. Chao, D.-Y.; Lin, H.-X. Nitrogen-use efficiency: Transport solution in rice variations. Nat. Plants 2015, 1, 1–2. [Google Scholar] [CrossRef] [PubMed]
  14. Zhao, S.; Shi, W. Expression patterns of OsAMT (1.1–1.3), OsAMT3.1 and OsAMT4.1 in rice (Oryza sativa L.). Soil 2007, 39, 460–464. [Google Scholar]
  15. Zhao, S.; Ye, X.; Shi, W. Expression of OsAMT1 (1.1–1.3) in rice varieties differing in nitrogen accumulation. Russ. J. Plant Physiol. 2014, 61, 707–713. [Google Scholar] [CrossRef]
  16. Li, Y.; Ouyang, J.; Wang, Y.-Y.; Hu, R.; Xia, K.; Duan, J.; Wang, Y.; Tsay, Y.-F.; Zhang, M. Disruption of the rice nitrate transporter OsNPF2.2 hinders root-to-shoot nitrate transport and vascular development. Sci. Rep. 2015, 5, 1–10. [Google Scholar]
  17. Hu, B.; Wang, W.; Ou, S.; Tang, J.; Li, H.; Che, R.; Zhang, Z.; Chai, X.; Wang, H.; Wang, Y. Variation in NRT1.1B contributes to nitrate-use divergence between rice subspecies. Nat. Genet. 2015, 47, 834. [Google Scholar] [CrossRef]
  18. Wang, X.; Cai, X.; Xu, C.; Wang, Q.; Dai, S. Drought-responsive mechanisms in plant leaves revealed by proteomics. Int. J. Mol. Sci. 2016, 17, 1706. [Google Scholar] [CrossRef] [Green Version]
  19. Xuan, W.; Beeckman, T.; Xu, G. Plant nitrogen nutrition: Sensing and signaling. Curr. Opin. Plant Biol. 2017, 39, 57–65. [Google Scholar] [CrossRef] [PubMed]
  20. Ashoub, A.; Baeumlisberger, M.; Neupaertl, M.; Karas, M.; Brüggemann, W. Characterization of common and distinctive adjustments of wild barley leaf proteome under drought acclimation, heat stress and their combination. Plant Mol. Biol. 2015, 87, 459–471. [Google Scholar] [CrossRef]
  21. Wendelboe-Nelson, C.; Morris, P.C. Proteins linked to drought tolerance revealed by DIGE analysis of drought resistant and susceptible barley varieties. Proteomics 2012, 12, 3374–3385. [Google Scholar] [CrossRef]
  22. Tcherkez, G.; Hodges, M. How stable isotopes may help to elucidate primary nitrogen metabolism and its interaction with (photo) respiration in C3 leaves. J. Exp. Bot. 2007, 59, 1685–1693. [Google Scholar] [CrossRef] [Green Version]
  23. Lea, P.J.; Miflin, B.J. Glutamate synthase and the synthesis of glutamate in plants. Plant Physiol. Biochem. 2003, 41, 555–564. [Google Scholar] [CrossRef]
  24. Kabange, N.R.; Park, S.-Y.; Shin, D.; Lee, S.-M.; Jo, S.-M.; Kwon, Y.; Cha, J.-K.; Song, Y.-C.; Ko, J.-M.; Lee, J.-H.J.A. Identification of a Novel QTL for Chlorate Resistance in Rice (Oryza sativa L.). Agriculture 2020, 10, 360. [Google Scholar] [CrossRef]
  25. Gao, Z.; Wang, Y.; Chen, G.; Zhang, A.; Yang, S.; Shang, L.; Wang, D.; Ruan, B.; Liu, C.; Jiang, H.; et al. The indica nitrate reductase gene OsNR2 allele enhances rice yield potential and nitrogen use efficiency. Nat. Commun. 2019, 10, 1–10. [Google Scholar] [CrossRef]
  26. Zhang, Z.; Chu, C. Nitrogen-use divergence between indica and japonica rice: Variation at nitrate assimilation. Mol. Plant 2020, 13, 6–7. [Google Scholar] [CrossRef] [PubMed]
  27. Duan, D.; Zhang, H. A single SNP in NRT1. 1B has a major impact on nitrogen use efficiency in rice. Sci. China Life Sci. 2015, 58, 827. [Google Scholar] [CrossRef] [Green Version]
  28. Nakagawa, H.; Yamashita, N. Chlorate reducing activity of spinach nitrate reductase. Agric. Biol. Chem. 1986, 50, 1893–1894. [Google Scholar]
  29. Solomonson, L.; Vennesland, B. Nitrate reductase and chlorate toxicity in Chlorella vulgaris Beijerinck. Plant Physiol. 1972, 50, 421–424. [Google Scholar] [CrossRef] [Green Version]
  30. Roldan, M.; Reyes, F.; Moreno-Vivian, C.; Castillo, F. Chlorate and nitrate reduction in the phototrophic bacteriaRhodobacter capsulatus andRhodobacter sphaeroides. Curr. Microbiol. 1994, 29, 241–245. [Google Scholar] [CrossRef]
  31. Mészáros, A.; Pauk, J. Chlorate resistance as a tool to study the effect of nitrate reductase antisense gene in wheat. Cereal Res. Commun. 2002, 30, 245–252. [Google Scholar] [CrossRef]
  32. Kamal, N.M.; Gorafi, Y.S.A.; Mega, R.; Tsujimoto, H.J.A. Physiological response of wheat to chemical desiccants used to simulate post-anthesis drought stress. Agronomy 2018, 8, 44. [Google Scholar] [CrossRef] [Green Version]
  33. Teng, S.; Tian, C.; Chen, M.; Zeng, D.; Guo, L.; Zhu, L.; Han, B.; Qian, Q.J.E. QTLs and candidate genes for chlorate resistance in rice (Oryzasativa L.). Euphytica 2006, 152, 141–148. [Google Scholar] [CrossRef]
  34. Inzé, D.; Van Montagu, M. Oxidative stress in plants. Curr. Opin. Biotechnol. 1995, 6, 153–158. [Google Scholar] [CrossRef]
  35. Bartosz, G. Oxidative stress in plants. Acta Physiol. 1997, 19, 47–64. [Google Scholar] [CrossRef]
  36. Corpas, F.J.; Chaki, M.; Fernandez-Ocana, A.; Valderrama, R.; Palma, J.M.; Carreras, A.; Begara-Morales, J.C.; Airaki, M.; del Río, L.A.; Barroso, J.B.J.P.; et al. Metabolism of reactive nitrogen species in pea plants under abiotic stress conditions. Plant Cell Physiol. 2008, 49, 1711–1722. [Google Scholar] [CrossRef] [PubMed]
  37. Bhattacharjee, S. Reactive oxygen species and oxidative burst: Roles in stress, senescence and signal transducation in plants. Curr. Sci. 2005, 89, 1113–1121. [Google Scholar]
  38. Parankusam, S.; Adimulam, S.S.; Bhatnagar-Mathur, P.; Sharma, K.K. Nitric oxide (NO) in plant heat stress tolerance: Current knowledge and perspectives. Front. Plant Sci. 2017, 8, 1582. [Google Scholar] [CrossRef]
  39. Pavlovic, D.; Nikolic, B.; Djurovic, S.; Waisi, H.; Andjelkovic, A.; Marisavljevic, D. Chlorophyll as a measure of plant health: Agroecological aspects. Pestic. Fitomed. 2014, 29, 21–34. [Google Scholar] [CrossRef]
  40. Rebeiz, C.A. Chlorophyll Biosynthesis and Technological Applications; Springer: Berlin/Heidelberg, Germany, 2014. [Google Scholar]
  41. Smith, S.; De Smet, I. Root system architecture: Insights from Arabidopsis and cereal crops. R. Soc. 2012, 367, 1595. [Google Scholar] [CrossRef] [PubMed] [Green Version]
  42. Pandey, A.; Suter, H.; He, J.-Z.; Hu, H.-W.; Chen, D. Dissimilatory nitrate reduction to ammonium dominates nitrate reduction in long-term low nitrogen fertilized rice paddies. Soil Biol. Biochem. 2019, 131, 149–156. [Google Scholar] [CrossRef]
  43. Kuiper, P.J.; Kuiper, D.; Schuit, J. Root functioning under stress conditions: An introduction. Plant Soil 1988, 249–253. [Google Scholar] [CrossRef]
  44. Hsiao, T.C.; Xu, L.K. Sensitivity of growth of roots versus leaves to water stress: Biophysical analysis and relation to water transport. J. Exp. Bot. 2000, 51, 1595–1616. [Google Scholar] [CrossRef]
  45. Khan, M.; Gemenet, D.C.; Villordon, A. Root system architecture and abiotic stress tolerance: Current knowledge in root and tuber crops. Front. Plant Sci. 2016, 7, 1584. [Google Scholar] [CrossRef] [PubMed] [Green Version]
  46. Borges, R.; Miguel, E.C.; Dias, J.M.; da Cunha, M.; Bressan-Smith, R.E.; de Oliveira, J.G.; de Souza Filho, G.A. Ultrastructural, physiological and biochemical analyses of chlorate toxicity on rice seedlings. Plant Sci. 2004, 166, 1057–1062. [Google Scholar] [CrossRef]
  47. LaBrie, S.T.; Wilkinson, J.Q.; Crawford, N.M. Effect of chlorate treatment on nitrate reductase and nitrite reductase gene expression in Arabidopsis thaliana. Plant Physiol. 1991, 97, 873–879. [Google Scholar] [CrossRef] [PubMed] [Green Version]
  48. Zhao, C.-m.; Hasegawa, H.; Ichii, M. A chlorate resistant mutant of rice (Oryza sativa L.) with normal nitrate uptake and nitrate reductase activity. Breed. Sci. 2000, 50, 9–15. [Google Scholar] [CrossRef]
  49. Rolly, N.K.; Lee, S.-U.; Imran, Q.M.; Hussain, A.; Mun, B.-G.; Kim, K.-M.; Yun, B.-W. Nitrosative stress-mediated inhibition of OsDHODH1 gene expression suggests roots growth reduction in rice (Oryza sativa L.). 3 Biotech 2019, 9, 273. [Google Scholar] [CrossRef]
  50. Wilkinson, J.Q.; Crawford, N.M. Identification and characterization of a chlorate-resistant mutant of Arabidopsis thaliana with mutations in both nitrate reductase structural genes NIA1 and NIA2. Mol. Gen. Genet. 1993, 239, 289–297. [Google Scholar] [CrossRef]
  51. Islam, M.S. Sensing and Uptake of Nitrogen in Rice Plant: A Molecular View. Rice Sci. 2019, 26, 343–355. [Google Scholar] [CrossRef]
  52. Wang, W.; Hu, B.; Li, A.; Chu, C. NRT1.1s in plants: Functions beyond nitrate transport. J. Exp. Bot. 2020, 71, 4373–4379. [Google Scholar] [CrossRef]
  53. Zhang, G.-B.; Meng, S.; Gong, J.-M. The expected and unexpected roles of nitrate transporters in plant abiotic stress resistance and their regulation. Int. J. Mol. Sci. 2018, 19, 3535. [Google Scholar] [CrossRef] [PubMed] [Green Version]
  54. von Wirén, N.; Gojon, A.; Chaillou, S.; Raper, D. Mechanisms and regulation of ammonium uptake in higher plants. In Plant Nitrogen; Springer: Berlin/Heidelberg, Germany, 2001; pp. 61–77. [Google Scholar]
  55. Bao, A.; Liang, Z.; Zhao, Z.; Cai, H. Overexpressing of OsAMT1-3, a high affinity ammonium transporter gene, modifies rice growth and carbon-nitrogen metabolic status. Int. J. Mol. Sci. 2015, 16, 9037–9063. [Google Scholar] [CrossRef] [PubMed] [Green Version]
  56. Ferreira, L.M.; de Souza, V.M.; Tavares, O.C.H.; Zonta, E.; Santa-Catarina, C.; de Souza, S.R.; Fernandes, M.S.; Santos, L.A. OsAMT1.3 expression alters rice ammonium uptake kinetics and root morphology. Plant Biotechnol. Rep. 2015, 9, 221–229. [Google Scholar] [CrossRef]
  57. Gaur, V.S.; Singh, U.; Gupta, A.K.; Kumar, A. Influence of different nitrogen inputs on the members of ammonium transporter and glutamine synthetase genes in two rice genotypes having differential responsiveness to nitrogen. Mol. Biol. Rep. 2012, 39, 8035–8044. [Google Scholar] [CrossRef]
  58. Kamachi, K.; Yamaya, T.; Mae, T.; Ojima, K. A role for glutamine synthetase in the remobilization of leaf nitrogen during natural senescence in rice leaves. Plant Physiol. 1991, 96, 411–417. [Google Scholar] [CrossRef] [Green Version]
  59. Gill, S.S.; Tuteja, N. Reactive oxygen species and antioxidant machinery in abiotic stress tolerance in crop plants. Plant Physiol. Biochem. 2010, 48, 909–930. [Google Scholar] [CrossRef]
  60. Borsani, O.; Valpuesta, V.; Botella, M.A. Evidence for a role of salicylic acid in the oxidative damage generated by NaCl and osmotic stress in Arabidopsis seedlings. Plant Physiol. 2001, 126, 1024–1030. [Google Scholar] [CrossRef] [PubMed] [Green Version]
  61. Corpas, F.J. What is the role of hydrogen peroxide in plant peroxisomes? Plant Biol. 2015, 17, 1099–1103. [Google Scholar] [CrossRef]
  62. Rolly, N.K.; Imran, Q.M.; Shahid, M.; Imran, M.; Khan, M.; Lee, S.-U.; Hussain, A.; Lee, I.-J.; Yun, B.-W. Drought-induced AtbZIP62 transcription factor regulates drought stress response in Arabidopsis. Plant Physiol. Biochem. 2020, 156, 384–395. [Google Scholar] [CrossRef]
  63. Sharma, P.; Jha, A.B.; Dubey, R.S.; Pessarakli, M. Reactive oxygen species, oxidative damage, and antioxidative defense mechanism in plants under stressful conditions. J. Bot. 2012, 2012. [Google Scholar] [CrossRef] [Green Version]
  64. Mittler, R. Oxidative stress, antioxidants and stress tolerance. Trends Plant Sci. 2002, 7, 405–410. [Google Scholar] [CrossRef]
  65. Fisher, H.; Orth, H. Die Chemie des pyrrols. Acad. Verl. Leipz. Ger. 1937, 623, 673. [Google Scholar]
  66. Rolly, N.K.; Imran, Q.M.; Lee, I.-J.; Yun, B.-W. Salinity Stress-Mediated Suppression of Expression of Salt Overly Sensitive Signaling Pathway Genes Suggests Negative Regulation by AtbZIP62 Transcription Factor in Arabidopsis thaliana. Int. J. Mol. Sci. 2020, 21, 1726. [Google Scholar] [CrossRef] [PubMed] [Green Version]
  67. Armengaud, P.; Thiery, L.; Buhot, N.; Grenier-de March, G.; Savouré, A. Transcriptional regulation of proline biosynthesis in Medicago truncatula reveals developmental and environmental specific features. Physiol. Plant. 2004, 120, 442–450. [Google Scholar] [CrossRef]
  68. Newton, R.; Sen, S.; Puryear, J. Free proline changes in Pinus taeda L. callus in response to drought stress. Tree Physiol. 1986, 1, 325–332. [Google Scholar] [CrossRef]
  69. Mun, B.-G.; Lee, S.-U.; Hussain, A.; Kim, H.-H.; Rolly, N.K.; Jung, K.-H.; Yun, B.-W. S-nitrosocysteine-responsive genes modulate diverse regulatory pathways in Oryza sativa: A transcriptome profiling study. Funct. Plant Biol. 2018, 45, 630–644. [Google Scholar] [CrossRef] [PubMed]
  70. Ábrahám, E.; Hourton-Cabassa, C.; Erdei, L.; Szabados, L. Methods for determination of proline in plants. In Plant Stress Tolerance; Springer: Berlin/Heidelberg, Germany, 2010; pp. 317–331. [Google Scholar]
  71. Elavarthi, S.; Martin, B. Spectrophotometric assays for antioxidant enzymes in plants. In Plant Stress Tolerance; Springer: Berlin/Heidelberg, Germany, 2010; pp. 273–280. [Google Scholar]
  72. Aebi, H. Catalase in vitro. In Methods in Enzymology; Elsevier: Amsterdam, The Netherlands, 1984; Volume 105, pp. 121–126. [Google Scholar]
  73. Khan, A.R.; Ullah, I.; Waqas, M.; Park, G.-S.; Khan, A.L.; Hong, S.-J.; Ullah, R.; Jung, B.K.; Park, C.E.; Ur-Rehman, S. Host plant growth promotion and cadmium detoxification in Solanum nigrum, mediated by endophytic fungi. Ecotoxicol. Environ. Saf. 2017, 136, 180–188. [Google Scholar] [CrossRef]
  74. Shannon, L.M.; Kay, E.; Lew, J.Y. Peroxidase isozymes from horseradish roots I. Isolation and physical properties. J. Biol. Chem. 1966, 241, 2166–2172. [Google Scholar] [CrossRef]
  75. Chance, B.; Maehly, A. Assay of catalases and peroxidases. Methods Biochem. Anal. 1954, 1, 357–424. [Google Scholar]
  76. Lichtenthaler, H.K. Chlorophylls and carotenoids: Pigments of photosynthetic biomembranes. In Methods in Enzymology; Elsevier: Amsterdam, The Netherlands, 1987; Volume 148, pp. 350–382. [Google Scholar]
  77. Sumanta, N.; Haque, C.I.; Nishika, J.; Suprakash, R. Spectrophotometric analysis of chlorophylls and carotenoids from commonly grown fern species by using various extracting solvents. Res. J. Chem. Sci. 2014, 2231, 606X. [Google Scholar]
  78. Jambunathan, N. Determination and detection of reactive oxygen species (ROS), lipid peroxidation, and electrolyte leakage in plants. In Plant Stress Tolerance; Springer: Berlin/Heidelberg, Germany, 2010; pp. 291–297. [Google Scholar]
  79. Márton, L.; Sidorov, V.; Biasini, G.; Maliga, P. Complementation in somatic hybrids indicates four types of nitrate reductase deficient lines in Nicotiana plumbaginifolia. Mol. Gen. Genet. MGG 1982, 187, 1–3. [Google Scholar] [CrossRef]
Figure 1. Genotype–phenotype correlation of the nitrate reductase and nitrate transporter introgression lines and parental line in response to potassium chlorate (KClO3). (A) The box plots display the shoot growth patterns of the Saeilmi (P1, japonica), Milyang23 (P2, indica), Nipponbare (typical japonica cultivar), 93-11 (typical indica cultivar), nitrate reductase (NR, n = 26), and nitrate transporter (NRT, n = 59) introgression lines. (B) Box plots showing the root growth patterns, and (C) the KClO3 response.
Ijms 22 02192 g001
Figure 2. Frequency distribution, clustering, and principal component analysis results. Frequency distribution of the shoot growth of the nitrate reductase (NR, n = 26) (A), and nitrate transporter (NRT, n = 59) (B) introgression rice lines showing a normal distribution, (C) frequency distribution of the roots growth of NR, and (D) NRT introgression lines showing a positive skewness and a normal distribution, respectively. (E) frequency distribution of the KClO3 response of NR, (F) NRT introgression rice lines showing a positive skewness, (G) Clusters showing the distinctive phenotypic response between Saeilmi (P1) and Milyang23 (P2), and that of the NR or NRT introgression lines, and (H) 2-D principal component analysis (PCA) indicating the correlation between traits, and (IK) shoot and root growth pattern of Saeilmi (P1) and Milyang23 (P2) in response to KClO3.
Ijms 22 02192 g002
Figure 3. Changes in the activity of nitrate reductase (NR) and antioxidant enzymes. (AC) Tissue-specific activity of the nitrate reductase (NR) enzyme in response to 0.5% potassium chlorate (KClO3) 3 h after treatment, (D) catalase (CAT) activity, (E) peroxidase (POD) activity, and (F) polyphenol oxidase (PPO) activity in roots of rice seedlings exposed to KClO3. White bars are controls, while black bars are KClO3 treated seedlings. Bars are mean values of triplicates ± SE. *** p < 0.001, ** p < 0.01, ns non-significant.
Ijms 22 02192 g003
Figure 4. Pattern of chloroplast pigment content under potassium chlorate treatment. (AD) Chlorophyll a, b, a+b, and carotenoids relative to chlorophyll (Cx+c), respectively, (EH) Pheophytin a, b, a+b, and carotenoid relative to pheophytin (Cph x+c), respectively. Bars are mean values of triplicates ±SE. *** p < 0.001, ** p < 0.01, ns non-significant.
Ijms 22 02192 g004
Figure 5. Lipid peroxidation and proline change in proline content. (A) Lipid peroxidation by malondialdehyde (MDA) content in the roots, (B) stem, and (C) leaf tissues in response to potassium chlorate (KClO3) treatment, and (D) pattern of proline accumulation under KClO3 treatment. Bars are mean values of triplicates ±SE. *** p < 0.001, ** p < 0.01, * p < 0.05, ns non-significant.
Ijms 22 02192 g005
Figure 6. Transcriptional patterns of major nitrogen use efficiency (NUE) genes in different rice tissues under potassium chlorate (KClO3) treatment. Transcriptional patterns of major NUE genes in different rice tissues under potassium chlorate treatment. (AC) Transcriptional pattern of OsNR2 in the roots, stem, and leaves of three week-old nitrate reductase (NR) and nitrate transporter (NRT) introgression rice lines in response to 0.05% potassium chlorate (KClO3), soon after treatment. (DF) Transcript accumulation of OsNRT1.1B, (GI) OsAMT1.3, (JL) OsAMT2.3, (MO) OsGLU1, (PR) OsGLU2, (SU) OsNIA1, and (VX) OsNIA2 under the same conditions. Bars are mean values of triplicates ±SE. *** p < 0.001, ** p < 0.01, * p < 0.05, ns non-significant. Data were compared with the expression level of Milyang23 (P2, KClO3 sensitive) for the statistical significance.
Ijms 22 02192 g006aIjms 22 02192 g006b
Figure 7. Signaling model summarizing the morphological, physio-biochemical, and molecular response of NR and NRT introgression rice lines towards potassium chlorate. The phenotypic responses, the physiological and biochemical changes, as well as the molecular responses of the parental lines Saeilmi (P1, japonica) and Milyang23 (P2, indica) and their derived introgression lines (nitrate reductase or nitrate transporter, BC2F7) are summarized in the above signaling model. Continuous lines with an arrow indicate upregulation (for gene expression) or induction/increase (for enzyme activity or accumulation of physiological components). Continuous lines with a perpendicular bar indicate downregulation or inhibition/decrease. Dotted lines with or without an arrow or a perpendicular bar indicate that one of the introgression lines differentially expressed a particular gene in the corresponding rice tissue. This signaling model was created using ConceptDraw Pro v.10.3.2.114 (CS Odessa Corp, San Jose, CA, USA).
Ijms 22 02192 g007
Publisher’s Note: MDPI stays neutral with regard to jurisdictional claims in published maps and institutional affiliations.

