
Lysophosphatidic Acid Induces Aerobic Glycolysis, Lipogenesis, and Increased Amino Acid Uptake in BV-2 Microglia

 , , , , ,
  ,
,
Abstract
1. Introduction
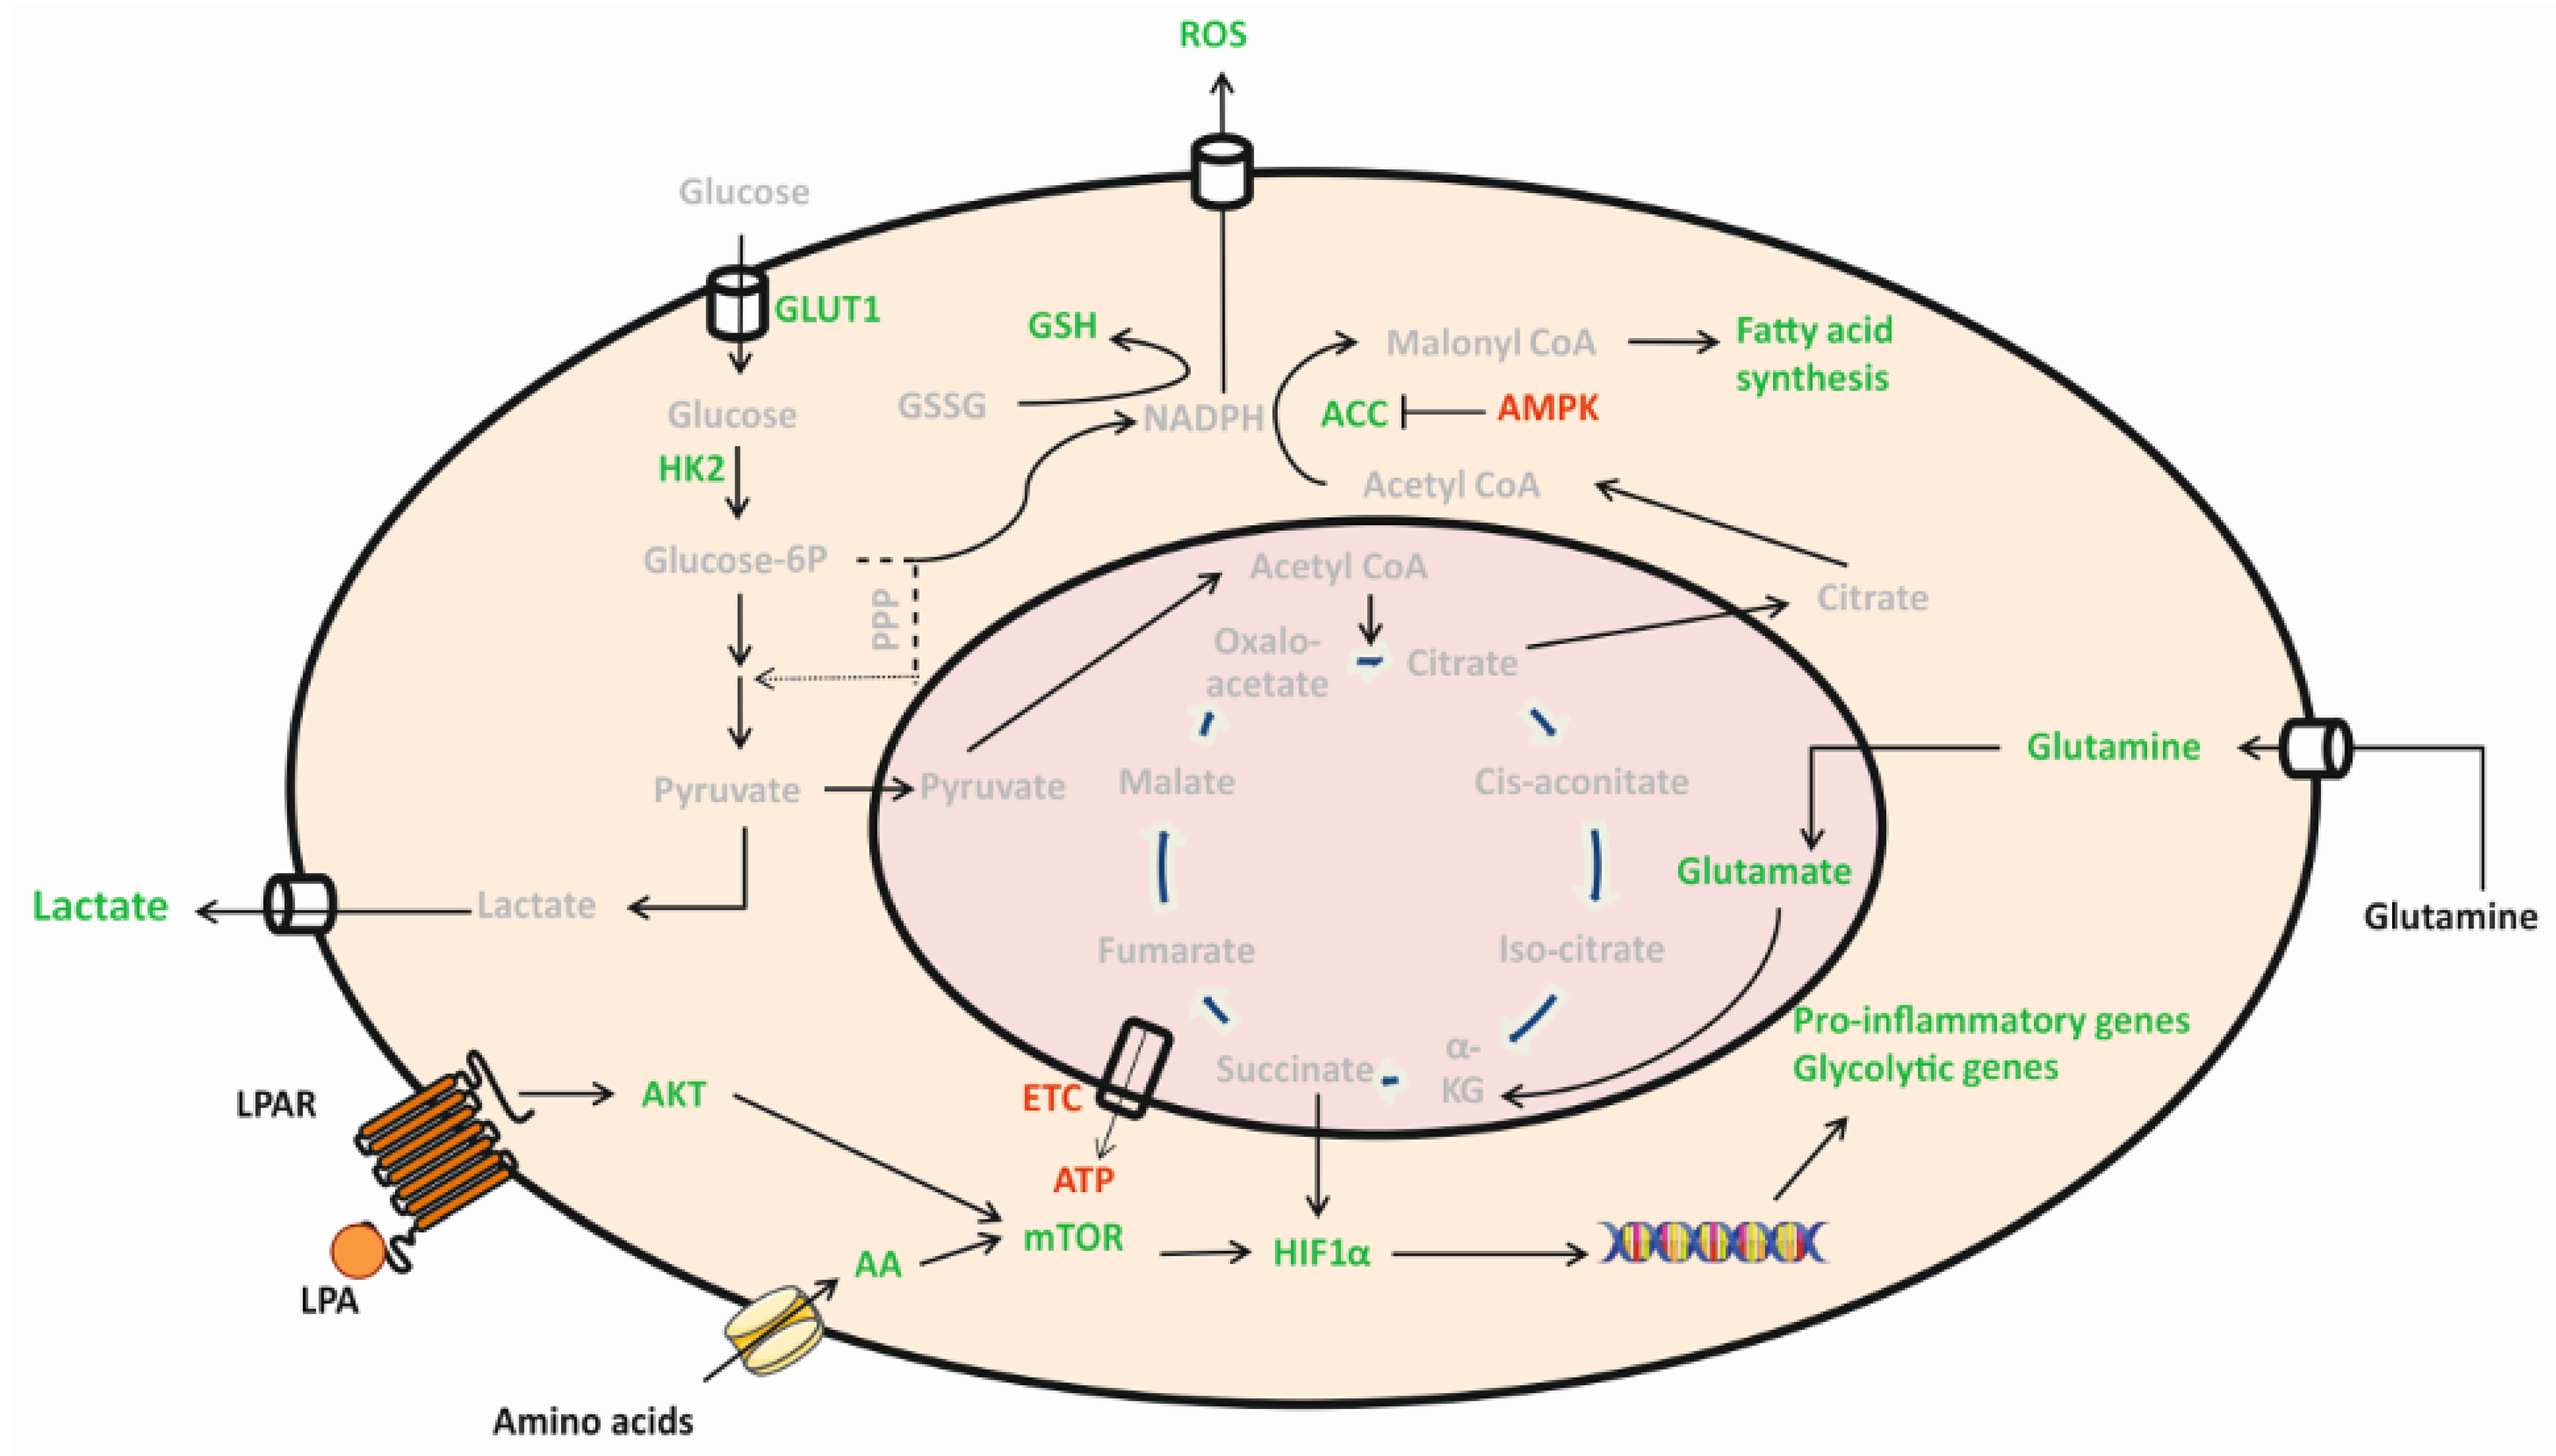
2. Results
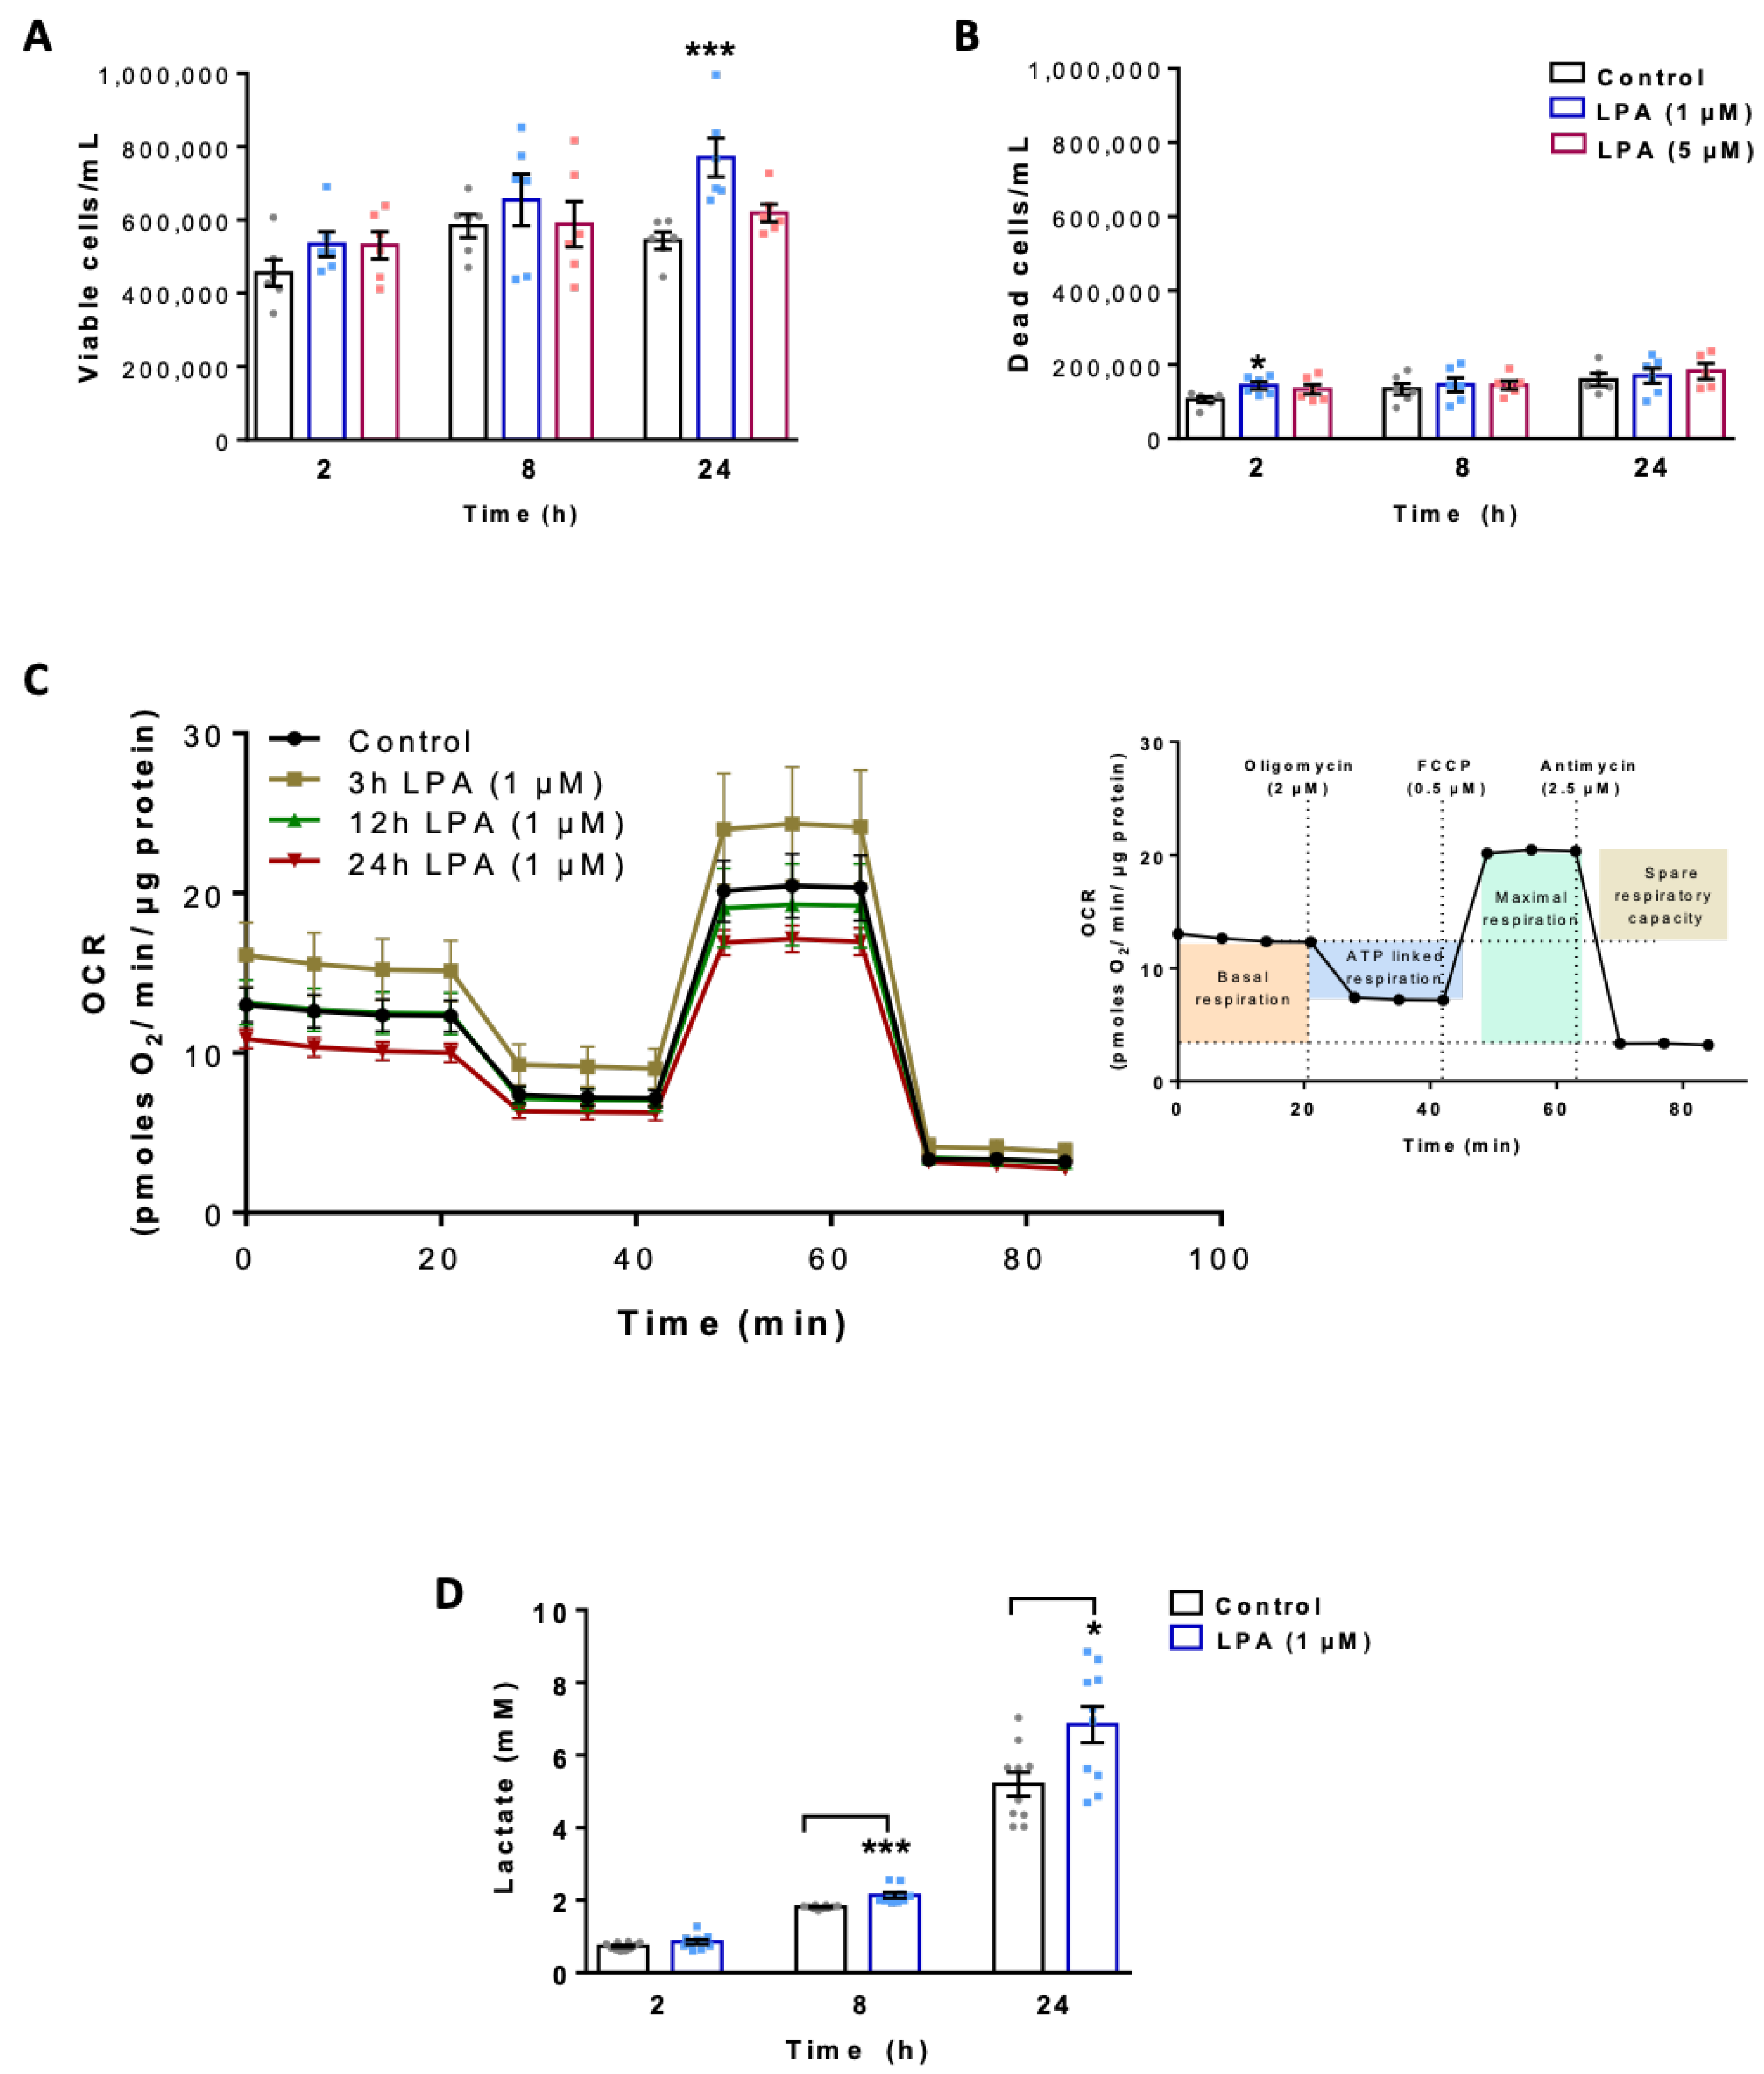
2.1. LPA Impacts Energy Metabolism of BV-2 Cells
2.2. LPA Activates Akt and mTOR and Induces HIF1α Expression
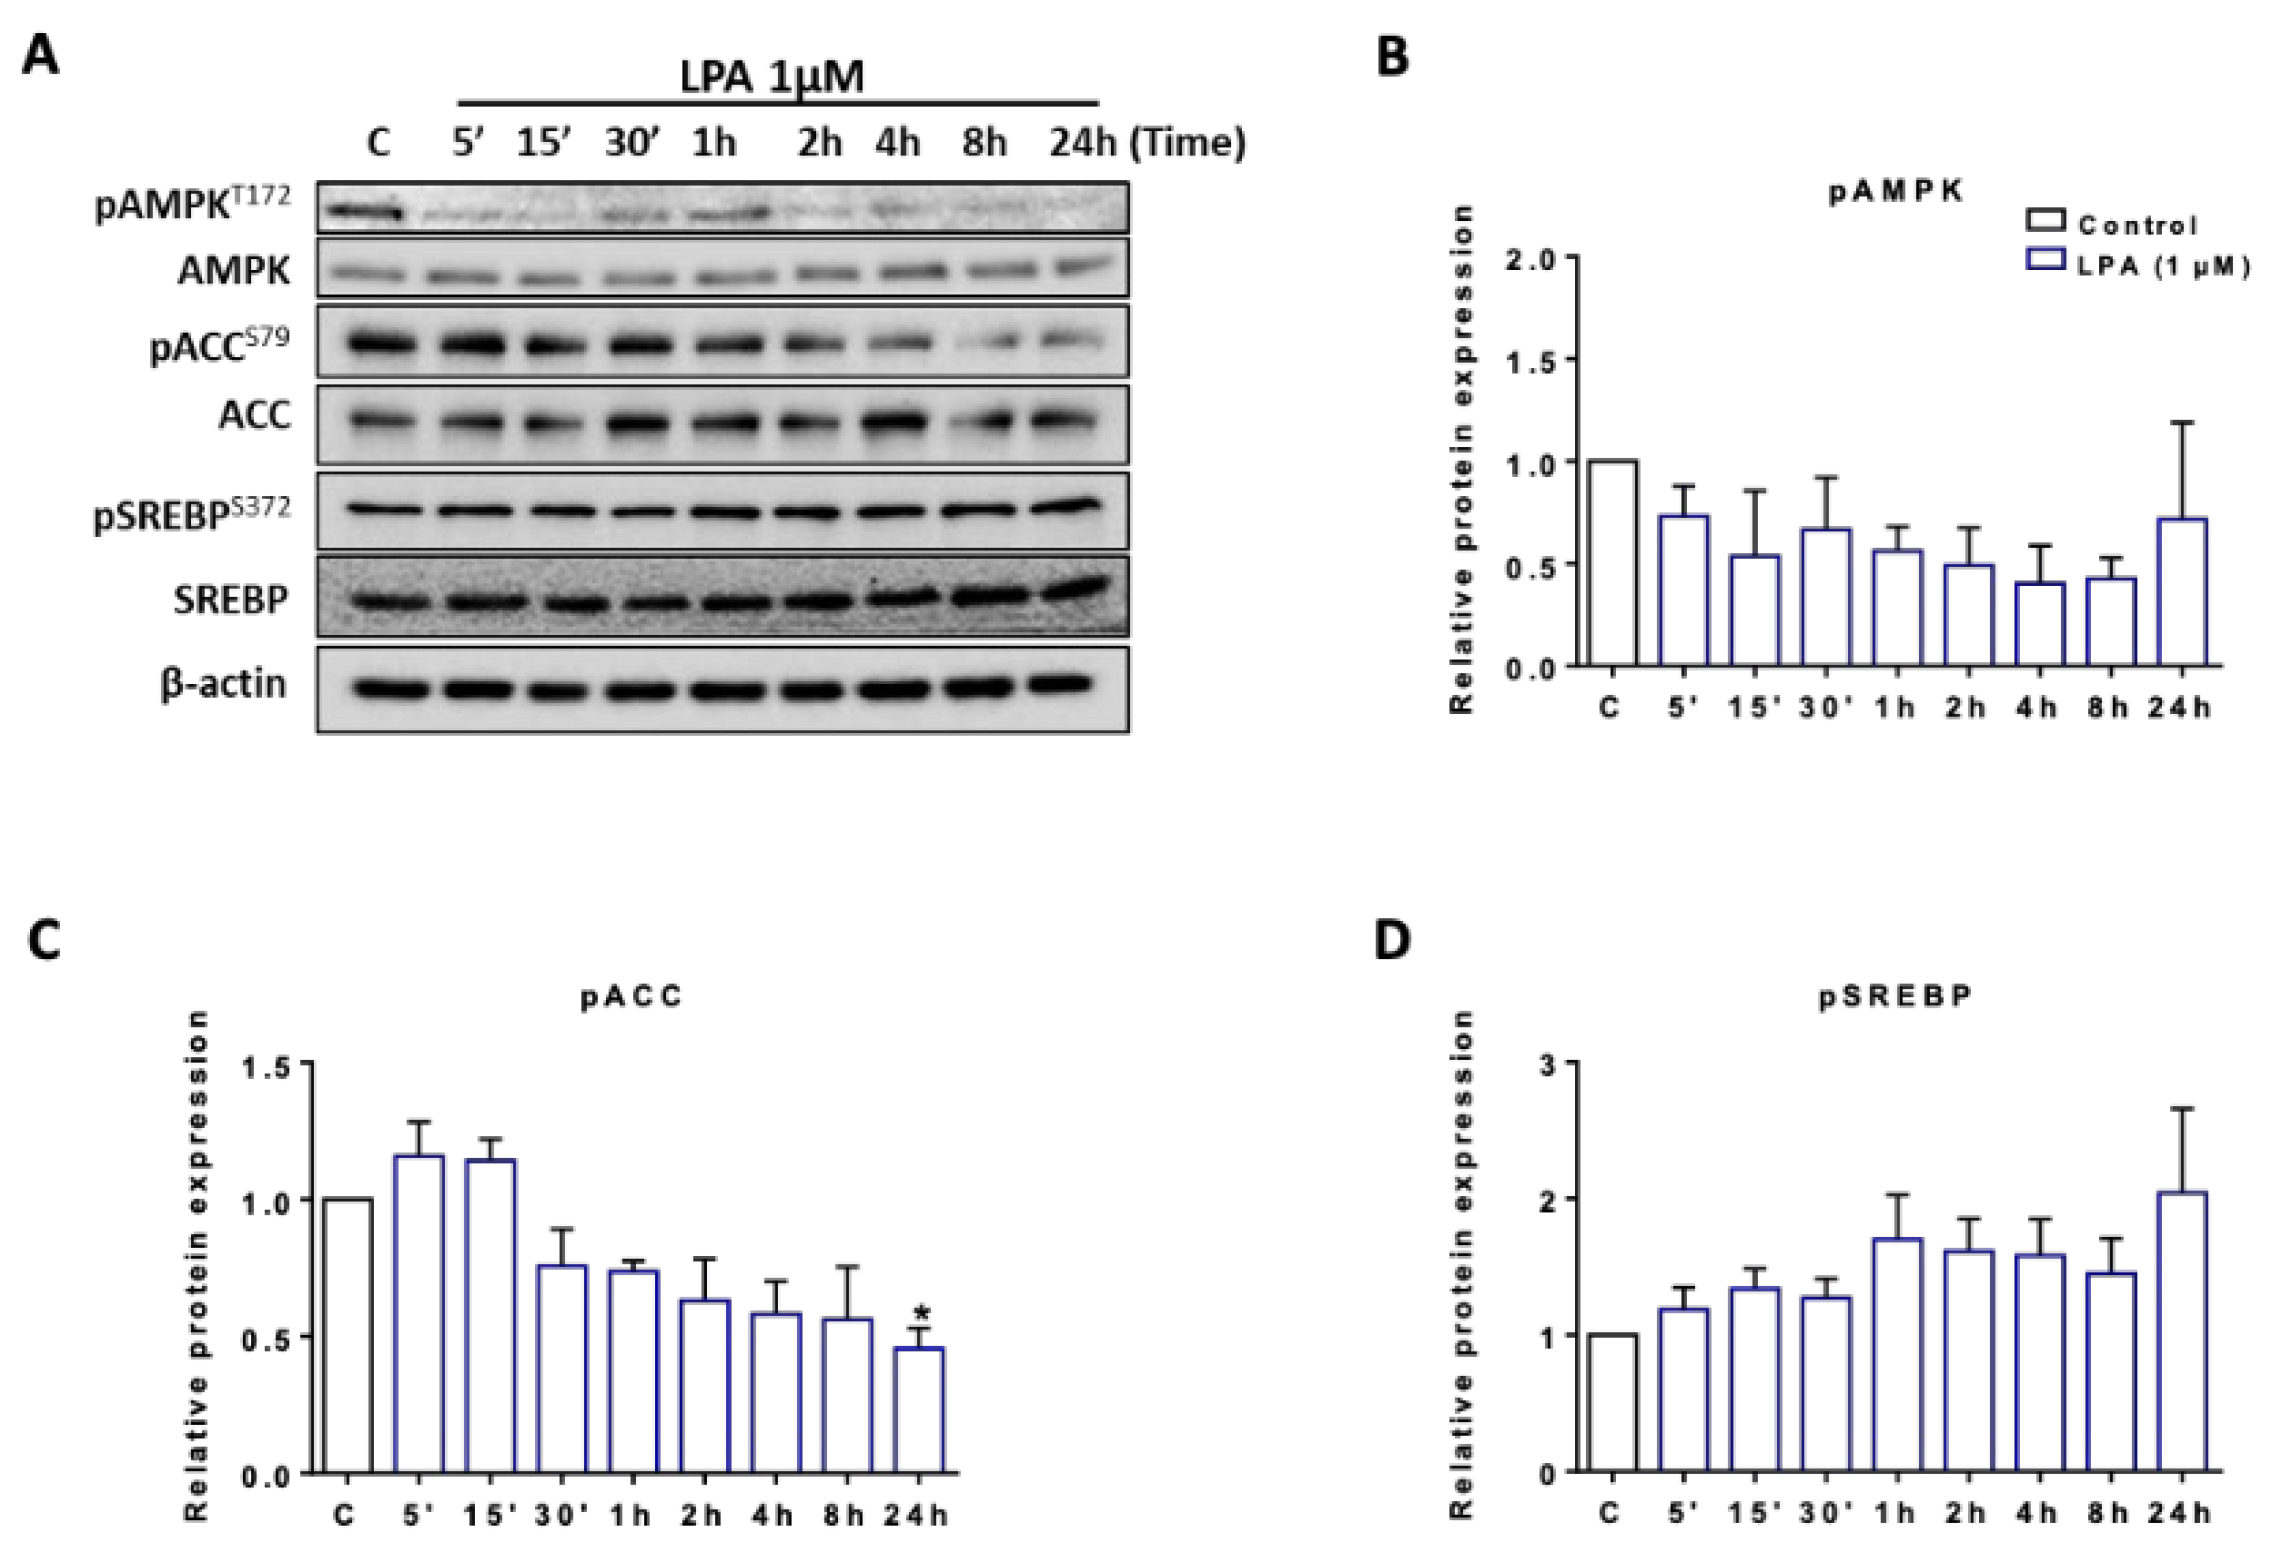
2.3. LPA Induces Lipogenesis in BV-2 Cells
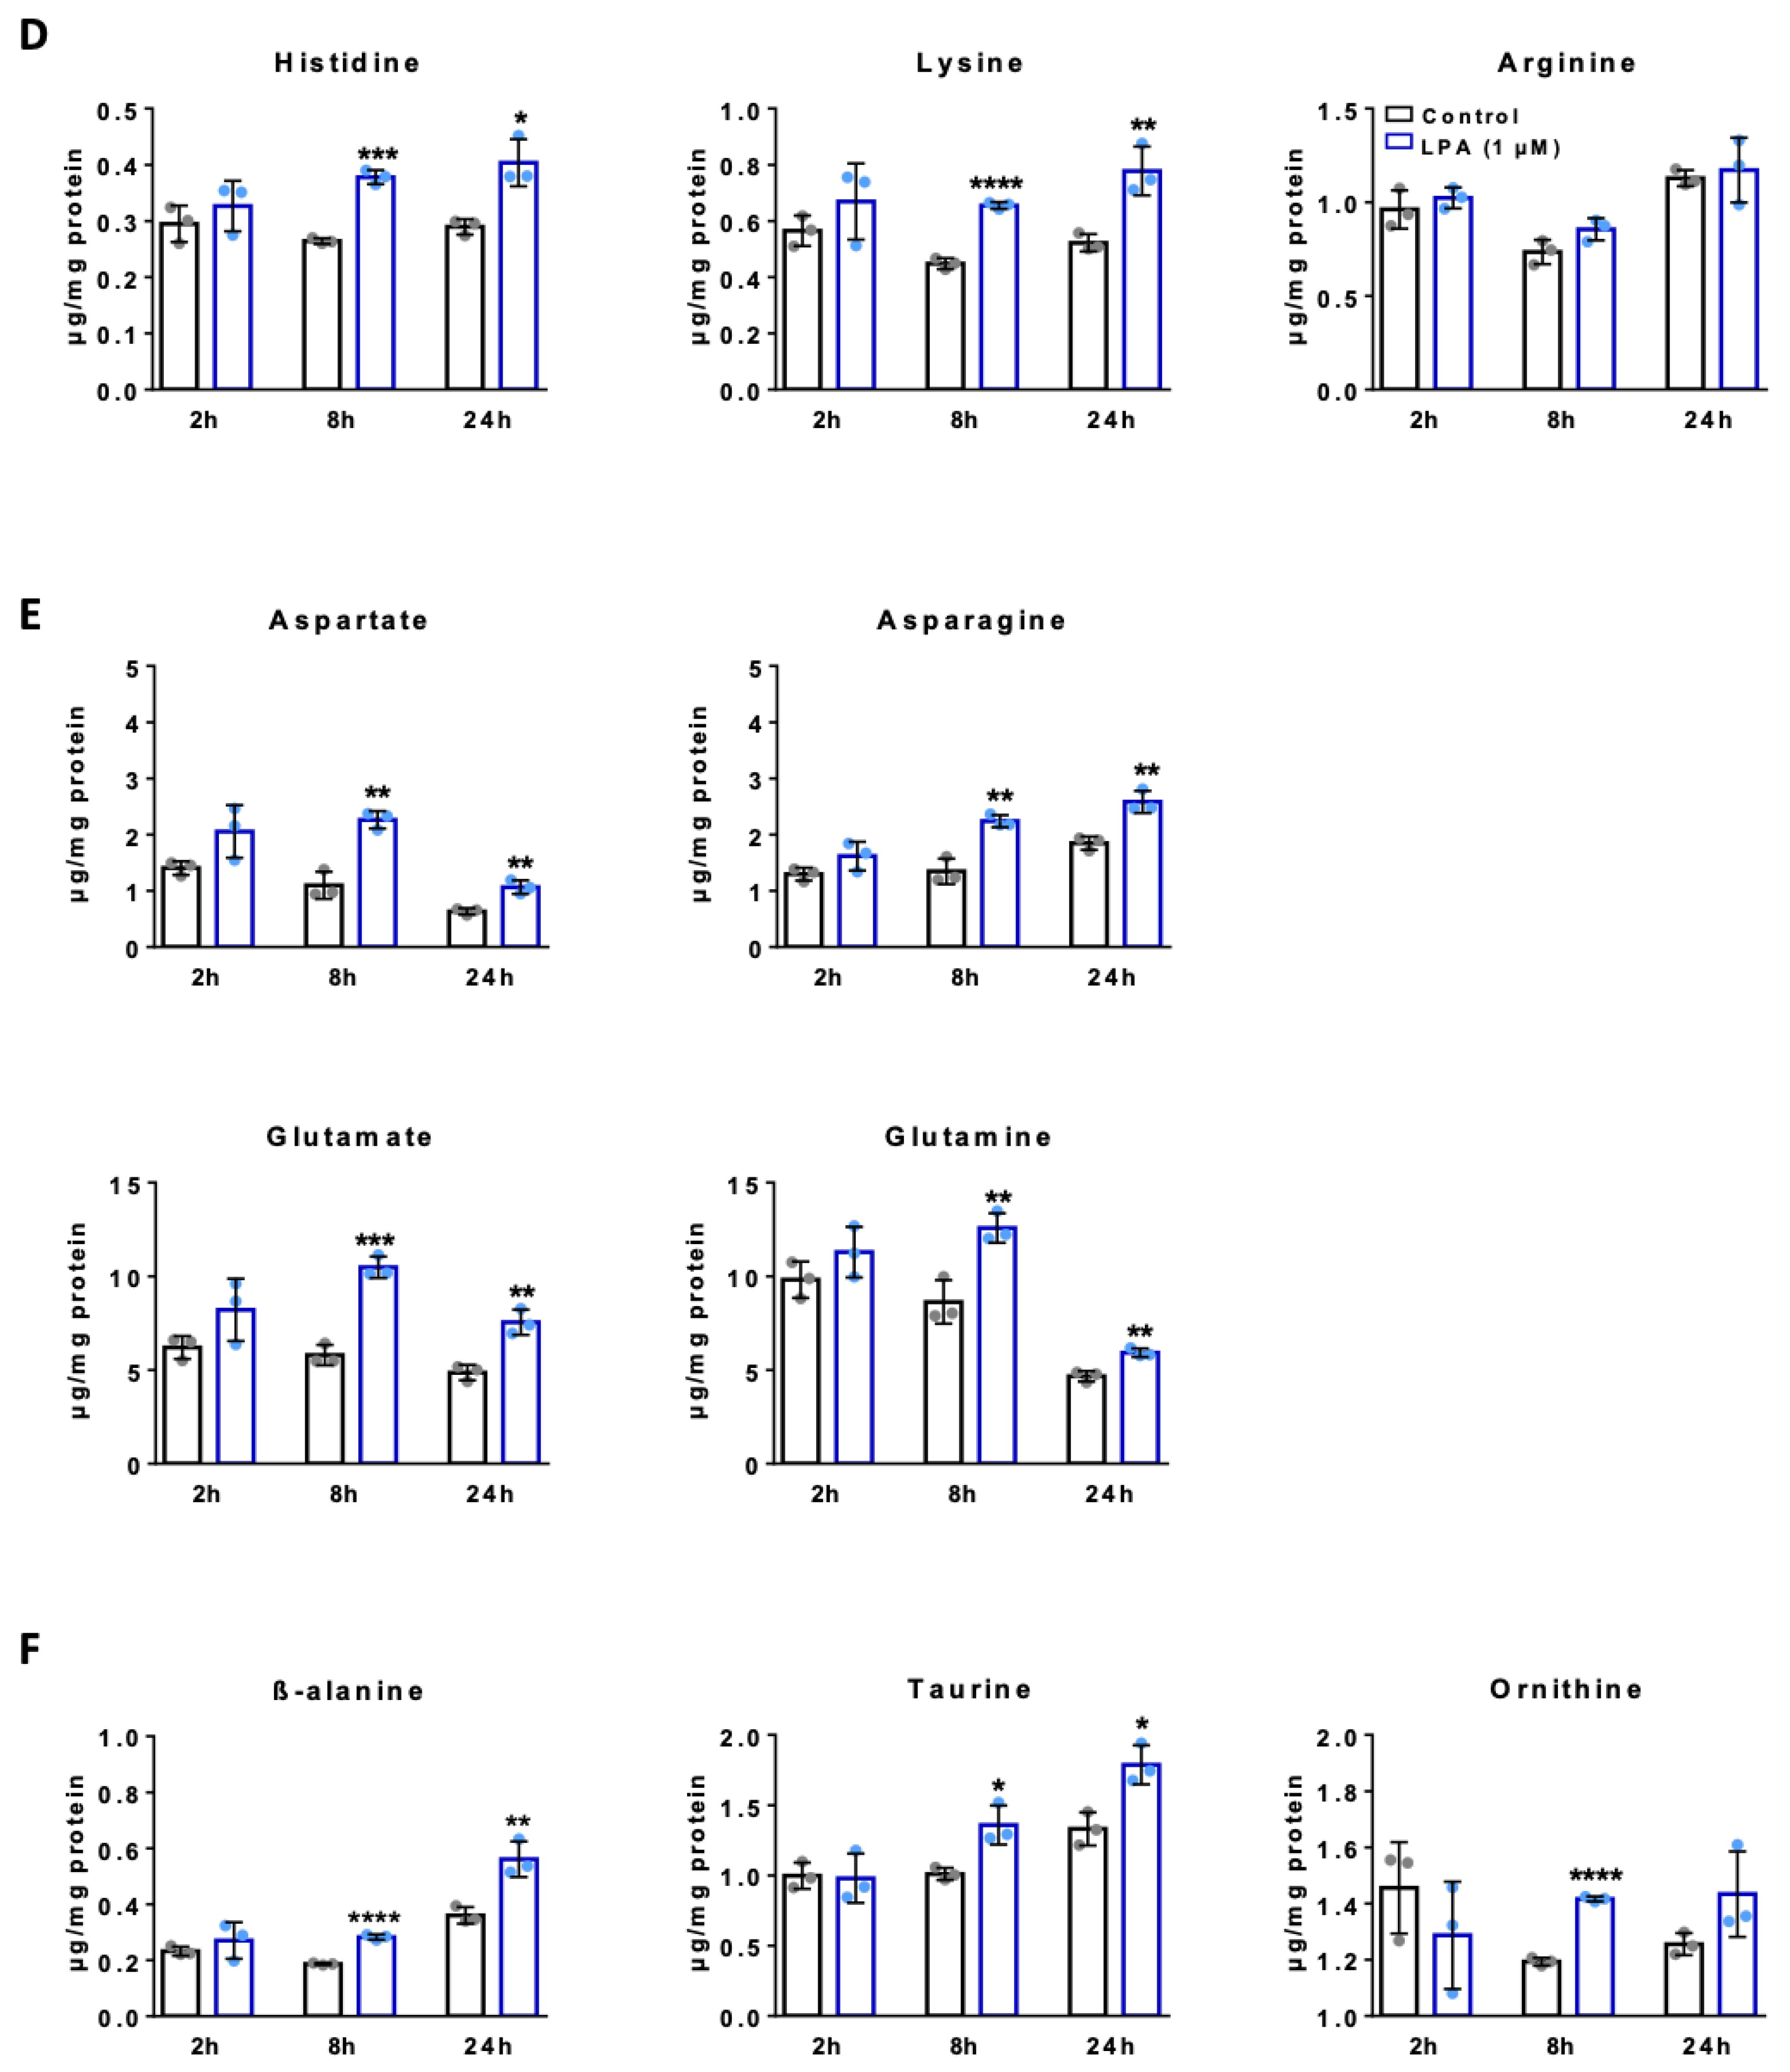
2.4. LPA Increases Amino Acid Concentrations in BV-2 Cells
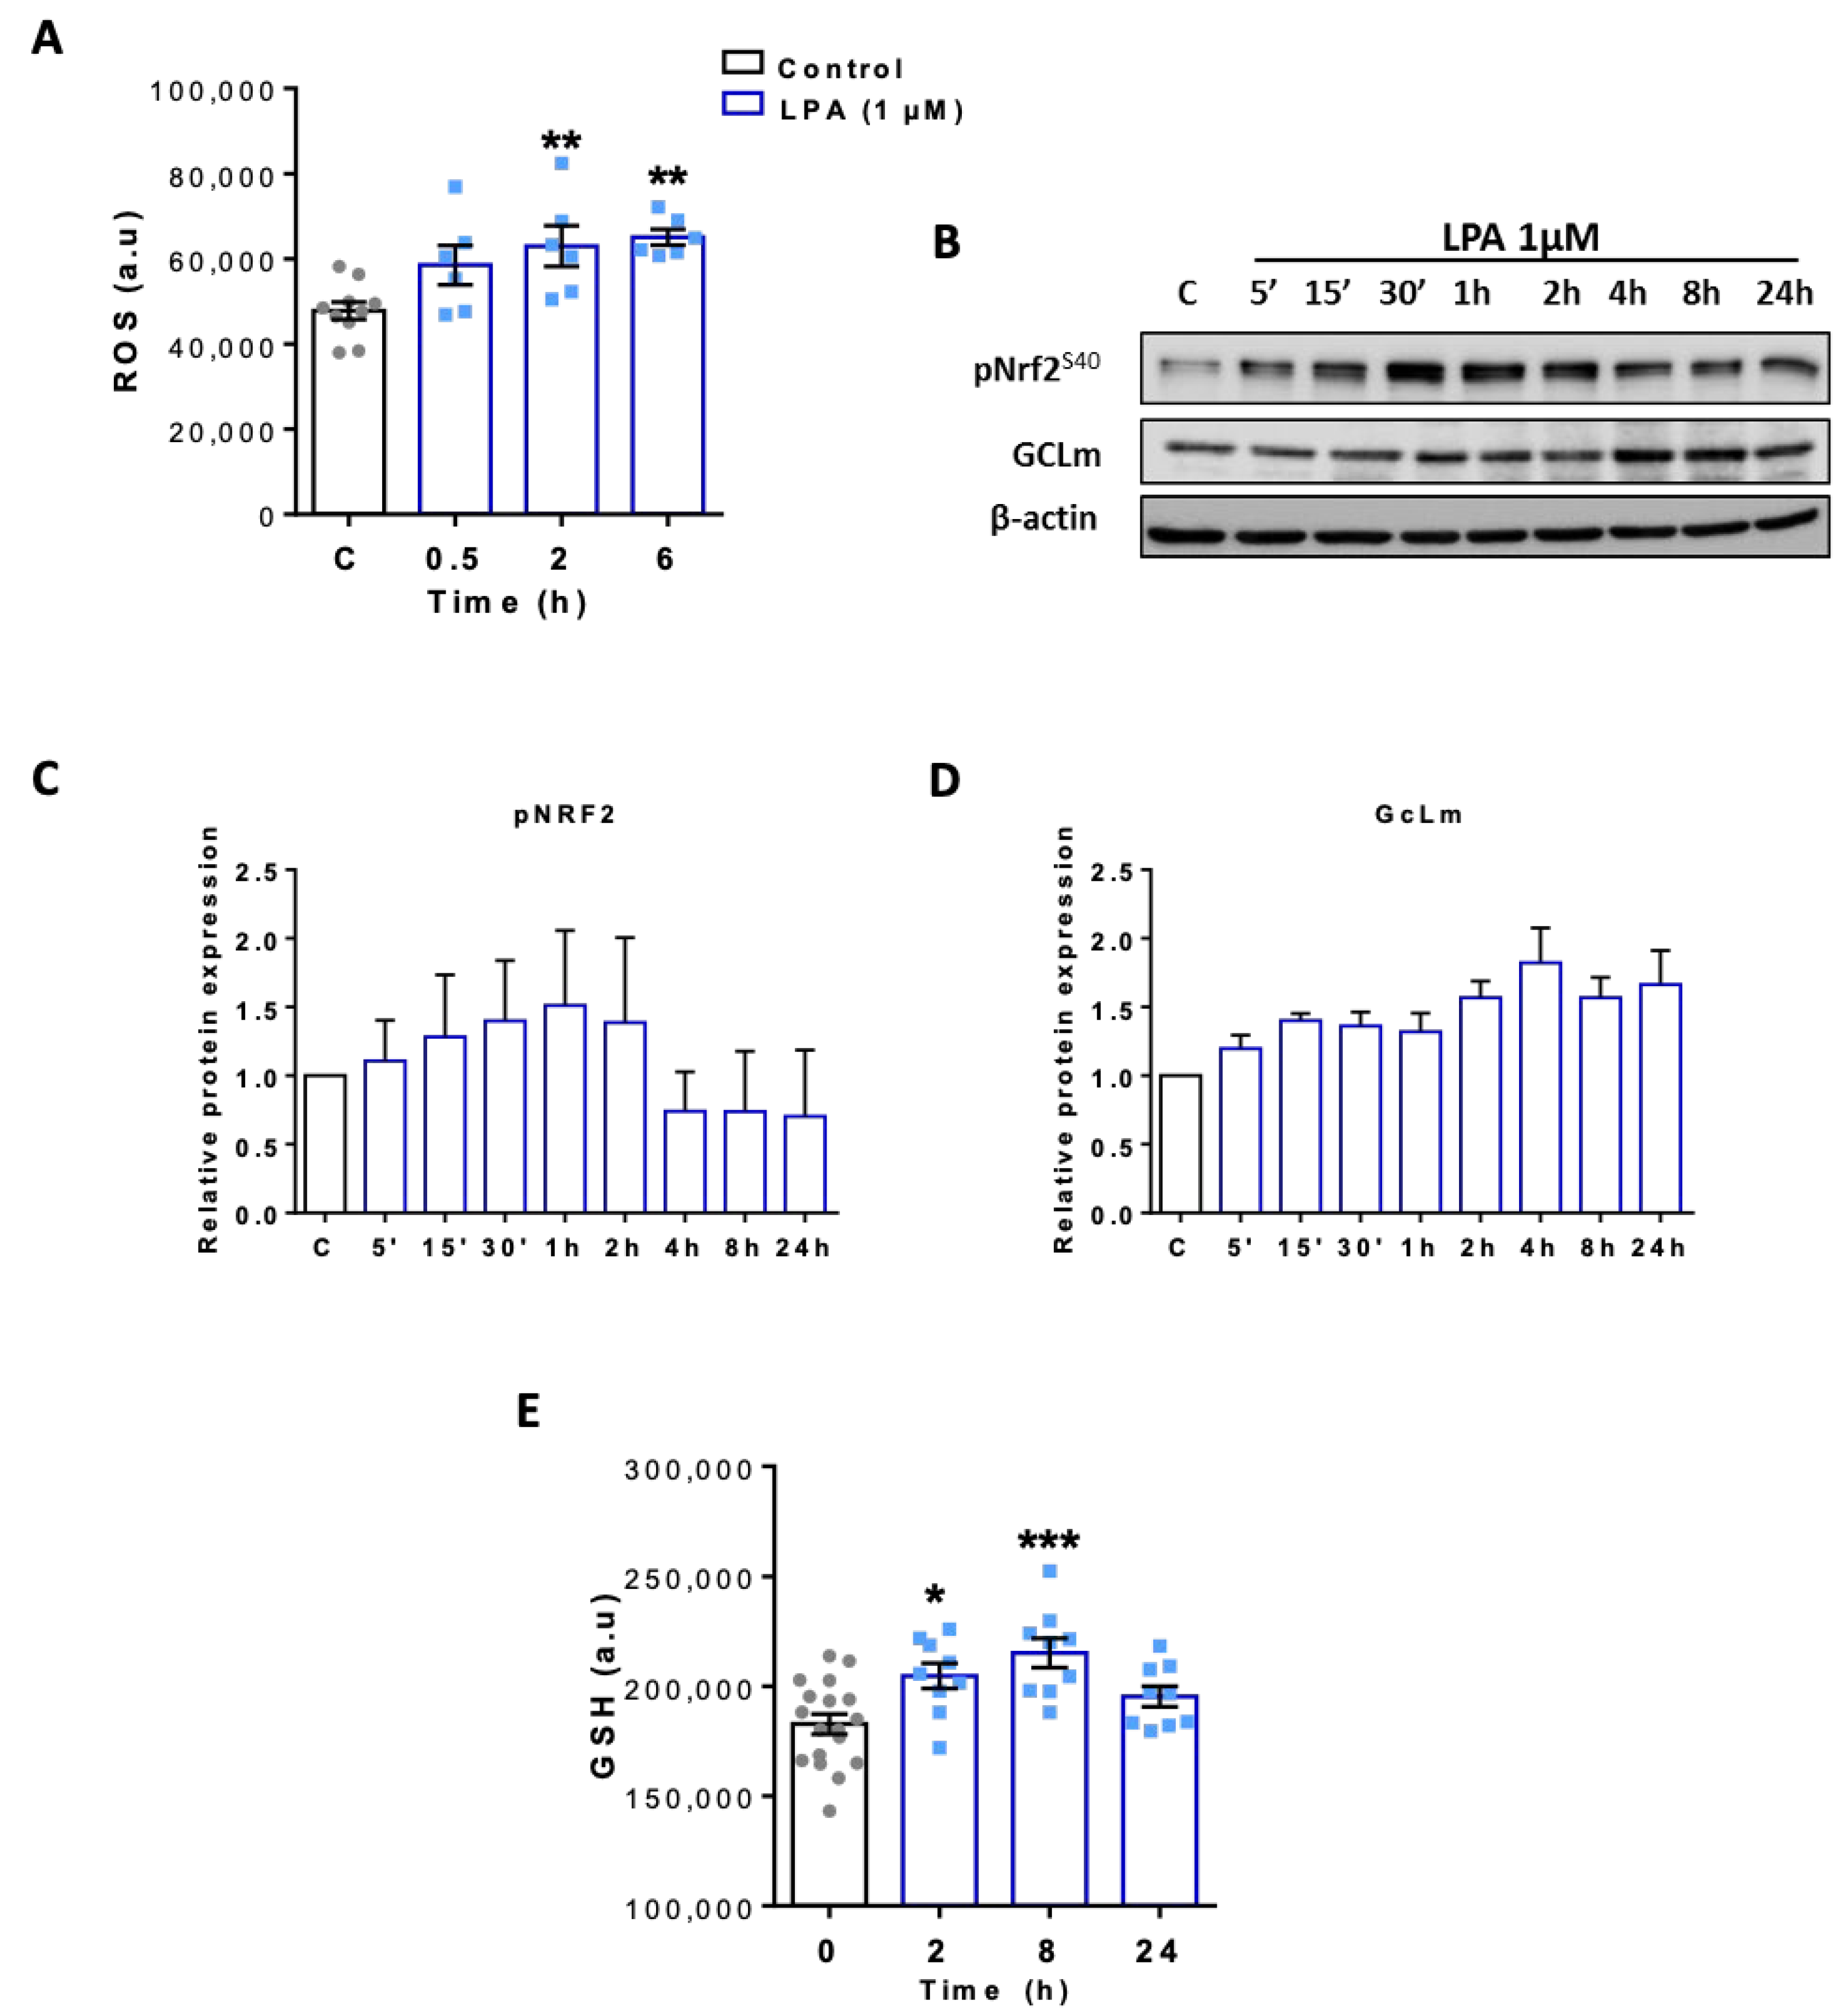
2.5. LPA Activates the Nrf2-Mediated Antioxidant Response in BV-2 Cells
3. Discussion
4. Materials and Methods
4.1. Materials
4.2. BV-2 Microglia
4.3. LPA Treatment
4.4. Cell Counting
4.5. MTT Assay
4.6. Seahorse XF Analyzer Respiratory Assay
4.7. Adenosine Nucleotide and Phosphocreatine Analysis by HPLC
4.8. Immunoblotting
4.9. RT-qPCR Analysis
4.10. Lactate Assay
4.11. Fatty Acid Composition Analysis by Gas Chromatography (GC)
4.12. Amino Acid Quantification by HPLC
4.13. ROS Assay
4.14. Glutathione Assay
4.15. Statistical Analysis
Supplementary Materials
Author Contributions
Funding
Institutional Review Board Statement
Informed Consent Statement
Data Availability Statement
Acknowledgments
Conflicts of Interest
Abbreviations
| AA | Amino acid |
| ACC | Acetyl-CoA carboxylase |
| AcCoA | Acetyl CoA |
| ADP | Adenosine diphosphate |
| AKT | Protein kinase B |
| Ala | Alanine |
| AMP | Adenosine monophosphate |
| AMPK | AMP-activated kinase |
| ARE | Antioxidant responsive element |
| Arg | Arginine |
| Asn | Asparagine |
| Asp | Aspartic acid |
| ATP | Adenosine triphosphate |
| ATX | Autotaxin |
| Aβ | Amyloid-β |
| CE | Cholesterylesters |
| CNS | Central Nervous System |
| CoA | Coenzyme A |
| CSF | Cerebrospinal fluid |
| DAG | Diacylglycerols |
| ETC | Electron transport chain |
| FA | Fatty acids |
| FASN | Fatty Acid Synthase |
| FCCP | Carbonyl cyanide-4-(trifluoromethoxy) phenylhydrazone |
| FFA | Free fatty acids |
| GCLm | Glutamate-cysteine ligase modifier subunit |
| Gln | Glutamine |
| GLS | Glutaminase |
| Glu | Glutamic acid |
| GLUT | Glucose transporters |
| Gly | Glycine |
| GSH | Glutathione |
| Hif1α | Hypoxia-inducible factor -1α |
| His | Histidine |
| HK2 | Hexokinase 2 |
| HPLC | High Performance Liquid Chromatography |
| Ile | Isoleucine |
| LD | Lipid droplets |
| Leu | Leucine |
| LPA | Lysophosphatidic acid |
| LPAR | Lysophosphatidic acid receptors |
| LPS | Lipopolysaccharide |
| Lys | Lysine |
| mTOR | Mammalian target of rapamycin |
| Nrf2 | Nuclear factor erythroid 2–related factor 2 |
| OCR | Oxygen consumption rate |
| OPA | o-phthalaldehyde |
| Orn | Ornithine |
| PBS | Phosphate Buffered Saline |
| PCr | Phosphocreatine |
| PI3K | Phosphoinositide 3-kinases |
| PL | Phospholipids |
| Pro | Proline |
| ROS | Reactive oxygen species |
| Ser | Serine |
| SREBP | Sterol regulatory element binding protein |
| TAG | Triacylglycerols |
| Tau | Taurine |
| Thr | Threonine |
| Trp | Tryptophan |
| Tyr | Tyrosine |
| Val | Valine |
| αKG | Alpha-ketoglutarate |
| β-Ala | Beta-alanine |
References
- Ginhoux, F.; Greter, M.; Leboeuf, M.; Nandi, S.; See, P.; Gokhan, S.; Mehler, M.F.; Conway, S.J.; Ng, L.G.; Stanley, E.R.; et al. Fate mapping analysis reveals that adult microglia derive from primitive macrophages. Science 2010, 330, 841–845. [Google Scholar] [CrossRef]
- Smolders, S.M.T.; Kessels, S.; Vangansewinkel, T.; Rigo, J.M.; Legendre, P.; Brône, B. Microglia: Brain cells on the move. Prog. Neurobiol. 2019, 178, 101612. [Google Scholar] [CrossRef]
- Heneka, M.T.; Kummer, M.P.; Latz, E. Innate immune activation in neurodegenerative disease. Nat. Rev. Immunol. 2014, 14, 463–477. [Google Scholar] [CrossRef]
- Tang, Y.; Le, W. Differential roles of M1 and M2 microglia in neurodegenerative diseases. Mol. Neurobiol. 2016, 53, 1181–1194. [Google Scholar] [CrossRef]
- Matcovitch-Natan, O.; Winter, D.R.; Giladi, A.; Vargas Aguilar, S.; Spinrad, A.; Sarrazin, S.; Ben-Yehuda, H.; David, E.; Zelada Gonzalez, F.; Perrin, P.; et al. Microglia development follows a stepwise program to regulate brain homeostasis. Science 2016, 353, aad8670. [Google Scholar] [CrossRef] [PubMed]
- Plastira, I.; Bernhart, E.; Joshi, L.; Koyani, C.N.; Strohmaier, H.; Reicher, H.; Malle, E.; Sattler, W. MAPK signaling determines lysophosphatidic acid (LPA)-induced inflammation in microglia. J. Neuroinflamm. 2020, 17, 127. [Google Scholar] [CrossRef] [PubMed]
- Masuda, T.; Sankowski, R.; Staszewski, O.; Bottcher, C.; Amann, L.; Scheiwe, C.; Nessler, S.; Kunz, P.; van Loo, G.; Coenen, V.A.; et al. Spatial and temporal heterogeneity of mouse and human microglia at single-cell resolution. Nature 2019, 566, 388–392. [Google Scholar] [CrossRef] [PubMed]
- Hammond, T.R.; Dufort, C.; Dissing-Olesen, L.; Giera, S.; Young, A.; Wysoker, A.; Walker, A.J.; Gergits, F.; Segel, M.; Nemesh, J.; et al. Single-cell RNA Sequencing of microglia throughout the mouse lifespan and in the injured brain reveals complex cell-state changes. Immunity 2019, 50, 253–271. [Google Scholar] [CrossRef]
- Bottcher, C.; Schlickeiser, S.; Sneeboer, M.A.M.; Kunkel, D.; Knop, A.; Paza, E.; Fidzinski, P.; Kraus, L.; Snijders, G.J.L.; Kahn, R.S.; et al. Human microglia regional heterogeneity and phenotypes determined by multiplexed single-cell mass cytometry. Nat. Neurosci. 2019, 22, 78–90. [Google Scholar] [CrossRef]
- Nimmerjahn, A.; Kirchhoff, F.; Helmchen, F. Resting microglial cells are highly dynamic surveillants of brain parenchyma in vivo. Science 2005, 308, 1314–1318. [Google Scholar] [CrossRef] [PubMed]
- Hickman, S.E.; Kingery, N.D.; Ohsumi, T.K.; Borowsky, M.L.; Wang, L.C.; Means, T.K.; El Khoury, J. The microglial sensome revealed by direct RNA sequencing. Nat. Neurosci. 2013, 16, 1896–1905. [Google Scholar] [CrossRef]
- Kettenmann, H.; Hanisch, U.K.; Noda, M.; Verkhratsky, A. Physiology of microglia. Physiol. Rev. 2011, 91, 461–553. [Google Scholar] [CrossRef]
- Crotti, A.; Ransohoff, R.M. Microglial physiology and pathophysiology: Insights from genome-wide transcriptional profiling. Immunity 2016, 44, 505–515. [Google Scholar] [CrossRef]
- Jurga, A.M.; Paleczna, M.; Kuter, K.Z. Overview of general and discriminating markers of differential microglia phenotypes. Front. Cell. Neurosci. 2020, 14, 198. [Google Scholar] [CrossRef]
- Hickman, S.; Izzy, S.; Sen, P.; Morsett, L.; El Khoury, J. Microglia in neurodegeneration. Nat. Neurosci. 2018, 21, 1359–1369. [Google Scholar] [CrossRef]
- Bernier, L.P.; York, E.M.; MacVicar, B.A. Immunometabolism in the brain: How metabolism shapes microglial function. Trends Neurosci. 2020, 43, 854–869. [Google Scholar] [CrossRef] [PubMed]
- van den Bossche, J.; O‘Neill, L.A.; Menon, D. Macrophage immunometabolism: Where are we (going)? Trends Immunol. 2017, 38, 395–406. [Google Scholar] [CrossRef] [PubMed]
- Lynch, M.A. Can the emerging field of immunometabolism provide insights into neuroinflammation? Prog. Neurobiol. 2020, 184, 101719. [Google Scholar] [CrossRef] [PubMed]
- Ghosh, S.; Castillo, E.; Frias, E.S.; Swanson, R.A. Bioenergetic regulation of microglia. Glia 2018, 66, 1200–1212. [Google Scholar] [CrossRef] [PubMed]
- Bernier, L.P.; York, E.M.; Kamyabi, A.; Choi, H.B.; Weilinger, N.L.; MacVicar, B.A. Microglial metabolic flexibility supports immune surveillance of the brain parenchyma. Nat. Commun. 2020, 11, 1559. [Google Scholar] [CrossRef] [PubMed]
- Zhang, Y.; Chen, K.; Sloan, S.A.; Bennett, M.L.; Scholze, A.R.; O‘Keeffe, S.; Phatnani, H.P.; Guarnieri, P.; Caneda, C.; Ruderisch, N.; et al. An RNA-sequencing transcriptome and splicing database of glia, neurons, and vascular cells of the cerebral cortex. J. Neurosci. 2014, 34, 11929–11947. [Google Scholar] [CrossRef]
- Bennett, M.L.; Bennett, F.C.; Liddelow, S.A.; Ajami, B.; Zamanian, J.L.; Fernhoff, N.B.; Mulinyawe, S.B.; Bohlen, C.J.; Adil, A.; Tucker, A.; et al. New tools for studying microglia in the mouse and human CNS. Proc. Natl. Acad. Sci. USA 2016, 113, E1738–E1746. [Google Scholar] [CrossRef]
- O‘Neill, L.A.; Kishton, R.J.; Rathmell, J. A guide to immunometabolism for immunologists. Nat. Rev. Immunol. 2016, 16, 553–565. [Google Scholar] [CrossRef] [PubMed]
- Buck, M.D.; Sowell, R.T.; Kaech, S.M.; Pearce, E.L. Metabolic instruction of immunity. Cell 2017, 169, 570–586. [Google Scholar] [CrossRef]
- Viola, A.; Munari, F.; Sanchez-Rodriguez, R.; Scolaro, T.; Castegna, A. The metabolic signature of macrophage responses. Front. Immunol. 2019, 10, 1462. [Google Scholar] [CrossRef]
- Orihuela, R.; McPherson, C.A.; Harry, G.J. Microglial M1/M2 polarization and metabolic states. Br. J. Pharmacol. 2015, 173, 649–665. [Google Scholar] [CrossRef]
- Plastira, I.; Bernhart, E.; Goeritzer, M.; Reicher, H.; Kumble, V.B.; Kogelnik, N.; Wintersperger, A.; Hammer, A.; Schlager, S.; Jandl, K.; et al. 1-Oleyl-lysophosphatidic acid (LPA) promotes polarization of BV-2 and primary murine microglia towards an M1-like phenotype. J. Neuroinflamm. 2016, 13, 205. [Google Scholar] [CrossRef]
- Plastira, I.; Bernhart, E.; Goeritzer, M.; DeVaney, T.; Reicher, H.; Hammer, A.; Lohberger, B.; Wintersperger, A.; Zucol, B.; Graier, W.F.; et al. Lysophosphatidic acid via LPA-receptor 5/protein kinase D-dependent pathways induces a motile and pro-inflammatory microglial phenotype. J. Neuroinflamm. 2017, 14, 253. [Google Scholar] [CrossRef]
- Yung, Y.C.; Stoddard, N.C.; Mirendil, H.; Chun, J. Lysophosphatidic acid signaling in the nervous system. Neuron 2015, 85, 669–682. [Google Scholar] [CrossRef]
- Yung, Y.C.; Stoddard, N.C.; Chun, J. LPA receptor signaling: Pharmacology, physiology, and pathophysiology. J. Lipid Res. 2014, 55, 1192–1214. [Google Scholar] [CrossRef]
- Savaskan, N.E.; Rocha, L.; Kotter, M.R.; Baer, A.; Lubec, G.; van Meeteren, L.A.; Kishi, Y.; Aoki, J.; Moolenaar, W.H.; Nitsch, R.; et al. Autotaxin (NPP-2) in the brain: Cell type-specific expression and regulation during development and after neurotrauma. Cell Mol. Life Sci. 2007, 64, 230–243. [Google Scholar] [CrossRef]
- Tigyi, G.A.B.O.R.; Hong, L.I.E.L.I.E.; Yakubu, M.O.M.O.H.; Parfenova, H.E.L.E.N.A.; Shibata, M.A.S.A.A.K.I.; Leffler, C.W. Lysophosphatidic acid alters cerebrovascular reactivity in piglets. Am. J. Physiol. Heart Circ. Physiol. 1995, 268, H2048–H2055. [Google Scholar] [CrossRef]
- Yung, Y.C.; Mutoh, T.; Lin, M.E.; Noguchi, K.; Rivera, R.R.; Choi, J.W.; Kingsbury, M.A.; Chun, J. Lysophosphatidic acid signaling may initiate fetal hydrocephalus. Sci. Transl. Med. 2011, 3, 99ra87. [Google Scholar] [CrossRef] [PubMed]
- Ma, L.; Uchida, H.; Nagai, J.; Inoue, M.; Aoki, J.; Ueda, H. Evidence for de novo synthesis of lysophosphatidic acid in the spinal cord through phospholipase A2 and autotaxin in nerve injury-induced neuropathic pain. J. Pharmacol. Exp. Ther. 2010, 333, 540–546. [Google Scholar] [CrossRef]
- Santos-Nogueira, E.; Lopez-Serrano, C.; Hernandez, J.; Lago, N.; Astudillo, A.M.; Balsinde, J.; Estivill-Torrus, G.; de Fonseca, F.R.; Chun, J.; Lopez-Vales, R. Activation of lysophosphatidic acid receptor type 1 contributes to pathophysiology of spinal cord injury. J. Neurosci. 2015, 35, 10224–10235. [Google Scholar] [CrossRef]
- Plastira, I.; Joshi, L.; Bernhart, E.; Schoene, J.; Specker, E.; Nazare, M.; Sattler, W. Small-molecule lysophosphatidic acid receptor 5 (LPAR5) antagonists: Versatile pharmacological tools to regulate inflammatory signaling in BV-2 microglia cells. Front. Cell. Neurosci. 2019, 13, 531. [Google Scholar] [CrossRef]
- Bernhart, E.; Kollroser, M.; Rechberger, G.; Reicher, H.; Heinemann, A.; Schratl, P.; Hallstrom, S.; Wintersperger, A.; Nusshold, C.; DeVaney, T.; et al. Lysophosphatidic acid receptor activation affects the C13NJ microglia cell line proteome leading to alterations in glycolysis, motility, and cytoskeletal architecture. Proteomics 2010, 10, 141–158. [Google Scholar] [CrossRef]
- Awada, R.; Saulnier-Blache, J.S.; Gres, S.; Bourdon, E.; Rondeau, P.; Parimisetty, A.; Orihuela, R.; Harry, G.J.; d‘Hellencourt, C.L. Autotaxin downregulates LPS-induced microglia activation and pro-inflammatory cytokines production. J. Cell. Biochem. 2014, 115, 2123–2132. [Google Scholar] [CrossRef]
- Cheng, S.C.; Quintin, J.; Cramer, R.A.; Shepardson, K.M.; Saeed, S.; Kumar, V.; Giamarellos-Bourboulis, E.J.; Martens, J.H.; Rao, N.A.; Aghajanirefah, A.; et al. mTOR- and HIF-1alpha-mediated aerobic glycolysis as metabolic basis for trained immunity. Science 2014, 345, 1250684. [Google Scholar] [CrossRef]
- Wang, L.; Pavlou, S.; Du, X.; Bhuckory, M.; Xu, H.; Chen, M. Glucose transporter 1 critically controls microglial activation through facilitating glycolysis. Mol. Neurodegener. 2019, 14, 2. [Google Scholar] [CrossRef]
- Loving, B.A.; Bruce, K.D. Lipid and lipoprotein metabolism in microglia. Front. Physiol. 2020, 11, 393. [Google Scholar] [CrossRef]
- Stefan, C.J.; Trimble, W.S.; Grinstein, S.; Drin, G.; Reinisch, K.; de Camilli, P.; Cohen, S.; Valm, A.M.; Lippincott-Schwartz, J.; Levine, T.P.; et al. Membrane dynamics and organelle biogenesis-lipid pipelines and vesicular carriers. BMC Biol. 2017, 15, 102. [Google Scholar] [CrossRef]
- Barber, C.N.; Raben, D.M. Lipid metabolism crosstalk in the brain: Glia and neurons. Front. Cell. Neurosci. 2019, 13, 212. [Google Scholar] [CrossRef]
- Bhatt, D.P.; Rosenberger, T.A. Acetate treatment increases fatty acid content in LPS-stimulated BV2 microglia. Lipids 2014, 49, 621–631. [Google Scholar] [CrossRef]
- Green, C.R.; Wallace, M.; Divakaruni, A.S.; Phillips, S.A.; Murphy, A.N.; Ciaraldi, T.P.; Metallo, C.M. Branched-chain amino acid catabolism fuels adipocyte differentiation and lipogenesis. Nat. Chem. Biol. 2016, 12, 15–21. [Google Scholar] [CrossRef]
- Huang, H.C.; Nguyen, T.; Pickett, C.B. Phosphorylation of Nrf2 at Ser-40 by protein kinase C regulates antioxidant response element-mediated transcription. J. Biol. Chem. 2002, 277, 42769–42774. [Google Scholar] [CrossRef]
- D‘Souza, K.; Nzirorera, C.; Cowie, A.M.; Varghese, G.P.; Trivedi, P.; Eichmann, T.O.; Biswas, D.; Touaibia, M.; Morris, A.J.; Aidinis, V.; et al. Autotaxin-LPA signaling contributes to obesity-induced insulin resistance in muscle and impairs mitochondrial metabolism. J. Lipid Res. 2018, 59, 1805–1817. [Google Scholar] [CrossRef]
- Nishimura, S.; Nagasaki, M.; Okudaira, S.; Aoki, J.; Ohmori, T.; Ohkawa, R.; Nakamura, K.; Igarashi, K.; Yamashita, H.; Eto, K.; et al. ENPP2 contributes to adipose tissue expansion and insulin resistance in diet-induced obesity. Diabetes 2014, 63, 4154–4164. [Google Scholar] [CrossRef]
- Radhakrishnan, R.; Ha, J.H.; Jayaraman, M.; Liu, J.; Moxley, K.M.; Isidoro, C.; Sood, A.K.; Song, Y.S.; Dhanasekaran, D.N. Ovarian cancer cell-derived lysophosphatidic acid induces glycolytic shift and cancer-associated fibroblast-phenotype in normal and peritumoral fibroblasts. Cancer Lett. 2019, 442, 464–474. [Google Scholar] [CrossRef] [PubMed]
- Mukherjee, A.; Ma, Y.; Yuan, F.; Gong, Y.; Fang, Z.; Mohamed, E.M.; Berrios, E.; Shao, H.; Fang, X. Lysophosphatidic acid up-regulates hexokinase II and glycolysis to promote proliferation of ovarian cancer cells. Neoplasia 2015, 17, 723–734. [Google Scholar] [CrossRef]
- Ha, J.H.; Radhakrishnan, R.; Jayaraman, M.; Yan, M.; Ward, J.D.; Fung, K.M.; Moxley, K.; Sood, A.K.; Isidoro, C.; Mukherjee, P.; et al. LPA induces metabolic reprogramming in ovarian cancer via a pseudohypoxic response. Cancer Res. 2018, 78, 1923–1934. [Google Scholar] [CrossRef] [PubMed]
- Herr, D.R.; Chew, W.S.; Satish, R.L.; Ong, W.Y. Pleotropic roles of autotaxin in the nervous system present opportunities for the development of novel therapeutics for neurological diseases. Mol. Neurobiol. 2020, 57, 372–392. [Google Scholar] [CrossRef]
- Awada, R.; Rondeau, P.; Gres, S.; Saulnier-Blache, J.S.; Lefebvre d‘Hellencourt, C.; Bourdon, E. Autotaxin protects microglial cells against oxidative stress. Free Radic. Biol. Med. 2012, 52, 516–526. [Google Scholar] [CrossRef]
- Henn, A.; Lund, S.; Hedtjarn, M.; Schrattenholz, A.; Porzgen, P.; Leist, M. The suitability of BV2 cells as alternative model system for primary microglia cultures or for animal experiments examining brain inflammation. ALTEX 2009, 26, 83–94. [Google Scholar] [CrossRef]
- Timmerman, R.; Burm, S.M.; Bajramovic, J.J. An overview of in vitro methods to study microglia. Front. Cell. Neurosci. 2018, 12, 242. [Google Scholar] [CrossRef]
- Blasi, E.; Barluzzi, R.; Bocchini, V.; Mazzolla, R.; Bistoni, F. Immortalization of murine microglial cells by a v-raf/v-myc carrying retrovirus. J. Neuroimmunol. 1990, 27, 229–237. [Google Scholar] [CrossRef]
- He, Y.; Yao, X.; Taylor, N.; Bai, Y.; Lovenberg, T.; Bhattacharya, A. RNA sequencing analysis reveals quiescent microglia isolation methods from postnatal mouse brains and limitations of BV2 cells. J. Neuroinflamm. 2018, 15, 153. [Google Scholar] [CrossRef]
- Das, A.; Chai, J.C.; Kim, S.H.; Park, K.S.; Lee, Y.S.; Jung, K.H.; Chai, Y.G. Dual RNA sequencing reveals the expression of unique transcriptomic signatures in lipopolysaccharide-induced BV-2 microglial cells. PLoS ONE 2015, 10, e0121117. [Google Scholar] [CrossRef]
- Paolicelli, R.C.; Angiari, S. Microglia immunometabolism: From metabolic disorders to single cell metabolism. Semin. Cell Dev. Biol. 2019, 94, 129–137. [Google Scholar] [CrossRef]
- Butovsky, O.; Jedrychowski, M.P.; Moore, C.S.; Cialic, R.; Lanser, A.J.; Gabriely, G.; Koeglsperger, T.; Dake, B.; Wu, P.M.; Doykan, C.E.; et al. Identification of a unique TGF-beta-dependent molecular and functional signature in microglia. Nat. Neurosci. 2014, 17, 131–143. [Google Scholar] [CrossRef]
- Nagy, A.M.; Fekete, R.; Horvath, G.; Koncsos, G.; Kriston, C.; Sebestyen, A.; Giricz, Z.; Kornyei, Z.; Madarasz, E.; Tretter, L. Versatility of microglial bioenergetic machinery under starving conditions. Biochim. Biophys. Acta Bioenerg. 2018, 1859, 201–214. [Google Scholar] [CrossRef]
- Lin, M.T.; Beal, M.F. Mitochondrial dysfunction and oxidative stress in neurodegenerative diseases. Nature 2006, 443, 787–795. [Google Scholar] [CrossRef] [PubMed]
- Yin, F.; Sancheti, H.; Patil, I.; Cadenas, E. Energy metabolism and inflammation in brain aging and Alzheimer‘s disease. Free Radic. Biol. Med. 2016, 100, 108–122. [Google Scholar] [CrossRef] [PubMed]
- Baik, S.H.; Kang, S.; Lee, W.; Choi, H.; Chung, S.; Kim, J.I.; Mook-Jung, I. A breakdown in metabolic reprogramming causes microglia dysfunction in alzheimer‘s disease. Cell Metab. 2019, 30, 493–507. [Google Scholar] [CrossRef]
- Mossmann, D.; Park, S.; Hall, M.N. mTOR signalling and cellular metabolism are mutual determinants in cancer. Nat. Rev. Cancer 2018, 18, 744–757. [Google Scholar] [CrossRef] [PubMed]
- Lee, S.J.; No, Y.R.; Dang, D.T.; Dang, L.H.; Yang, V.W.; Shim, H.; Yun, C.C. Regulation of hypoxia-inducible factor 1alpha (HIF-1alpha) by lysophosphatidic acid is dependent on interplay between p53 and Kruppel-like factor 5. J. Biol. Chem. 2013, 288, 25244–25253. [Google Scholar] [CrossRef] [PubMed]
- Merighi, S.; Borea, P.A.; Stefanelli, A.; Bencivenni, S.; Castillo, C.A.; Varani, K.; Gessi, S. A2a and a2b adenosine receptors affect HIF-1alpha signaling in activated primary microglial cells. Glia 2015, 63, 1933–1952. [Google Scholar] [CrossRef]
- Van, H., II; Lupu-Meiri, M.; Tayer, M.; Shapira, H.; Oron, Y. Response to lysophosphatidic acid in Xenopus oocytes and its rapid desensitization: The role of Gq and Go G-protein families. J. Cell. Physiol. 2004, 200, 125–133. [Google Scholar] [CrossRef]
- Tigyi, G.; Fischer, D.J.; Baker, D.; Wang, D.A.; Yue, J.; Nusser, N.; Virag, T.; Zsiros, V.; Liliom, K.; Miller, D.; et al. Pharmacological characterization of phospholipid growth-factor receptors. Ann. N. Y. Acad. Sci. 2000, 905, 34–53. [Google Scholar] [CrossRef]
- Avendano-Vazquez, S.E.; Garcia-Caballero, A.; Garcia-Sainz, J.A. Phosphorylation and desensitization of the lysophosphatidic acid receptor LPA1. Biochem. J. 2005, 385, 677–684. [Google Scholar] [CrossRef]
- Fitzner, D.; Bader, J.M.; Penkert, H.; Bergner, C.G.; Su, M.; Weil, M.T.; Surma, M.A.; Mann, M.; Klose, C.; Simons, M. Cell-type- and brain-region-resolved mouse brain lipidome. Cell Rep. 2020, 32, 108132. [Google Scholar] [CrossRef]
- Fan, K.; Lin, L.; Ai, Q.; Wan, J.; Dai, J.; Liu, G.; Tang, L.; Yang, Y.; Ge, P.; Jiang, R.; et al. Lipopolysaccharide-induced dephosphorylation of AMPK-activated protein kinase potentiates inflammatory injury via repression of ULK1-dependent autophagy. Front. Immunol. 2018, 9, 1464. [Google Scholar] [CrossRef] [PubMed]
- Marschallinger, J.; Iram, T.; Zardeneta, M.; Lee, S.E.; Lehallier, B.; Haney, M.S.; Pluvinage, J.V.; Mathur, V.; Hahn, O.; Morgens, D.W.; et al. Lipid-droplet-accumulating microglia represent a dysfunctional and proinflammatory state in the aging brain. Nat. Neurosci. 2020, 23, 194–208. [Google Scholar] [CrossRef] [PubMed]
- Liu, L.; Zhang, K.; Sandoval, H.; Yamamoto, S.; Jaiswal, M.; Sanz, E.; Li, Z.; Hui, J.; Graham, B.H.; Quintana, A.; et al. Glial lipid droplets and ROS induced by mitochondrial defects promote neurodegeneration. Cell 2015, 160, 177–190. [Google Scholar] [CrossRef] [PubMed]
- Shimabukuro, M.K.; Langhi, L.G.; Cordeiro, I.; Brito, J.M.; Batista, C.M.; Mattson, M.P.; Mello Coelho, V. Lipid-laden cells differentially distributed in the aging brain are functionally active and correspond to distinct phenotypes. Sci. Rep. 2016, 6, 23795. [Google Scholar] [CrossRef]
- Khatchadourian, A.; Bourque, S.D.; Richard, V.R.; Titorenko, V.I.; Maysinger, D. Dynamics and regulation of lipid droplet formation in lipopolysaccharide (LPS)-stimulated microglia. Biochim. Biophys. Acta 2012, 1821, 607–617. [Google Scholar] [CrossRef]
- Kim, J.; Guan, K.L. mTOR as a central hub of nutrient signalling and cell growth. Nat. Cell Biol. 2019, 21, 63–71. [Google Scholar] [CrossRef]
- Brose, S.A.; Marquardt, A.L.; Golovko, M.Y. Fatty acid biosynthesis from glutamate and glutamine is specifically induced in neuronal cells under hypoxia. J. Neurochem. 2014, 129, 400–412. [Google Scholar] [CrossRef] [PubMed]
- Cuadrado, A.; Rojo, A.I.; Wells, G.; Hayes, J.D.; Cousin, S.P.; Rumsey, W.L.; Attucks, O.C.; Franklin, S.; Levonen, A.L.; Kensler, T.W.; et al. Therapeutic targeting of the NRF2 and KEAP1 partnership in chronic diseases. Nat. Rev. Drug Discov. 2019, 18, 295–317. [Google Scholar] [CrossRef]
- Rosito, M.; Testi, C.; Parisi, G.; Cortese, B.; Baiocco, P.; Di Angelantonio, S. Exploring the use of dimethyl fumarate as microglia modulator for neurodegenerative diseases treatment. Antioxid. Basel 2020, 9, 700. [Google Scholar] [CrossRef]
- Vilhardt, F.; Haslund-Vinding, J.; Jaquet, V.; McBean, G. Microglia antioxidant systems and redox signalling. Br. J. Pharmacol. 2017, 174, 1719–1732. [Google Scholar] [CrossRef]
- Pelzmann, B.; Hallstrom, S.; Schaffer, P.; Lang, P.; Nadlinger, K.; Birkmayer, G.D.; Vrecko, K.; Reibnegger, G.; Koidl, B. NADH supplementation decreases pinacidil-primed I K ATP in ventricular cardiomyocytes by increasing intracellular ATP. Br. J. Pharmacol. 2003, 139, 749–754. [Google Scholar] [CrossRef]
- Furst, W.; Hallstrom, S. Simultaneous determination of myocardial nucleotides, nucleosides, purine bases and creatine phosphate by ion-pair high-performance liquid chromatography. J. Chromatogr. 1992, 578, 39–44. [Google Scholar] [CrossRef]
- Bernhart, E.; Kogelnik, N.; Prasch, J.; Gottschalk, B.; Goeritzer, M.; Depaoli, M.R.; Reicher, H.; Nusshold, C.; Plastira, I.; Hammer, A.; et al. 2-Chlorohexadecanoic acid induces ER stress and mitochondrial dysfunction in brain microvascular endothelial cells. Redox Biol. 2018, 15, 441–451. [Google Scholar] [CrossRef] [PubMed]
- Livak, K.J.; Schmittgen, T.D. Analysis of relative gene expression data using real-time quantitative PCR and the 2(-Delta Delta C(T)) method. Methods 2001, 25, 402–408. [Google Scholar] [CrossRef]
- Sattler, W.; Puhl, H.; Hayn, M.; Kostner, G.M.; Esterbauer, H. Determination of fatty acids in the main lipoprotein classes by capillary gas chromatography: BF3/methanol transesterification of lyophilized samples instead of Folch extraction gives higher yields. Anal. Biochem. 1991, 198, 184–190. [Google Scholar] [CrossRef]
- Wu, G.; Meininger, C.J. Analysis of citrulline, arginine, and methylarginines using high-performance liquid chromatography. Methods Enzymol. 2008, 440, 177–189. [Google Scholar] [CrossRef]


| Antibody | Company | Cat no | Dilution |
| Phospho Akt (Ser 473) | Cell Signaling Technology | cs-4060 | 1:1000 |
| Akt | Cell Signaling Technology | cs-9272 | 1:1000 |
| Phospho Mtor (Ser 2448) | Cell Signaling Technology | cs5536 | 1:1000 |
| Mtor | Cell Signaling Technology | cs-2972 | 1:1000 |
| HIF1α | Cell Signaling Technology | cs-14179 | 1:1000 |
| Phospho AMPK(Thr 172) | Cell Signaling Technology | cs-2535 | 1:500 |
| AMPK | Cell Signaling Technology | cs-2532 | 1:1000 |
| Phospho ACC(Ser 79) | Cell Signaling Technology | cs-3661 | 1:1000 |
| ACC | Cell Signaling Technology | cs-3676 | 1:1000 |
| Phospho SREBP (Ser 372) | Cell Signaling Technology | cs-9874 | 1:1000 |
| SREBP1 | Abcam | ab44153 | 1:1000 |
| Phospho NRF2 (Ser 40) | Abcam | ab76026 | 1:1000 |
| GCLm | Santa Cruz Biotechnology Inc | sc166603 | 1:1000 |
| β-actin | Santa Cruz Biotechnology Inc | sc47778 | 1:5000 |
| Gene | Company | Cat no | Forward/Reverse Primers |
| Glut2 | Qiagen | QT00103573 | |
| Glut3 | Qiagen | QT00159691 | |
| Glut5 | Qiagen | QT00148267 | |
| HPRT | Qiagen | QT00166768 | |
| GLUT1 | Invitrogen | F: CCGTTCTCCGTCTCGCAG | |
| R: CTCCCACAGCCAACATGAGG | |||
| GLUT4 | Invitrogen | F: ATTGTCGGCATGGGTTTCCA | |
| R: AGCAGGAGGACGGCAAATAG | |||
| Hexokinase2 | Invitrogen | F: ATCGCCTGCTTATTCACGGAG | |
| R: TCTGAGAGACGCATGTGGTAG |
Publisher’s Note: MDPI stays neutral with regard to jurisdictional claims in published maps and institutional affiliations. |
© 2021 by the authors. Licensee MDPI, Basel, Switzerland. This article is an open access article distributed under the terms and conditions of the Creative Commons Attribution (CC BY) license (http://creativecommons.org/licenses/by/4.0/).
Share and Cite
Joshi, L.; Plastira, I.; Bernhart, E.; Reicher, H.; Koyani, C.N.; Madl, T.; Madreiter-Sokolowski, C.; Koshenov, Z.; Graier, W.F.; Hallström, S.; et al. Lysophosphatidic Acid Induces Aerobic Glycolysis, Lipogenesis, and Increased Amino Acid Uptake in BV-2 Microglia. Int. J. Mol. Sci. 2021, 22, 1968. https://doi.org/10.3390/ijms22041968
Joshi L, Plastira I, Bernhart E, Reicher H, Koyani CN, Madl T, Madreiter-Sokolowski C, Koshenov Z, Graier WF, Hallström S, et al. Lysophosphatidic Acid Induces Aerobic Glycolysis, Lipogenesis, and Increased Amino Acid Uptake in BV-2 Microglia. International Journal of Molecular Sciences. 2021; 22(4):1968. https://doi.org/10.3390/ijms22041968
Chicago/Turabian StyleJoshi, Lisha, Ioanna Plastira, Eva Bernhart, Helga Reicher, Chintan N. Koyani, Tobias Madl, Corina Madreiter-Sokolowski, Zhanat Koshenov, Wolfgang F. Graier, Seth Hallström, and et al. 2021. "Lysophosphatidic Acid Induces Aerobic Glycolysis, Lipogenesis, and Increased Amino Acid Uptake in BV-2 Microglia" International Journal of Molecular Sciences 22, no. 4: 1968. https://doi.org/10.3390/ijms22041968
APA StyleJoshi, L., Plastira, I., Bernhart, E., Reicher, H., Koyani, C. N., Madl, T., Madreiter-Sokolowski, C., Koshenov, Z., Graier, W. F., Hallström, S., & Sattler, W. (2021). Lysophosphatidic Acid Induces Aerobic Glycolysis, Lipogenesis, and Increased Amino Acid Uptake in BV-2 Microglia. International Journal of Molecular Sciences, 22(4), 1968. https://doi.org/10.3390/ijms22041968