
Structure of Lipopolysaccharide from Liberibacter crescens Is Low Molecular Weight and Offers Insight into Candidatus Liberibacter Biology

 , ,
, ,
Abstract
:1. Introduction
2. Results
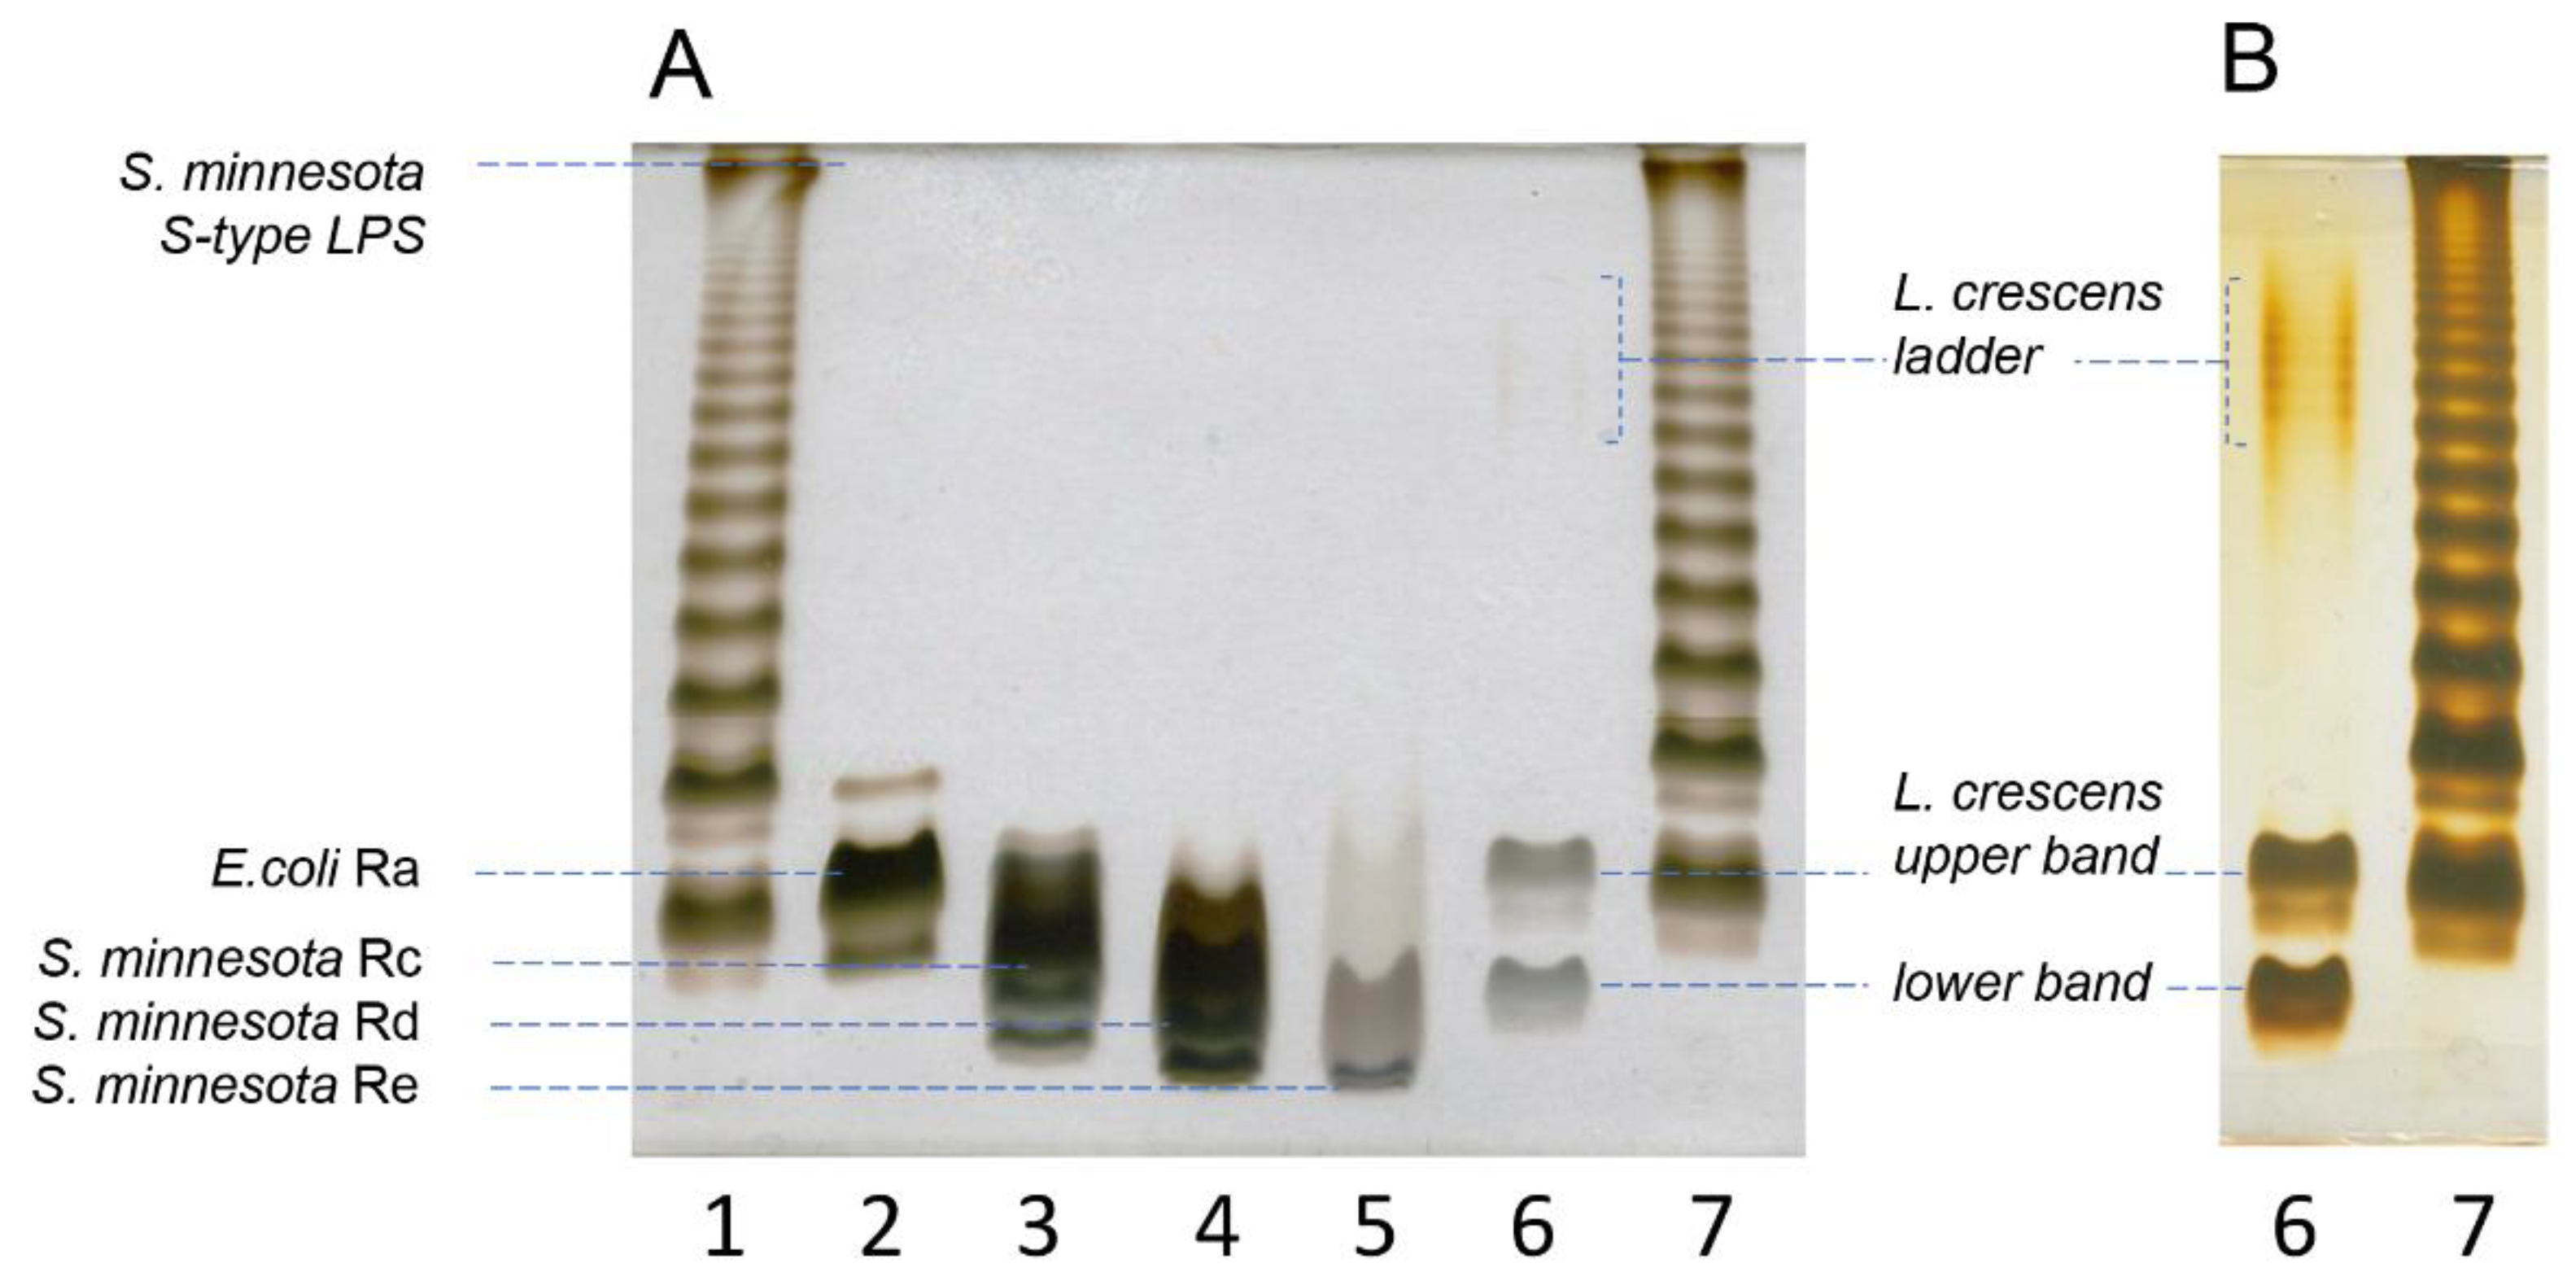
2.1. Purified LPS from Lcr Is Low Molecular Weight
2.2. Composition Analysis of the Purified LPS from Lcr
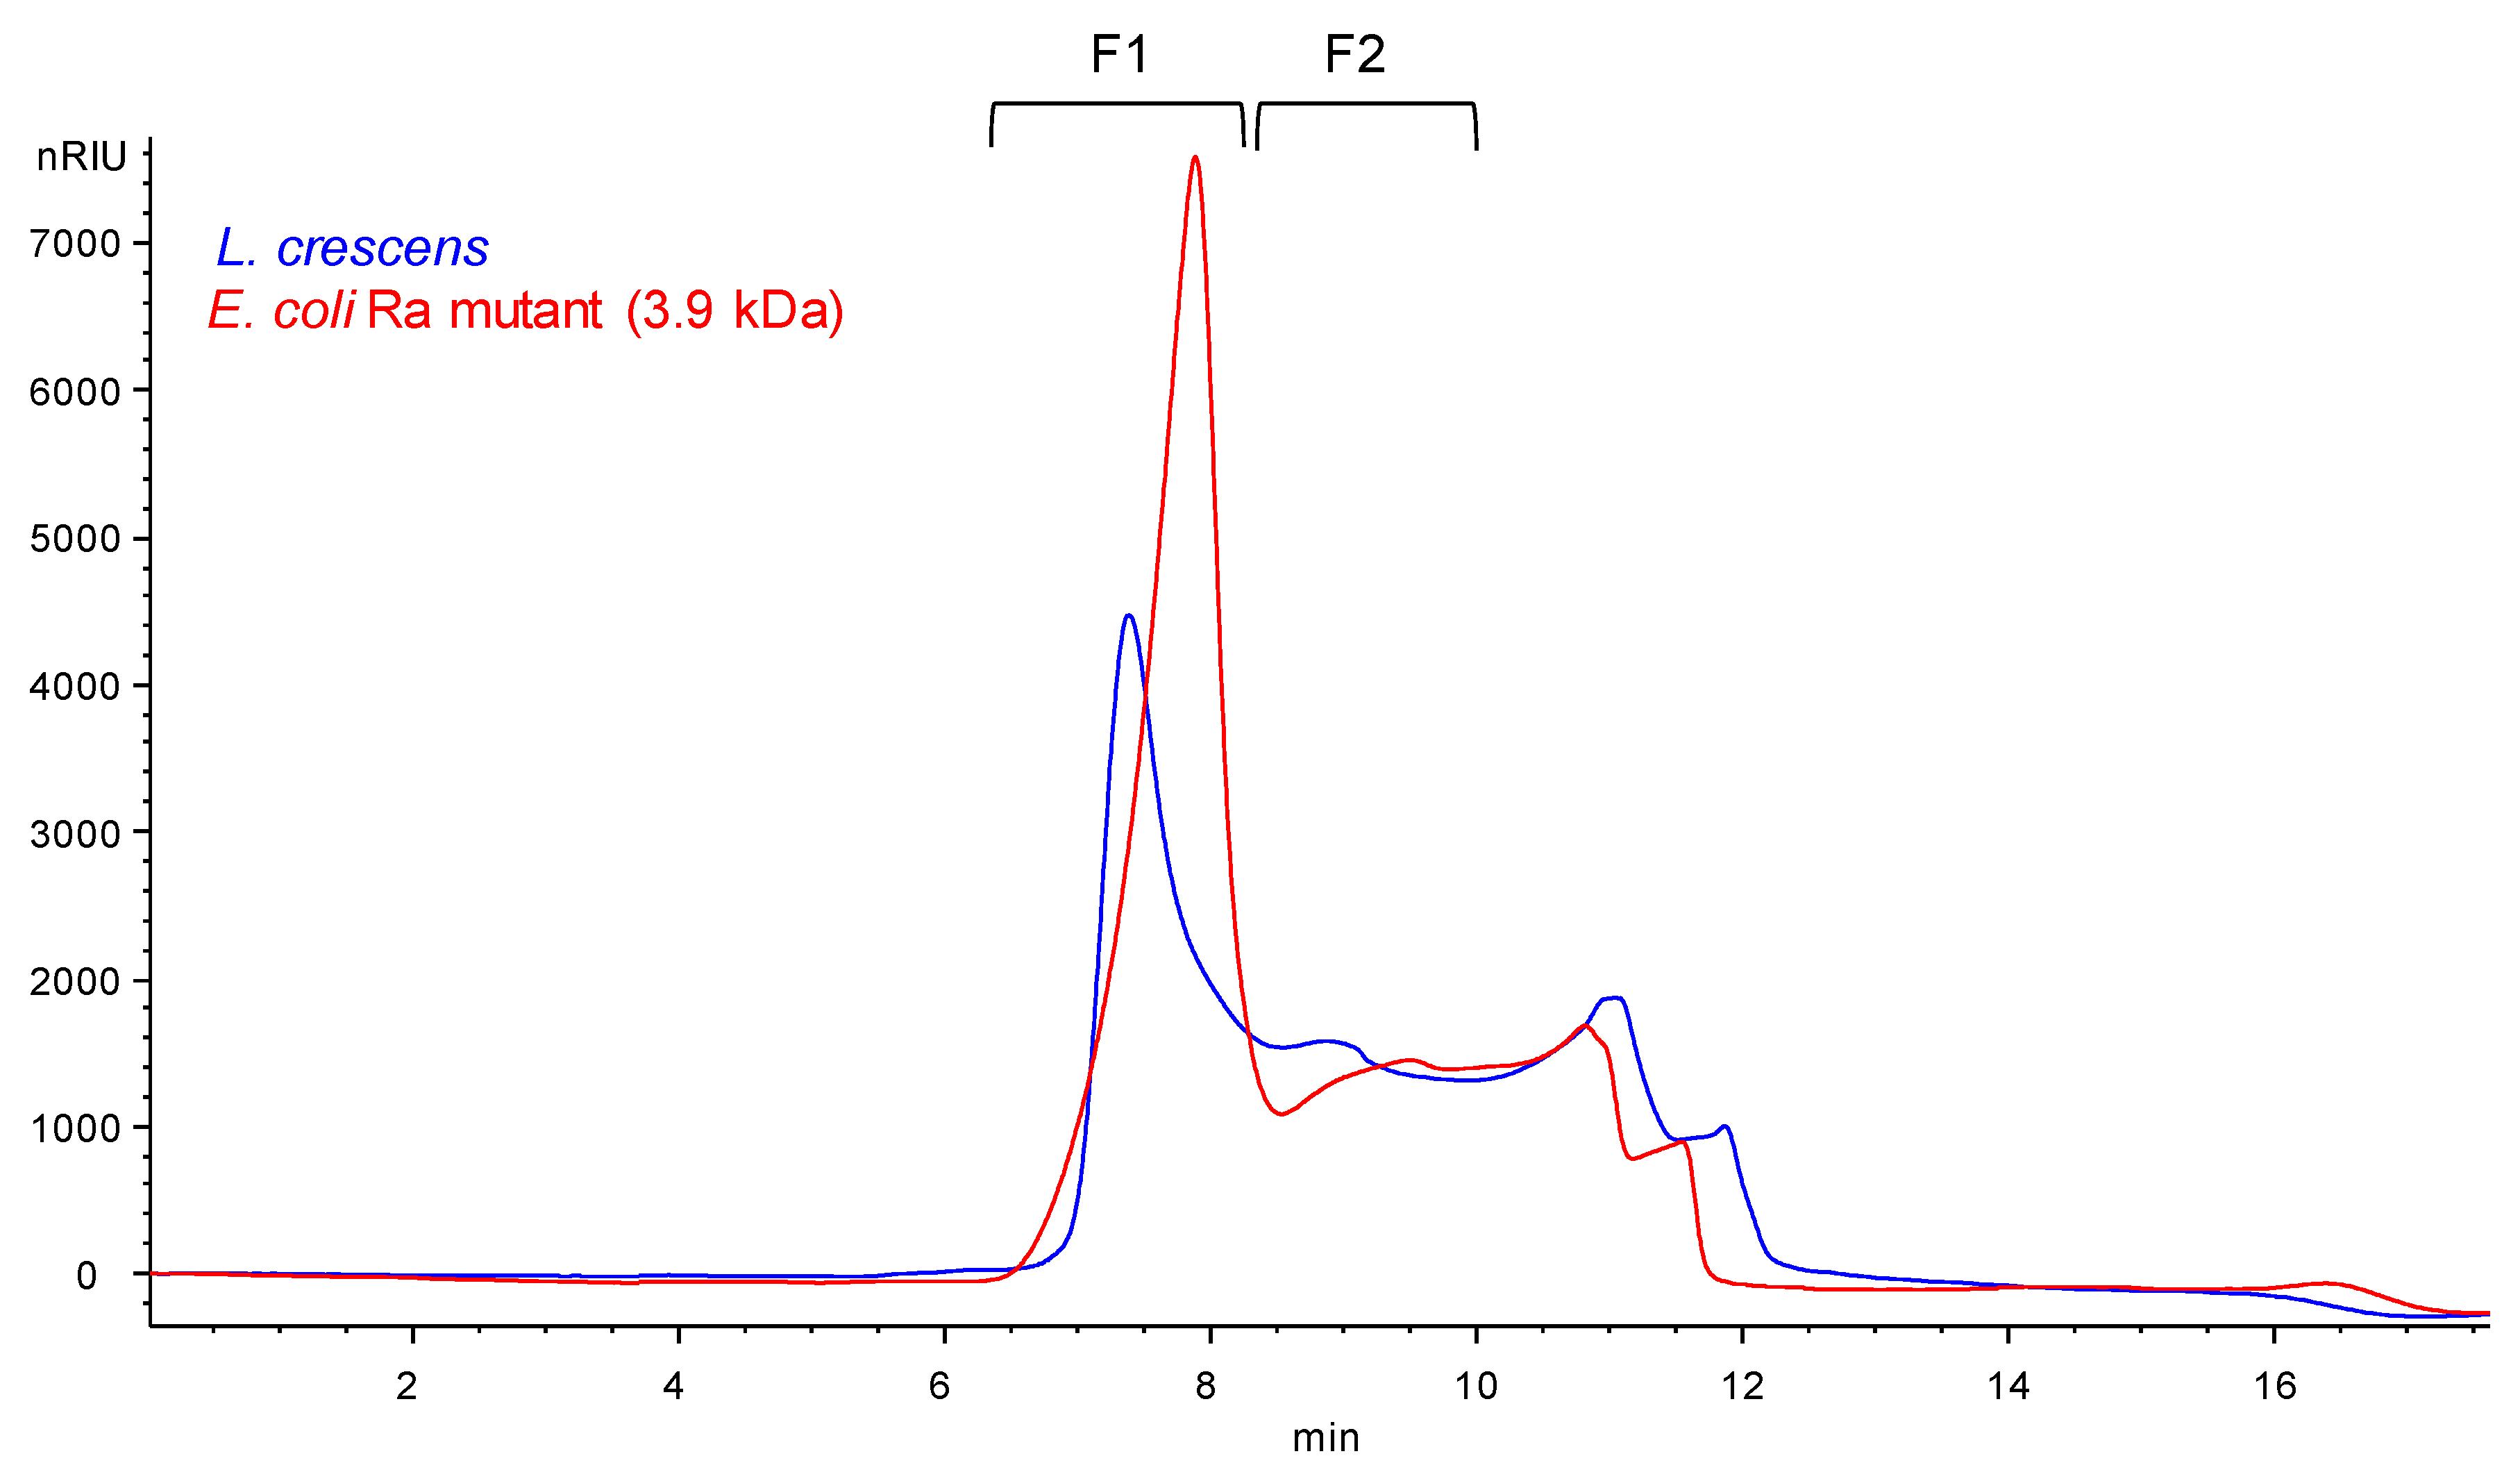
2.3. Composition Analysis of SEC Purified Fractions from Lcr
2.4. Composition Analysis of the Released Lipid A
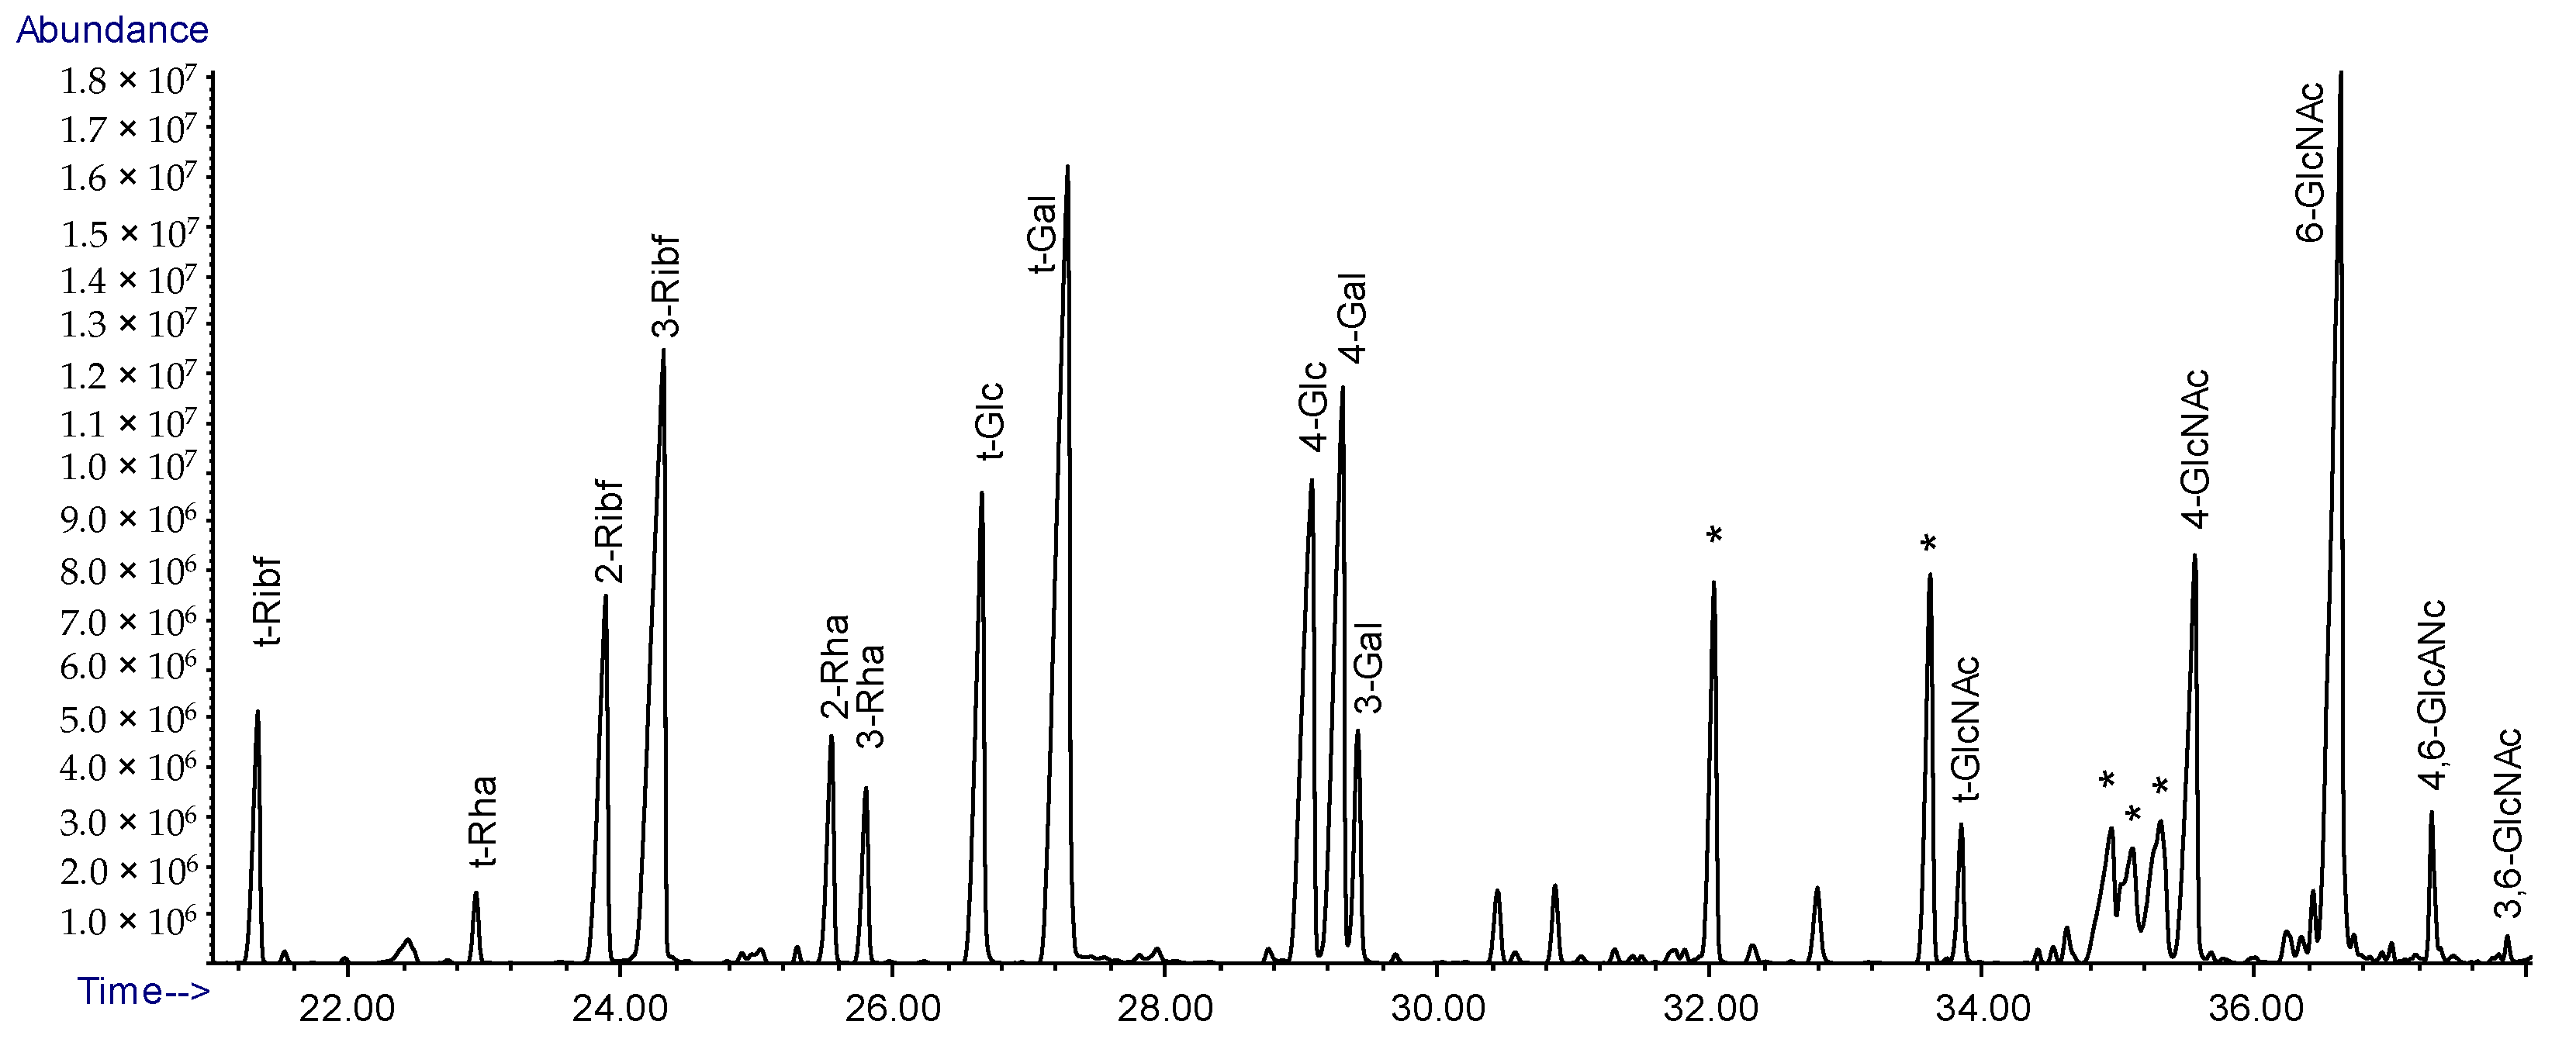
2.5. Linkage Analysis of Lcr LPS
2.6. Mass Spectrometric Analysis of the Released Lipid A
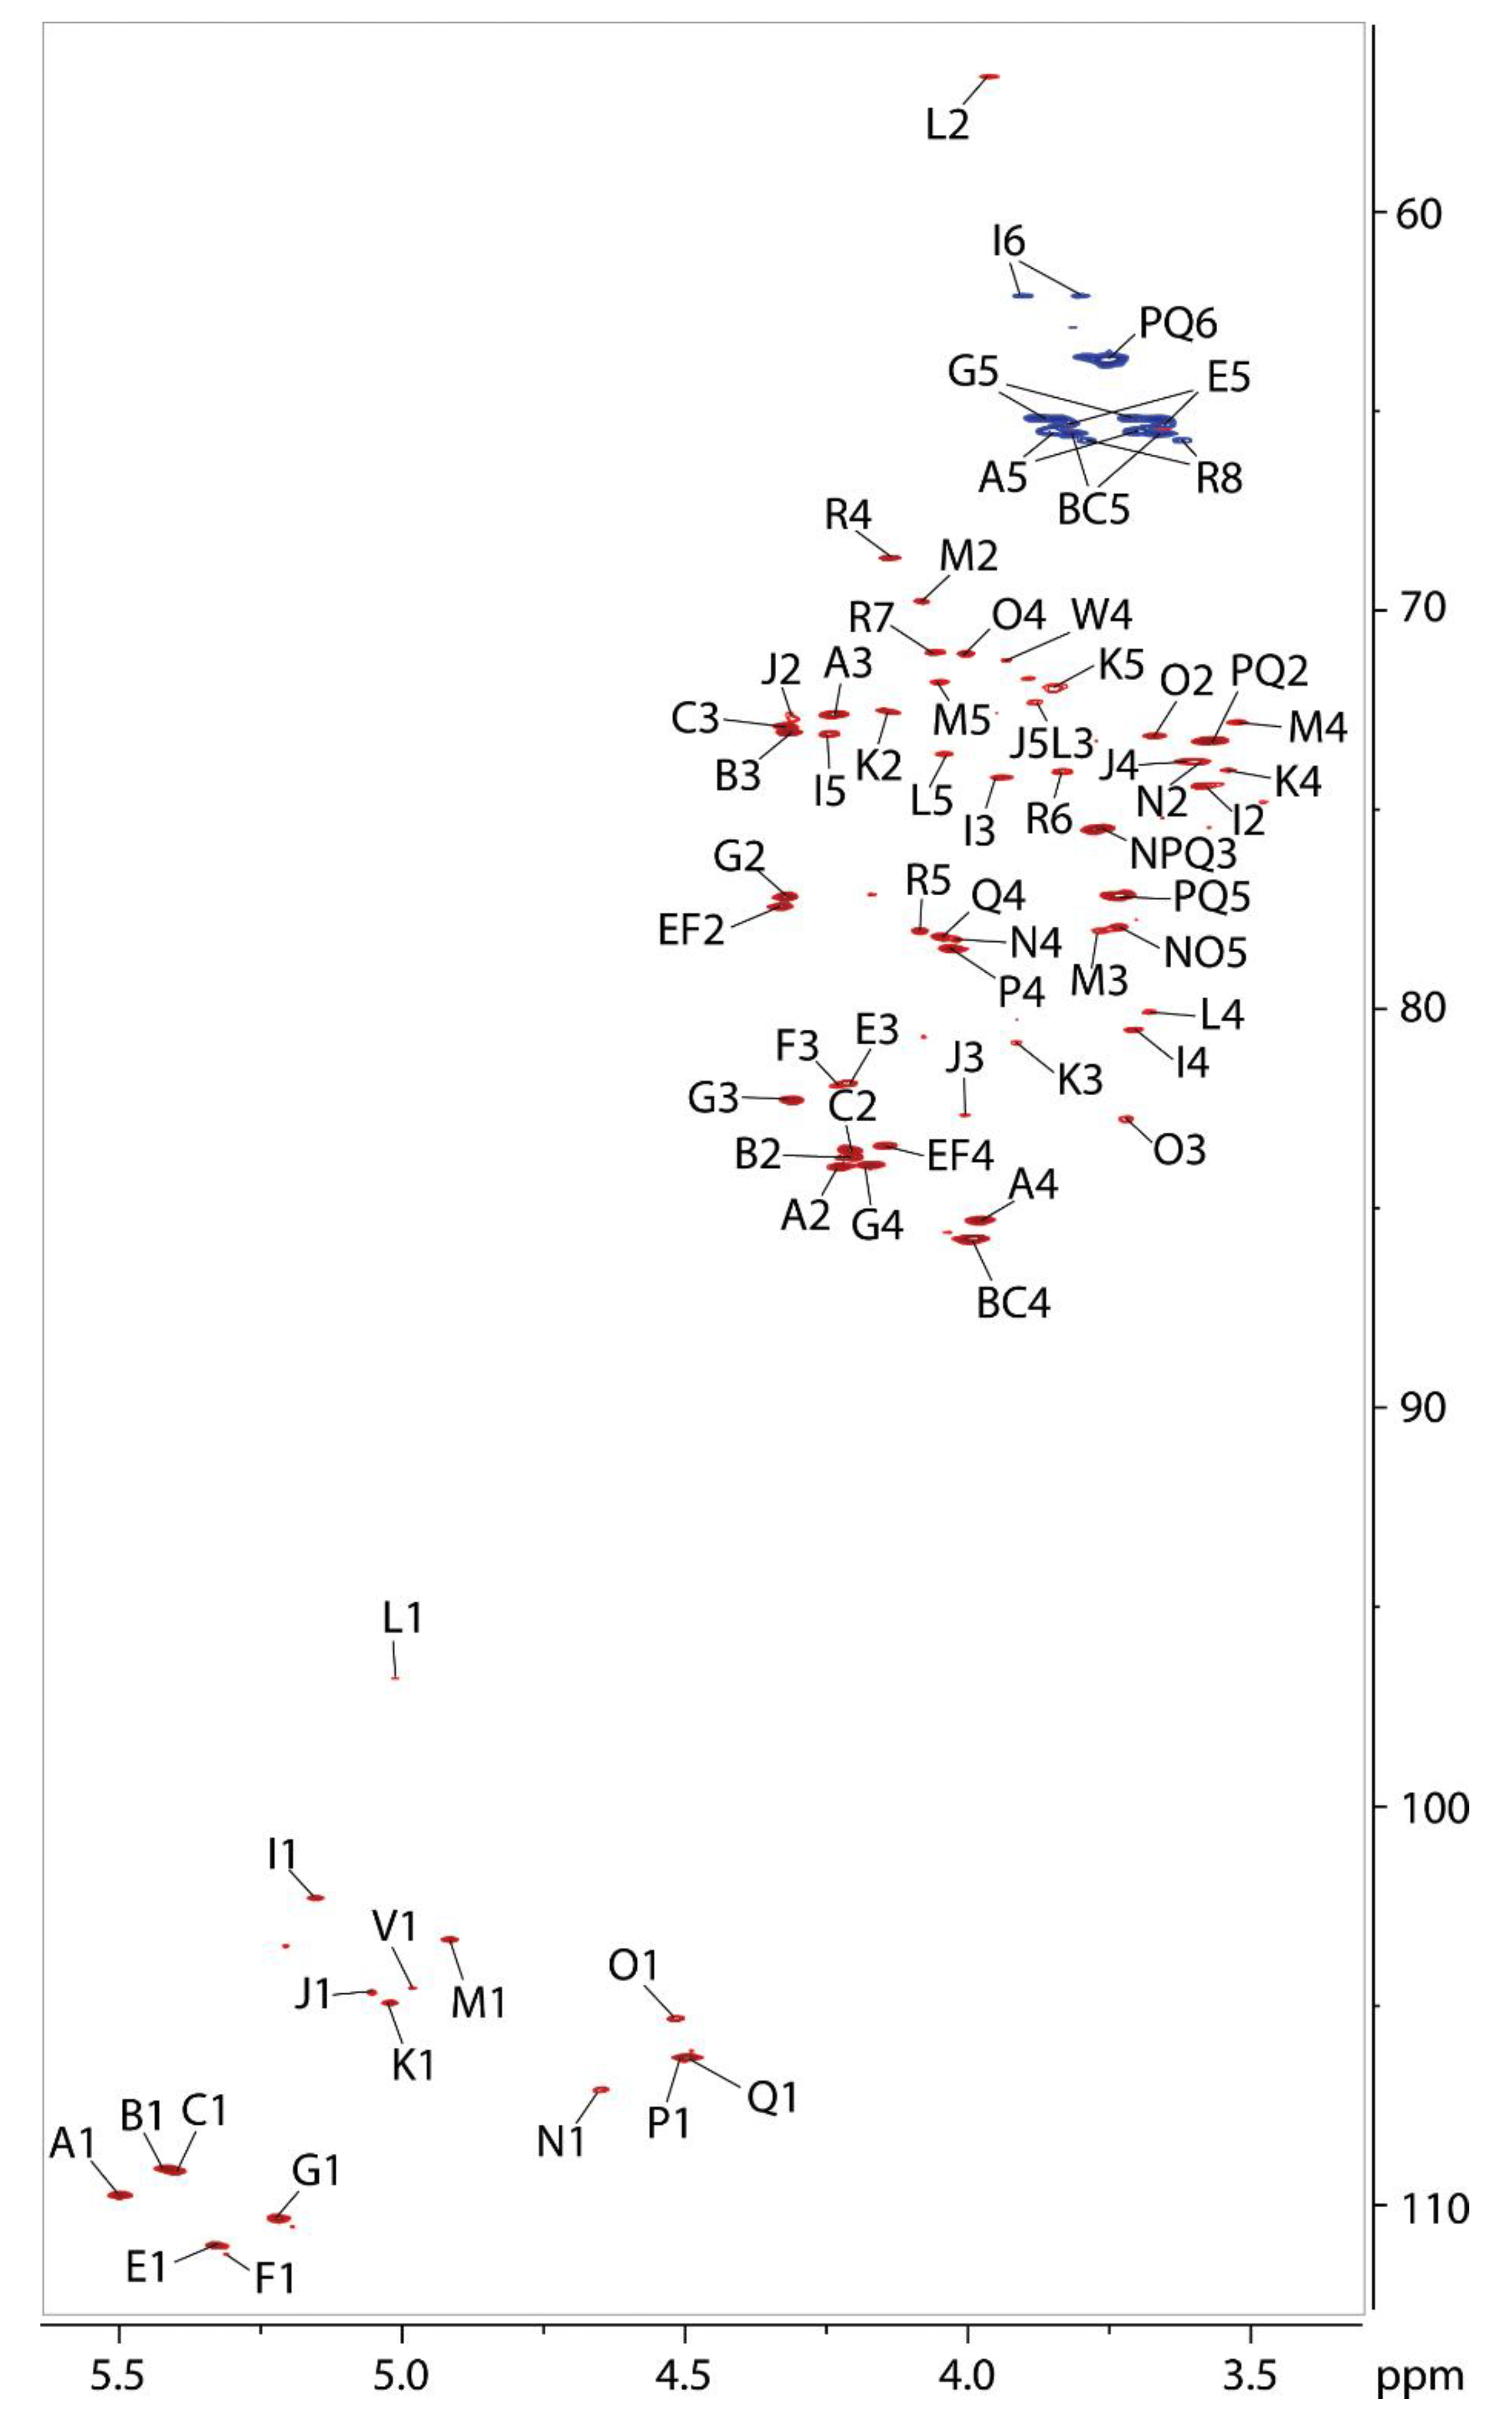
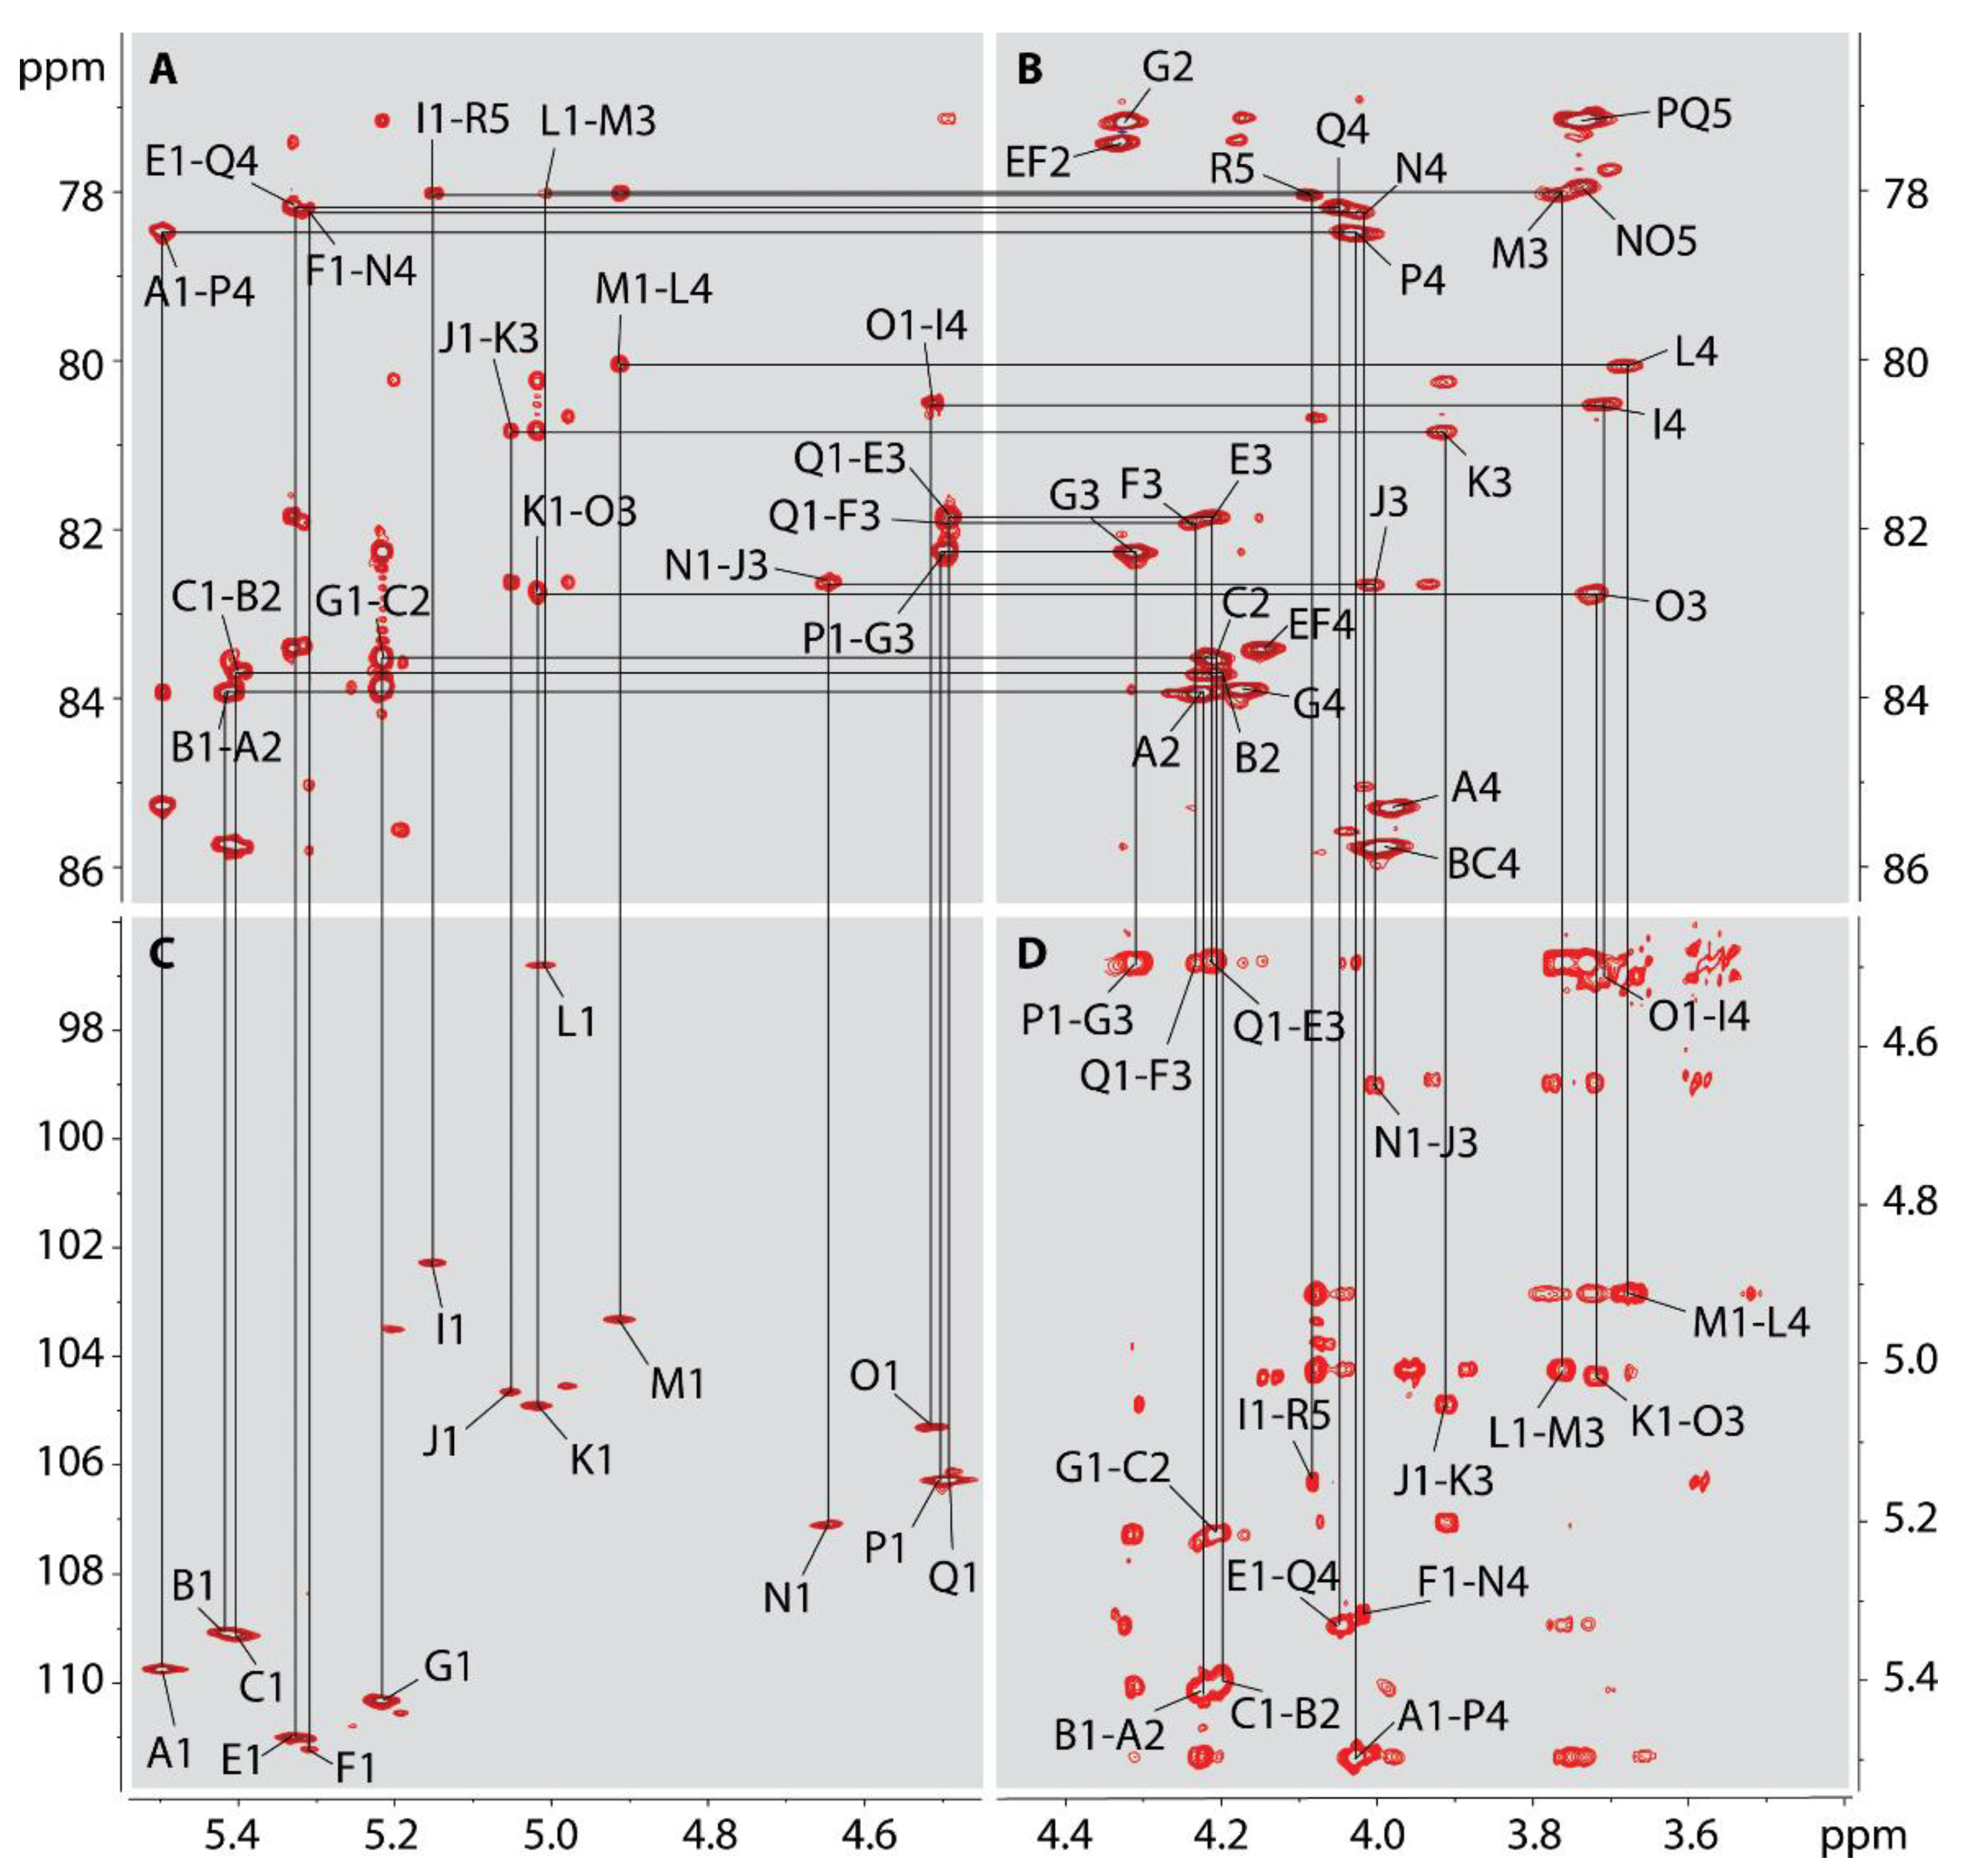
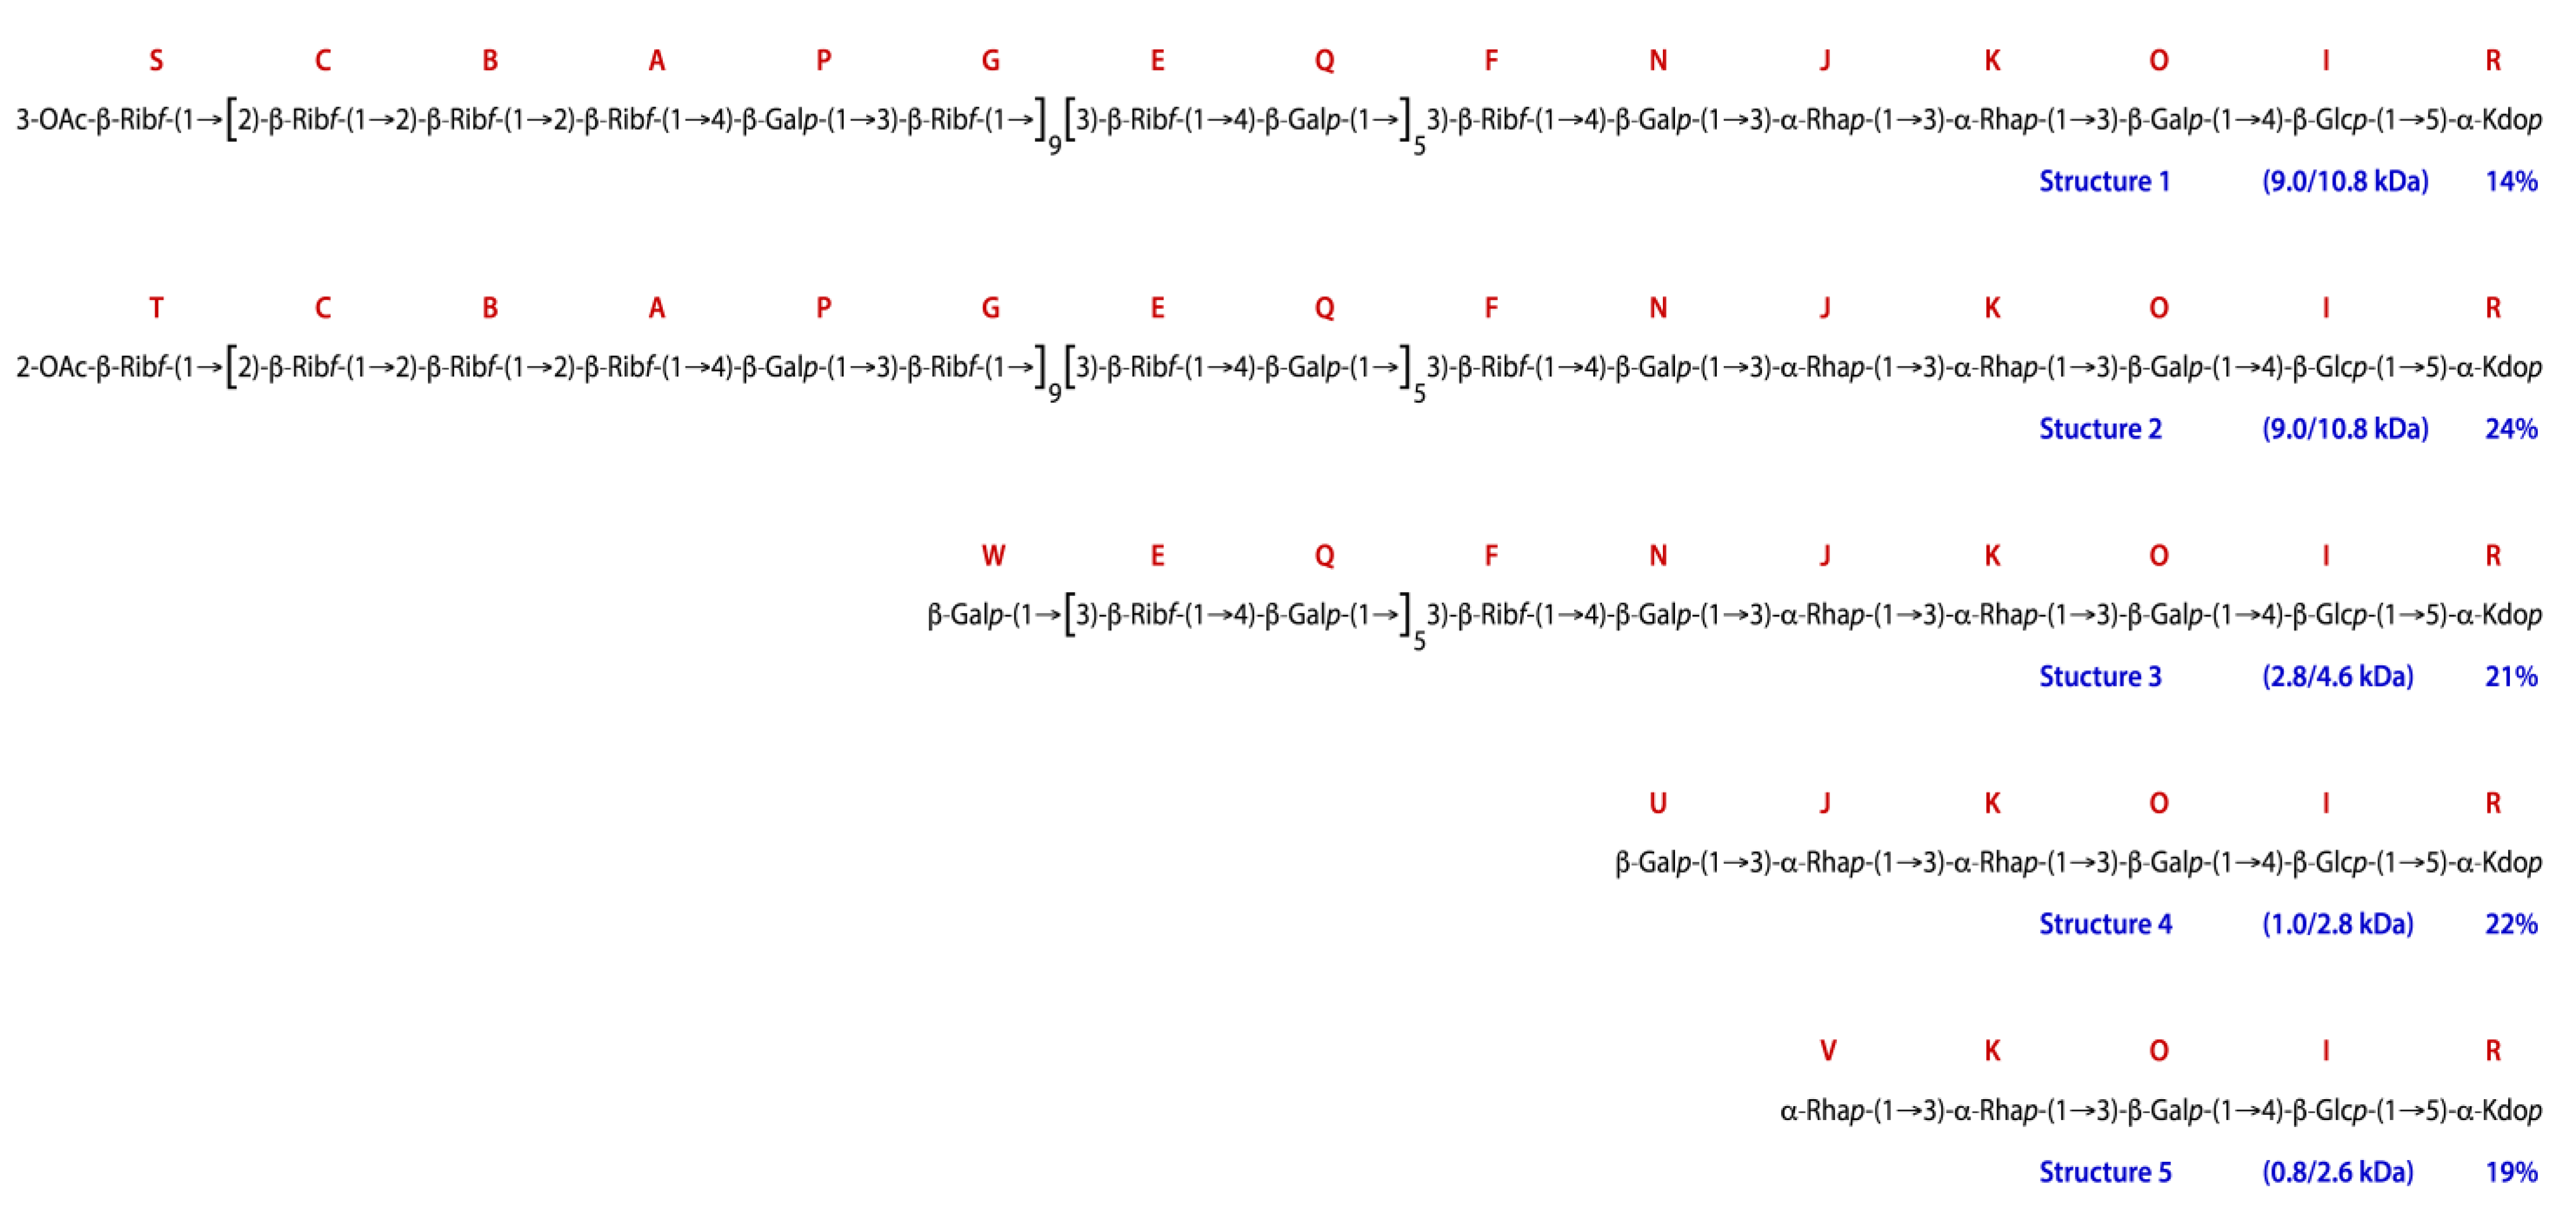
2.7. NMR Analysis of the O-polysaccharide from Lcr
3. Discussion
4. Materials and Methods
4.1. Growth of Lcr Cells
4.2. Isolation of LPS
4.3. Deoxycholate-Polyacrylamide Gel Electrophoresis (DOC-PAGE)
4.4. Composition Analysis of the LPS and Lipid A by TMS Methyl Glycosides
4.5. Isolation of Lipid A
4.6. MALDI-TOF Mass Spectrometric Analysis of the Lipid A
4.7. NMR Analysis of the Released O-polysaccharide
4.8. SEC Analysis of the Released O-polysaccharide from Lcr LPS and E. coli EH100 Mutant
4.9. Glycosyl Linkage Analysis of the Released O-polysaccharide
Author Contributions
Funding
Institutional Review Board Statement
Informed Consent Statement
Data Availability Statement
Conflicts of Interest
References
- Gottwald, T.R. Current epidemiological understanding of citrus huanglongbing. Phytopathology 2010, 48, 119–139. [Google Scholar] [CrossRef] [PubMed] [Green Version]
- Monger, W.A.; Jeffries, C.J. A survey of ‘Candidatus Liberibacter solanacearum’ in historical seed from collections of carrot and related Apiaceae species. Eur. J. Plant Pathol. 2018, 150, 803–815. [Google Scholar] [CrossRef]
- Achor, D.S.; Etxeberria, E.; Wang, N.; Folimonova, S.Y.; Chung, K.R.; Albrigo, L.G. Sequence of anatomical symptom observations in citrus affected with huanglongbing disease. Plant Pathol. J. 2010, 9, 56–64. [Google Scholar] [CrossRef] [Green Version]
- Alvarez, S.; Rohrig, E.; Solís, D.; Thomas, M.H. Citrus greening disease (Huanglongbing) in Florida: Economic impact, management and the potential for biological control. Agric. Res. J. 2016, 5, 109–118. [Google Scholar] [CrossRef]
- Canales, E.; Coll, Y.; Hernández, I.; Portieles, R.; Rodríguez García, M.; López, Y.; Aranguren, M.; Alonso, E.; Delgado, R.; Luis, M. ‘Candidatus Liberibacter asiaticus’, Causal Agent of Citrus Huanglongbing, Is Reduced by Treatment with Brassinosteroids. PLoS ONE 2016, 11, e0146223. [Google Scholar] [CrossRef]
- Gottwalda, T.; Graham, J.; Irey, M.; McCollum, T.; Wood, B. Inconsequential effect of nutritional treatments on huanglongbing control, fruit quality, bacterial titer and disease progress. Crop Prot. 2012, 36, 73–82. [Google Scholar] [CrossRef]
- Barnett, M.; Solow-Cordero, D.; Long, S. A high-throughput system to identify inhibitors of Candidatus Liberibacter asiaticus transcription regulators. Proc. Natl. Acad. Sci. USA 2019, 116, 18009–18014. [Google Scholar] [CrossRef] [Green Version]
- Muhlradt, P.; Golecki, J. Asymmetrical distribution and artifactual reorientation of lipopolysaccharide in the outer membrane bilayer of Salmonella typhimurium. Eur. J. Biochem. 1975, 51, 343–352. [Google Scholar] [CrossRef]
- Nikaido, H.; Vaara, M. Molecular basis of bacterial outer membrane permeability. Microbiol. Rev. 1985, 49, 1–32. [Google Scholar] [CrossRef]
- Whitfield, C.; Trent, M.S. Biosynthesis and export of bacterial lipopolysaccharides. Annu. Rev. Biochem. 2014, 83, 99–128. [Google Scholar] [CrossRef]
- Wulff, N.; Zhang, S.; Setubal, J.; Almeida, N.; Martins, E.C.; Harakava, R.; Kumar, D.; Rangel, L.T.; Foissac, X.; Bove, J.M.; et al. The complete genome sequence of ‘Candidatus Liberibacter americanus’, associated with Citrus huanglongbing. Mol. Plant-Microbe Interact. 2014, 27, 163–176. [Google Scholar] [CrossRef] [Green Version]
- Erridgea, C.; Bennett-Guerrero, E.; Poxton, I. Structure and function of lipopolysaccharides. Microbes Infect. 2002, 4, 837–851. [Google Scholar] [CrossRef]
- Duan, Y.; Zhou, D.; Hall, W.; Li, H.; Doddapaneni, H.; Lin, H.; Liu, L.; Vahling, C.M.; Gabriel, D.W.; Williams, K.P.; et al. Complete genome sequence of citrus Huanglongbing bacterium, ‘Candidatus Liberibacter asiaticus’ obtained through metagenomics. Mol. Plant-Microbe Interact. 2009, 22, 1011–1020. [Google Scholar] [CrossRef] [Green Version]
- Carlson, R.; Forsberg, L.S.; Kannenberg, E.L. Lipopolysaccharides in Rhizobium-Legume Symbioses. Subcell Biochem. 2010, 53, 339–386. [Google Scholar] [CrossRef]
- Merfa, M.V.; Pérez-López, E.; Naranjo, E.; Jain, M.; Gabriel, D.W.; De La Fuente, L. Progress and obstacles in culturing ‘Candidatus Liberibacter asiaticus’, the bacterium associated with Huanglongbing. Phytopathology 2019, 109, 1092–1101. [Google Scholar] [CrossRef]
- Ha, P.T.; He, R.; Killiny, N.; Brown, J.K.; Omslande, A.; Gang, D.R.; Beyenala, H. Host-free biofilm culture of “Candidatus Liberibacter asiaticus”, the bacterium associated with Huanglongbing. Biofilm 2019, 1, 100005. [Google Scholar] [CrossRef]
- Fujiwara, K.; Iwanami, T.; Fujikawa, T. Alterations of Candidatus Liberibacter asiaticus-associated microbiota decrease survival of Ca. L. asiaticus in in vitro assays. Front. Microbiol. 2018, 9, 3089. [Google Scholar] [CrossRef] [PubMed] [Green Version]
- Leonard, M.T.; Fagen, J.R.; Davis-Richardson, A.G.; Davis, M.J.; Triplett, E.W. Complete genome sequence of Liberibacter crescens BT-1. Stand. Genom. Sci. 2012, 7, 271. [Google Scholar] [CrossRef] [PubMed] [Green Version]
- Jain, M.; Cai, L.; Fleites, L.A.; Munoz-Bodnar, A.; Davis, M.J.; Gabriel, D.W. Liberibacter crescens is a cultured surrogate for functional genomics of uncultured pathogenic ‘Candidatus Liberibacter’ spp. and is naturally competent for transformation. Phytopathology 2019, 109, 1811–1819. [Google Scholar] [CrossRef] [PubMed]
- Nakabachi, A.; Nikoh, N.; Oshima, K.; Inoue, H.; Ohkuma, M.; Hongoh, Y.; Miyagishima, S.Y.; Hattori, M.; Fukatsu, T. Horizontal gene acquisition of Liberibacter plant pathogens from a bacteriome-confined endosymbiont of their psyllid vector. PLoS ONE 2013, 18, e82612. [Google Scholar] [CrossRef]
- Simpson, B.W.; Trent, M.S. Pushing the envelope: LPS modifications and their consequences. Nat. Rev. Microbiol. 2019, 17, 403–416. [Google Scholar] [CrossRef] [PubMed]
- Choma, A.; Komaniecka, I.; Zebracki, K. Structure, biosynthesis and function of unusual lipids A from nodule-inducing and N2-fixing bacteria. Biochim. Biophys. Acta Mol. Cell Biol. Lipids 2017, 1862, 196–209. [Google Scholar] [CrossRef] [PubMed]
- Bhat, U.R.; Forsberg, L.S.; Carlson, R. Structure of Lipid A Component of Rhizobium leguminosarum bv. phaseoli Lipopolysaccharide. JBC 1994, 269, 14402–14410. [Google Scholar] [CrossRef]
- Agrawal, P.K. NMR Spectroscopy in the structural elucidation of oligosaccharides and glycosides. Phytochemistrey 1992, 31, 3307–3330. [Google Scholar] [CrossRef]
- Angyal, S.J. Hudson’s rules of isorotation as applied to furanosides, and the conformations of methyl aldofuranosides. Carbohydr. Res. 1979, 77, 37–50. [Google Scholar] [CrossRef]
- Benesi, A.J.; Falzone, C.J.; Banerjee, S.; Farber, G.K. NMR assignments for the aldopentoses. Carbohydr. Res. 1994, 258, 27–33. [Google Scholar] [CrossRef]
- Lipkind, G.M.; Shashkov, A.S.; Knirel, Y.A.; Vinogradov, E.V.; Kochetkov, N.K. A computer-assisted structural analysis of regular polysaccharides on the basis of 13C-n.m.r. data. Carbohydr. Res. 1988, 175, 59–75. [Google Scholar] [CrossRef]
- Jansson, P.E.; Kenne, L.; Widmalm, G. Computer-assisted structural analysis of polysaccharides with an extended version of CASPER using 1H-and 13C-NMR data. Carbohydr. Res. 1989, 188, 169–191. [Google Scholar] [CrossRef]
- Perry, M.B.; Maclean, L.M.; Brisson, J.R.; Wilson, M.E. Structures of the antigenic O-polysaccharides of lipopolysaccharides produced by Actinobacillus actinomycetemcomitans serotypes a, c, d and e. Eur. J. biochem. 1996, 242, 682–688. [Google Scholar] [CrossRef]
- Starr, K.F.; Porsch, E.A.; Heiss, C.; Black, I.; Azadi, P.; Geme III, J.W.S. Characterization of the Kingella kingae polysaccharide capsule and exopolysaccharide. PLoS ONE 2013, 8, e75409. [Google Scholar] [CrossRef] [Green Version]
- Shashkov, A.S.; Arbatsky, N.P.; Knirel, Y.A. Structures and genetics of Kdo-containing O-antigens of Cronobacter sakazakii G2706 and G2704, the reference strains of serotypes O5 and O6. Carbohydr. Res. 2011, 346, 1924–1929. [Google Scholar] [CrossRef] [PubMed]
- Leone, S.; Molinaro, A.; Pessione, E.; Mazzoli, R.; Giunta, C.; Sturiale, L.; Garozzo, D.; Lanzetta, R.; Parrilli, M. Structural elucidation of the core-lipid A backbone from the lipopolysaccharide of Acinetobacter radioresistens S13, an organic solvent tolerant Gram-negative bacterium. Carbohydr. Res. 2006, 341, 582–590. [Google Scholar] [CrossRef] [PubMed]
- Raetz, C.R.; Guan, Z.; Ingram, B.O.; Six, D.A.; Song, F.; Wang, X.; Zhao, J. Discovery of new biosynthetic pathways: The lipid A story. J. Lipid Res. 2009, 50, S103–S108. [Google Scholar] [CrossRef] [Green Version]
- Ferguson, G.P.; Datta, A.; Baumgartner, J.; Roop, R.M.; Carlson, R.W.; Walker, G.C. Similarity to peroxisomal-membrane protein family reveals that Sinorhizobium and Brucella BacA affect lipid-A fatty acids. Proc. Natl. Acad. Sci. USA 2004, 101, 5012–5017. [Google Scholar] [CrossRef] [PubMed] [Green Version]
- Jain, M.; Cai, L.; Black, I.; Azadi, P.; Carlson, R.W.; Jones, K.M.; Gabriel, D.W. ‘Candidatus Liberibacter asiaticus’-Encoded BCP Peroxiredoxin Suppresses Lipopolysaccharide-Mediated Defense Signaling and Nitrosative Stress in Planta. 2021. Submitted. [Google Scholar]
- Klein, G.; Lindner, B.; Brabetz, W.; Brade, H.; Raina, S. Escherichia coli K-12 Suppressor-free Mutants Lacking Early Glycosyltransferases and Late Acyltransferases: Minimal lipopolysaccharide structure and induction of envelope stress response. J. Biol. Chem. 2009, 284, 15369–15389. [Google Scholar] [CrossRef] [Green Version]
- Gorzelak, P.; Klein, G.; Raina, S. Molecular Basis of Essentiality of Early Critical Steps in the Lipopolysaccharide Biogenesis in Escherichia coli K-12: Requirement of MsbA, Cardiolipin, LpxL, LpxM and GcvB. Int. J. Mol. Sci. 2021, 22, 5099. [Google Scholar] [CrossRef] [PubMed]
- Cardoso, P.G.; Macedo, G.C.; Azevedo, V.; Oliveira, S.C. Brucella spp noncanonical LPS: Structure, biosynthesis, and interaction with host immune system. Microb. Cell Factories 2006, 5, 13. [Google Scholar] [CrossRef] [PubMed] [Green Version]
- Maldonado, R.F.; SáCorreia, I.; Valvano, M.A. Lipopolysaccharide modification in Gram-negative bacteria during chronic infection. FEMS Microbiol. Rev. 2016, 40, 480–493. [Google Scholar] [CrossRef]
- Westphal, O.; Jann, K. Bacterial Lipopolysaccharides Extraction with Phenol-Water and Further Applications of the Procedure. Methods Carbohydr. Chem. 1965, 5, 83–91. [Google Scholar] [CrossRef]
- Krauss, J.H.; Weckesser, J.; Mayer, H. Electrophoretic analysis of lipopolysaccharides of purple non-sulfur bacteria. Int. J. Syst. Bacteriol. 1988, 38, 157–163. [Google Scholar] [CrossRef] [Green Version]
- Tsai, C.; Frisch, C.E. A sensitive silver stain for detecting lipopolysaccharides in polyacrylamide gels. Anal. Biochem. 1982, 119, 115–119. [Google Scholar] [CrossRef]
- Santander, J.; Martin, T.; Loh, A.; Pohlenz, C.; Gatlin, D.M.; Curtiss, R. Mechanisms of intrinsic resistance to antimicrobial peptides of Edwardsiella ictaluri and its influence on fish gut inflammation and virulence. Microbiology 2013, 159, 1471–1486. [Google Scholar] [CrossRef] [Green Version]
- Vranken, W.F.; Boucher, W.; Stevens, T.J.; Fogh, R.H.; Pajon, A.; Llinas, M.; Ulrich, E.L.; Markley, J.L.; Ionides, J.; Laue, E.D. The CCPN data model for NMR spectroscopy: Development of a software pipeline. Proteins 2005, 59, 687–696. [Google Scholar] [CrossRef] [PubMed]
- Heiss, C.; Klutts, J.S.; Wang, Z.; Doering, T.L.; Azadi, P. The structure of Cryptococcus neoformans galactoxylomannan contains beta-D-glucuronic acid. Carbohydr Res. 2009, 344, 915–920. [Google Scholar] [CrossRef] [PubMed]


| Glycosyl Residue | Mass (μg) | Mol % |
|---|---|---|
| Ribose (Rib) | 26.4 | 43.8 |
| Rhamnose (Rha) | 7.8 | 11.9 |
| Galactose (Gal) | 16.6 | 22.9 |
| Glucose (Glc) | 6 | 8.3 |
| N-Acetylglucosamine (GlcNAc) | 8.1 | 13.2 |
| Σ= | 65 | 100 |
| Glycosyl Residue | Ratio F1/F2 |
|---|---|
| Ribose | 3.13 |
| Rhamnose | 2.37 |
| Galactose | 1.14 |
| Glucose | 0.67 |
| 3-Deoxy-D-manno-oct-2-ulosonic acid | 0.17 |
| N-Acetylglucosamine | 1.97 |
| Inositol | 1.00 |
| Residue | Area % |
|---|---|
| Terminal Ribofuranosyl Residue (t-Ribf) | 3.0 |
| Terminal Rhamnopyranosyl Residue (t-Rha) | 0.7 |
| 2-Linked Ribofuranosyl Residue (2-Ribf) | 5.7 |
| 3-Linked Ribofuranosyl Residue (3-Ribf) | 13.8 |
| 2-Linked Rhamnopyranosyl Residue (2-Rha) | 2.7 |
| 3-Linked Rhamnopyranosyl Residue (3-Rha) | 1.9 |
| Terminal Glucopyranosyl Residue (t-Glc) | 6.7 |
| Terminal Galactopyranosyl Residue (t-Gal) | 17.8 |
| 4-Linked Glucopyranosyl Residue (4-Glc) | 9.6 |
| 4-Linked Galactopyranosyl Residue (4-Gal) | 9.9 |
| 3-Linked Galactopyranosyl Residue (3-Gal) | 2.7 |
| Terminal N-Acetylglucosamine Residue (t-GlcNAc) | 1.4 |
| 4-Linked N-Acetylglucosamine Residue (4-GlcNAc) | 6.5 |
| 6-Linked N-Acetylglucosamine Residue (6-GlcNAc) | 16.1 |
| 4,6-Linked N-Acetylglucosamine Residue (4,6-GlcNAc) | 1.3 |
| 3,6-Linked N-Acetylglucosamine Residue (3,6-GlcNAc) | 0.2 |
| Ion | Observed Mass * | Calculated Mass * | Composition ** |
|---|---|---|---|
| Positive mode ions | |||
| [M+Na]+ | 1746.33 | 1746.39 | GlcN216:0(3-OH)214:0(3-OH)228:0(27-OH)1 |
| [M+Na]+ | 1774.35 | 1774.43 | GlcN216:0(3-OH)314:0(3-OH)128:0(27-OH)1 |
| [MNa+Na]+ | 1848.34 | 1848.34 | P1GlcN216:0(3-OH)214:0 3-OH)228:0(27-OH)1 |
| [MNa+Na]+ | 1876.33 | 1876.36 | P1GlcN216:0(3-OH)314:0(3-OH)128:0(27-OH)1 |
| Negative mode ions | |||
| [M-H]− | 1774.95 | 1774.32 | P1GlcN216:0(3-OH)114:0(3-OH)328:0(27-OH)1 |
| [M-H]− | 1802.97 | 1802.36 | P1GlcN216:0(3-OH)214:0(3-OH)228:0(27-OH)1 |
| [M-H]− | 1830.99 | 1830.39 | P1GlcN216:0(3-OH)314:0(3-OH)128:0(27-OH)1 |
| [M-H]− | 1926.96 | 1926.02 | PEA1P1GlcN216:0(3-OH)314:0(3-OH)128:0 (27-OH)1 |
| No. | Residue | H-1 | H-2 | H-3 | H-4 | H-5 | H-6 | H-7 | H-8 |
|---|---|---|---|---|---|---|---|---|---|
| C-1 | C-2 | C-3 | C-4 | C-5 | C-6 | C-7 | C-8 | ||
| A | 2-β-Ribf-1- | 5.50 | 4.22 | 4.23 | 3.98 | 3.67/3.84 | |||
| 109.8 | 84.0 | 72.6 | 85.3 | 65.5 | |||||
| B | 2-β-Ribf-1- | 5.42 | 4.20 | 4.32 | 3.99 | 3.66/3.81 | |||
| 109.2 | 83.7 | 73.1 | 85.8 | 65.7 | |||||
| C | 2-β-Ribf-1- | 5.40 | 4.21 | 4.33 | 4.00 | 3.66/3.81 | |||
| 109.2 | 83.7 | 72.9 | 85.8 | 65.7 | |||||
| D | 2-β-Ribf-1- | 5.39 | 4.21 | 4.33 | 4.01 | 3.66/3.82 | |||
| 109.2 | 83.7 | 73.0 | 85.8 | 65.7 | |||||
| E | 3-β-Ribf-1- | 5.33 | 4.33 | 4.21 | 4.14 | 3.71/3.88 | |||
| 111.0 | 77.4 | 81.9 | 83.5 | 65.3 | |||||
| F | 3-β-Ribf-1- | 5.32 | 4.34 | 4.23 | 4.14 | 3.71/3.81 | |||
| 111.1 | 77.4 | 82.0 | 83.9 | 65.6 | |||||
| G | 3-β-Ribf-1- | 5.22 | 4.32 | 4.31 | 4.17 | 3.70/3.85 | |||
| 110.3 | 77.2 | 82.3 | 83.9 | 65.2 | |||||
| I | 4-α-Glcp-1- | 5.15 | 3.59 | 3.94 | 3.71 | 4.24 | 3.80/3.90 | ||
| 102.3 | 73.9 | 74.3 | 80.6 | 73.1 | 62.2 | ||||
| J | 3-α-Rhap-1- | 5.05 | 4.31 | 4.00 | 3.62 | 3.89 | 1.30 | ||
| 104.7 | 72.7 | 82.7 | 73.8 | 72.4 | 19.3 | ||||
| K | 3-α-Rhap-1- | 5.02 | 4.14 | 3.92 | 3.54 | 3.84 | 1.28 | ||
| 104.9 | 72.6 | 80.9 | 74.0 | 71.9 | 19.3 | ||||
| L | 4-α-GlcpNAc-1- | 5.01 | 3.96 | 3.88 | 3.68 | 4.04 | 3.72/3.79 | ||
| 96.8 | 56.6 | 72.3 | 80.1 | 73.6 | 62.5 | ||||
| M | 3-α-Rhap-1- | 4.91 | 4.08 | 3.76 | 3.52 | 4.05 | 1.26 | ||
| 103.4 | 69.8 | 78.2 | 72.9 | 71.8 | 19.3 | ||||
| N | 4-β-Galp-1- | 4.65 | 3.60 | 3.78 | 4.02 | 3.72 | |||
| 107.1 | 73.8 | 75.5 | 78.4 | 77.9 | |||||
| O | 3-β-Galp-1- | 4.51 | 3.67 | 3.72 | 4.00 | 3.74 | |||
| 105.4 | 73.2 | 82.8 | 71.2 | 78.0 | |||||
| P | 4-β-Galp-1- | 4.50 | 3.57 | 3.76 | 4.03 | 3.73 | 3.75/3.77 | ||
| 106.3 | 73.3 | 75.5 | 78.5 | 77.2 | 63.7 | ||||
| Q | 4-β-Galp-1- | 4.49 | 3.57 | 3.77 | 4.05 | 3.73 | 3.75/3.77 | ||
| 106.3 | 73.3 | 75.5 | 78.5 | 77.2 | 63.7 | ||||
| R | 5-α-Kdop | 1.86/2.07 | 4.14 | 4.09 | 3.83 | 4.05 | 3.62/3.80 | ||
| 179.2 | 99.2 | 37.0 | 68.7 | 78.1 | 74.1 | 71.1 | 65.7 | ||
| S | 3-OAc-β-Ribf-1- | 5.26 | 4.43 | 5.11 | 4.26 | 3.70/3.81 | |||
| 110.9 | 75.9 | 76.2 | 84.0 | 65.6 | |||||
| T | 2-OAc-β-Ribf-1- | 5.19 | 5.19 | 4.44 | 4.07 | 3.70/3.86 | |||
| 110.6 | 79.3 | 72.1 | 85.8 | 65.2 | |||||
| U | β-Galp-1- | 4.64 | 3.58 | 3.67 | 3.92 | 3.69 | |||
| 107.1 | 74.5 | 75.3 | 71.3 | 77.8 | |||||
| V | α-Rhap-1- | 4.98 | 4.21 | 3.95 | 3.48 | 3.83 | 1.30 | ||
| 104.8 | 73.2 | 72.6 | 74.8 | 71.8 | 19.3 | ||||
| W | β-Galp-1- | 4.49 | 3.65 | 3.72 | 3.93 | ||||
| 106.1 | 73.3 | 75.2 | 71.3 |
| Residue | Calculated NMR Intensity | Measured NMR Intensity |
|---|---|---|
| R | 1.00 | 0.87 |
| I | 1.00 | 1.13 |
| O | 1.00 | 0.96 |
| K | 1.00 | 1.04 |
| V | 0.19 | 0.22 |
| J | 0.81 | 0.87 |
| U | 0.22 | 0.26 |
| N | 0.59 | 0.53 |
| F | 0.59 | 0.78 |
| Q | 2.96 | 3.48 |
| E | 2.96 | 2.17 |
| W | 0.21 | 0.25 |
| C | 3.40 | 2.70 |
| G | 3.40 | 3.57 |
| P | 3.40 | 3.48 |
| A | 3.40 | 3.22 |
| B | 3.40 | 2.43 |
| S | 0.14 | 0.17 |
| T | 0.24 | 0.28 |
Publisher’s Note: MDPI stays neutral with regard to jurisdictional claims in published maps and institutional affiliations. |
© 2021 by the authors. Licensee MDPI, Basel, Switzerland. This article is an open access article distributed under the terms and conditions of the Creative Commons Attribution (CC BY) license (https://creativecommons.org/licenses/by/4.0/).
Share and Cite
Black, I.M.; Heiss, C.; Jain, M.; Muszyński, A.; Carlson, R.W.; Gabriel, D.W.; Azadi, P. Structure of Lipopolysaccharide from Liberibacter crescens Is Low Molecular Weight and Offers Insight into Candidatus Liberibacter Biology. Int. J. Mol. Sci. 2021, 22, 11240. https://doi.org/10.3390/ijms222011240
Black IM, Heiss C, Jain M, Muszyński A, Carlson RW, Gabriel DW, Azadi P. Structure of Lipopolysaccharide from Liberibacter crescens Is Low Molecular Weight and Offers Insight into Candidatus Liberibacter Biology. International Journal of Molecular Sciences. 2021; 22(20):11240. https://doi.org/10.3390/ijms222011240
Chicago/Turabian StyleBlack, Ian M., Christian Heiss, Mukesh Jain, Artur Muszyński, Russell W. Carlson, Dean W. Gabriel, and Parastoo Azadi. 2021. "Structure of Lipopolysaccharide from Liberibacter crescens Is Low Molecular Weight and Offers Insight into Candidatus Liberibacter Biology" International Journal of Molecular Sciences 22, no. 20: 11240. https://doi.org/10.3390/ijms222011240
APA StyleBlack, I. M., Heiss, C., Jain, M., Muszyński, A., Carlson, R. W., Gabriel, D. W., & Azadi, P. (2021). Structure of Lipopolysaccharide from Liberibacter crescens Is Low Molecular Weight and Offers Insight into Candidatus Liberibacter Biology. International Journal of Molecular Sciences, 22(20), 11240. https://doi.org/10.3390/ijms222011240