
Histone Deacetylase Inhibition Regulates Lipid Homeostasis in a Mouse Model of Amyotrophic Lateral Sclerosis

 , and
, and 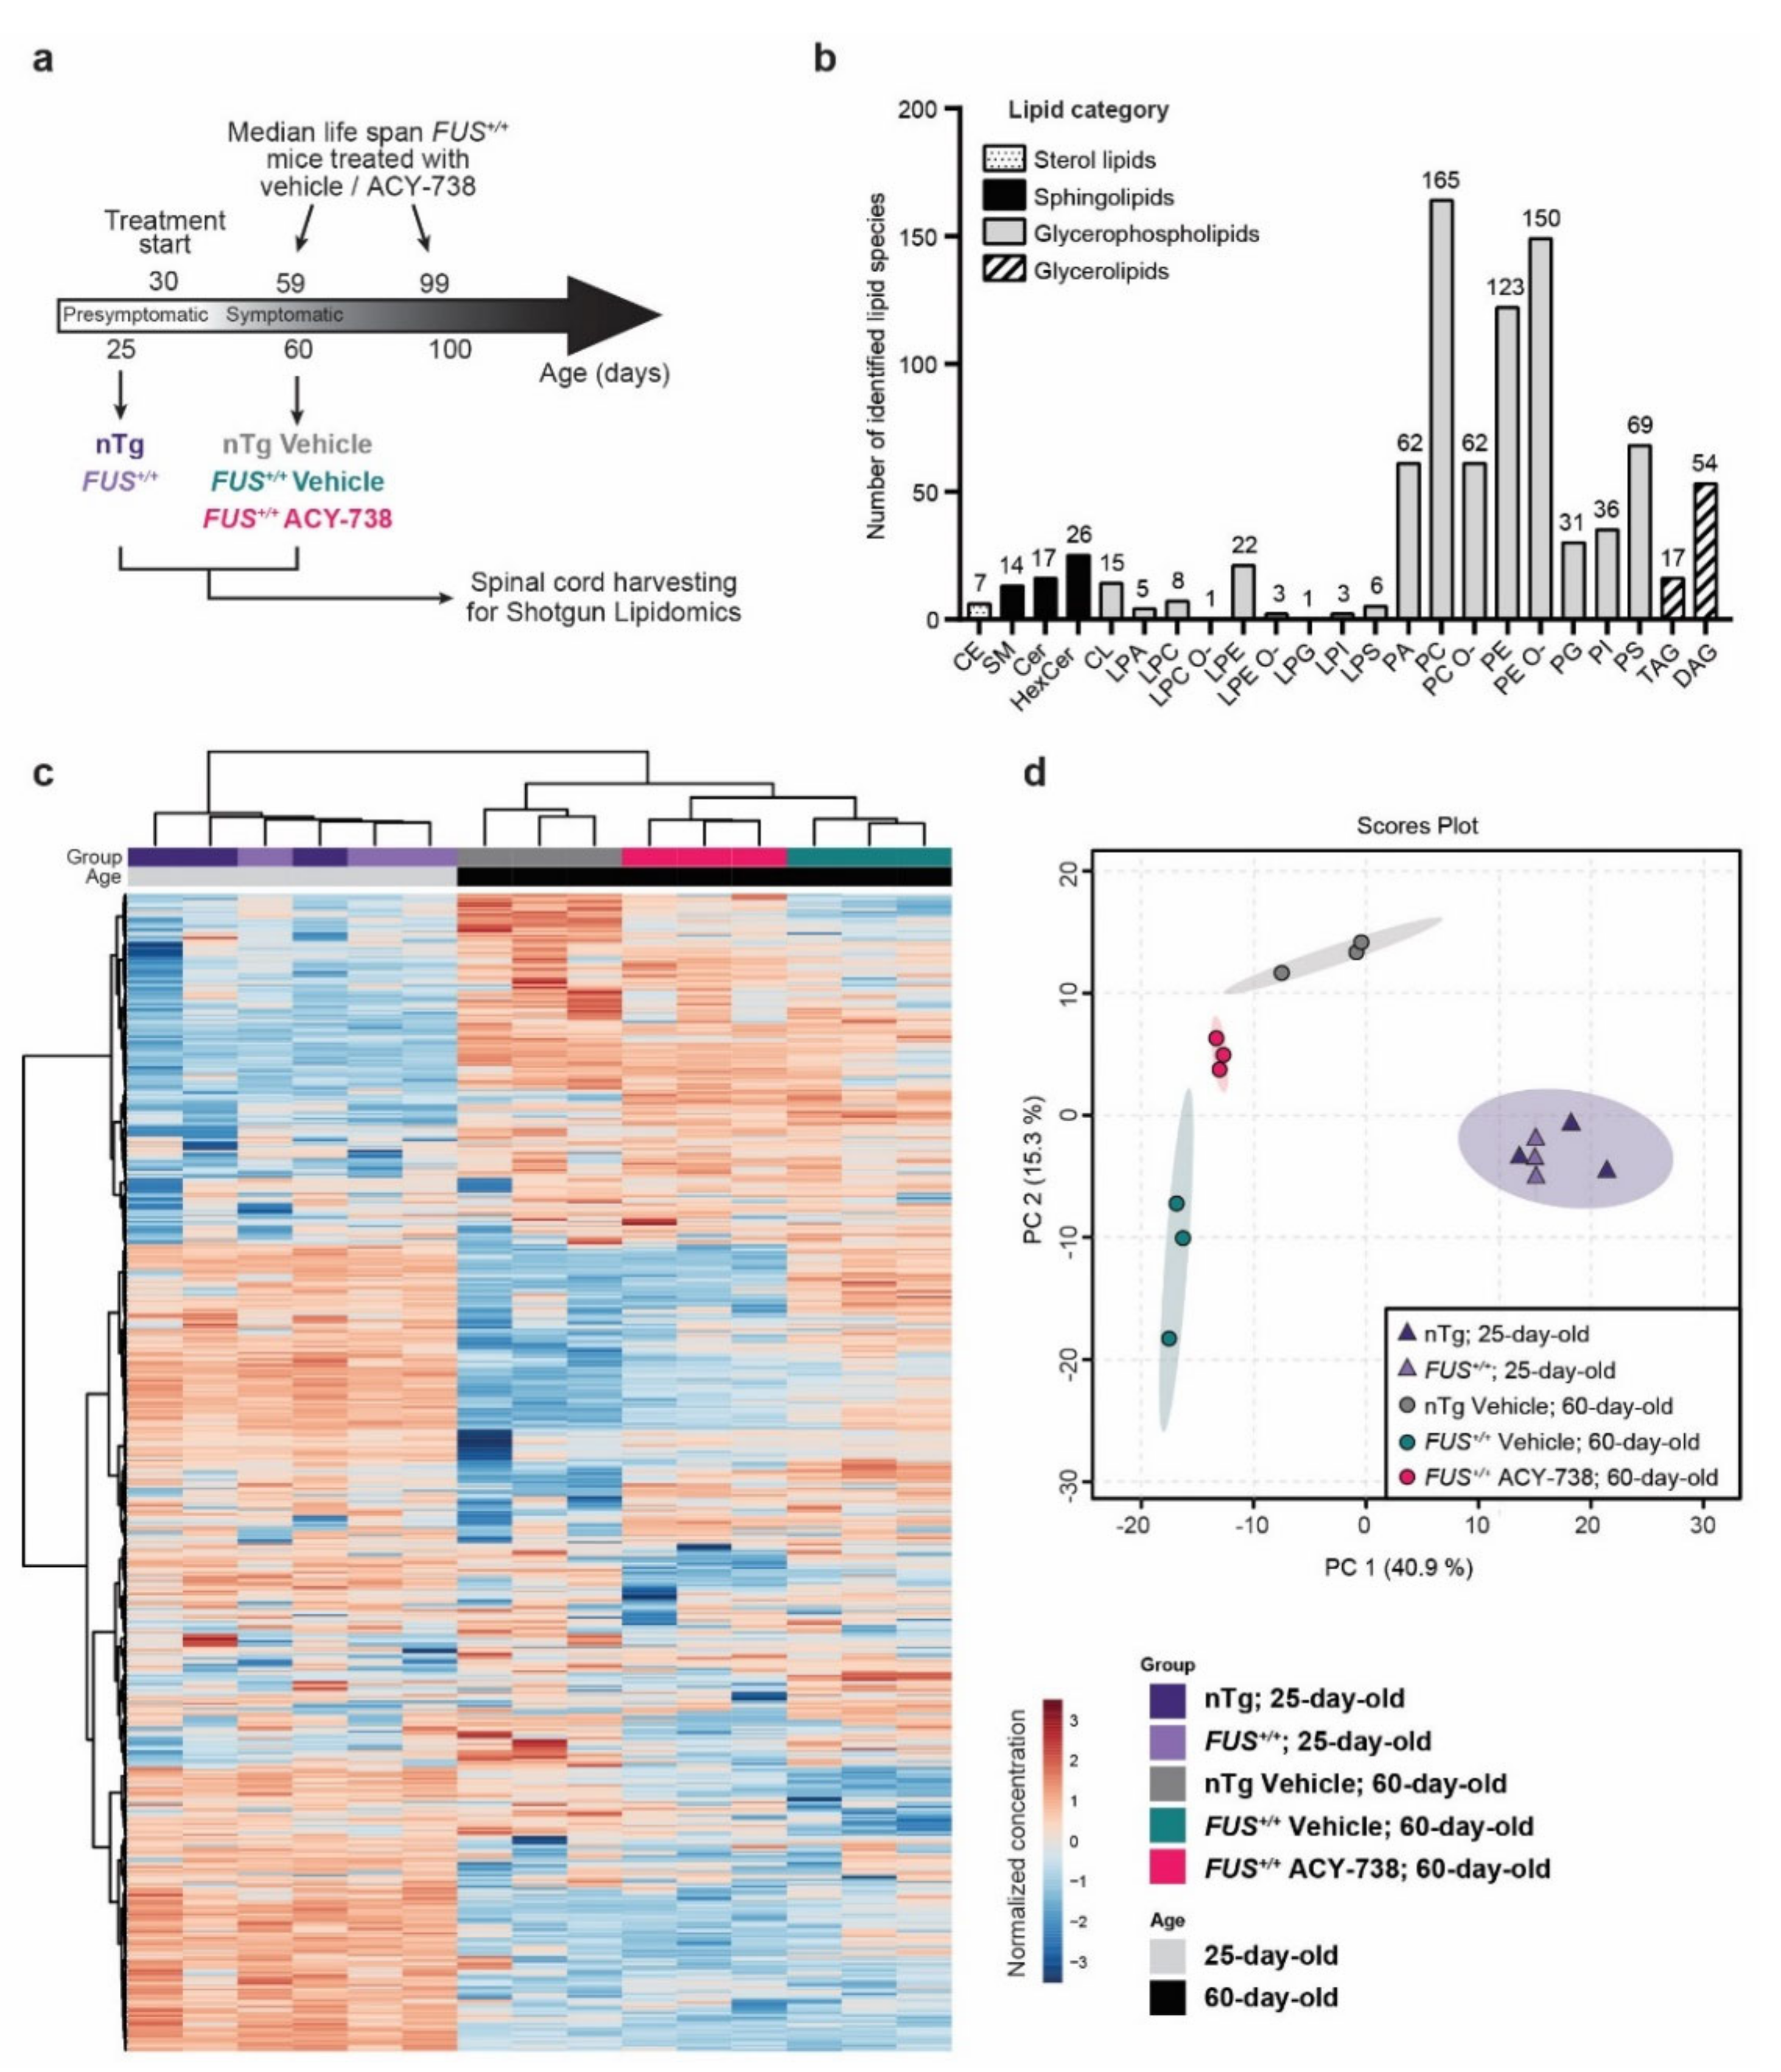
Abstract
:1. Introduction
2. Results
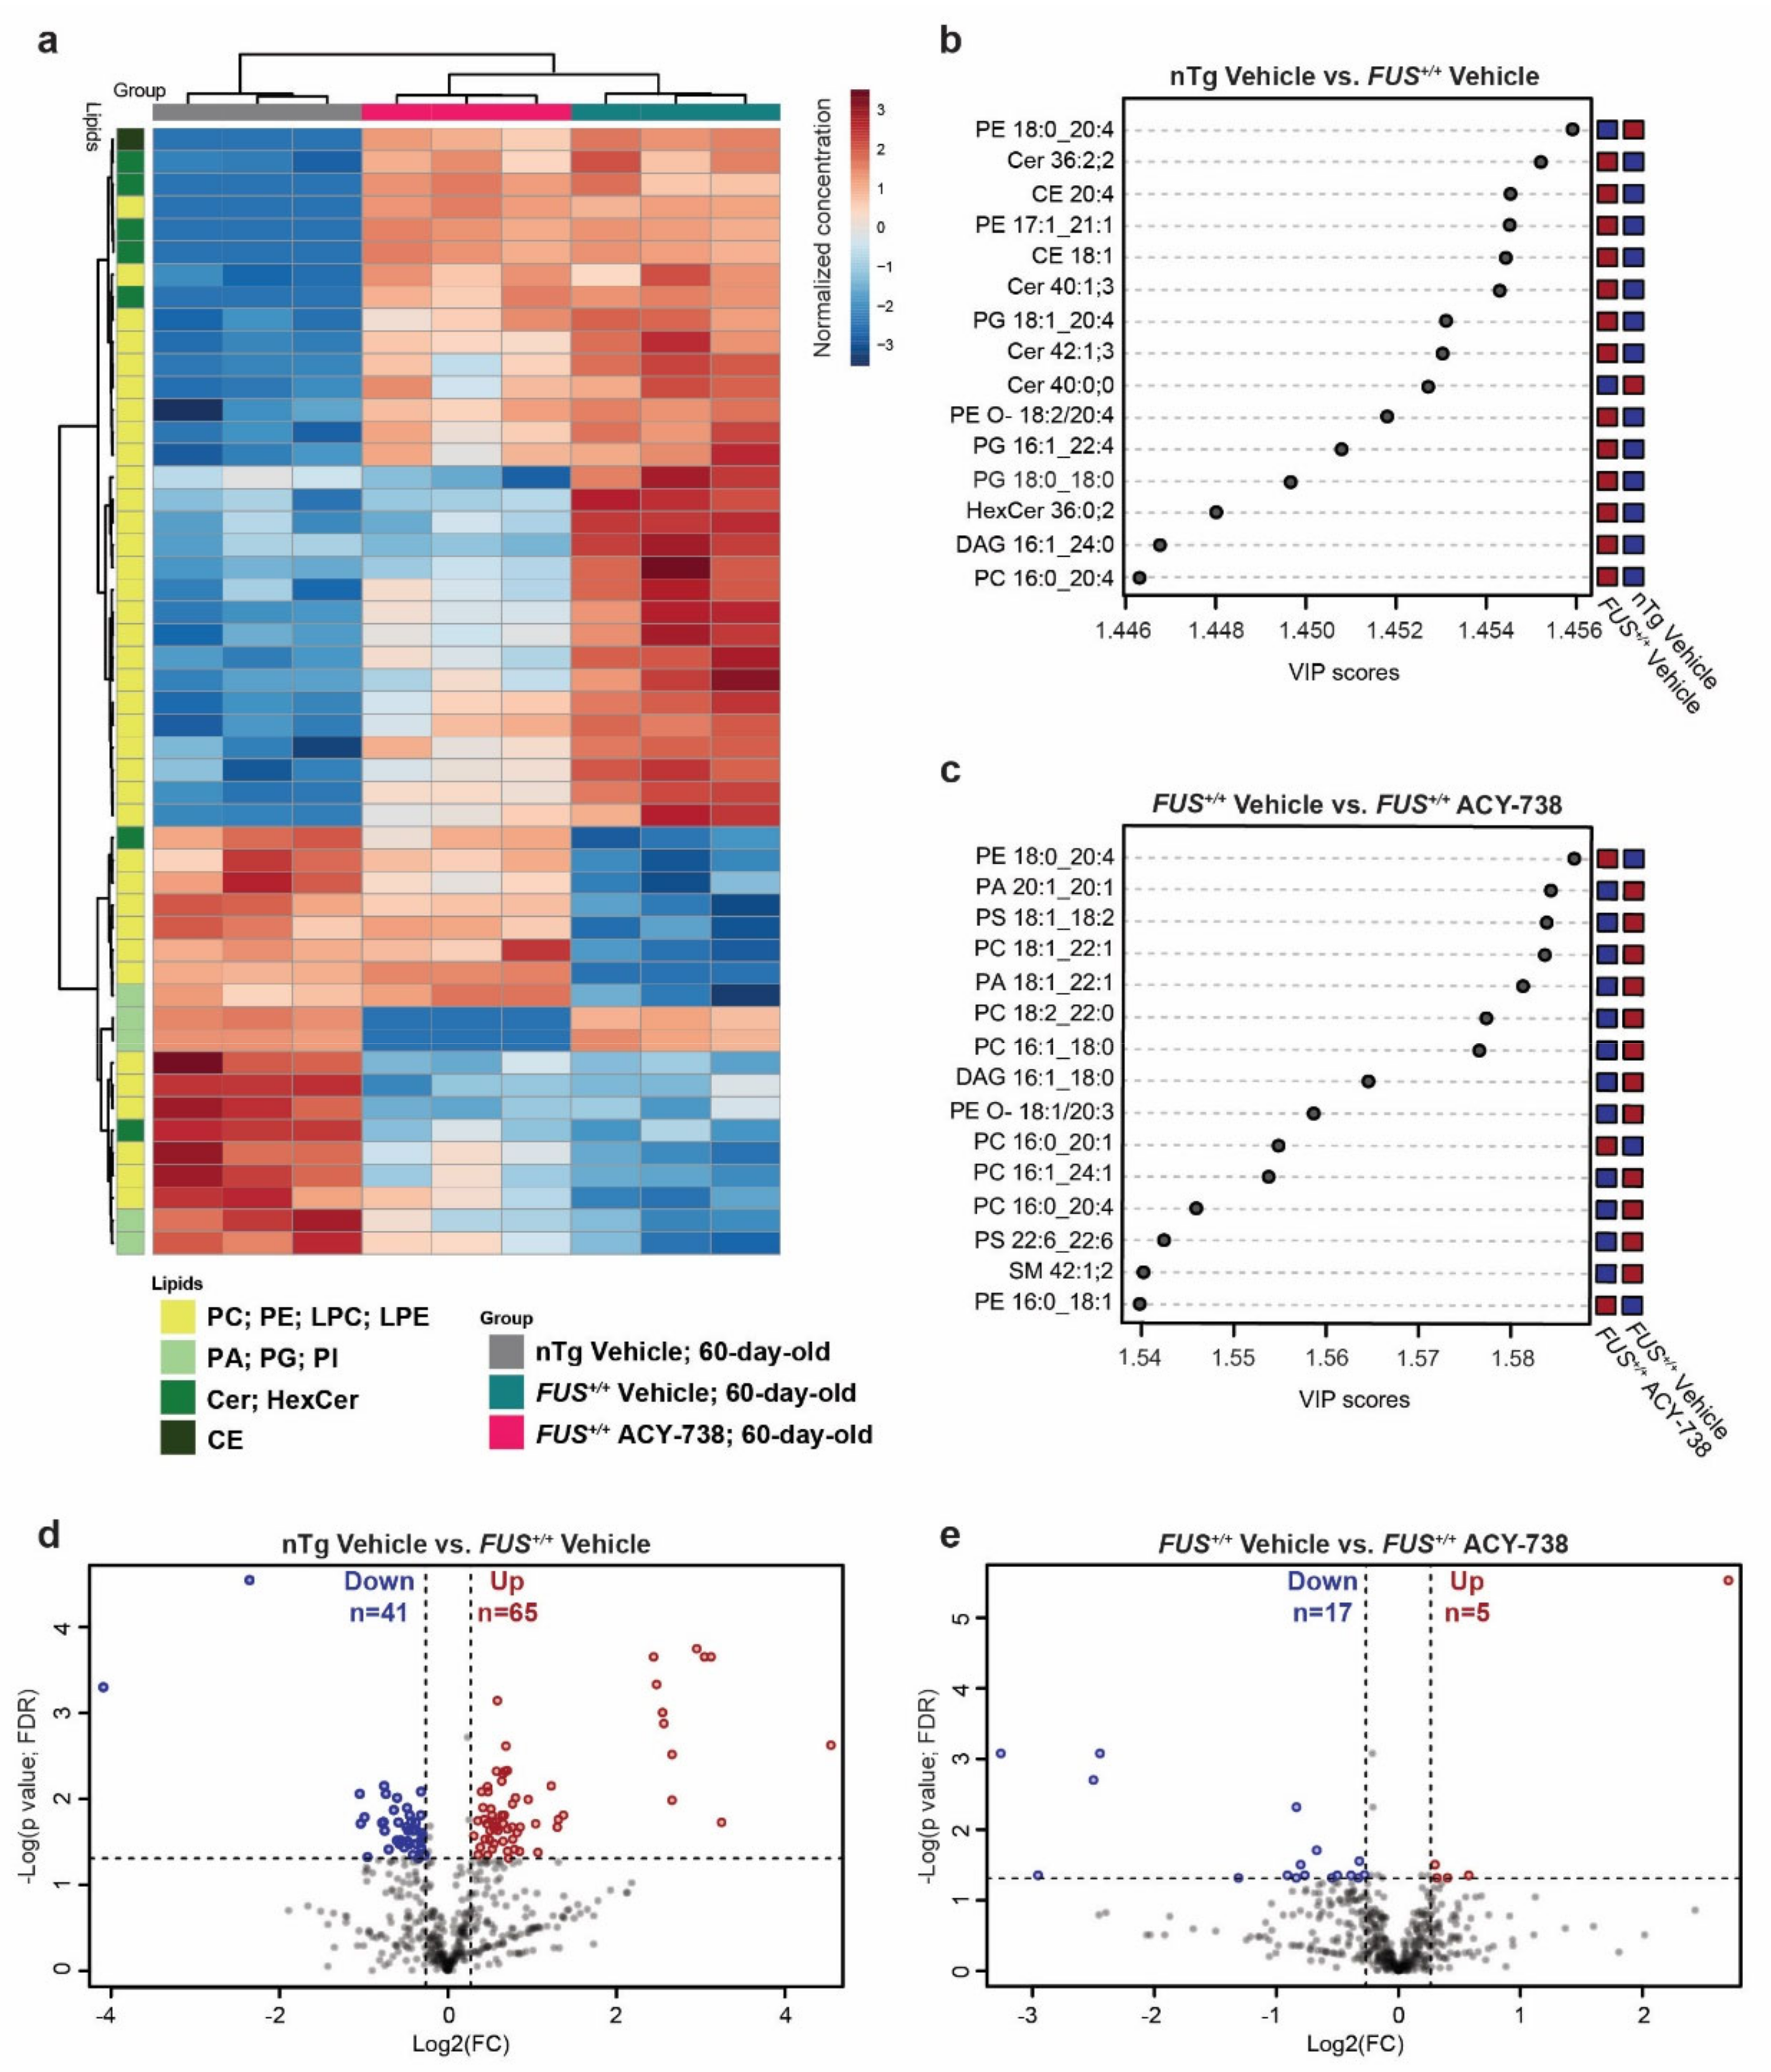
2.1. Lipidomic Analysis Reveals ALS Pathological Signature in the Spinal Cord of Symptomatic FUS Mice
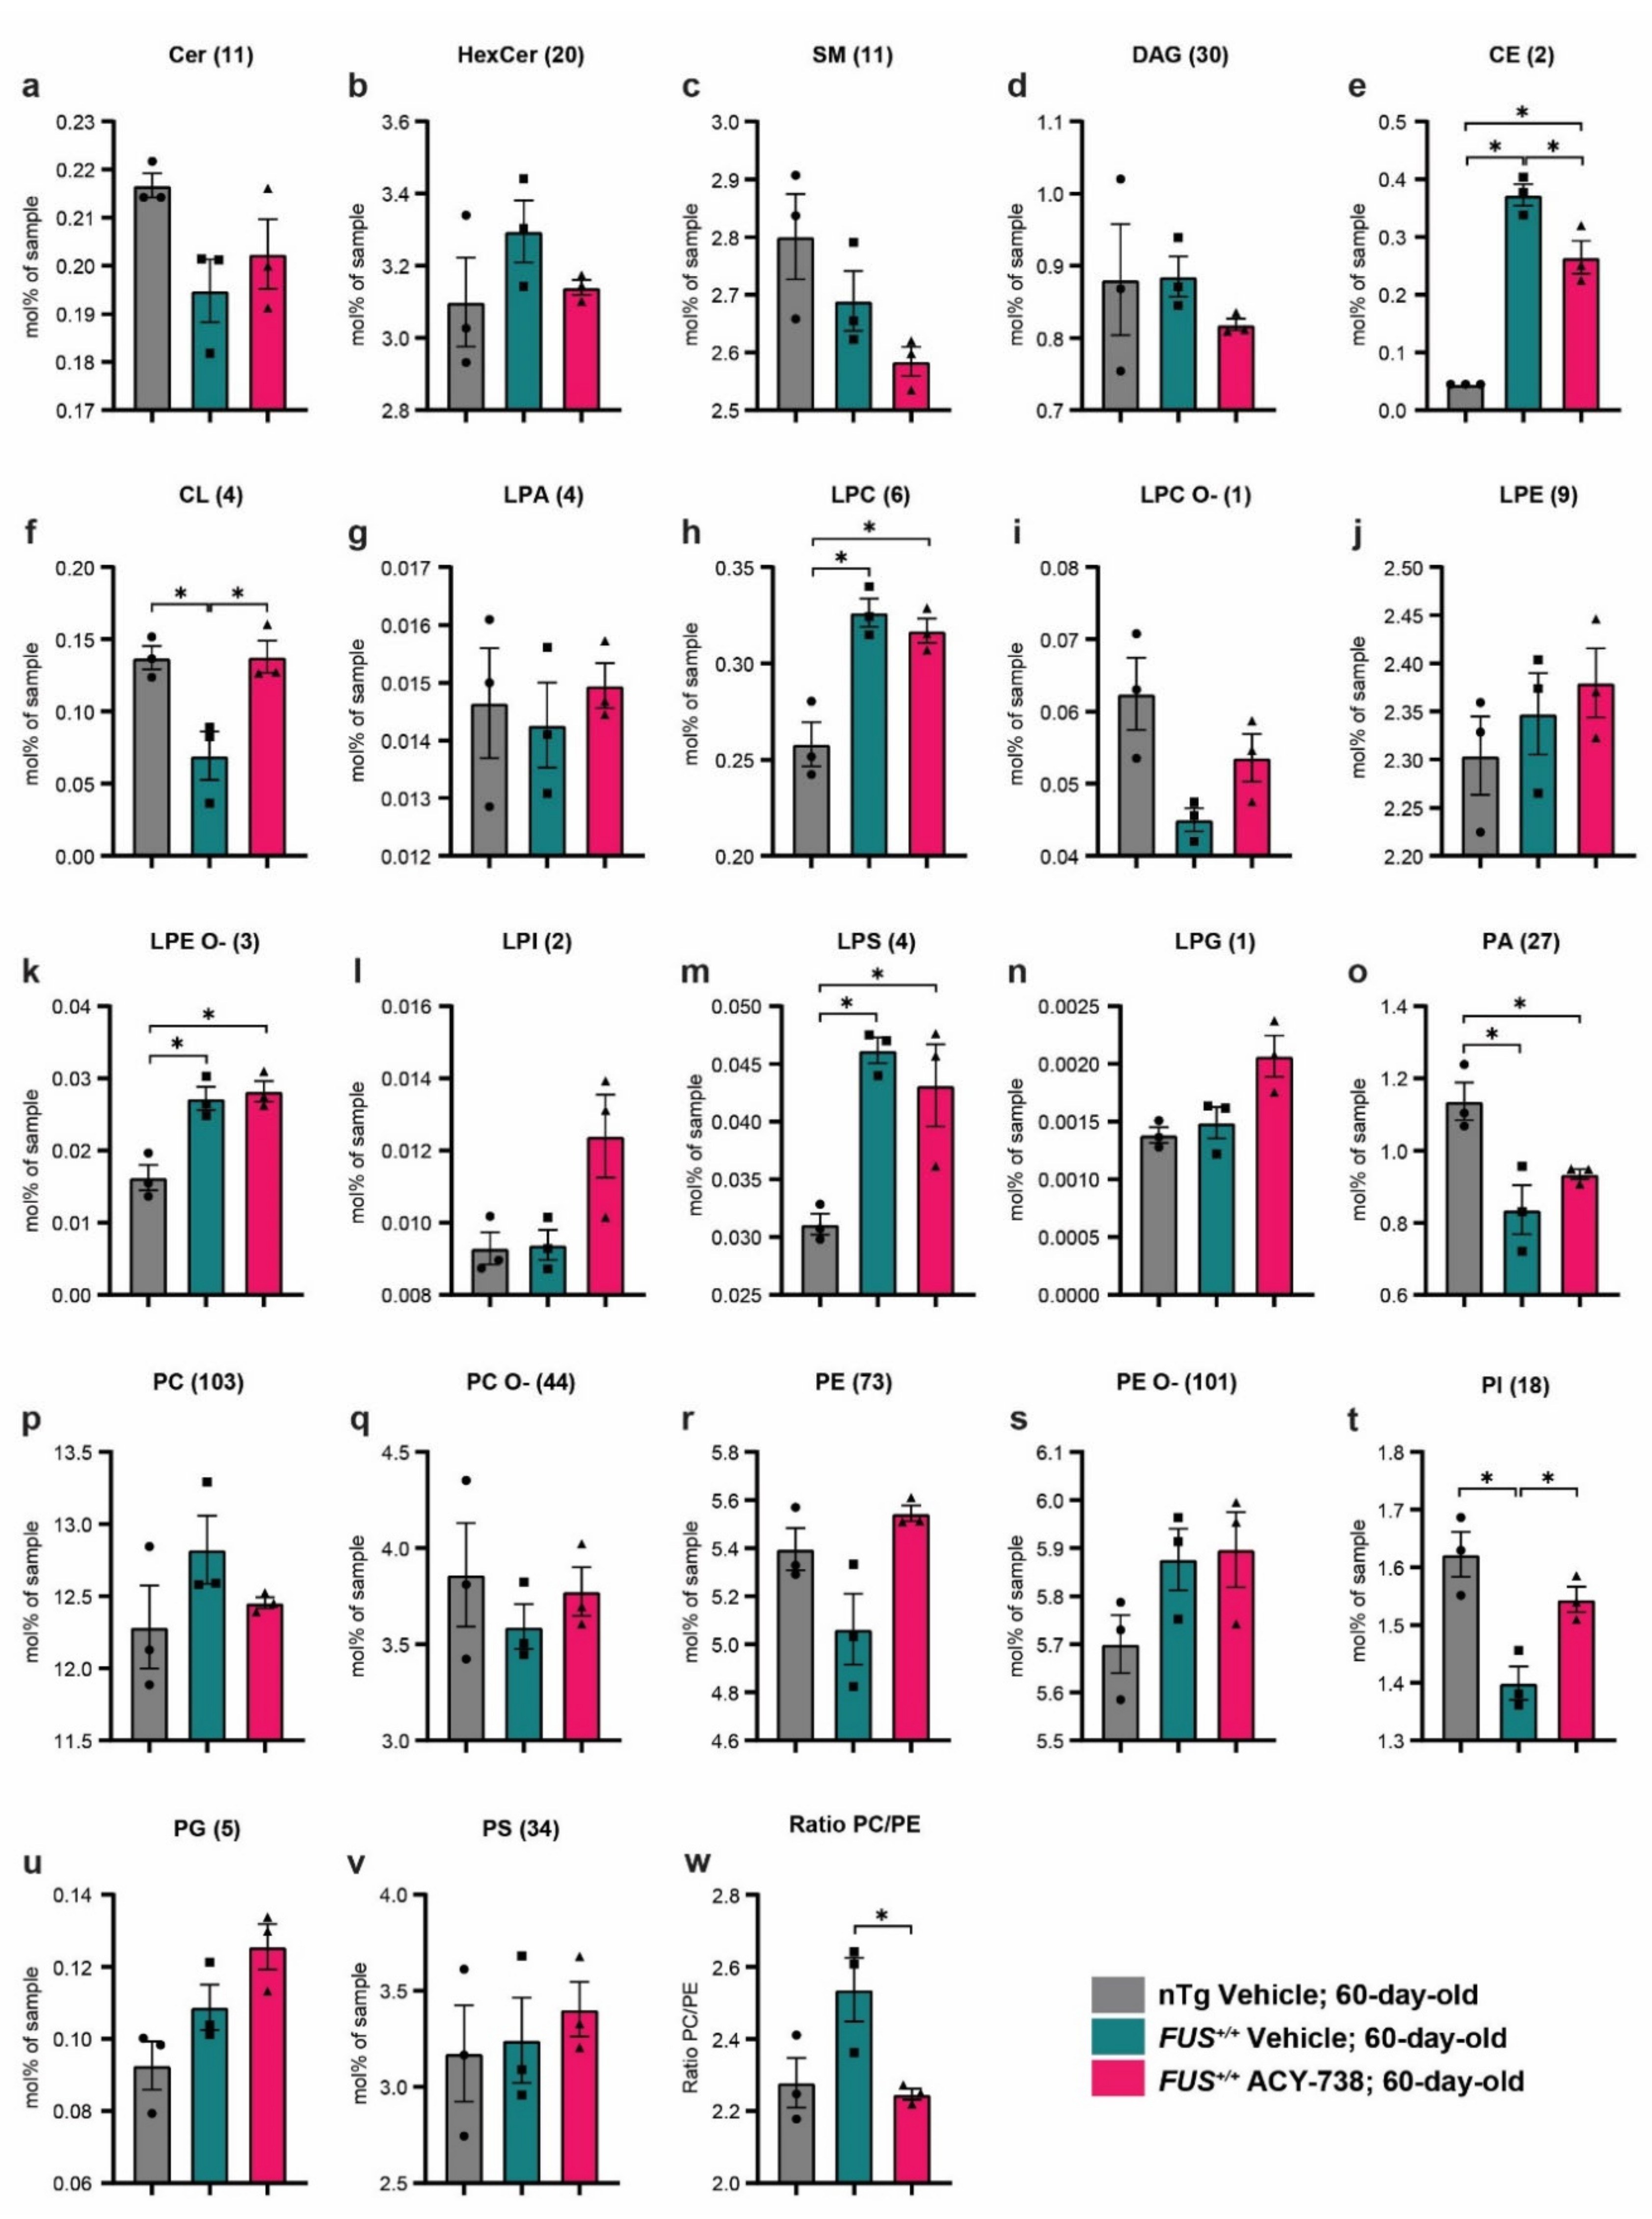
2.2. HDAC Inhibition Mitigates Lipid Metabolism Alterations in the Spinal Cord of Symptomatic FUS Mice
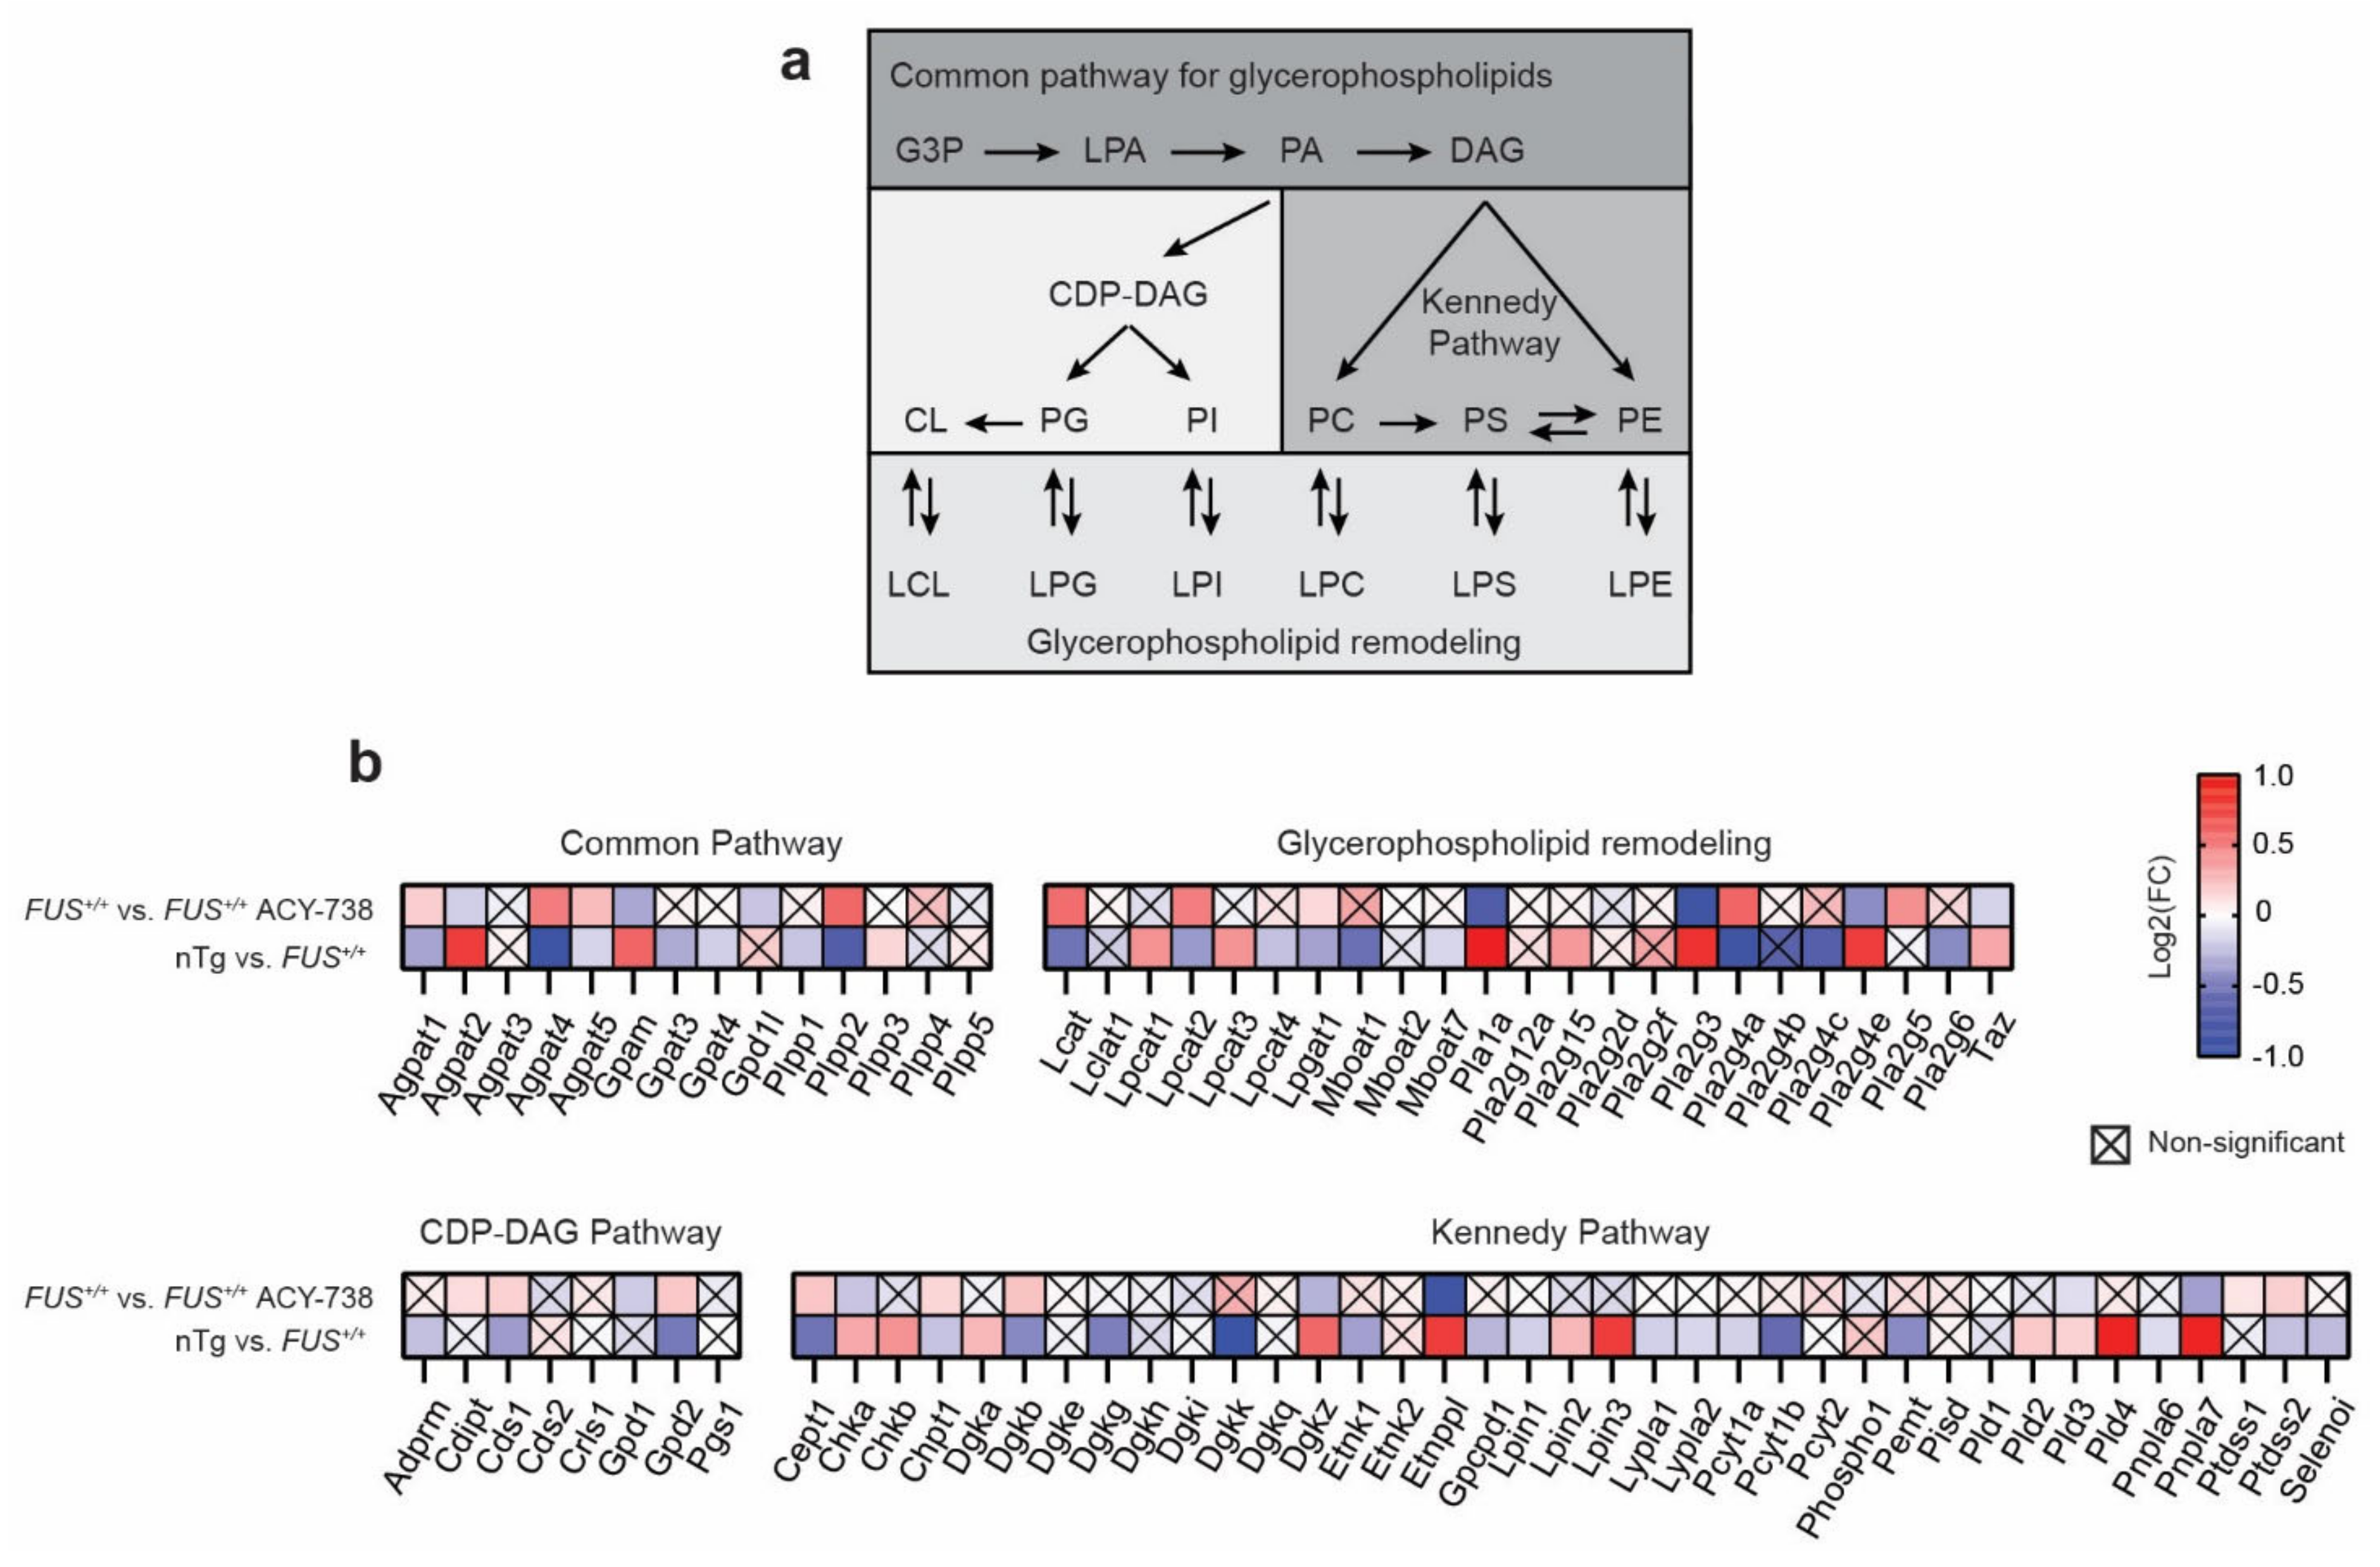
2.3. HDAC Inhibition Targets Specific Individual Glycerophospholipid Species
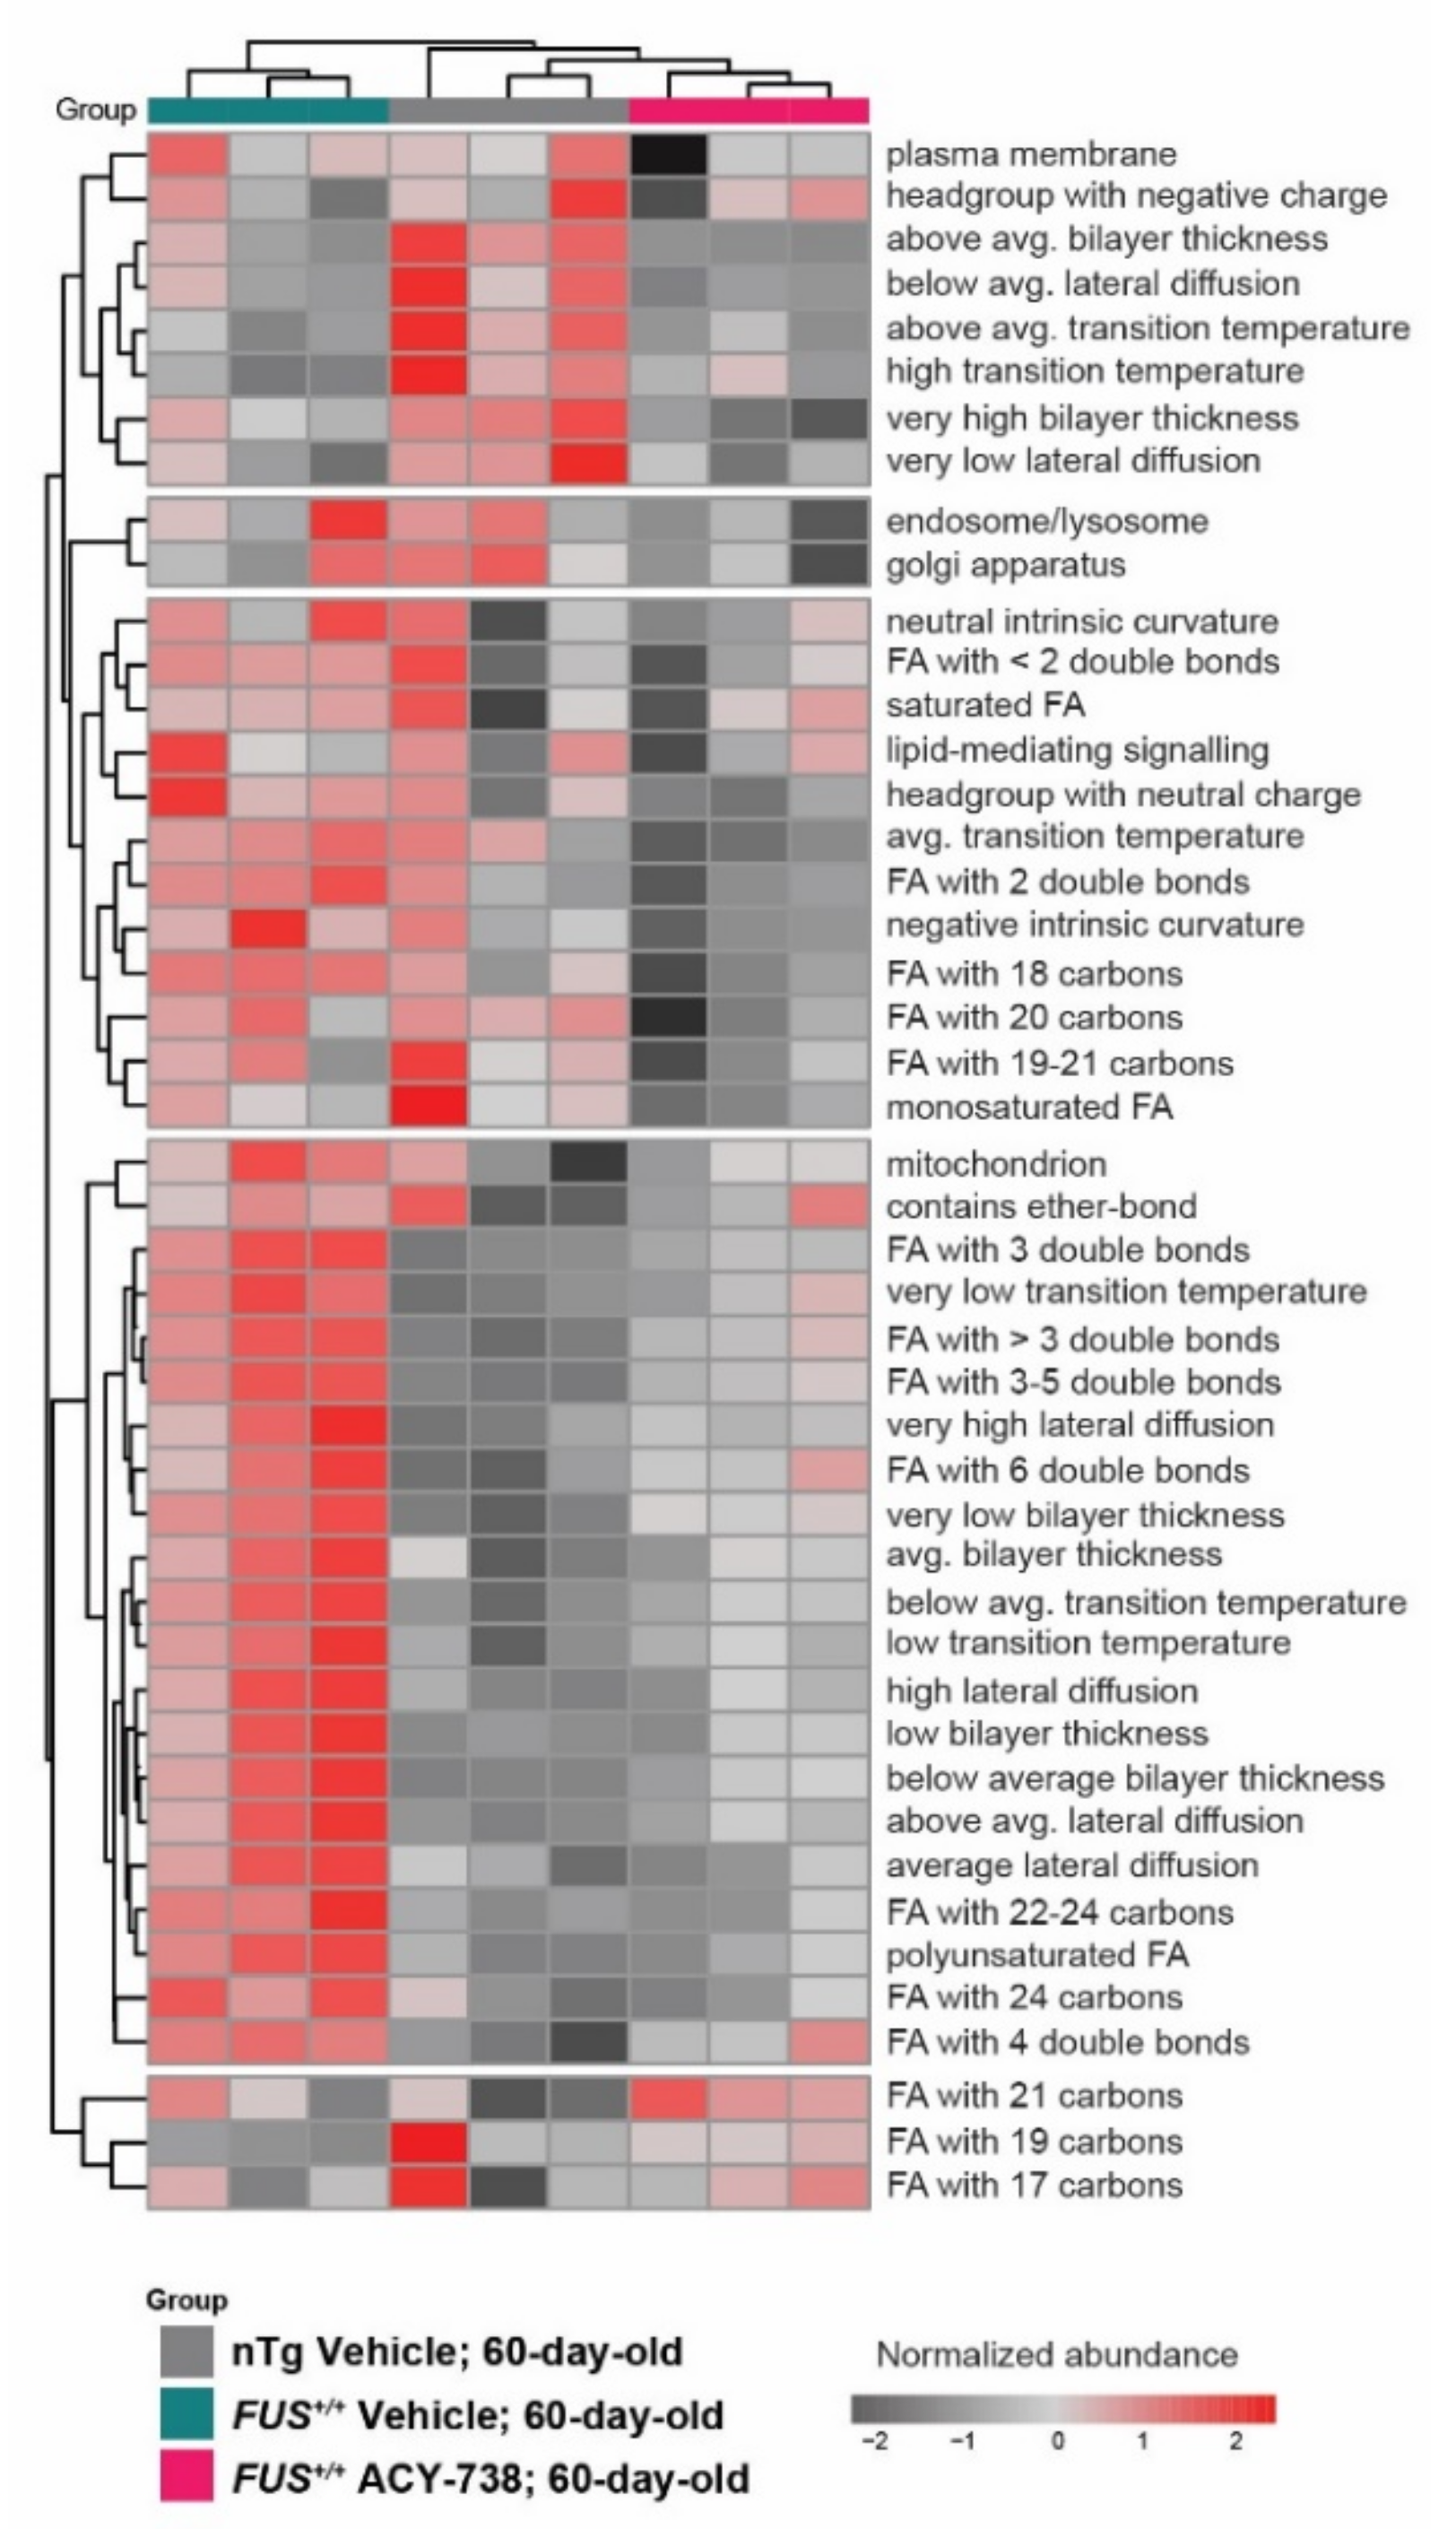
2.4. HDAC Inhibition Partially Reinstates Fatty Acid Composition and Lipid Functional Properties
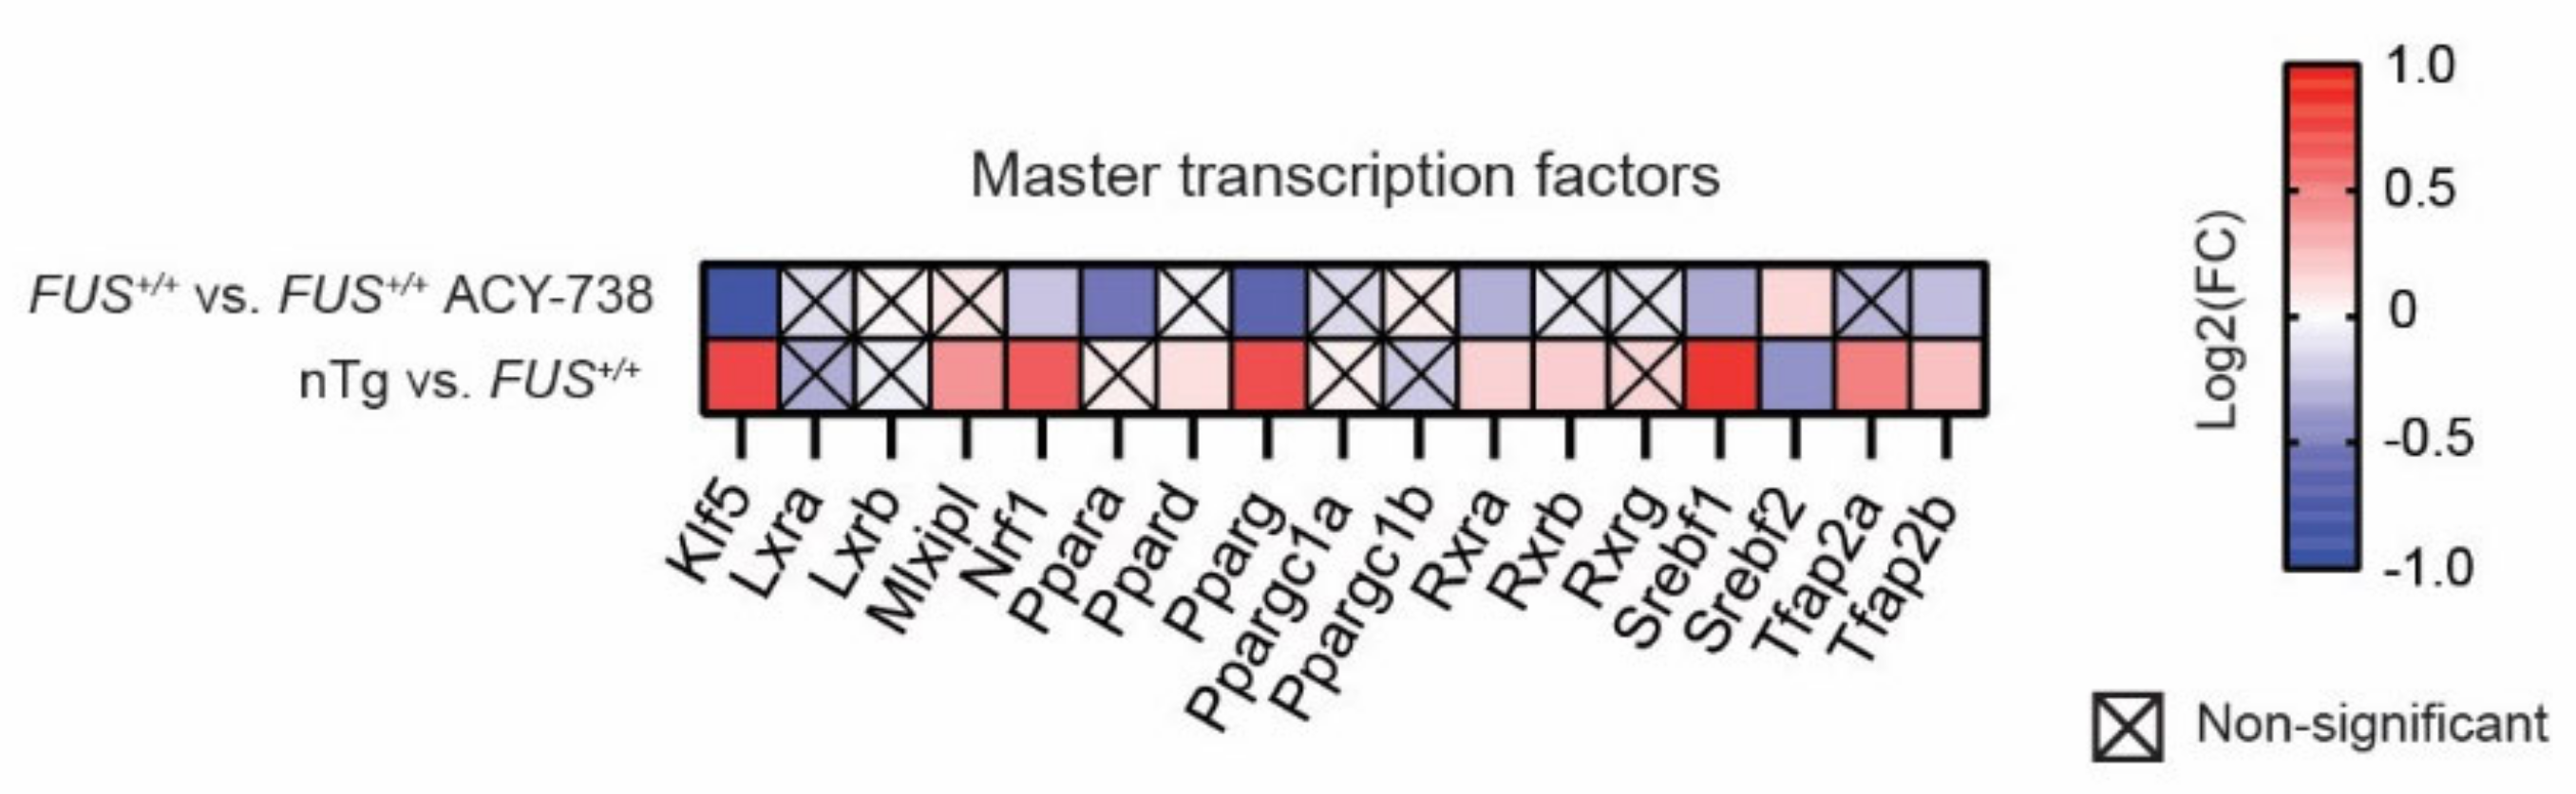
2.5. HDAC Inhibition Restores Transcriptional Alterations of Lipid Metabolism Master Transcription Factors and Genes Linked to Glycerophospholipids Synthesis and Remodeling
3. Discussion
4. Materials and Methods
4.1. Animals
4.2. Lipid Nomenclature
4.3. Lipid Extraction for Mass Spectrometry Lipidomics
4.4. MS Data Acquisition
4.5. Lipidomic Data Processing
4.6. Statistical Analysis of Lipidomic Data
4.7. Transcriptomic Data Acquisition and Statistical Analysis
Supplementary Materials
Author Contributions
Funding
Institutional Review Board Statement
Informed Consent Statement
Data Availability Statement
Acknowledgments
Conflicts of Interest
Abbreviations
| ALS | Amyotrophic lateral sclerosis |
| C9ORF72 | Chromosome 9 open reading frame 72 |
| CE | Cholesterol esters |
| Cer | Ceramide |
| CL | Cardiolipin |
| DAG | Diacylglycerol |
| ER | Endoplasmic reticulum |
| FA | Fatty acids |
| FC | Fold change |
| FUS | Fused in sarcoma |
| GP3 | Glycerol 3-phosphate |
| HCA | Hierarchical clustering analysis |
| HDAC | Histone deacetylase |
| HexCer | Hexocylceramide |
| LION | Lipid ontology |
| LPA | Lyso-phosphatidate |
| LPC/LPC O- | Lyso-phosphatidylcholine (-ether) |
| LPE/LPE O- | Lyso-phosphatidylethanolamine (-ether) |
| LPG | Lyso-phosphatidylglycerol |
| LPI | Lyso-phosphatidylinositol |
| LPS | Lyso-phosphatidylserine |
| MAMs | Mitochondria-associated ER membranes |
| nTg | Non-transgenic |
| PA | Phosphatidate |
| PCA | Principal component analysis |
| PC/PC O- | Phosphatidylcholine (-ether) |
| PE/PE O- | Phosphatidylethanolamine (-ether) |
| PG | Phosphatidylglycerol |
| PI | Phosphatidylinositol |
| PLS-DA | Partial least squares discriminant analysis |
| PrP | Prion protein promotor |
| PS | Phosphatidylserine |
| SEM | Standard error of the mean |
| SM | Sphingomyelin |
| SOD1 | Superoxide dismutase 1 |
| TAG | Triacylglycerol |
| TARDBP | TAR DNA binding protein 43 |
| VIP | Variable importance in projection |
References
- Masrori, P.; Van Damme, P. Amyotrophic lateral sclerosis: A clinical review. Eur. J. Neurol. 2020, 27, 1918–1929. [Google Scholar] [CrossRef]
- Bennett, S.A.; Tanaz, R.; Cobos, S.N.; Torrente, M.P. Epigenetics in amyotrophic lateral sclerosis: A role for histone post-translational modifications in neurodegenerative disease. Transl. Res. 2019, 204, 19–30. [Google Scholar] [CrossRef]
- Paez-Colasante, X.; Figueroa-Romero, C.; Sakowski, S.A.; Goutman, S.A.; Feldman, E.L. Amyotrophic lateral sclerosis: Mechanisms and therapeutics in the epigenomic era. Nat. Rev. Neurol. 2015, 11, 266–279. [Google Scholar] [CrossRef]
- Verdone, L.; Caserta, M.; Mauro, E.D. Role of histone acetylation in the control of gene expression. Biochem. Cell Biol. 2005, 83, 344–353. [Google Scholar] [CrossRef]
- Bruneteau, G.; Simonet, T.; Bauche, S.; Mandjee, N.; Malfatti, E.; Girard, E.; Tanguy, M.L.; Behin, A.; Khiami, F.; Sariali, E.; et al. Muscle histone deacetylase 4 upregulation in amyotrophic lateral sclerosis: Potential role in reinnervation ability and disease progression. Brain 2013, 136, 2359–2368. [Google Scholar] [CrossRef]
- Rossaert, E.; Pollari, E.; Jaspers, T.; Van Helleputte, L.; Jarpe, M.; Van Damme, P.; De Bock, K.; Moisse, M.; Van Den Bosch, L. Restoration of histone acetylation ameliorates disease and metabolic abnormalities in a FUS mouse model. Acta Neuropathol. Commun. 2019, 7, 107. [Google Scholar] [CrossRef]
- Rouaux, C.; Jokic, N.; Mbebi, C.; Boutillier, S.; Loeffler, J.P.; Boutillier, A.L. Critical loss of CBP/p300 histone acetylase activity by caspase-6 during neurodegeneration. EMBO J. 2003, 22, 6537–6549. [Google Scholar] [CrossRef] [Green Version]
- Valle, C.; Salvatori, I.; Gerbino, V.; Rossi, S.; Palamiuc, L.; René, F.; Carrì, M. Tissue-specific deregulation of selected HDACs characterizes ALS progression in mouse models: Pharmacological characterization of SIRT1 and SIRT2 pathways. Cell Death Dis. 2014, 5, e1296. [Google Scholar] [CrossRef] [Green Version]
- Sanna, S.; Esposito, S.; Masala, A.; Sini, P.; Nieddu, G.; Galioto, M.; Fais, M.; Iaccarino, C.; Cestra, G.; Crosio, C. HDAC1 inhibition ameliorates TDP-43-induced cell death in vitro and in vivo. Cell Death Dis. 2020, 11, 369. [Google Scholar] [CrossRef]
- Janssen, C.; Schmalbach, S.; Boeselt, S.; Sarlette, A.; Dengler, R.; Petri, S. Differential Histone Deacetylase mRNA Expression Patterns in Amyotrophic Lateral Sclerosis. J. Neuropathol. Exp. Neurol. 2010, 69, 573–581. [Google Scholar] [CrossRef]
- Klingl, Y.E.; Pakravan, D.; Van Den Bosch, L. Opportunities for histone deacetylase inhibition in amyotrophic lateral sclerosis. Br. J. Pharmacol. 2021, 178, 1353–1372. [Google Scholar] [CrossRef]
- Guo, W.; Naujock, M.; Fumagalli, L.; Vandoorne, T.; Baatsen, P.; Boon, R.; Ordovas, L.; Patel, A.; Welters, M.; Vanwelden, T.; et al. HDAC6 inhibition reverses axonal transport defects in motor neurons derived from FUS-ALS patients. Nat. Commun. 2017, 8, 861. [Google Scholar] [CrossRef]
- Dittlau, K.S.; Krasnow, E.N.; Fumagalli, L.; Vandoorne, T.; Baatsen, P.; Kerstens, A.; Giacomazzi, G.; Pavie, B.; Rossaert, E.; Beckers, J.; et al. Human motor units in microfluidic devices are impaired by FUS mutations and improved by HDAC6 inhibition. Stem Cell Rep. 2021, 16, 2213–2227. [Google Scholar] [CrossRef]
- Taes, I.; Timmers, M.; Hersmus, N.; Bento-Abreu, A.; Van Den Bosch, L.; Van Damme, P.; Auwerx, J.; Robberecht, W. Hdac6 deletion delays disease progression in the SOD1G93A mouse model of ALS. Hum. Mol. Genet. 2013, 22, 1783–1790. [Google Scholar] [CrossRef]
- Pigna, E.; Simonazzi, E.; Sanna, K.; Bernadzki, K.M.; Proszynski, T.; Heil, C.; Palacios, D.; Adamo, S.; Moresi, V. Histone deacetylase 4 protects from denervation and skeletal muscle atrophy in a murine model of amyotrophic lateral sclerosis. EBioMedicine 2019, 40, 717–732. [Google Scholar] [CrossRef] [Green Version]
- Kuta, R.; Larochelle, N.; Fernandez, M.; Pal, A.; Minotti, S.; Tibshirani, M.; St Louis, K.; Gentil, B.J.; Nalbantoglu, J.N.; Hermann, A.; et al. Depending on the stress, histone deacetylase inhibitors act as heat shock protein co-inducers in motor neurons and potentiate arimoclomol, exerting neuroprotection through multiple mechanisms in ALS models. Cell Stress Chaperones 2020, 25, 173–191. [Google Scholar] [CrossRef] [Green Version]
- Fazal, R.; Boeynaems, S.; Swijsen, A.; De Decker, M.; Fumagalli, L.; Moisse, M.; Vanneste, J.; Guo, W.; Boon, R.; Vercruysse, T. HDAC6 inhibition restores TDP-43 pathology and axonal transport defects in human motor neurons with TARDBP mutations. EMBO J. 2021, 40, e106177. [Google Scholar] [CrossRef]
- Benoy, V.; Van den Berghe, P.; Jarpe, M.; Van Damme, P.; Robberecht, W.; Van Den Bosch, L. Development of Improved HDAC6 Inhibitors as Pharmacological Therapy for Axonal Charcot-Marie-Tooth Disease. Neurotherapeutics 2017, 14, 417–428. [Google Scholar] [CrossRef] [Green Version]
- Jochems, J.; Boulden, J.; Lee, B.G.; Blendy, J.A.; Jarpe, M.; Mazitschek, R.; Van Duzer, J.H.; Jones, S.; Berton, O. Antidepressant-like properties of novel HDAC6-selective inhibitors with improved brain bioavailability. Neuropsychopharmacology 2014, 39, 389–400. [Google Scholar] [CrossRef]
- Majid, T.; Griffin, D.; Criss, Z., 2nd; Jarpe, M.; Pautler, R.G. Pharmocologic treatment with histone deacetylase 6 inhibitor (ACY-738) recovers Alzheimer’s disease phenotype in amyloid precursor protein/presenilin 1 (APP/PS1) mice. Alzheimers Dement. 2015, 1, 170–181. [Google Scholar] [CrossRef] [Green Version]
- Mitchell, J.C.; McGoldrick, P.; Vance, C.; Hortobagyi, T.; Sreedharan, J.; Rogelj, B.; Tudor, E.L.; Smith, B.N.; Klasen, C.; Miller, C.C.; et al. Overexpression of human wild-type FUS causes progressive motor neuron degeneration in an age- and dose-dependent fashion. Acta Neuropathol. 2013, 125, 273–288. [Google Scholar] [CrossRef] [Green Version]
- Fernandez-Beltran, L.C.; Godoy-Corchuelo, J.M.; Losa-Fontangordo, M.; Williams, D.; Matias-Guiu, J.; Corrochano, S. A Transcriptomic Meta-Analysis Shows Lipid Metabolism Dysregulation as an Early Pathological Mechanism in the Spinal Cord of SOD1 Mice. Int. J. Mol. Sci. 2021, 22, 9553. [Google Scholar] [CrossRef]
- Johnson, J.O.; Chia, R.; Miller, D.E.; Li, R.; Kumaran, R.; Abramzon, Y.; Alahmady, N.; Renton, A.E.; Topp, S.D.; Gibbs, J.R.; et al. Association of Variants in the SPTLC1 Gene with Juvenile Amyotrophic Lateral Sclerosis. JAMA Neurol. 2021, 78, 1236–1248. [Google Scholar]
- Sol, J.; Jove, M.; Povedano, M.; Sproviero, W.; Dominguez, R.; Pinol-Ripoll, G.; Romero-Guevara, R.; Hye, A.; Al-Chalabi, A.; Torres, P.; et al. Lipidomic traits of plasma and cerebrospinal fluid in amyotrophic lateral sclerosis correlate with disease progression. Brain Commun. 2021, 3, fcab143. [Google Scholar] [CrossRef]
- Tracey, T.J.; Kirk, S.E.; Steyn, F.J.; Ngo, S.T. The role of lipids in the central nervous system and their pathological implications in amyotrophic lateral sclerosis. Semin. Cell Dev. Biol. 2020, 112, 69–81. [Google Scholar] [CrossRef]
- Henriques, A.; Croixmarie, V.; Bouscary, A.; Mosbach, A.; Keime, C.; Boursier-Neyret, C.; Walter, B.; Spedding, M.; Loeffler, J.P. Sphingolipid Metabolism Is Dysregulated at Transcriptomic and Metabolic Levels in the Spinal Cord of an Animal Model of Amyotrophic Lateral Sclerosis. Front. Mol. Neurosci. 2017, 10, 433. [Google Scholar] [CrossRef]
- Blasco, H.; Veyrat-Durebex, C.; Bocca, C.; Patin, F.; Vourc’h, P.; Kouassi Nzoughet, J.; Lenaers, G.; Andres, C.R.; Simard, G.; Corcia, P.; et al. Lipidomics Reveals Cerebrospinal-Fluid Signatures of ALS. Sci. Rep. 2017, 7, 17652. [Google Scholar] [CrossRef]
- Chaves-Filho, A.B.; Pinto, I.F.D.; Dantas, L.S.; Xavier, A.M.; Inague, A.; Faria, R.L.; Medeiros, M.H.G.; Glezer, I.; Yoshinaga, M.Y.; Miyamoto, S. Alterations in lipid metabolism of spinal cord linked to amyotrophic lateral sclerosis. Sci. Rep. 2019, 9, 11642. [Google Scholar] [CrossRef] [Green Version]
- Veyrat-Durebex, C.; Bris, C.; Codron, P.; Bocca, C.; Chupin, S.; Corcia, P.; Vourc’h, P.; Hergesheimer, R.; Cassereau, J.; Funalot, B.; et al. Metabo-lipidomics of Fibroblasts and Mitochondrial-Endoplasmic Reticulum Extracts from ALS Patients Shows Alterations in Purine, Pyrimidine, Energetic, and Phospholipid Metabolisms. Mol. Neurobiol. 2019, 56, 5780–5791. [Google Scholar] [CrossRef]
- Dodge, J.C.; Jensen, E.H.; Yu, J.; Sardi, S.P.; Bialas, A.R.; Taksir, T.V.; Bangari, D.S.; Shihabuddin, L.S. Neutral Lipid Cacostasis Contributes to Disease Pathogenesis in Amyotrophic Lateral Sclerosis. J. Neurosci. 2020, 40, 9137–9147. [Google Scholar] [CrossRef]
- Dodge, J.C.; Treleaven, C.M.; Pacheco, J.; Cooper, S.; Bao, C.; Abraham, M.; Cromwell, M.; Sardi, S.P.; Chuang, W.L.; Sidman, R.L.; et al. Glycosphingolipids are modulators of disease pathogenesis in amyotrophic lateral sclerosis. Proc. Natl. Acad. Sci. USA 2015, 112, 8100–8105. [Google Scholar] [CrossRef] [Green Version]
- Henriques, A.; Croixmarie, V.; Priestman, D.A.; Rosenbohm, A.; Dirrig-Grosch, S.; D’Ambra, E.; Huebecker, M.; Hussain, G.; Boursier-Neyret, C.; Echaniz-Laguna, A.; et al. Amyotrophic lateral sclerosis and denervation alter sphingolipids and up-regulate glucosylceramide synthase. Hum. Mol. Genet. 2015, 24, 7390–7405. [Google Scholar] [CrossRef] [Green Version]
- Marin, B.; Desport, J.C.; Kajeu, P.; Jesus, P.; Nicolaud, B.; Nicol, M.; Preux, P.M.; Couratier, P. Alteration of nutritional status at diagnosis is a prognostic factor for survival of amyotrophic lateral sclerosis patients. J. Neurol. Neurosurg. Psychiatry 2011, 82, 628–634. [Google Scholar] [CrossRef] [PubMed] [Green Version]
- Lindauer, E.; Dupuis, L.; Muller, H.P.; Neumann, H.; Ludolph, A.C.; Kassubek, J. Adipose Tissue Distribution Predicts Survival in Amyotrophic Lateral Sclerosis. PLoS ONE 2013, 8, e67783. [Google Scholar] [CrossRef] [PubMed]
- Dupuis, L.; Corcia, P.; Fergani, A.; De Aguilar, J.-L.G.; Bonnefont-Rousselot, D.; Bittar, R.; Seilhean, D.; Hauw, J.-J.; Lacomblez, L.; Loeffler, J.-P. Dyslipidemia is a protective factor in amyotrophic lateral sclerosis. Neurology 2008, 70, 1004–1009. [Google Scholar] [CrossRef]
- Paganoni, S.; Deng, J.; Jaffa, M.; Cudkowicz, M.E.; Wills, A.M. Body mass index, not dyslipidemia, is an independent predictor of survival in amyotrophic lateral sclerosis. Muscle Nerve 2011, 44, 20–24. [Google Scholar] [CrossRef] [Green Version]
- Bouscary, A.; Quessada, C.; Mosbach, A.; Callizot, N.; Spedding, M.; Loeffler, J.P.; Henriques, A. Ambroxol Hydrochloride Improves Motor Functions and Extends Survival in a Mouse Model of Familial Amyotrophic Lateral Sclerosis. Front. Pharm. 2019, 10, 883. [Google Scholar] [CrossRef] [Green Version]
- Van der Veen, J.N.; Kennelly, J.P.; Wan, S.; Vance, J.E.; Vance, D.E.; Jacobs, R.L. The critical role of phosphatidylcholine and phosphatidylethanolamine metabolism in health and disease. Biochim. Biophys. Acta Biomembr. 2017, 1859, 1558–1572. [Google Scholar] [CrossRef]
- Molenaar, M.R.; Jeucken, A.; Wassenaar, T.A.; van de Lest, C.H.; Brouwers, J.F.; Helms, J.B. LION/web: A web-based ontology enrichment tool for lipidomic data analysis. GigaScience 2019, 8, giz061. [Google Scholar] [CrossRef] [Green Version]
- Desvergne, B.; Michalik, L.; Wahli, W. Transcriptional regulation of metabolism. Physiol. Rev. 2006, 86, 465–514. [Google Scholar] [CrossRef]
- Bravo-Ruiz, I.; Medina, M.A.; Martinez-Poveda, B. From Food to Genes: Transcriptional Regulation of Metabolism by Lipids and Carbohydrates. Nutrients 2021, 13, 1513. [Google Scholar] [CrossRef] [PubMed]
- Kanehisa, M.; Sato, Y.; Kawashima, M.; Furumichi, M.; Tanabe, M. KEGG as a reference resource for gene and protein annotation. Nucleic Acids Res. 2016, 44, D457–D462. [Google Scholar] [CrossRef] [PubMed] [Green Version]
- Cutler, R.G.; Pedersen, W.A.; Camandola, S.; Rothstein, J.D.; Mattson, M.P. Evidence that accumulation of ceramides and cholesterol esters mediates oxidative stress-induced death of motor neurons in amyotrophic lateral sclerosis. Ann. Neurol. 2002, 52, 448–457. [Google Scholar] [CrossRef]
- Fu, Y.; Rusznak, Z.; Herculano-Houzel, S.; Watson, C.; Paxinos, G. Cellular composition characterizing postnatal development and maturation of the mouse brain and spinal cord. Brain Struct. Funct. 2013, 218, 1337–1354. [Google Scholar] [CrossRef] [Green Version]
- McCallum-Loudeac, J.; Anderson, G.; Wilson, M.J. Age and Sex-Related Changes to Gene Expression in the Mouse Spinal Cord. J. Mol. Neurosci. 2019, 69, 419–432. [Google Scholar] [CrossRef]
- Dodge, J.C. Lipid Involvement in Neurodegenerative Diseases of the Motor System: Insights from Lysosomal Storage Diseases. Front. Mol. Neurosci. 2017, 10, 356. [Google Scholar] [CrossRef] [Green Version]
- Hishikawa, D.; Hashidate, T.; Shimizu, T.; Shindou, H. Diversity and function of membrane glycerophospholipids generated by the remodeling pathway in mammalian cells. J. Lipid Res. 2014, 55, 799–807. [Google Scholar] [CrossRef] [Green Version]
- Tan, S.T.; Ramesh, T.; Toh, X.R.; Nguyen, L.N. Emerging roles of lysophospholipids in health and disease. Prog. Lipid Res. 2020, 80, 101068. [Google Scholar] [CrossRef]
- Falabella, M.; Vernon, H.J.; Hanna, M.G.; Claypool, S.M.; Pitceathly, R.D.S. Cardiolipin, Mitochondria, and Neurological Disease. Trends Endocrinol. Metab. 2021, 32, 224–237. [Google Scholar] [CrossRef] [PubMed]
- Vance, J.E. MAM (mitochondria-associated membranes) in mammalian cells: Lipids and beyond. Biochim. Biophys. Acta 2014, 1841, 595–609. [Google Scholar] [CrossRef]
- Giorgi, C.; Missiroli, S.; Patergnani, S.; Duszynski, J.; Wieckowski, M.R.; Pinton, P. Mitochondria-associated membranes: Composition, molecular mechanisms, and physiopathological implications. Antioxid. Redox Signal. 2015, 22, 995–1019. [Google Scholar] [CrossRef] [PubMed]
- Parakh, S.; Atkin, J.D. The Mitochondrial-associated ER membrane (MAM) compartment and its dysregulation in Amyotrophic Lateral Sclerosis (ALS). Semin. Cell Dev. Biol. 2021, 112, 105–113. [Google Scholar] [CrossRef]
- Stoica, R.; De Vos, K.J.; Paillusson, S.; Mueller, S.; Sancho, R.M.; Lau, K.F.; Vizcay-Barrena, G.; Lin, W.L.; Xu, Y.F.; Lewis, J.; et al. ER-mitochondria associations are regulated by the VAPB-PTPIP51 interaction and are disrupted by ALS/FTD-associated TDP-43. Nat. Commun. 2014, 5, 3996. [Google Scholar] [CrossRef] [PubMed] [Green Version]
- Watanabe, S.; Ilieva, H.; Tamada, H.; Nomura, H.; Komine, O.; Endo, F.; Jin, S.; Mancias, P.; Kiyama, H.; Yamanaka, K. Mitochondria-associated membrane collapse is a common pathomechanism in SIGMAR1- and SOD1-linked ALS. EMBO Mol. Med. 2016, 8, 1421–1437. [Google Scholar] [CrossRef]
- Bernard-Marissal, N.; Chrast, R.; Schneider, B.L. Endoplasmic reticulum and mitochondria in diseases of motor and sensory neurons: A broken relationship? Cell Death Dis. 2018, 9, 333. [Google Scholar] [CrossRef] [PubMed]
- Stoica, R.; Paillusson, S.; Gomez-Suaga, P.; Mitchell, J.C.; Lau, D.H.; Gray, E.H.; Sancho, R.M.; Vizcay-Barrena, G.; De Vos, K.J.; Shaw, C.E.; et al. ALS/FTD-associated FUS activates GSK-3beta to disrupt the VAPB-PTPIP51 interaction and ER-mitochondria associations. EMBO Rep. 2016, 17, 1326–1342. [Google Scholar] [CrossRef]
- Guzman, K.M.; Brink, L.E.; Rodriguez-Bey, G.; Bodnar, R.J.; Kuang, L.; Xing, B.; Sullivan, M.; Park, H.J.; Koppes, E.; Zhu, H.; et al. Conditional depletion of Fus in oligodendrocytes leads to motor hyperactivity and increased myelin deposition associated with Akt and cholesterol activation. Glia 2020, 68, 2040–2056. [Google Scholar] [CrossRef]
- Ho, W.Y.; Chang, J.C.; Lim, K.; Cazenave-Gassiot, A.; Nguyen, A.T.; Foo, J.C.; Muralidharan, S.; Viera-Ortiz, A.; Ong, S.J.M.; Hor, J.H.; et al. TDP-43 mediates SREBF2-regulated gene expression required for oligodendrocyte myelination. J. Cell Biol. 2021, 220, e201910213. [Google Scholar] [CrossRef] [PubMed]
- Ramírez-Nuñez, O.; Jové, M.; Torres, P.; Sol, J.; Fontdevila, L.; Romero-Guevara, R.; Andrés-Benito, P.; Ayala, V.; Rossi, C.; Boada, J.; et al. Nuclear lipidome is altered in amyotrophic lateral sclerosis: A pilot study. J. Neurochem. 2021, 158, 482–499. [Google Scholar] [CrossRef]
- Marschallinger, J.; Iram, T.; Zardeneta, M.; Lee, S.E.; Lehallier, B.; Haney, M.S.; Pluvinage, J.V.; Mathur, V.; Hahn, O.; Morgens, D.W.; et al. Lipid-droplet-accumulating microglia represent a dysfunctional and proinflammatory state in the aging brain. Nat. Neurosci. 2020, 23, 194–208. [Google Scholar] [CrossRef] [PubMed]
- Li, Z.; Cheng, S.; Lin, Q.; Cao, W.; Yang, J.; Zhang, M.; Shen, A.; Zhang, W.; Xia, Y.; Ma, X.; et al. Single-cell lipidomics with high structural specificity by mass spectrometry. Nat. Commun. 2021, 12, 2869. [Google Scholar] [CrossRef] [PubMed]
- Tejido, C.; Pakravan, D.; Bosch, L.V.D. Potential Therapeutic Role of HDAC Inhibitors in FUS-ALS. Front. Mol. Neurosci. 2021, 14, 686995. [Google Scholar] [CrossRef]
- Wang, W.-Y.; Pan, L.; Su, S.C.; Quinn, E.J.; Sasaki, M.; Jimenez, J.C.; Mackenzie, I.R.; Huang, E.J.; Tsai, L.-H. Interaction of FUS and HDAC1 regulates DNA damage response and repair in neurons. Nat. Neurosci. 2013, 16, 1383–1391. [Google Scholar] [CrossRef] [PubMed]
- Tibshirani, M.; Zhao, B.; Gentil, B.J.; Minotti, S.; Marques, C.; Keith, J.; Rogaeva, E.; Zinman, L.; Rouaux, C.; Robertson, J.; et al. Dysregulation of chromatin remodelling complexes in amyotrophic lateral sclerosis. Hum. Mol. Genet. 2017, 26, 4142–4152. [Google Scholar] [CrossRef] [PubMed] [Green Version]
- Arenas, A.; Chen, J.; Kuang, L.; Barnett, K.R.; Kasarskis, E.J.; Gal, J.; Zhu, H. Lysine acetylation regulates the RNA binding, subcellular localization and inclusion formation of FUS. Hum. Mol. Genet. 2020, 29, 2684–2697. [Google Scholar] [CrossRef]
- Zou, C.; Synan, M.J.; Li, J.; Xiong, S.; Manni, M.L.; Liu, Y.; Chen, B.B.; Zhao, Y.; Shiva, S.; Tyurina, Y.Y.; et al. LPS impairs oxygen utilization in epithelia by triggering degradation of the mitochondrial enzyme Alcat1. J. Cell Sci. 2016, 129, 51–64. [Google Scholar] [CrossRef] [Green Version]
- Gong, Y.; Cao, R.; Ding, G.; Hong, S.; Zhou, W.; Lu, W.; Damle, M.; Fang, B.; Wang, C.C.; Qian, J.; et al. Integrated omics approaches to characterize a nuclear receptor corepressor-associated histone deacetylase in mouse skeletal muscle. Mol. Cell Endocrinol. 2018, 471, 22–32. [Google Scholar] [CrossRef]
- Wang, W.; Li, L.; Lin, W.L.; Dickson, D.W.; Petrucelli, L.; Zhang, T.; Wang, X. The ALS disease-associated mutant TDP-43 impairs mitochondrial dynamics and function in motor neurons. Hum. Mol. Genet. 2013, 22, 4706–4719. [Google Scholar] [CrossRef] [Green Version]
- Gonneaud, A.; Turgeon, N.; Jones, C.; Couture, C.; Levesque, D.; Boisvert, F.M.; Boudreau, F.; Asselin, C. HDAC1 and HDAC2 independently regulate common and specific intrinsic responses in murine enteroids. Sci. Rep. 2019, 9, 5363. [Google Scholar] [CrossRef]
- Galmozzi, A.; Mitro, N.; Ferrari, A.; Gers, E.; Gilardi, F.; Godio, C.; Cermenati, G.; Gualerzi, A.; Donetti, E.; Rotili, D.; et al. Inhibition of class I histone deacetylases unveils a mitochondrial signature and enhances oxidative metabolism in skeletal muscle and adipose tissue. Diabetes 2013, 62, 732–742. [Google Scholar] [CrossRef] [PubMed] [Green Version]
- Jiang, X.; Ye, X.; Guo, W.; Lu, H.; Gao, Z. Inhibition of HDAC3 promotes ligand-independent PPARgamma activation by protein acetylation. J. Mol. Endocrinol. 2014, 53, 191–200. [Google Scholar] [CrossRef] [Green Version]
- Knutson, S.K.; Chyla, B.J.; Amann, J.M.; Bhaskara, S.; Huppert, S.S.; Hiebert, S.W. Liver-specific deletion of histone deacetylase 3 disrupts metabolic transcriptional networks. EMBO J. 2008, 27, 1017–1028. [Google Scholar] [CrossRef] [Green Version]
- Hong, S.; Zhou, W.; Fang, B.; Lu, W.; Loro, E.; Damle, M.; Ding, G.; Jager, J.; Zhang, S.; Zhang, Y.; et al. Dissociation of muscle insulin sensitivity from exercise endurance in mice by HDAC3 depletion. Nat. Med. 2017, 23, 223–234. [Google Scholar] [CrossRef] [Green Version]
- Song, S.; Wen, Y.; Tong, H.; Loro, E.; Gong, Y.; Liu, J.; Hong, S.; Li, L.; Khurana, T.S.; Chu, M.; et al. The HDAC3 enzymatic activity regulates skeletal muscle fuel metabolism. J. Mol. Cell. Biol. 2019, 11, 133–143. [Google Scholar] [CrossRef] [Green Version]
- Palamiuc, L.; Schlagowski, A.; Ngo, S.T.; Vernay, A.; Dirrig-Grosch, S.; Henriques, A.; Boutillier, A.L.; Zoll, J.; Echaniz-Laguna, A.; Loeffler, J.P.; et al. A metabolic switch toward lipid use in glycolytic muscle is an early pathologic event in a mouse model of amyotrophic lateral sclerosis. EMBO Mol. Med. 2015, 7, 526–546. [Google Scholar] [CrossRef]
- Area-Gomez, E.; Larrea, D.; Yun, T.; Xu, Y.; Hupf, J.; Zandkarimi, F.; Chan, R.B.; Mitsumoto, H. Lipidomics study of plasma from patients suggest that ALS and PLS are part of a continuum of motor neuron disorders. Sci. Rep. 2021, 11, 13562. [Google Scholar] [CrossRef] [PubMed]
- Fahy, E.; Subramaniam, S.; Murphy, R.C.; Nishijima, M.; Raetz, C.R.; Shimizu, T.; Spener, F.; van Meer, G.; Wakelam, M.J.; Dennis, E.A. Update of the LIPID MAPS comprehensive classification system for lipids1. J. Lipid Res. 2009, 50, S9–S14. [Google Scholar] [CrossRef] [PubMed] [Green Version]
- Sampaio, J.L.; Gerl, M.J.; Klose, C.; Ejsing, C.S.; Beug, H.; Simons, K.; Shevchenko, A. Membrane lipidome of an epithelial cell line. Proc. Natl. Acad. Sci. USA 2011, 108, 1903–1907. [Google Scholar] [CrossRef] [Green Version]
- Ejsing, C.S.; Sampaio, J.L.; Surendranath, V.; Duchoslav, E.; Ekroos, K.; Klemm, R.W.; Simons, K.; Shevchenko, A. Global analysis of the yeast lipidome by quantitative shotgun mass spectrometry. Proc. Natl. Acad. Sci. USA 2009, 106, 2136–2141. [Google Scholar] [CrossRef] [Green Version]
- Surma, M.A.; Herzog, R.; Vasilj, A.; Klose, C.; Christinat, N.; Morin-Rivron, D.; Simons, K.; Masoodi, M.; Sampaio, J.L. An automated shotgun lipidomics platform for high throughput, comprehensive, and quantitative analysis of blood plasma intact lipids. Eur. J. Lipid Sci. Technol. 2015, 117, 1540–1549. [Google Scholar] [CrossRef] [PubMed] [Green Version]
- Herzog, R.; Schuhmann, K.; Schwudke, D.; Sampaio, J.L.; Bornstein, S.R.; Schroeder, M.; Shevchenko, A. LipidXplorer: A software for consensual cross-platform lipidomics. PLoS ONE 2012, 7, e29851. [Google Scholar] [CrossRef] [Green Version]
- Herzog, R.; Schwudke, D.; Schuhmann, K.; Sampaio, J.L.; Bornstein, S.R.; Schroeder, M.; Shevchenko, A. A novel informatics concept for high-throughput shotgun lipidomics based on the molecular fragmentation query language. Genome Biol. 2011, 12, 1–25. [Google Scholar] [CrossRef] [PubMed] [Green Version]
- Chong, J.; Wishart, D.S.; Xia, J. Using MetaboAnalyst 4.0 for Comprehensive and Integrative Metabolomics Data Analysis. Curr. Protoc. Bioinform. 2019, 68, e86. [Google Scholar] [CrossRef] [PubMed]
- Wagner, F. GO-PCA: An Unsupervised Method to Explore Gene Expression Data Using Prior Knowledge. PLoS ONE 2015, 10, e0143196. [Google Scholar] [CrossRef] [PubMed] [Green Version]


Publisher’s Note: MDPI stays neutral with regard to jurisdictional claims in published maps and institutional affiliations. |
© 2021 by the authors. Licensee MDPI, Basel, Switzerland. This article is an open access article distributed under the terms and conditions of the Creative Commons Attribution (CC BY) license (https://creativecommons.org/licenses/by/4.0/).
Share and Cite
Burg, T.; Rossaert, E.; Moisse, M.; Van Damme, P.; Van Den Bosch, L. Histone Deacetylase Inhibition Regulates Lipid Homeostasis in a Mouse Model of Amyotrophic Lateral Sclerosis. Int. J. Mol. Sci. 2021, 22, 11224. https://doi.org/10.3390/ijms222011224
Burg T, Rossaert E, Moisse M, Van Damme P, Van Den Bosch L. Histone Deacetylase Inhibition Regulates Lipid Homeostasis in a Mouse Model of Amyotrophic Lateral Sclerosis. International Journal of Molecular Sciences. 2021; 22(20):11224. https://doi.org/10.3390/ijms222011224
Chicago/Turabian StyleBurg, Thibaut, Elisabeth Rossaert, Matthieu Moisse, Philip Van Damme, and Ludo Van Den Bosch. 2021. "Histone Deacetylase Inhibition Regulates Lipid Homeostasis in a Mouse Model of Amyotrophic Lateral Sclerosis" International Journal of Molecular Sciences 22, no. 20: 11224. https://doi.org/10.3390/ijms222011224
APA StyleBurg, T., Rossaert, E., Moisse, M., Van Damme, P., & Van Den Bosch, L. (2021). Histone Deacetylase Inhibition Regulates Lipid Homeostasis in a Mouse Model of Amyotrophic Lateral Sclerosis. International Journal of Molecular Sciences, 22(20), 11224. https://doi.org/10.3390/ijms222011224