Abstract
Starch and prolamin composition and content are important indexes for determining the processing and nutritional quality of wheat (Triticum aestivum L.) grains. Several transcription factors (TFs) regulate gene expression during starch and protein biosynthesis in wheat. Storage protein activator (TaSPA), a member of the basic leucine zipper (bZIP) family, has been reported to activate glutenin genes and is correlated to starch synthesis related genes. In this study, we generated TaSPA-B overexpressing (OE) transgenic wheat lines. Compared with wild-type (WT) plants, the starch content was slightly reduced and starch granules exhibited a more polarized distribution in the TaSPA-B OE lines. Moreover, glutenin and ω- gliadin contents were significantly reduced, with lower expression levels of related genes (e.g., By15, Dx2, and ω-1,2 gliadin gene). RNA-seq analysis identified 2023 differentially expressed genes (DEGs). The low expression of some DEGs (e.g., SUSase, ADPase, Pho1, Waxy, SBE, SSI, and SS II a) might explain the reduction of starch contents. Some TFs involved in glutenin and starch synthesis might be regulated by TaSPA-B, for example, TaPBF was reduced in TaSPA-B OE-3 lines. In addition, dual-luciferase reporter assay indicated that both TaSPA-B and TaPBF could transactivate the promoter of ω-1,2 gliadin gene. These results suggest that TaSPA-B regulates a complex gene network and plays an important role in starch and protein biosynthesis in wheat.
1. Introduction
Bread wheat (Triticum aestivum L.), one of the three major food crops, provides a quarter of the world’s supply of plant proteins, carbohydrates, and dietary fiber [1,2]. In wheat grains, starch and prolamins are synthesized and stored in the endosperm. Starch synthesis involves a serious of complex and finely regulated enzymatic reactions and forms amylose and amylopectin [3]. The starch is stored as large A-type (average 10~35 µm diameter) and small B-type (<10 µm diameter) starch granules (SGs) [4]. Prolamins, composed of glutenin and gliadin, are synthesized on the rough endoplasmic reticulum (ER) and deposited to form protein bodies (PBs) [5]. PBs wrap around SGs and form two main abundant organelles in the endosperm of wheat grain. The quantities and proportions of starch and protein are key determinants of processing quality in wheat.
The special accumulation of prolamins in the endosperm during grain filling is controlled by several mechanisms. Regulation at the transcriptional level is the primary mode and depends on the interaction of with cis-motifs in the promoters of related genes, which is conserved in most cereals and dicots [6,7,8,9,10,11,12,13]. The bipartite endosperm box is composed of GCN4 motif, which is recognized by basic leucine zipper (bZIP) TFs, and P box, which is recognized by DNA binding with one finger (Dof) TFs [6,14,15]. B3 and MYB TFs also regulate prolamin genes [16,17,18,19]. Different TFs have been reported to establish a complex gene network via synergetic interactions and determine the expression of prolamin genes [17,20,21,22]. Post-transcriptional regulation is also important for prolamin accumulations. N-glycosylation, folding, and assembly of proteins often occur on the ER. Glutenin and gliadin are transported via Golgi-independent and dependent secretory pathways, respectively, and aggregate to form PBs in vacuoles [5]. Starch synthesis in cereals is catalyzed by a series of enzymes, including sucrose synthase (SUSase), invertase (INV), ADP-glucose pyrophosphorylase (ADPase), granule bound starch synthase (GBSS, Waxy), starch synthase (SS), starch branching enzyme (SBE), and starch de-branching enzyme (DBE) [3]. Up till now, only a few TFs that regulate starch synthesis have been identified. AP2, bZIP, and NAC TFs regulate starch synthesis related genes (SSRGs) in rice (Oryza sativa), maize (Zea mays) and wheat [11,12,23,24,25,26,27]. For example, maize Opaque-2 (O2) indirectly represses the TF gene Prolamin-box binding factor (PBF); furthermore, O2 and PBF interact to regulate gene networks for starch and protein biosynthesis [14,27,28]. Similar bZIP and Dof TF regulatory interaction is also found in rice [15,29,30].
Previous researches focused on the modification of the prolamin genes and starch synthesis genes to obtain ideal phenotypes [31,32]. With advances in genomics, the regulatory mechanism underlying the TFs and gene networks becomes a hot topic in wheat grain research [13,17,19,27,33,34]. Maize O2 is a typical TF with a broad influence, especially on starch and protein synthesis [28,35]. In wheat, the homolog O2 gene TaSPA, was cloned as an activator of low molecular weight glutenin subunit (LMW-GS) gene [36]. Three homoeologous copies of TaSPA are located on the long arms of the homoeologous 1 group [37]. TaSPA-B activates high molecular weight glutenin subunit (HMW-GS) gene and was a candidate gene for a protein QTL [38,39,40]. In addition to HMW-GS and LMW-GS, the promoter of α- and γ- gliadin genes also contain the GCN4 motif [38,41,42,43]. However, up to date, TaSPA-B mediated regulatory role for starch and gliadins remains unknown.
In the current research, to investigate the role of TaSPA-B on the accumulation of starch and prolamin in wheat mature seeds, we generated TaSPA-B overexpressing (OE) transgenic wheat lines. In the TaSPA-B OE lines, starch and protein contents decreased and larger A-type SGs and smaller B-type SGs accumulated. RNA-seq analysis suggested that the differentially expressed genes (DEGs) regulated by TaSPA-B were involved in a wide range of metabolic pathways, especially starch and amino acid metabolism. Important TFs and key enzymes were identified as DEGs, which may contribute to the decrease of starch and protein contents. This study contributes a better understanding of the role of TaSPA-B in prolamin and starch accumulation in wheat grains.
2. Results
2.1. Generating TaSPA-B Overexpressing Lines
To examine the role of TaSPA-B, we transformed wheat with TaSPA-B under the Glu-1Dx5 promoter, which could drive genes specifical expression in the wheat endosperm. We obtained six independent transformants, which were confirmed by PCR and sequencing analysis (Figure 1A). In the wild-type (WT) and TaSPA-B OE lines, the relative expression of TaSPA rapidly increased and reached a peak at 18 days post-anthesis (DPA), followed by decreasing gradually to 22 DPA (Figure 1B). At the peaking time, the expression of TaSPA in the three TaSPA-B OE lines was approximately 10- to 20-fold higher than in WT and remained high level at 22 DPA. These three lines were used to generate stable lines through PCR test, and their seeds were harvested and used in the following studies.
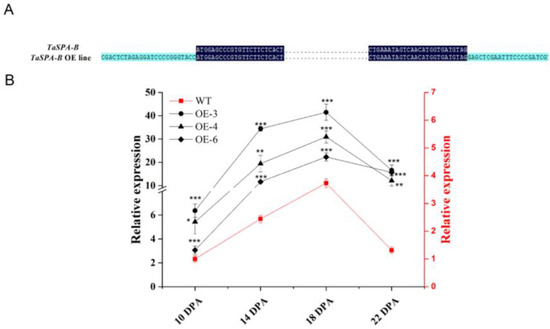
Figure 1.
Validation of the TaSPA-B overexpressing (OE) lines in the T1 generation. (A) Partial sequence alignment of the vector and TaSPA-B in the TaSPA-B OE lines. The dark blue shows the sequence of TaSPA-B. The light blue shows the sequence of the vector. The points represent the omitted base sequences. (B) Relative expression level of TaSPA at 10, 14, 18, and 22 days post-anthesis (DPA) endosperms in the T1 generation measured by quantitative reverse-transcription PCR (qRT-PCR) analysis. The left black y-axis shows the TaSPA expression level in the TaSPA-B OE lines, and right red y-axis shows the TaSPA expression level of wild-type (WT). The relative expression represents the three homoeologous copies of TaSPA. The values are the mean of three biological repetitions and error bars represent the SD. The gene expression in the TaSPA-B OE lines at each period is compared with WT, respectively. Asterisks indicate significant differences (Student’s t-test, * p < 0.05; ** p < 0.01; *** p < 0.001).
2.2. Morphology of Starch and Prolamin in Mature Seeds
We examined the morphology of starch, prolamin, and SGs in mature seeds by scanning electron microscopy (SEM). In wheat mature seeds, SGs were packed tightly with matrix proteins in the endosperm of mature seeds, varied in size, and were distributed randomly (Figure 2). Compared with WT, more and larger gaps and looser arrangement of PBs and SGs were observed in the three TaSPA-B OE lines (Figure 2A–D). The A-type SGs in WT appeared irregular round shape, while were more oval in the TaSPA-B OE lines, which might be caused by the looser endosperm structure (Figure 2E–H). The particle size of SGs showed a bimodal distribution with a peak at ~22 μm for A-type SGs and another peak at ~2 μm for B-type SGs in WT and TaSPA-B OE lines (Figure 3). There were more particles >22 μm and <2 μm in the TaSPA-B OE lines compared with WT, suggesting that larger A-type and smaller B-type SGs accumulated in these lines (Figure 3).
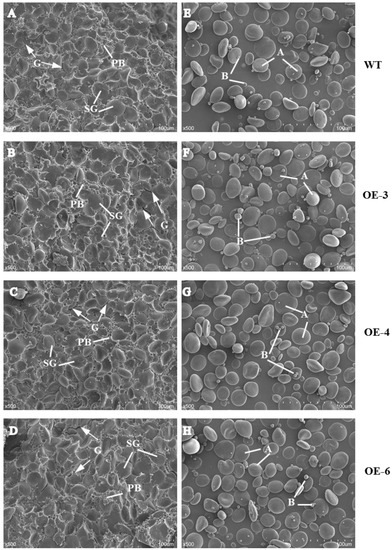
Figure 2.
Scanning electron micrograph of mature seeds and isolated starch granules in WT and TaSPA-B OE lines. (A–D) Transverse sections of mature seeds. (E–H) Isolated starch granules. PB, protein body; SG, starch granule; A, A-starch granule; B, B-starch granule; G, the gap between PB and SG. Arrows indicate the gaps between starch granules and protein bodies. Scale bars, 100 μm (500× magnification).
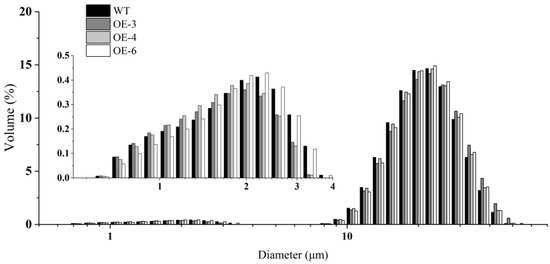
Figure 3.
The particle size distribution of SGs. The inset shows the distribution of B-type SGs.
2.3. Starch and Prolamin Contents
Compared with WT, starch contents were slightly decreased in the three TaSPA-B OE lines (Figure 4A). HMW-GS (Bx14, By15, Dx2 and Dy12) and LMW-GS levels were dramatically reduced (Figure 4B). In addition, ω- gliadin levels were significantly reduced in the three TaSPA-B OE lines, α/β- gliadin levels were slightly reduced in OE-4 and OE-6, and γ- gliadin levels were significantly increased only in OE-4 lines (Figure 4C). On average, total glutenin content was significantly reduced by 40% in the three TaSPA-B OE lines, and total gliadin was only significantly reduced in OE-6 (Figure 4D). Previous result had shown that TaSPA-B activated glutenin genes, while our results suggested that overexpression of TaSPA-B reduced starch, glutenin, ω- and α/β- gliadin contents, even if the opposite was expected.
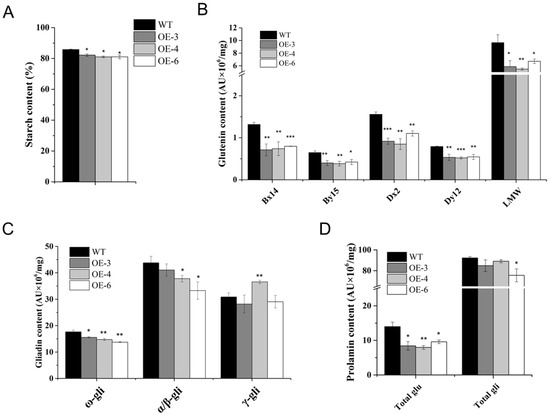
Figure 4.
Starch and prolamin contents in WT and TaSPA-B OE lines. (A) Starch contents. (B) Glutenin contents. Bx14, By15, Dx2 and Dy12 are the four subunits of HMW-GS. (C) Gliadin contents. ω-, α/β- and γ-gli represent the compositions of gliadin. (D) Total glutenin and gliadin contents. The values are the mean of three biological repetitions and error bars represent the SD. Asterisks indicate significant differences compared with WT (Student’s t-test, * p < 0.05; ** p < 0.01; *** p < 0.001).
2.4. Relative Expression Analysis of TaSPA and Prolamin Genes
For further study whether the expression patterns of prolamin genes could be regulated by TaSPA-B, the immature seeds of WT and TaSPA-B OE-3 lines at 18 DPA (the expressing peaking time point of TaSPA) were collected for RNA extraction. The relative expressions of TaSPA and prolamin genes were measured by qRT-PCR. Expectedly, the TaSPA-B was significantly induced by 60-fold in TaSPA-B OE-3 lines. However, the TaSPA-A and TaSPA-D were slightly reduced (Figure 5). The expression of two glutenin genes, Dx2 and By15, was significantly reduced, while the ω-1,2 gliadin gene was slightly reduced in the TaSPA-B OE-3 lines (Figure 5). The other measured prolamin genes Bx14, Dy12, LMW, α-, γ- and ω-5 gliadin showed no difference in expression.
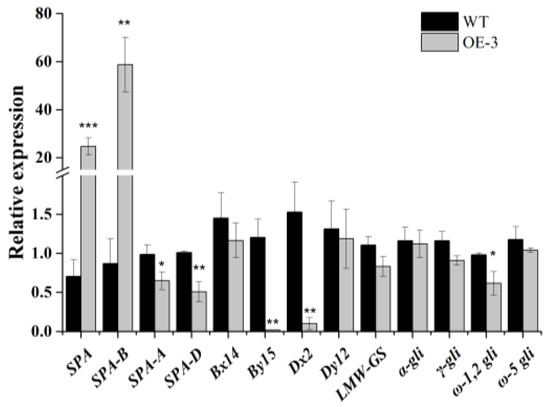
Figure 5.
The relative expressions of TaSPA and prolamin genes in 18 DPA endosperm of WT and TaSPA-B OE-3 lines. SPA represents the three homoeologous copies and SPA-A, -B and -D represent each single homoeologous copy of TaSPA. Bx14, By15, Dx2 and Dy12 represent the coding genes of the four subunits of HMW-GS. α-, γ, ω-1,2 and ω-5 gli represent the coding genes of different components of gliadin. The values are the mean of three biological repetitions and error bars represent the SD. Asterisks indicate significant differences (Student’s t-test, * p < 0.05; ** p < 0.01; *** p < 0.001).
2.5. Identification and Annotation of Differentially Expressed Genes in the TaSPA-B OE-3 Immature Seeds
For better understanding what pathways were regulated by TaSPA-B to decrease starch and protein content, we selected 18 DPA immature seeds of the TaSPA-B OE-3 line for RNA-seq analysis. We obtained 322,633,576 clean reads, with an average of 53,772,262 clean reads for WT and TaSPA-B OE-3 lines, with three repetitions (Table S1). Q20 and Q30 values were >97.5% and 93.1%, respectively. On average, more than 70% of reads were uniquely aligned to the wheat reference genome of Chinese Spring (IWGSC RefSeq v1.1; Table S1). The overlapped annotated genes were more than 90% in WT and TaSPA-B OE-3 lines, suggesting that the transcriptomes were similar in addition to expression level (Figure S1A). A total of 2023 differentially expressed genes (DEGs) were identified, including 1437 up-regulated and 586 down-regulated genes in TaSPA-B OE-3 lines compared with WT (Table S2, Figure S1B).
In the TaSPA-B OE-3 lines, 873 up-regulated and 311 down-regulated genes were annotated to 565 Gene ontology (GO) terms (Figure S1B, Table S3). GO enrichment analysis indicated that some important terms could be affected by TaSPA-B, such as starch synthetic process, transferase activity, hydrolase activity and amyloplast (Figure 6A). Kyoto Encyclopedia of Genes and Genomes (KEGG) pathway analysis assigned 357 up-regulated and 175 down-regulated genes to 115 different pathways (Figure S1B, Table S4). KEGG enrichment analysis revealed 15 significantly enriched pathways, including some important pathways such as starch and sucrose metabolism, valine, leucine and isoleucine degradation, and phenylalanine metabolism (Figure 6B).
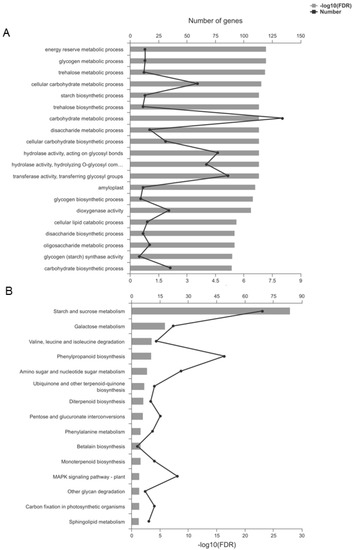
Figure 6.
Gene ontology (GO) and Kyoto Encyclopedia of Genes and Genomes (KEGG) enrichment of differentially expressed genes (DEGs). (A) The top 20 enriched GO terms. (B) The 15 enriched KEGG pathways. FDR represents the adjusted P-value using the Benjamini–Hochberg (BH) method.
2.6. DEGs Involved in Starch and Protein Metabolism
In the TaSPA-B OE-3 lines, the pyruvate orthophosphate dikinase (PPDK) and pyruvate dehydrogenase (PDH) complex genes were up-regulated, which suggested the enhanced nitrogen assimilation. Moreover, 27 key enzymes of starch synthesis were down-regulated (Table 1), which might explain the decrease in starch content (Figure 4A). The protein processing in ER relevant genes Ribophorin I (RPN1) and B-cell receptor-associated protein (BAP31) were down-regulated. Ubiquitin-conjugating enzyme E2 and ubiquitin ligase E3 were up-regulated (Table 1), which suggested the enhanced ubiquitin-mediated degradation.

Table 1.
Representative DEGs involved in starch and protein synthesis.
Among the DEGs, in addition to the over-expressed TaSPA-B, 130 TFs belonging to 22 TF families were identified in the TaSPA-B OE-3 lines (Table S5). The TFs related to starch synthesis (e.g., TaRSR1, TaGBF1 and TabZIPs) and protein (e.g., TaSPA, TaPBF and TaSHP) were differentially expressed (Table 2).
Table 2.
Representative differentially expressed transcription factors (TFs) involved in starch and protein synthesis.
2.7. Dual-Luciferase Reporter Assay of the ω-1,2 Gliadin Gene Promoter
TaSPA-B and TaPBF-D have been identified to regulate wheat glutenin gene, and their homologs in maize (O2 and PBF) show stimulatory and additive effects on maize zein and wheat glutenin genes [14,34,38]. In our results, ω-1,2 gliadin gene and TaPBF showed a little reduction in TaSPA-B OE-3 lines compared with WT (Figure 5, Table 2). Therefore, we performed the dual-luciferase reporter (DLR) assay to determine whether TaSPA-B and TaPBF-D could regulate ω-1,2 gliadin gene. In this system, 35S-SPA-B and 35S-PBF-D were constructed as effectors (Figure 7A). The ω-1,2 gliadin gene promoter was fused with LUC to generate the reporter ω-1,2-LUC. Compared with the negative control, 35S-SPA-B and 35S-PBF-D increased the LUC activity by 2- and 11-fold, respectively (Figure 7B). Moreover, the combination of two effectors (SPA-B&PBF-D) resulted in 20-fold increase in LUC activity compared with negative control (Figure 7B). The results indicated that both TaSPA-B and TaPBF-D could activate the ω-1,2 gliadin gene promoter. TaPBF-D showed a higher activation than TaSPA-B and they provide additive activation of ω-1,2 gliadin gene.
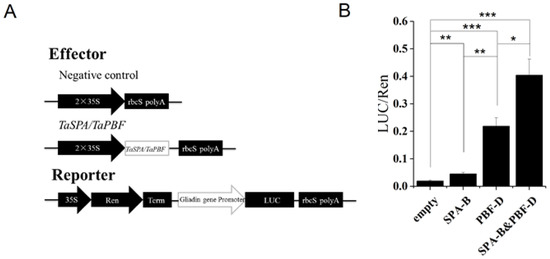
Figure 7.
The activation of ω-1,2 gliadin gene promoter by TaSPA-B and TaPBF in N. benthamiana leaves. (A) Schematic diagram of effectors and reporter. Ren, Renilla luciferase; LUC, firefly luciferase; Term, terminator. (B) The relative LUC activities driven by the promoter of ω-1,2 gliadin gene. The ratios of LUC/Ren represent the relative promoter activities. Empty, negative control effector; SPA-B, 35S-SPA-B effector; PBF-D, 35S-PBF-D; SPA-B&PBF-D, combination of 35S-SPA-B and 35S-PBF-D. The values are the mean of three biological repetitions and error bars represent the SD. The LUC activities of SPA-B, PBF-D and the combination of effectors (SPA-B&PBF-D) are compared with the empty, respectively. The LUC activity of PBF-D is compared with SPA-B and the combination of effectors (SPA-B&PBF-D), respectively. Asterisks indicate significant differences (Student’s t-test, * p < 0.05; ** p < 0.01; *** p < 0.001).
3. Discussion
The bZIP family TFs play roles in various biological processes and stress responses. The O2 subfamily, including O2 and RISBZ1, is a typical bZIP family and family members interact with the GCN4 motif to regulate prolamin genes and SSRGs in maize and rice [23,30,44,45]. The O2 mutant affects starch and zein accumulation [28,35]. TaSPA-B, which is a homolog of O2, was isolated as an activator of LMW-GS and HMW-GS [36,38]. An association study reported that the three homoeologous copies of TaSPA were strongly associated with prolamin composition [46]. Interestingly, correlation analysis of gene expression revealed that TaSPA-B was also correlated with SSRGs [47]. To understand the effect of TaSPA-B on the accumulation of prolamin and starch, we developed three TaSPA-B OE lines. The expression pattern of TaSPA showed the trend of first increasing and then decreasing from 10 to 22 DPA, which was consistent with the previous finding [37]. The TaSPA in the TaSPA-B OE lines showed a similar expression pattern as in WT, but with higher transcriptional level at four time points (Figure 1B).
In wheat grains, SGs and PBs distribute randomly in the starchy endosperm. The A-type SGs form earlier and larger than B-type SGs [48], but account for <10% of the numbers of SGs [49]. PBs accumulate different compositions of glutenin and gliadin in different endosperm tissues and arrange compactly with SGs [50]. In the TaSPA-B OE lines, SGs and protein matrix arranged looser in mature seeds, compared with WT (Figure 2). The SGs in the Triticeae grass family show unique bimodal granule morphology [48], and this was also observed in our results (Figure 3). However, the SGs showed a more polarized distribution and starch content showed a slight decrease in the TaSPA-B OE lines compared with WT (Figure 3 and Figure 4A). It has been proved that TaSPA-B activates LMW-GS and HMW-GS [36,38,39], and is associated with glutenin content [46]. On the contrary, our results showed that HMW-GS (Bx14, By15, Dx2 and Dy12) and LMW-GS contents were reduced dramatically in the TaSPA-B OE lines (Figure 4B). Moreover, the ω-1,2 and α/β- gliadin contents also showed a slight decrease in the TaSPA-B OE lines. The relative expression analysis revealed that the levels of By15, Dx2 and ω-1,2 gliadin gene were reduced, which might explain the decrease of protein contents (Figure 4 and Figure 5). Interestingly, other prolamin genes had no significantly transcriptional change in spite of the reduction of accumulations. We speculated that TaSPA-B might affect some important genes at the transcriptional and post-transcriptional level to play an important role in starch and protein synthesis.
Our RNA-seq analysis identified a wide range of metabolic pathways regulated by TaSPA-B (Figure 6), especially starch and amino acid metabolism, which might explain the content changes of starch and protein in TaSPA-B OE-3 lines (Figure 4B,C). PPDK play an important role in the balance of starch and protein as the central substance by regulating the ratio of phosphoenolpyruvate and pyrophosphoric acid in maize and rice [51,52,53]. PDH catalyzes a rate-limiting step of pyruvate entering the tricarboxylic acid cycle (TCA). The up-regulation of PPDK and PDH genes might enhance nitrogen assimilation in TaSPA-B OE-3 lines, however, 27 key enzymes of starch synthesis were down-regulated, which might cause the decrease in starch content (Table 1, Figure 4A). Moreover, the plastidial phosphorylase (Pho1) mutation increased the accumulation of small SGs and modified the amylopectin structure in rice [54]. We also found an increase in small B-type SGs and the down-regulation of Pho1 in TaSPA-B OE-3 lines, perhaps Pho1 have a similar effect (Figure 3, Table 1). Some important genes related to protein processing in ER were also down-regulated, while the ubiquitin-proteasome complex related genes were up-regulated.
Maize O2 regulates a complex gene network, such as genes coding starch synthesis related enzymes, cyPPDK1, cyPPDK2 and PBF, to balance starch and protein synthesis [27,28,35]. The expression of TaRSR1 and TabZIPs is correlated to the expression of SSRGs in wheat [9,13,25,47]. However, the overexpressed TaSPA-B was negatively correlated, TaRSR1 was positively correlated to 27 SSRGs in the TaSPA-B OE-3 lines, showing not completely in line with the previous results [9,25,47]. Other TF genes related to SSRGs, such as the negative regulatory factor genes TabZIP151, TabZIP194.3 and TabZIP229.1 (up-regulated), and the positive regulatory factor gene TabZIP167.2 (down-regulated), were also differentially expressed (Table 2) [13]. A series of TFs, including TaSPA, TaGAMYB, TaFUSCA3, TaSHP, and TaPBF-D, regulate the glutenin genes in wheat [17,19,33,34,36,38]. In the TaSPA-B OE-3 lines, TaSPA-A and TaSPA-D were down-regulated (Figure 5); TaSHP, encoding a transcriptional repressor of glutenin genes, was up-regulated; TaPBF, encoding a transcriptional activator of glutenin genes was down-regulated (Table 2). The expression changes of these TFs genes corresponded to the changes in starch and protein contents.
Maize PBF is an indirect O2 target gene and is up-regulated in the B73O2 mutant, suggesting the negative role of O2 to PBF [28]. Importantly, PBF and O2 can interact to affect the accumulation of zein and starch [14,28]. Consistent with these results, TaPBF was reduced in TaSPA-B OE-3 lines (Table 2). TaPBF activated glutenin genes by regulating methylation of the promoter [34]. Our DLR assay revealed that TaSPA-B and TaPBF-D could activate the expression of ω-1,2 gliadin gene, and TaPBF-D showed a higher activation than TaSPA-B (Figure 7B). The down-regulation of TaPBF might be one of factors for prolamin reduction. Therefore, TaSPA-B regulates a complex gene network and plays an important role in starch and protein biosynthesis in wheat.
4. Materials and Methods
4.1. Plant Materials
Wheat cultivar Fielder and Jing 411 were planted in the greenhouse at 26/20 °C (day/night) with 75% relative humidity and a light intensity of 40 µmol m−2 s−1. Mature seeds were harvested and ground into flour with an experimental mill (Brabender, Duisburg, Germany). Nicotiana benthamiana seeds were planted in the greenhouse at 22/18 °C (day/ night) with 60% relative humidity and a light intensity of 3000 lux. Young leaves were used for DLR assay.
4.2. DNA Extraction, RNA Extraction, cDNA Synthesis, and qRT-PCR
Genomic DNA was isolated from one-week-old wheat leaves using the CTAB method. Seeds were harvested at 10, 14, 18 and 22 DPA, snap-frozen in liquid nitrogen, and stored at −80 °C. Total RNA was extracted from seed samples using the RNA prep Pure Plant Kit (Tiangen Biotech, Beijing, China) and reverse transcribed to cDNA using the PrimeScriptTM RT reagent Kit with gDNA Eraser (Takara, Dalian, China). The qRT-PCR primers were listed in Table S6. GAPDH was the house-keeping gene used as internal control. The primer of TaSPA was designed to amplify three homoeologous copies according to the conserved sequence. The primers of LMW-GS, α-, γ-, ω-1,2 and ω-5 gli were designed to amplify the whole multigene family members according to the conserved sequences. The qRT-PCR reaction system was 20 μL according to the manufacturer’s instructions of SYBR Premix Ex TaqII (Takara, Dalian, China). The recommended PCR amplification procedure for Applied Biosystems 7500 Real-Time PCR System (Applied Biosystem, Foster City, CA) was used for analysis. The relative expression levels of genes were calculated using the 2−ΔΔCt method and normalized to GAPDH. Three independent experiments were performed with three technical repetitions for each sample.
4.3. Plasmid Construction and Genetic Transformation for Wheat
The full-length coding sequence of TaSPA-B was amplified from Jing411 cDNA and inserted in the pCAMBIA3300 vector via restriction enzyme digestion and ligation. The primer for TaSPA-B was listed in Table S7. The Bar gene of the pCAMBIA3300 vector was driven by CaMV35S. The Glu-1Dx5 promoter was digested from the vector pBAC47p and ligated to the vector before TaSPA-B to ensure efficient expression in wheat endosperm [55]. The vector was transferred into Agrobacterium strain C58C1. Immature Fielder wheat embryos were used for agrobacterium-mediated transformation according to the modified protocol developed by Japan Tobacco Company [56]. The stable integration of TaSPA-B was confirmed by PCR test of genomic DNA. Two pairs of primers were designed for detecting the TaSPA-B and Bar in the vector (Table S7).
4.4. Extraction and Size Distribution of Starch Granules, and Morphology Observation
The SGs were isolated according to Peng et al. [4]. The starch pellets were dried at room temperature and stored at −20 °C. The particle size distribution of SGs was measured with a Mastersize 2000 Laser Diffraction instrument (Malvern Instruments Ltd., Worcestershire, UK). Dried seeds were sliced down the middle to create transverse sections and adhered to an aluminum stub with conductive double-sided tape. The isolated SGs were gently transferred onto the stub. The samples were sprayed with a thin film of gold (10 nm) and observed under a scanning electron microscope (Hitachi S3400N, Tokyo, Japan). For WT and TaSPA-B OE lines, three independent mature seeds with three transverse sections were imaged.
4.5. Starch and Protein Extraction and Content Analysis
The total starch content of flour was measured using a Total Starch Assay kit (Megazyme, Wicklow, Ireland) according to the manufacturer’s protocol. The sequential extraction of gliadin and glutenin from wheat flour and reversed-phase ultra-performance liquid chromatography (RP-UPLC) were performed according to Han et al. [57] and Yan et al. [58,59] with slight modifications. Wheat flour (0.1 g) was mixed with 1 mL 50% n-propanol and incubated at 65 °C for 30 min. Three times repeated supernatants were combined and subjected to gliadin detection. 250 μL solution A (50% n-propanol, 20% 1 M pH 6.8 Tris-HCl and freshly added 1% dithiothreitol) and 250 μL solution B (50% n-propanol, 20% 1 M pH 6.8 Tris-HCl and freshly added 1.4% 4-vinyl pyridine) were successively added to the residues, followed by incubation at 65 °C for 30 min after each addition. Glutenin was precipitated with 60% acetone, washed with ethanol, and dissolved in 100 μL solution (50% acetonitrile and 0.5% trifluoroacetic acid). Both protein solutions were filtered through 0.45 μm nylon filters. RP-UPLC was performed on an Acquity UPLC (Waters Crop., Milford, MA, USA) with an Agilent ZORBAX 300SB-C18 column (4.6 × 150 mm, 5 μm, Agilent Technologies, Palo Alto, CA, USA). The parameters were absorbance at 210 nm, column temperature of 60 °C, flow rate of 1 mL/min, and 4 μL injection volumes. The elution buffer was consisted of acetonitrile and 0.06% trifluoroacetic acid. The gradient was gradually increased from 25 to 50% in 25 min for gliadin and from 21 to 53.5% in 50 min for glutenin. Each sample was sequentially injected three times for technical replicates.
The integration of peak areas was performed automatically with the same criteria to obtain effective peaks and avoid noise peaks. The effective peak areas were used to represent protein contents. The ω-, α/β-, and γ- gliadins were eluted from 6 to 13 min, from 13 to 20 min, and from 20 to 30 min, respectively. The four subunits of HMW-GS were eluted at approximately 15, 18, 20 and 22 min for Dy12, By15, Dx2, and Bx14, respectively, and LMW-GSs were eluted from 26 to 36 min. Every sample was compared with WT, respectively, with three repetitions.
4.6. RNA-Seq Analysis
The RNA-seq was performed using the 18 DPA immature seeds of Fielder and TaSPA-B OE-3 lines. Each sample included three biological repetitions. The total RNA was extracted and detected by agarose gel electrophoresis and Agilent 2100 Bioanalyzer. The concentration and purity of the RNA were checked with a NanoDrop 2000. 1 μg RNA was used for library construction with the Truseq RNA sample prep Kit (Illumina, San Diego, CA, USA). The pair-end sequencing was performed on the Illumina Novaseq 6000 platform. The adapter sequences and low-quality sequences of raw reads were removed with the SeqPrep (https://github.com/jstjohn/SeqPrep) and Sickle (https://github.com/najoshi/sickle) software to obtain clean reads. The TopHat2 (Version 2.1.1) was used to map the clean reads to the Chinese Spring (CS) wheat reference genome (http://plants.ensembl.org/Triticum_aestivum/Info/Index). The reads with one single aligned position were used for further analysis. The Transcript per Million (TPM) values were used as the variables to measure the expression levels of transcripts and to eliminate the impact of differences in gene length and sequencing volume on the calculated gene expression [60,61]. The gene functions were annotated to the NR (NCBI non-redundant protein sequences), Swiss-Prot (a manually annotated and reviewed protein sequence database), Pfam (Protein family), EggNOG (Evolutionary Genealogy of Genes: Non-supervised Orthologous Groups), GO and KEGG databases. DEGs were identified using the criteria |log2FC|>1 and FDR < 0.05 with DESeq2 Software (version 1.24.0). GO and KEGG enrichment of DEGs was implemented with Goatools (version 0.6.5) with BH method. Transcription factor prediction for DEGs was performed with PlantTF 4.0 (http://planttfdb.cbi.pku.edu.cn/).
4.7. Dual-Luciferase Reporter Assay of Gliadin Gene Promoter Activations
DLR assay was performed as described by Liu et al. [62]. To generate the 35S-SPA-B and 35S-PBF-D effector constructs (driven by the CaMV 35S promoter), we ligated the coding sequence of TaSPA-B and TaPBF-D to the PHB vector, respectively. The ~1 kb promoter sequence of the ω-1,2 gliadin gene was amplified from Fielder genomic DNA and used to drive the LUC of pGreenII 0800-LUC. The Ren driven by the CaMV 35S promoter was used as an internal control. The primers used for the construction of vectors were listed in Table S8. The constructed vectors were transferred into Agrobacterium strain GV3101 (pSoup) and injected into young leaves of four- to six-week-old Nicotiana benthamiana plants. Forty-eight hours later, the ratio of LUC/Ren activities was measured according to the Dual-luciferase assay reagents (Promega, CA, USA) with a Synergy 2 Multi-Detection Microplate Reader (BioTek Instrument Inc., Winooski, VT, USA) [63].
4.8. Statistical Analysis
Statistical analysis of significant differences was performed using Student’s t-test. The sequence alignment was performed using the DNAMAN software (version 8.0). The bar and line charts were graphically drawn using Origin 9.1 (OriginLab) software.
Supplementary Materials
Supplementary materials can be found at https://www.mdpi.com/1422-0067/21/9/3257/s1.
Author Contributions
B.L. and D.G. conceived the project; D.G. performed most of the experiments; Q.H. provided help with experiments and life; R.Z. provided help for using the software; H.L. provided data curation; D.G. wrote the manuscript; Y.L., Y.Z., M.Y., C.X., R.L. and B.L. improved and revised this manuscript. All authors have read and agreed to the published version of the manuscript.
Funding
This research was funded by the National Key Research and Development Program of China (2016YFD0100502).
Acknowledgments
We are grateful to Professor Xingguo Ye and Xianchun Xia (Institute of Crop Science, CAAS) for transgenic experiment and RP-UPLC analysis.
Conflicts of Interest
The authors declare that the research was conducted in the absence of any commercial or financial relationships that could be construed as a potential conflict of interest.
References
- Rustgi, S.; Shewry, P.; Brouns, F.; Deleu, L.J.; Delcour, J.A. Wheat Seed Proteins: Factors Influencing Their Content, Composition, and Technological Properties, and Strategies to Reduce Adverse Reactions. Compr. Rev. Food Sci. Food Saf. 2019, 18, 1751–1769. [Google Scholar] [CrossRef]
- Wang, D.; Li, F.; Cao, S.; Zhang, K. Genomic and functional genomics analyses of gluten proteins and prospect for simultaneous improvement of end-use and health-related traits in wheat. Theor. Appl. Genet. 2020, 10–1007. [Google Scholar] [CrossRef] [PubMed]
- Kumar, R.; Mukherjee, S.; Ayele, B.T. Molecular aspects of sucrose transport and its metabolism to starch during seed development in wheat: A comprehensive review. Biotechnol. Adv. 2018, 36, 954–967. [Google Scholar] [CrossRef] [PubMed]
- Peng, M.; Gao, M.; Abdel Aal, E.S.M.; Hucl, P.; Chibbar, R.N. Separation and Characterization of A- and B- Type Starch Granules in Wheat Endosperm. Cereal Chem. 1999, 76, 375–379. [Google Scholar] [CrossRef]
- Tosi, P. Trafficking and deposition of prolamins in wheat. J. Cereal Sci. 2012, 56, 81–90. [Google Scholar] [CrossRef]
- Kawakatsu, T.; Takaiwa, F. Cereal seed storage protein synthesis: Fundamental processes for recombinant protein production in cereal grains. Plant Biotechnol. J. 2010, 8, 939–953. [Google Scholar] [CrossRef]
- Verdier, J.; Thompson, R.D. Transcriptional Regulation of Storage Protein Synthesis During Dicotyledon Seed Filling. Plant Cell Physiol. 2008, 49, 1263–1271. [Google Scholar] [CrossRef]
- Xi, D.; Zheng, C. Transcriptional regulation of seed storage protein genes in Arabidopsis and cereals. Seed Sci. Res. 2011, 21, 247–254. [Google Scholar] [CrossRef]
- Kang, G.; Xu, W.; Liu, G.; Peng, X.; Guo, T. Comprehensive analysis of the transcription of starch synthesis genes and the transcription factor RSR1 in wheat (Triticum aestivum L.) endosperm. Genome 2013, 56, 115–122. [Google Scholar] [CrossRef]
- Fu, F.; Xue, H. Coexpression Analysis Identifies Rice Starch Regulator1, a Rice AP2/EREBP Family Transcription Factor, as a Novel Rice Starch Biosynthesis Regulator. Plant Physiol. 2010, 154, 927–938. [Google Scholar] [CrossRef]
- Maddaloni, M.; Donini, G.; Balconi, C.; Rizzi, E.; Gallusci, P.; Forlani, F.; Lohmer, S.; Thompson, R.; Salamini, F.; Motto, M. The transcriptional activator Opaque-2 controls the expression of a cytosolic form of pyruvate orthophosphate dikinase-1 in maize endosperms. Mol. Gen. Genet. 1996, 250, 647–654. [Google Scholar] [CrossRef]
- She, K.; Kusano, H.; Koizumi, K.; Yamakawa, H.; Hakata, M.; Imamura, T.; Fukuda, M.; Naito, N.; Tsurumaki, Y.; Yaeshima, M.; et al. A Novel Factor FLOURY ENDOSPERM2 Is Involved in Regulation of Rice Grain Size and Starch Quality. Plant Cell 2010, 22, 3280–3294. [Google Scholar] [CrossRef] [PubMed]
- Kumar, P.; Mishra, A.; Sharma, H.; Sharma, D.; Rahim, M.S.; Sharma, M.; Parveen, A.; Jain, P.; Verma, S.K.; Rishi, V.; et al. Pivotal role of bZIPs in amylose biosynthesis by genome survey and transcriptome analysis in wheat (Triticum aestivum L.) mutants. Sci. Rep. 2018, 8, 17240. [Google Scholar] [CrossRef] [PubMed]
- Hwang, Y.S.; Ciceri, P.; Parsons, R.L.; Moose, S.P.; Schmidt, R.J.; Huang, N. The maize O2 and PBF proteins act additively to promote transcription from storage protein gene promoters in rice endosperm cells. Plant Cell Physiol. 2004, 45, 1509–1518. [Google Scholar] [CrossRef] [PubMed]
- Yamamoto, M.P.; Onodera, Y.; Touno, S.M.; Takaiwa, F. Synergism between RPBF Dof and RISBZ1 bZIP Activators in the Regulation of Rice Seed Expression Genes. Plant Physiol. 2006, 141, 1694–1707. [Google Scholar] [CrossRef] [PubMed]
- Moreno-Risueno, M.Á.; González, N.; Díaz, I.; Parcy, F.; Carbonero, P.; Vicente-Carbajosa, J. FUSCA3 from barley unveils a common transcriptional regulation of seed-specific genes between cereals and Arabidopsis. Plant J. 2008, 53, 882–894. [Google Scholar] [CrossRef] [PubMed]
- Sun, F.; Liu, X.; Wei, Q.; Liu, J.; Yang, T.; Jia, L.; Wang, Y.; Yang, G.; He, G. Functional Characterization of TaFUSCA3, a B3-Superfamily Transcription Factor Gene in the Wheat. Front. Plant Sci. 2017, 8, 1133. [Google Scholar] [CrossRef]
- Diaz, I.; Vicente-Carbajosa, J.; Abraham, Z.; Martinez, M.; Isabel-La, M.I.; Carbonero, P. The GAMYB protein from barley interacts with the DOF transcription factor BPBF and activates endosperm-specific genes during seed development. Plant J. 2002, 29, 453–464. [Google Scholar] [CrossRef]
- Guo, W.; Yang, H.; Liu, Y.; Gao, Y.; Ni, Z.; Peng, H.; Xin, M.; Hu, Z.; Sun, Q.; Yao, Y. The wheat transcription factor TaGAMyb recruits histone acetyltransferase and activates the expression of a high-molecular-weight glutenin subunit gene. Plant J. 2015, 84, 347–359. [Google Scholar] [CrossRef]
- Rubio-Somoza, I.; Martinez, M.; Abraham, Z.; Diaz, I.; Carbonero, P. Ternary complex formation between HvMYBS3 and other factors involved in transcriptional control in barley seeds. Plant J. 2006, 47, 269–281. [Google Scholar] [CrossRef]
- Rubio-Somoza, I.; Martinez, M.; Diaz, I.; Carbonero, P. HvMCB1, a R1MYB transcription factor from barley with antagonistic regulatory functions during seed development and germination. Plant J. 2006, 45, 17–30. [Google Scholar] [CrossRef]
- She, M.; Ye, X.; Yan, Y.; Howit, C.; Belgard, M.; Ma, W. Gene networks in the synthesis and deposition of protein polymers during grain development of wheat. Funct. Integr. Genom. 2011, 11, 23–35. [Google Scholar] [CrossRef] [PubMed]
- Wang, J.; Xu, H.; Zhu, Y.; Liu, Q.; Cai, X. OsbZIP58, a basic leucine zipper transcription factor, regulates starch biosynthesis in rice endosperm. J. Exp. Bot. 2013, 64, 3453–3466. [Google Scholar] [CrossRef] [PubMed]
- Zhang, Z.; Dong, J.; Ji, C.; Wu, Y.; Messing, J. NAC-type transcription factors regulate accumulation of starch and protein in maize seeds. Proc. Natl. Acad. Sci. USA 2019, 116, 11223–11228. [Google Scholar] [CrossRef] [PubMed]
- Liu, G.; Wu, Y.; Xu, M.; Gao, T.; Wang, P.; Wang, L.; Guo, T.; Kang, G. Virus-Induced Gene Silencing Identifies an Important Role of the TaRSR1 Transcription Factor in Starch Synthesis in Bread Wheat. Int. J. Mol. Sci. 2016, 17, 1557. [Google Scholar] [CrossRef]
- Song, Y.; Luo, G.; Shen, L.; Yu, K.; Yang, W.; Li, X.; Sun, J.; Zhan, K.; Cui, D.; Liu, D.; et al. TubZIP28, a novel bZIP family transcription factor from Triticum urartu, and TabZIP28, its homologue from Triticum aestivum, enhance starch synthesis in wheat. New Phytol. 2020. [Google Scholar] [CrossRef]
- Zhan, J.; Li, G.; Ryu, C.; Ma, C.; Zhang, S.; Lloyd, A.; Hunter, B.G.; Larkins, B.A.; Drews, G.N.; Wang, X.; et al. Opaque-2 Regulates a Complex Gene Network Associated with Cell Differentiation and Storage Functions of Maize Endosperm. Plant Cell 2018, 30, 2425–2446. [Google Scholar] [CrossRef]
- Zhang, Z.; Zheng, X.; Yang, J.; Messing, J.; Wu, Y. Maize endosperm-specific transcription factors O2 and PBF network the regulation of protein and starch synthesis. Proc. Natl. Acad. Sci. USA 2016, 113, 10842–10847. [Google Scholar] [CrossRef] [PubMed]
- Kawakatsu, T.; Yamamoto, M.P.; Touno, S.M.; Yasuda, H.; Takaiwa, F. Compensation and interaction between RISBZ1 and RPBF during grain filling in rice. Plant J 2009, 59, 908–920. [Google Scholar] [CrossRef]
- Kim, J.S.; Chae, S.; Jun, K.M.; Pahk, Y.; Lee, T.; Chung, P.J.; Kim, Y.; Nahm, B.H. Genome-wide identification of grain filling genes regulated by the OsSMF1 transcription factor in rice. Rice 2017, 10, 16. [Google Scholar] [CrossRef]
- Barro, F.; Iehisa, J.C.M.; Giménez, M.J.; García-Molina, M.D.; Ozuna, C.V.; Comino, I.; Sousa, C.; Gil-Humanes, J. Targeting of prolamins by RNAi in bread wheat: Effectiveness of seven silencing-fragment combinations for obtaining lines devoid of coeliac disease epitopes from highly immunogenic gliadins. Plant Biotechnol. J. 2016, 14, 986–996. [Google Scholar] [CrossRef] [PubMed]
- Blechl, A.E.; Anderson, O.D. Expression of a novel high-molecular-weight glutenin subunit gene in transgenic wheat. Nat. Biotechnol. 1996, 14, 875–879. [Google Scholar] [CrossRef] [PubMed]
- Boudet, J.; Merlino, M.; Plessis, A.; Gaudin, J.; Dardevet, M.; Perrochon, S.; Alvarez, D.; Risacher, T.; Martre, P.; Ravel, C. The bZIP transcription factor SPA Heterodimerizing Protein represses glutenin synthesis inTriticum aestivum. Plant J. 2019, 97, 858–871. [Google Scholar] [CrossRef] [PubMed]
- Zhu, J.; Fang, L.; Yu, J.; Zhao, Y.; Chen, F.; Xia, G. 5-Azacytidine treatment and TaPBF-D over-expression increases glutenin accumulation within the wheat grain by hypomethylating the Glu-1 promoters. Theor. Appl. Genet. 2018, 131, 735–746. [Google Scholar] [CrossRef] [PubMed]
- Li, C.; Qiao, Z.; Qi, W.; Wang, Q.; Yuan, Y.; Yang, X.; Tang, Y.; Mei, B.; Lv, Y.; Zhao, H.; et al. Genome-Wide Characterization of cis-Acting DNA Targets Reveals the Transcriptional Regulatory Framework of Opaque2 in Maize. Plant Cell 2015, 27, 532–545. [Google Scholar] [CrossRef] [PubMed]
- Albani, D.; Hammond-Kosack, M.C.; Smith, C.; Conlan, S.; Colot, V.; Holdsworth, M.; Bevan, M.W. The wheat transcriptional activator SPA: A seed-specific bZIP protein that recognizes the GCN4-like motif in the bifactorial endosperm box of prolamin genes. Plant Cell 1997, 9, 171–184. [Google Scholar] [CrossRef]
- Ravel, C.; Martre, P.; Romeuf, I.; Dardevet, M.; El-Malki, R.; Bordes, J.; Duchateau, N.; Brunel, D.; Balfourier, F.; Charmet, G. Nucleotide Polymorphism in the Wheat Transcriptional Activator Spa Influences Its Pattern of Expression and Has Pleiotropic Effects on Grain Protein Composition, Dough Viscoelasticity, and Grain Hardness. Plant Physiol. 2009, 151, 2133–2144. [Google Scholar] [CrossRef]
- Ravel, C.; Fiquet, S.; Boudet, J.; Dardevet, M.; Vincent, J.; Merlino, M.; Michard, R.; Martre, P. Conserved cis-regulatory modules in promoters of genes encoding wheat high-molecular-weight glutenin subunits. Front. Plant Sci. 2014, 5, 621. [Google Scholar] [CrossRef]
- Li, J.; Wang, K.; Li, G.; Li, Y.; Zhang, Y.; Liu, Z.; Ye, X.; Xia, X.; He, Z.; Cao, S. Dissecting conserved cis-regulatory modules of Glu-1 promoters which confer the highly active endosperm-specific expression via stable wheat transformation. Crop J. 2019, 7, 8–18. [Google Scholar] [CrossRef]
- Guillaumie, S.; Charmet, G.; Linossier, L.; Torney, V.; Robert, N.; Ravel, C. Colocation between a gene encoding the bZip factor SPA and an eQTL for a high-molecular-weight glutenin subunit in wheat (Triticum aestivum). Genome 2004, 47, 705–713. [Google Scholar] [CrossRef]
- Long, H.; Wei, Y.; Yan, Z.; Baum, B.; Nevo, E.; Zheng, Y. Analysis and validation of genome-specific DNA variations in 5’ flanking conserved sequences of wheat low-molecular-weight glutenin subunit genes. Sci. China Ser. C Life Sci. 2006, 49, 322–331. [Google Scholar] [CrossRef] [PubMed]
- Van Herpen, T.W.J.M.; Riley, M.; Sparks, C.; Jones, H.D.; Gritsch, C.; Dekking, E.H.; Hamer, R.J.; Bosch, D.; Salentijn, E.M.J.; Smulders, M.J.M.; et al. Detailed Analysis of the Expression of an Alpha-gliadin Promoter and the Deposition of Alpha-gliadin Protein During Wheat Grain Development. Ann. Bot. 2008, 102, 331–342. [Google Scholar] [CrossRef] [PubMed]
- Pistón, F.; Marín, S.; Hernando, A.; Barro, F. Analysis of the activity of a γ-gliadin promoter in transgenic wheat and characterization of gliadin synthesis in wheat by MALDI-TOF during grain development. Mol. Breed. 2009, 23, 655–667. [Google Scholar] [CrossRef]
- Vincentz, M.; Bandeira-Kobarg, C.; Gauer, L.; Schlögl, P.; Leite, A. Evolutionary Pattern of Angiosperm bZIP Factors Homologous to the Maize Opaque2 Regulatory Protein. J. Mol. Evol. 2003, 56, 105–116. [Google Scholar] [CrossRef] [PubMed]
- Onodera, Y.; Suzuki, A.; Wu, C.; Washida, H.; Takaiwa, F. A Rice Functional Transcriptional Activator, RISBZ1, Responsible for Endosperm-specific Expression of Storage Protein Genes through GCN4 Motif. J. Biol. Chem. 2001, 276, 14139–14152. [Google Scholar] [CrossRef]
- Plessis, A.; Ravel, C.; Bordes, J.; Balfourier, F.; Martre, P. Association study of wheat grain protein composition reveals that gliadin and glutenin composition are trans-regulated by different chromosome regions. J. Exp. Bot. 2013, 64, 3627–3644. [Google Scholar] [CrossRef]
- Singh, A.; Kumar, P.; Sharma, M.; Tuli, R.; Dhaliwal, H.S.; Chaudhury, A.; Pal, D.; Roy, J. Expression patterns of genes involved in starch biosynthesis during seed development in bread wheat (Triticum aestivum). Mol. Breed. 2015, 35, 184. [Google Scholar] [CrossRef]
- Howard, T.; Rejab, N.A.; Griffiths, S.; Leigh, F.; Leverington-Waite, M.; Simmonds, J.; Uauy, C.; Trafford, K. Identification of a major QTL controlling the content of B-type starch granules in Aegilops. J. Exp. Bot. 2011, 62, 2217–2228. [Google Scholar] [CrossRef]
- Lindeboom, N.; Chang, P.R.; Tyler, R.T. Analytical, biochemical and physicochemical aspects of starch granule size, with emphasis on small granule starches: A review. Starch-Starke 2004, 56, 89–99. [Google Scholar] [CrossRef]
- Zheng, Y.; Wang, Z. Protein accumulation in aleurone cells, sub-aleurone cells and the center starch endosperm of cereals. Plant Cell Rep. 2014, 33, 1607–1615. [Google Scholar] [CrossRef]
- Méchin, V.; Thévenot, C.; Le Guilloux, M.; Prioul, J.; Damerval, C. Developmental Analysis of Maize Endosperm Proteome Suggests a Pivotal Role for Pyruvate Orthophosphate Dikinase. Plant Physiol. 2007, 143, 1203–1219. [Google Scholar] [CrossRef] [PubMed]
- Manicacci, D.; Camus-Kulandaivelu, L.; Fourmann, M.; Arar, C.; Barrault, S.; Rousselet, A.; Feminias, N.; Consoli, L.; Francès, L.; Méchin, V.; et al. Epistatic Interactions between Opaque2 Transcriptional Activator and Its Target Gene CyPPDK1 Control Kernel Trait Variation in Maize. Plant Physiol. 2009, 150, 506–520. [Google Scholar] [CrossRef] [PubMed]
- Zhang, L.; Zhao, L.; Lin, L.; Zhao, L.; Liu, Q.; Wei, C. A Novel Mutation of OsPPDKB, Encoding Pyruvate Orthophosphate Dikinase, Affects Metabolism and Structure of Starch in the Rice Endosperm. Int. J. Mol. Sci. 2018, 19, 2268. [Google Scholar] [CrossRef] [PubMed]
- Satoh, H.; Shibahara, K.; Tokunaga, T.; Nishi, A.; Tasaki, M.; Hwang, S.; Okita, T.W.; Kaneko, N.; Fujita, N.; Yoshida, M.; et al. Mutation of the Plastidial α-Glucan Phosphorylase Gene in Rice Affects the Synthesis and Structure of Starch in the Endosperm. Plant Cell 2008, 20, 1833–1849. [Google Scholar] [CrossRef]
- Sun, C.; Yang, F.; Zhang, T.; Sui, X.; Liang, R.; Liu, Q.; Zhang, X.; Li, B. Down-Regulation of the Expression of Grain ppo Genes to Improve Wheat Dough Whiteness by RNA Interference. Sci. Agric. Sin. 2013, 46, 1104–1113. [Google Scholar] [CrossRef]
- Wang, K.; Liu, H.; Du, L.; Ye, X. Generation of marker-free transgenic hexaploid wheat via an Agrobacterium-mediated co-transformation strategy in commercial Chinese wheat varieties. Plant Biotechnol. J. 2017, 15, 614–623. [Google Scholar] [CrossRef]
- Han, C.; Lu, X.; Yu, Z.; Li, X.; Ma, W.; Yan, Y. Rapid separation of seed gliadins by reversed-phase ultra performance liquid chromatography (RP-UPLC) and its application in wheat cultivar and germplasm identification. Biosci. Biotechnol. Biochem. 2015, 79, 808–815. [Google Scholar] [CrossRef]
- Yan, X.; Liu, W.; Yu, Z.; Han, C.; Zeller, F.J.; Hsam, S.L.K.; Yan, Y. Rapid separation and identification of wheat HMW glutenin subunits by UPLC and comparative analysis with HPLC. Aust. J. Crop Sci. 2014, 8, 140–147. [Google Scholar]
- Yu, Z.; Han, C.; Yan, X.; Li, X.; Jiang, G.; Yan, Y. Rapid Characterization of Wheat Low Molecular Weight Glutenin Subunits by Ultraperformance Liquid Chromatography (UPLC). J. Agric. Food Chem. 2013, 61, 4026–4034. [Google Scholar] [CrossRef]
- Borrill, P.; Harrington, S.A.; Simmonds, J.; Uauy, C. Identification of Transcription Factors Regulating Senescence in Wheat through Gene Regulatory Network Modelling. Plant Physiol. 2019, 180, 1740–1755. [Google Scholar] [CrossRef]
- Ramirez-Gonzalez, R.H.; Borrill, P.; Lang, D.; Harrington, S.A.; Brinton, J.; Venturini, L.; Davey, M.; Jacobs, J.; van Ex, F.; Pasha, A.; et al. The transcriptional landscape of polyploid wheat. Science 2018, 361, 662. [Google Scholar] [CrossRef] [PubMed]
- Liu, K.; Cao, J.; Yu, K.; Liu, X.; Gao, Y.; Chen, Q.; Zhang, W.; Peng, H.; Du, J.; Xin, M.; et al. Wheat TaSPL8 Modulates Leaf Angle Through Auxin and Brassinosteroid Signaling. Plant Physiol. 2019, 181, 179–194. [Google Scholar] [CrossRef] [PubMed]
- Hellens, R.P.; Allan, A.C.; Friel, E.N.; Bolitho, K.; Grafton, K.; Templeton, M.D.; Karunairetnam, S.; Gleave, A.P.; Laing, W.A. Transient expression vectors for functional genomics, quantification of promoter activity and RNA silencing in plants. Plant Methods 2005, 1, 13. [Google Scholar] [CrossRef] [PubMed]


© 2020 by the authors. Licensee MDPI, Basel, Switzerland. This article is an open access article distributed under the terms and conditions of the Creative Commons Attribution (CC BY) license (http://creativecommons.org/licenses/by/4.0/).