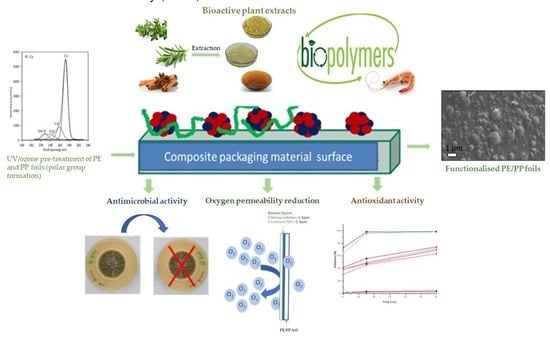
Bioactive Characterization of Packaging Foils Coated by Chitosan and Polyphenol Colloidal Formulations


 , ,
, , 

Abstract
1. Introduction
2. Results and Discussion
2.1. Dispersion Characterization
2.1.1. Minimal Inhibitory Concentration (MIC)
2.1.2. Total Phenolic Content
2.2. Functional Foils
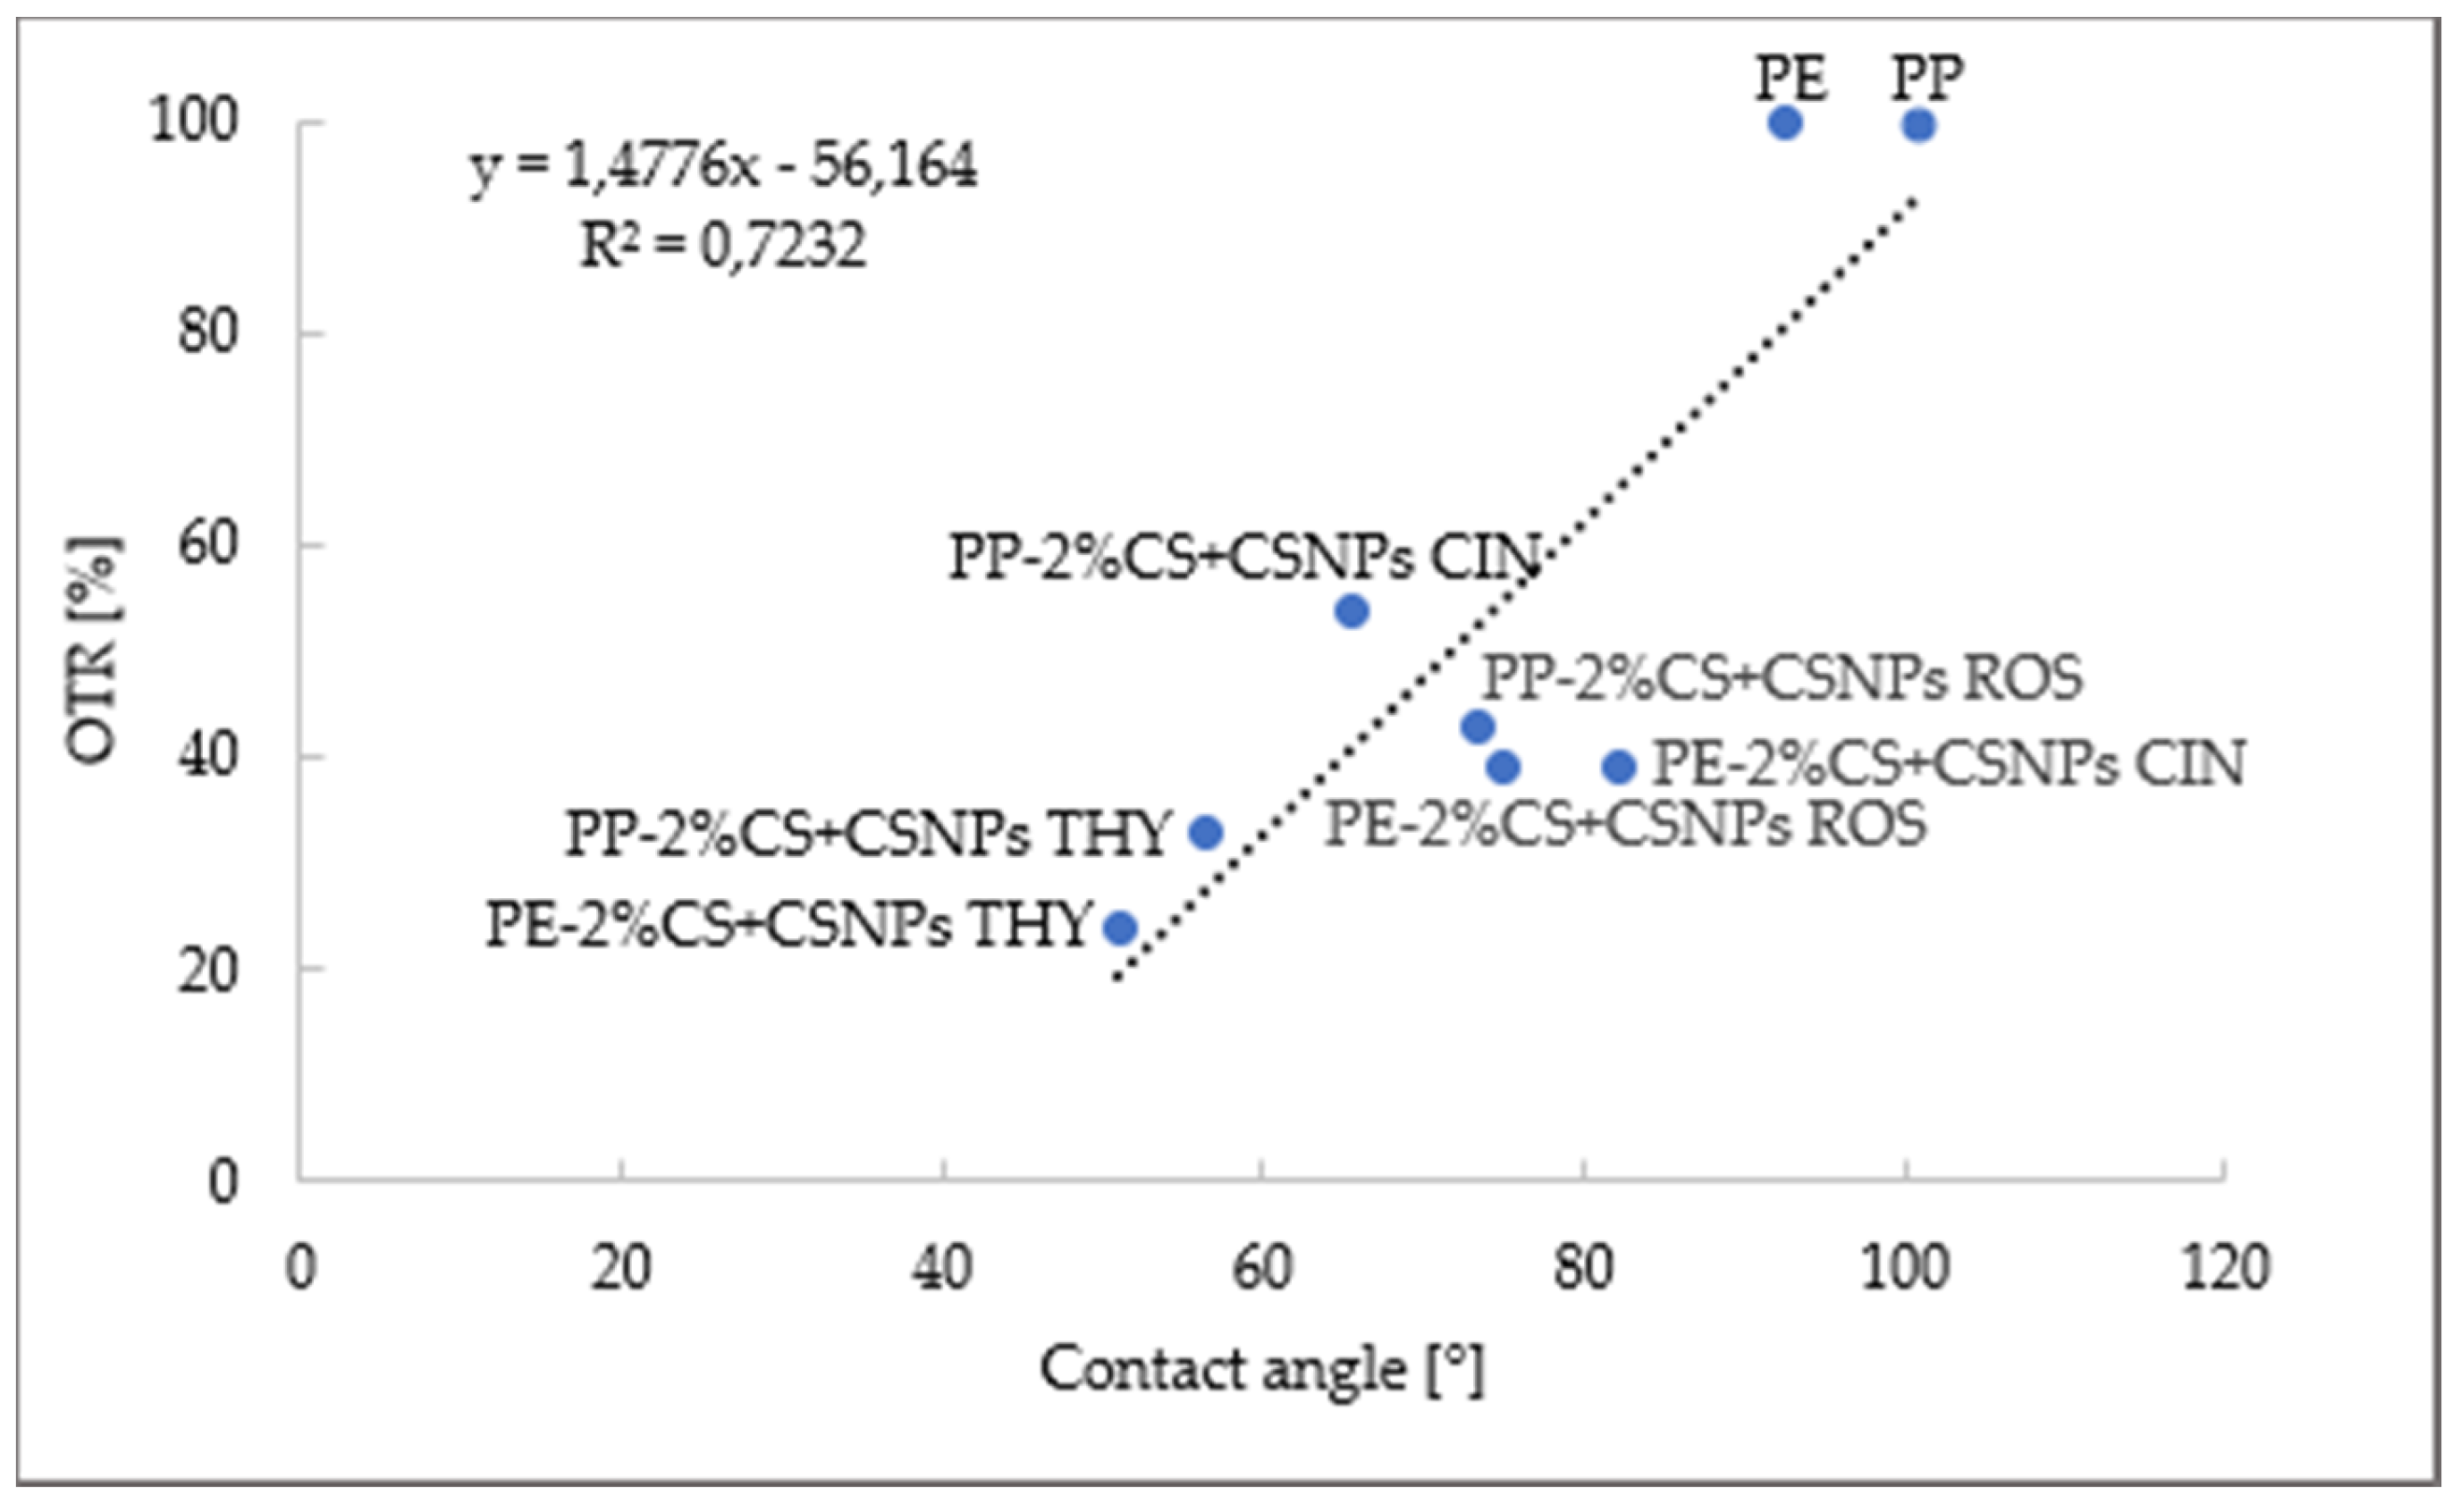
2.2.1. Oxygen Permeability
2.2.2. Desorption Experiment
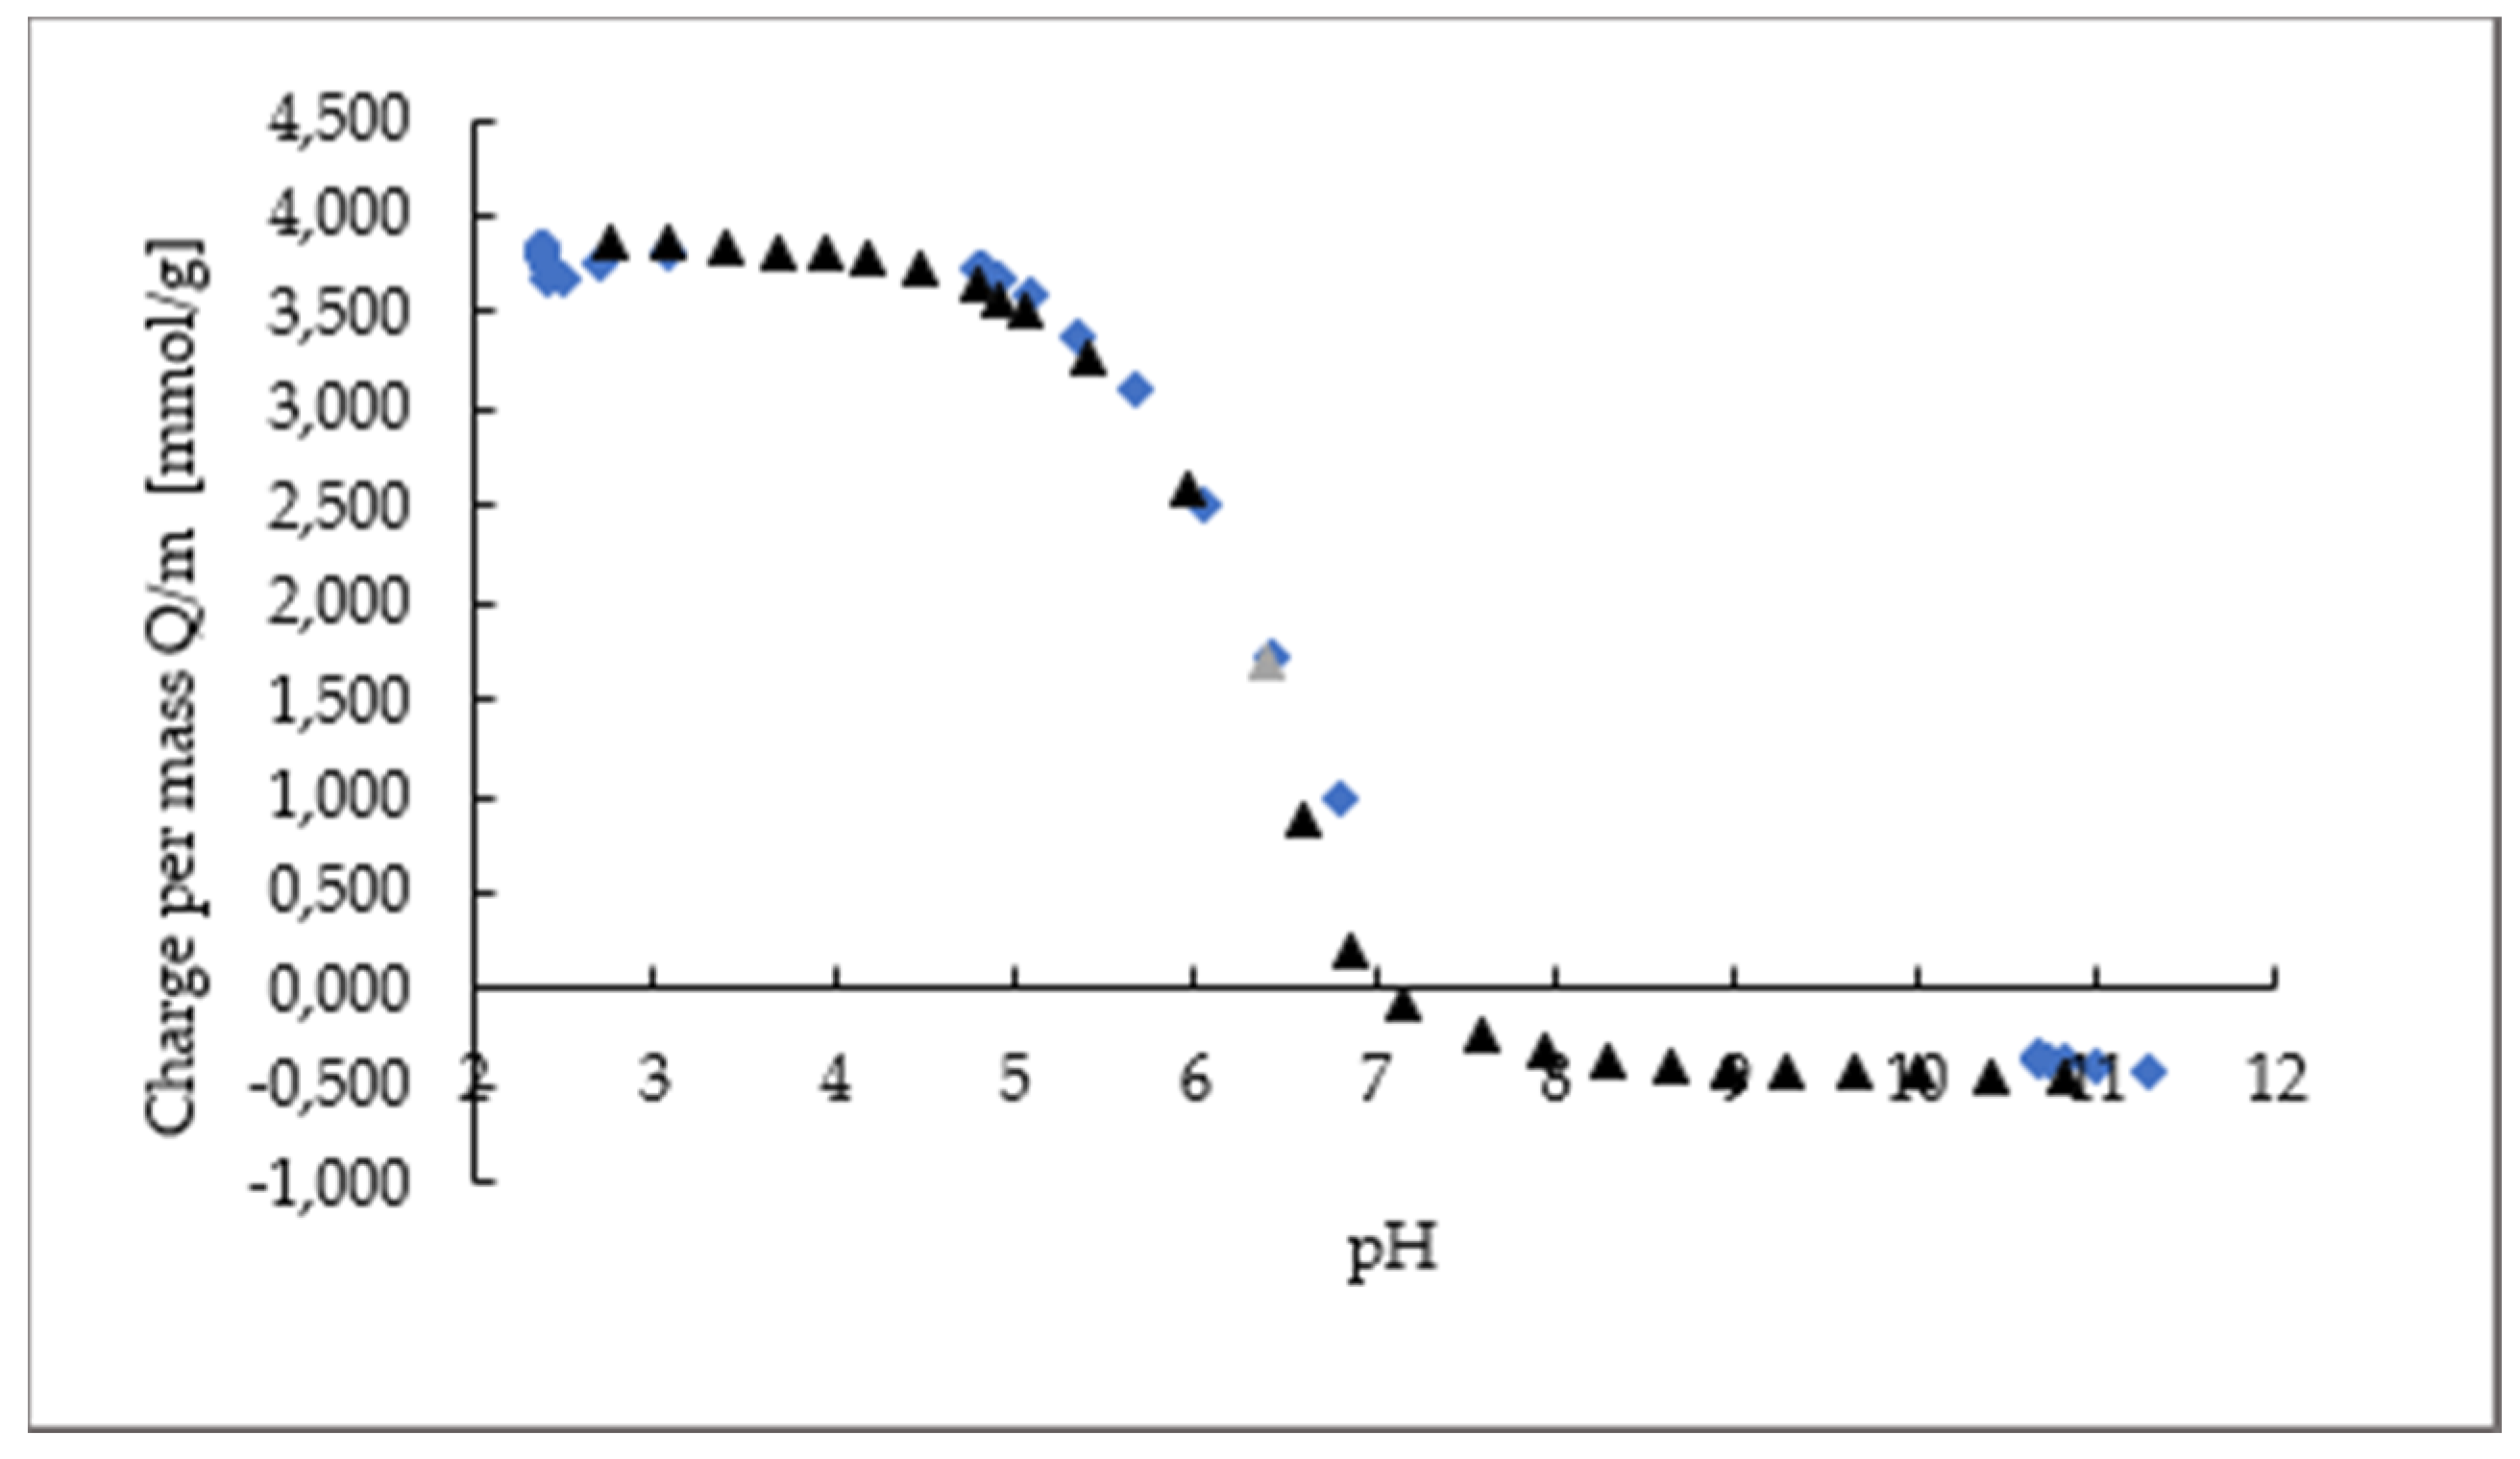
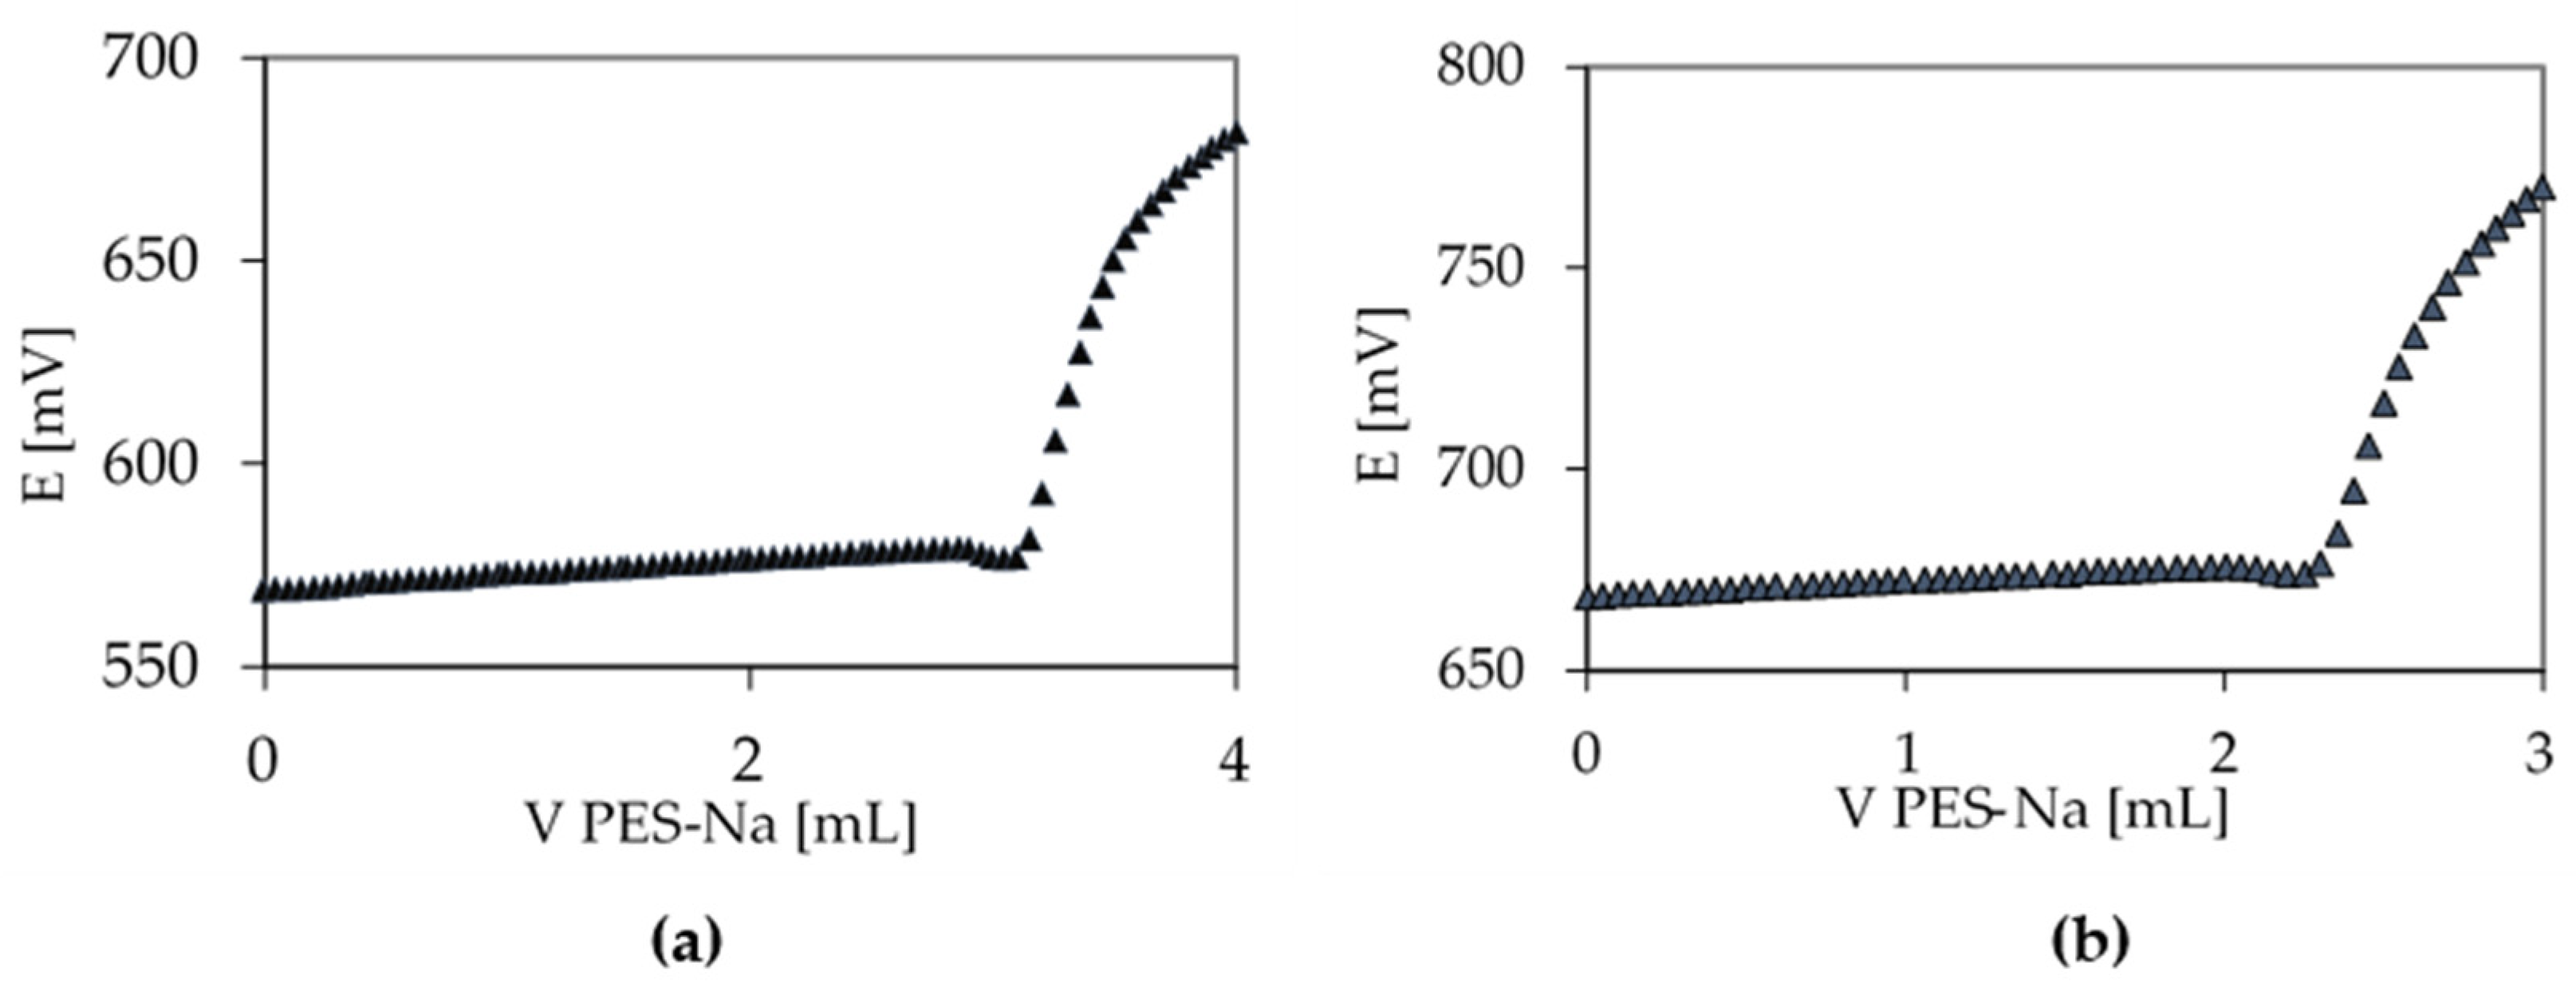
Polyelectrolyte Titration
Desorption of Extracts Using UV–Vis Spectroscopy
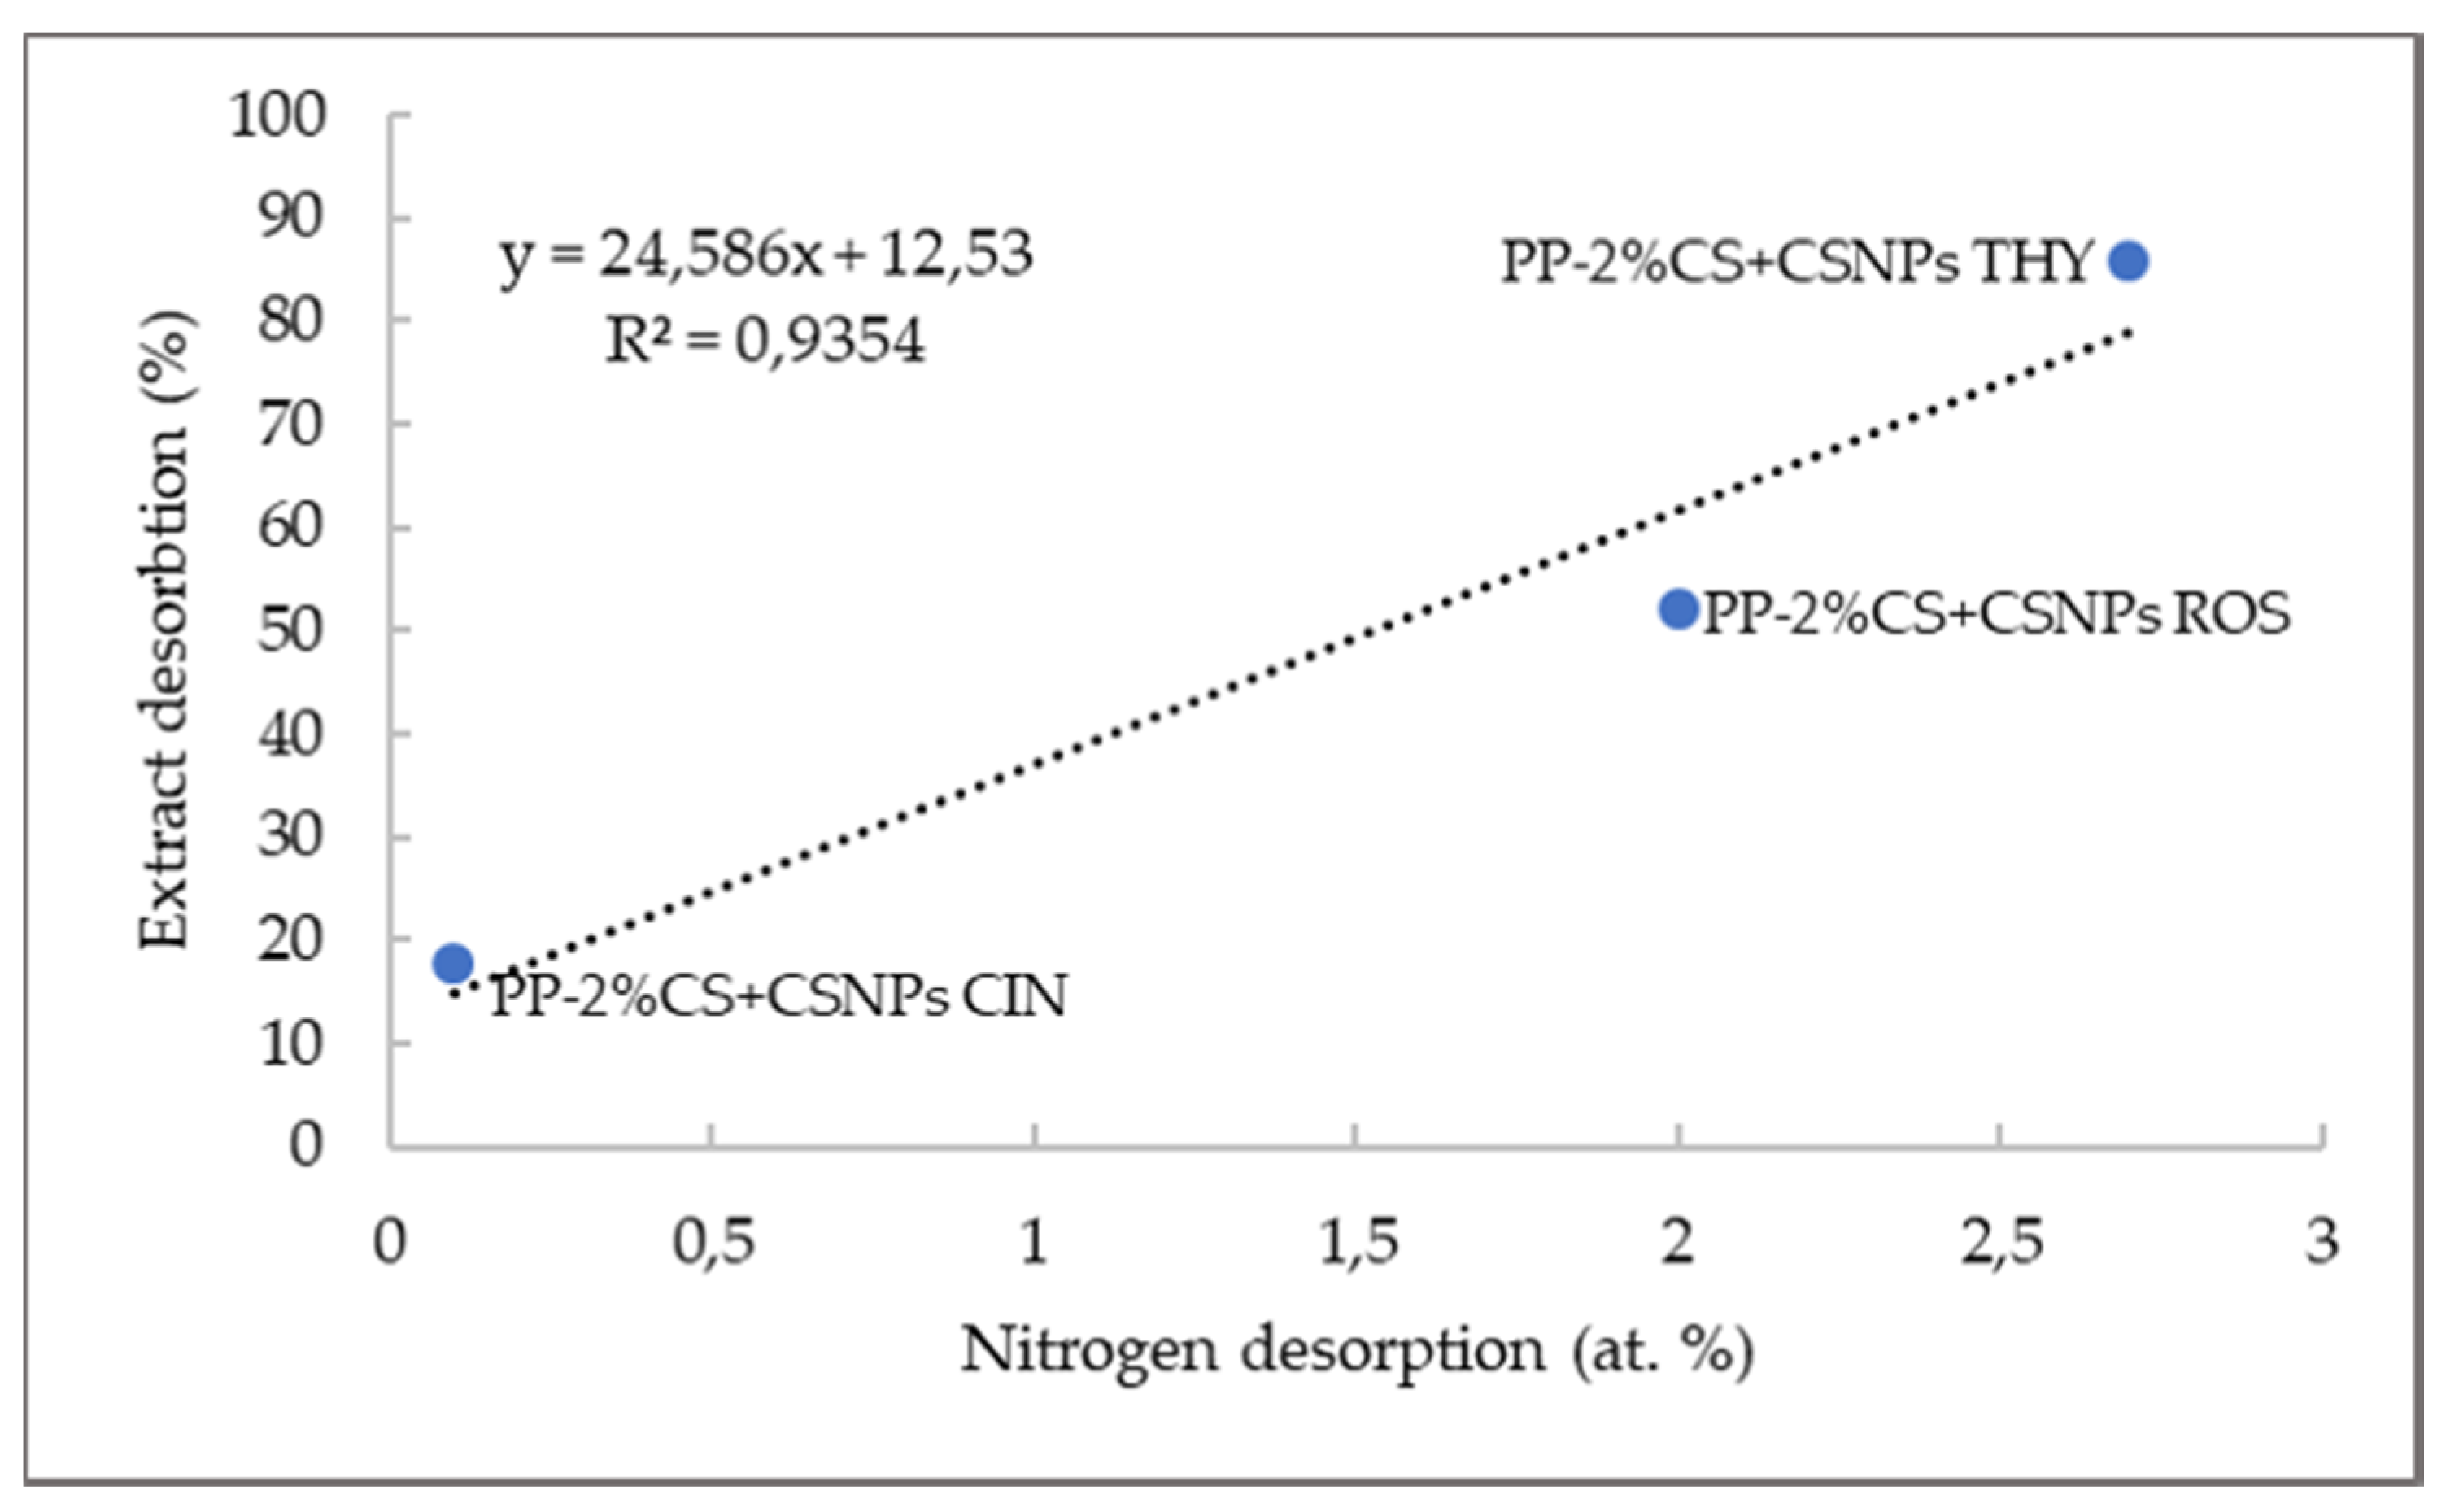
Overall Desorption from PE and PP by XPS
2.2.3. Bioactivity
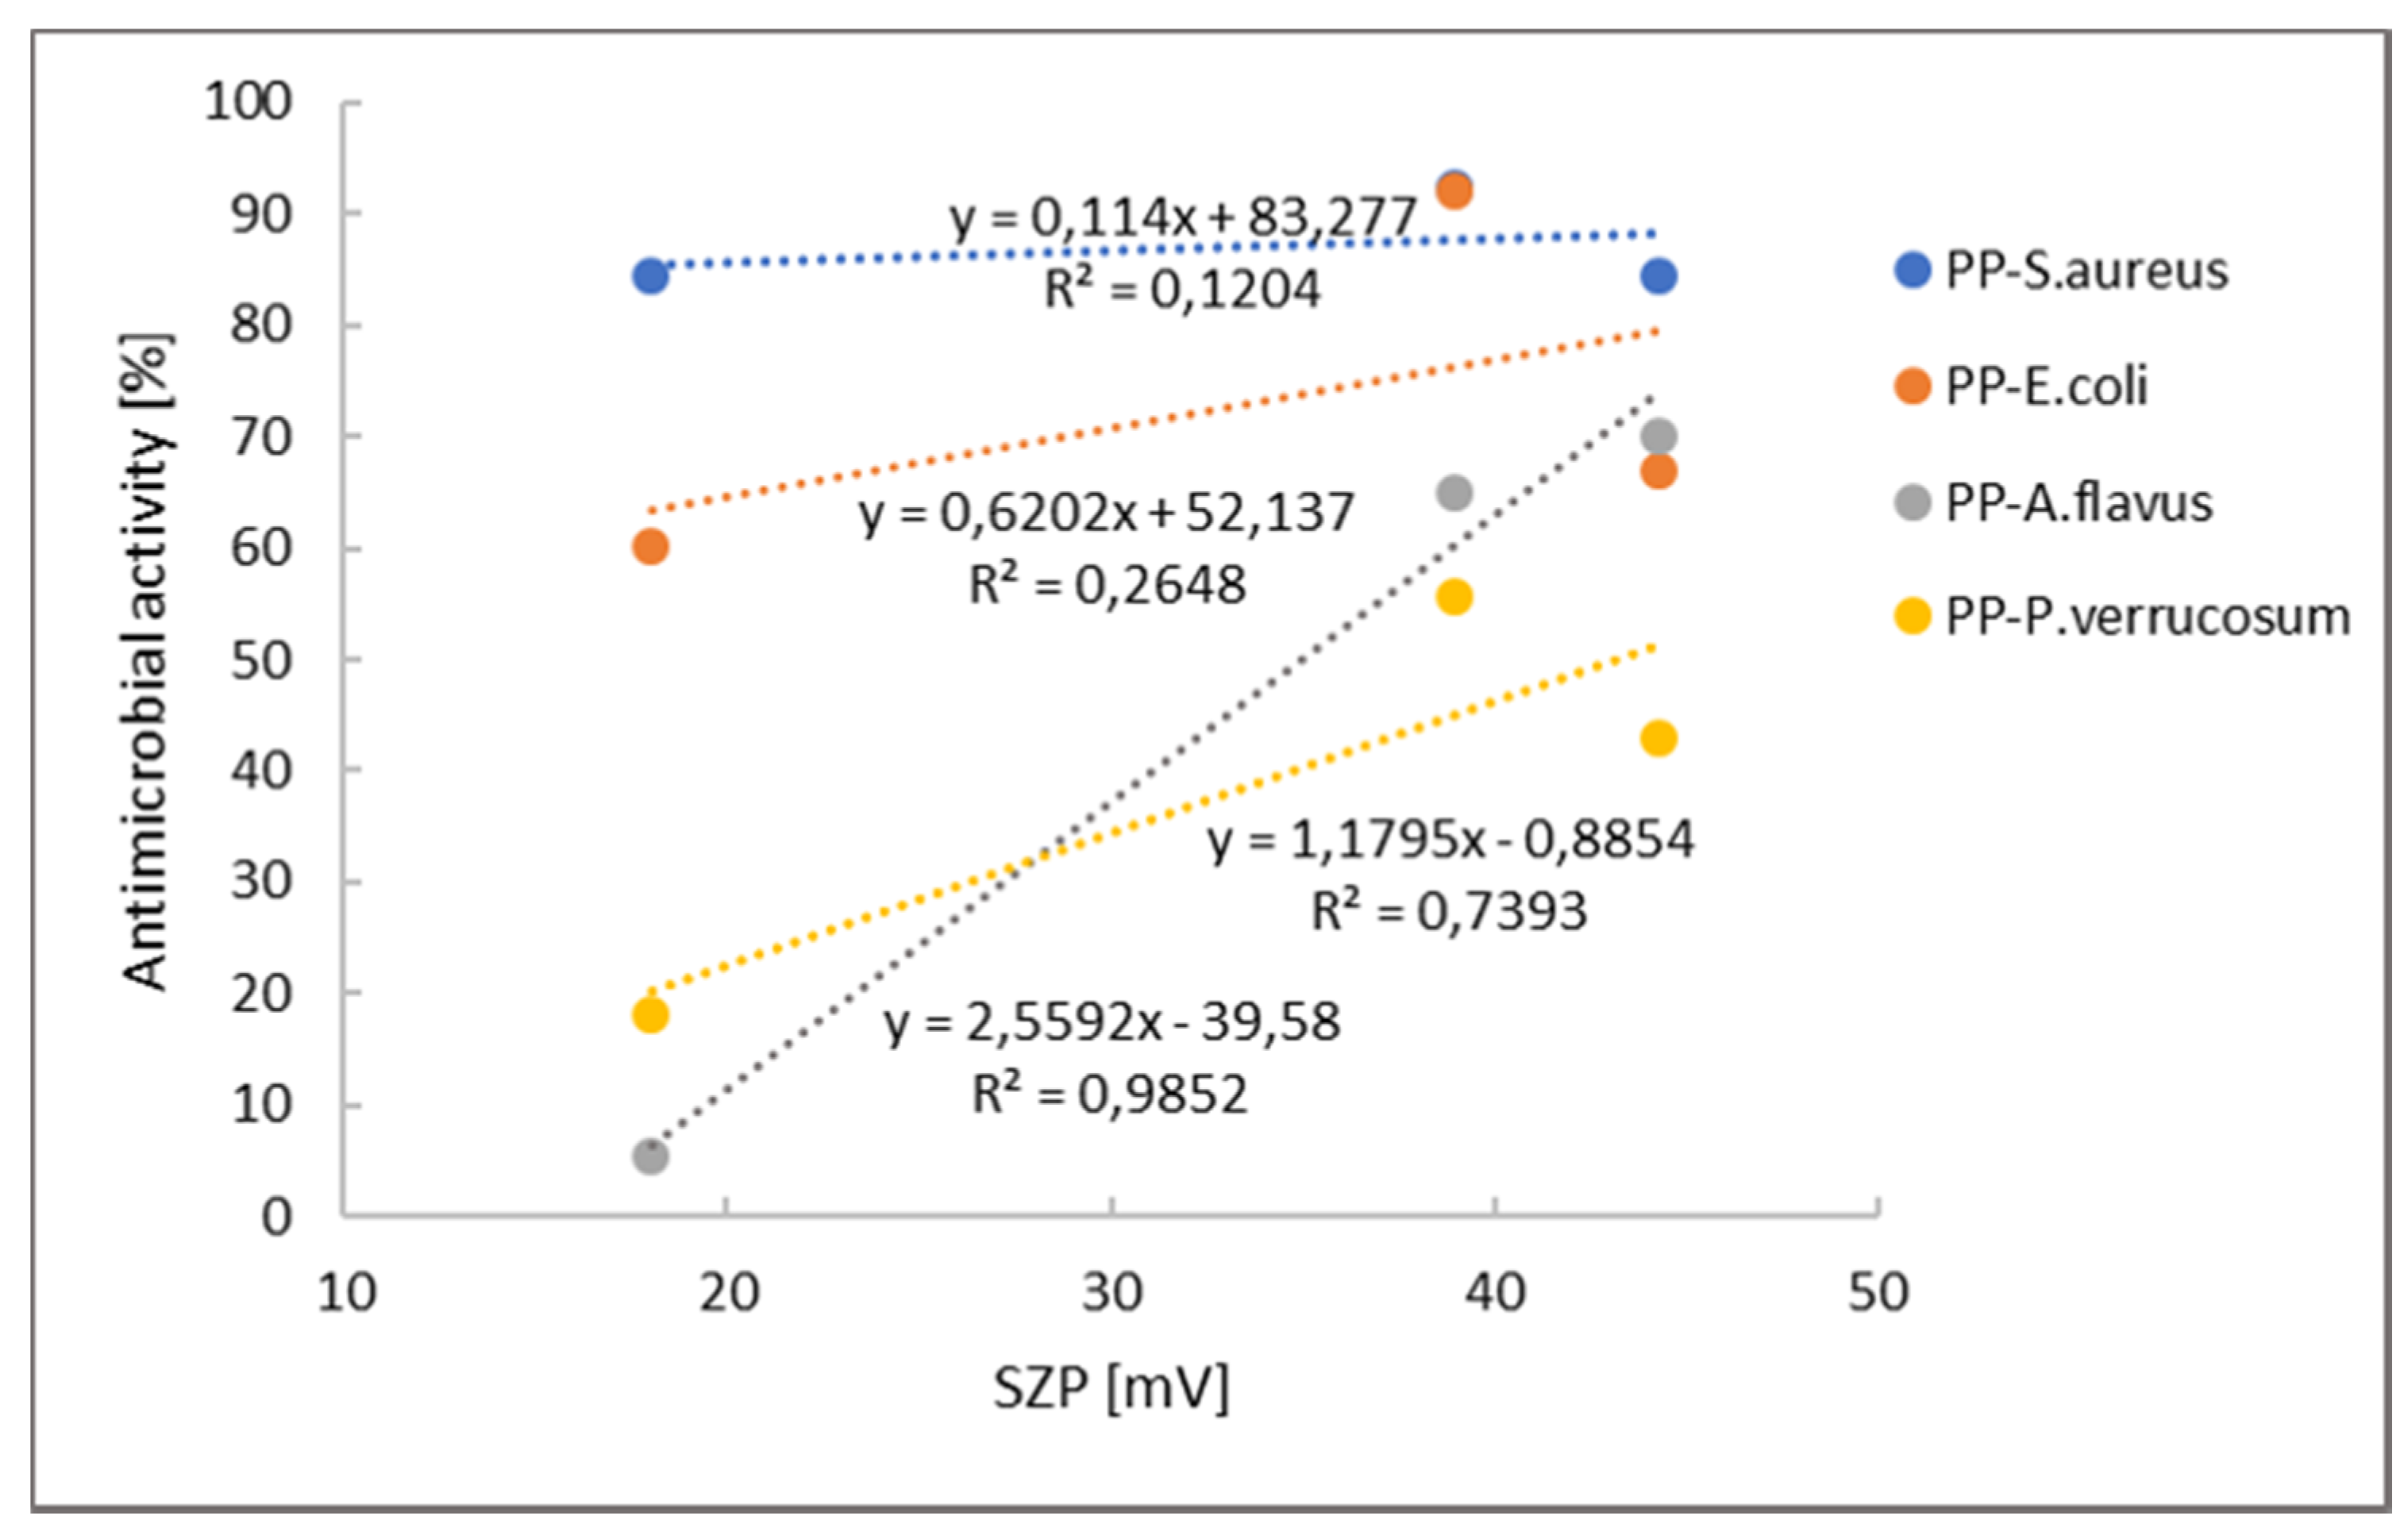
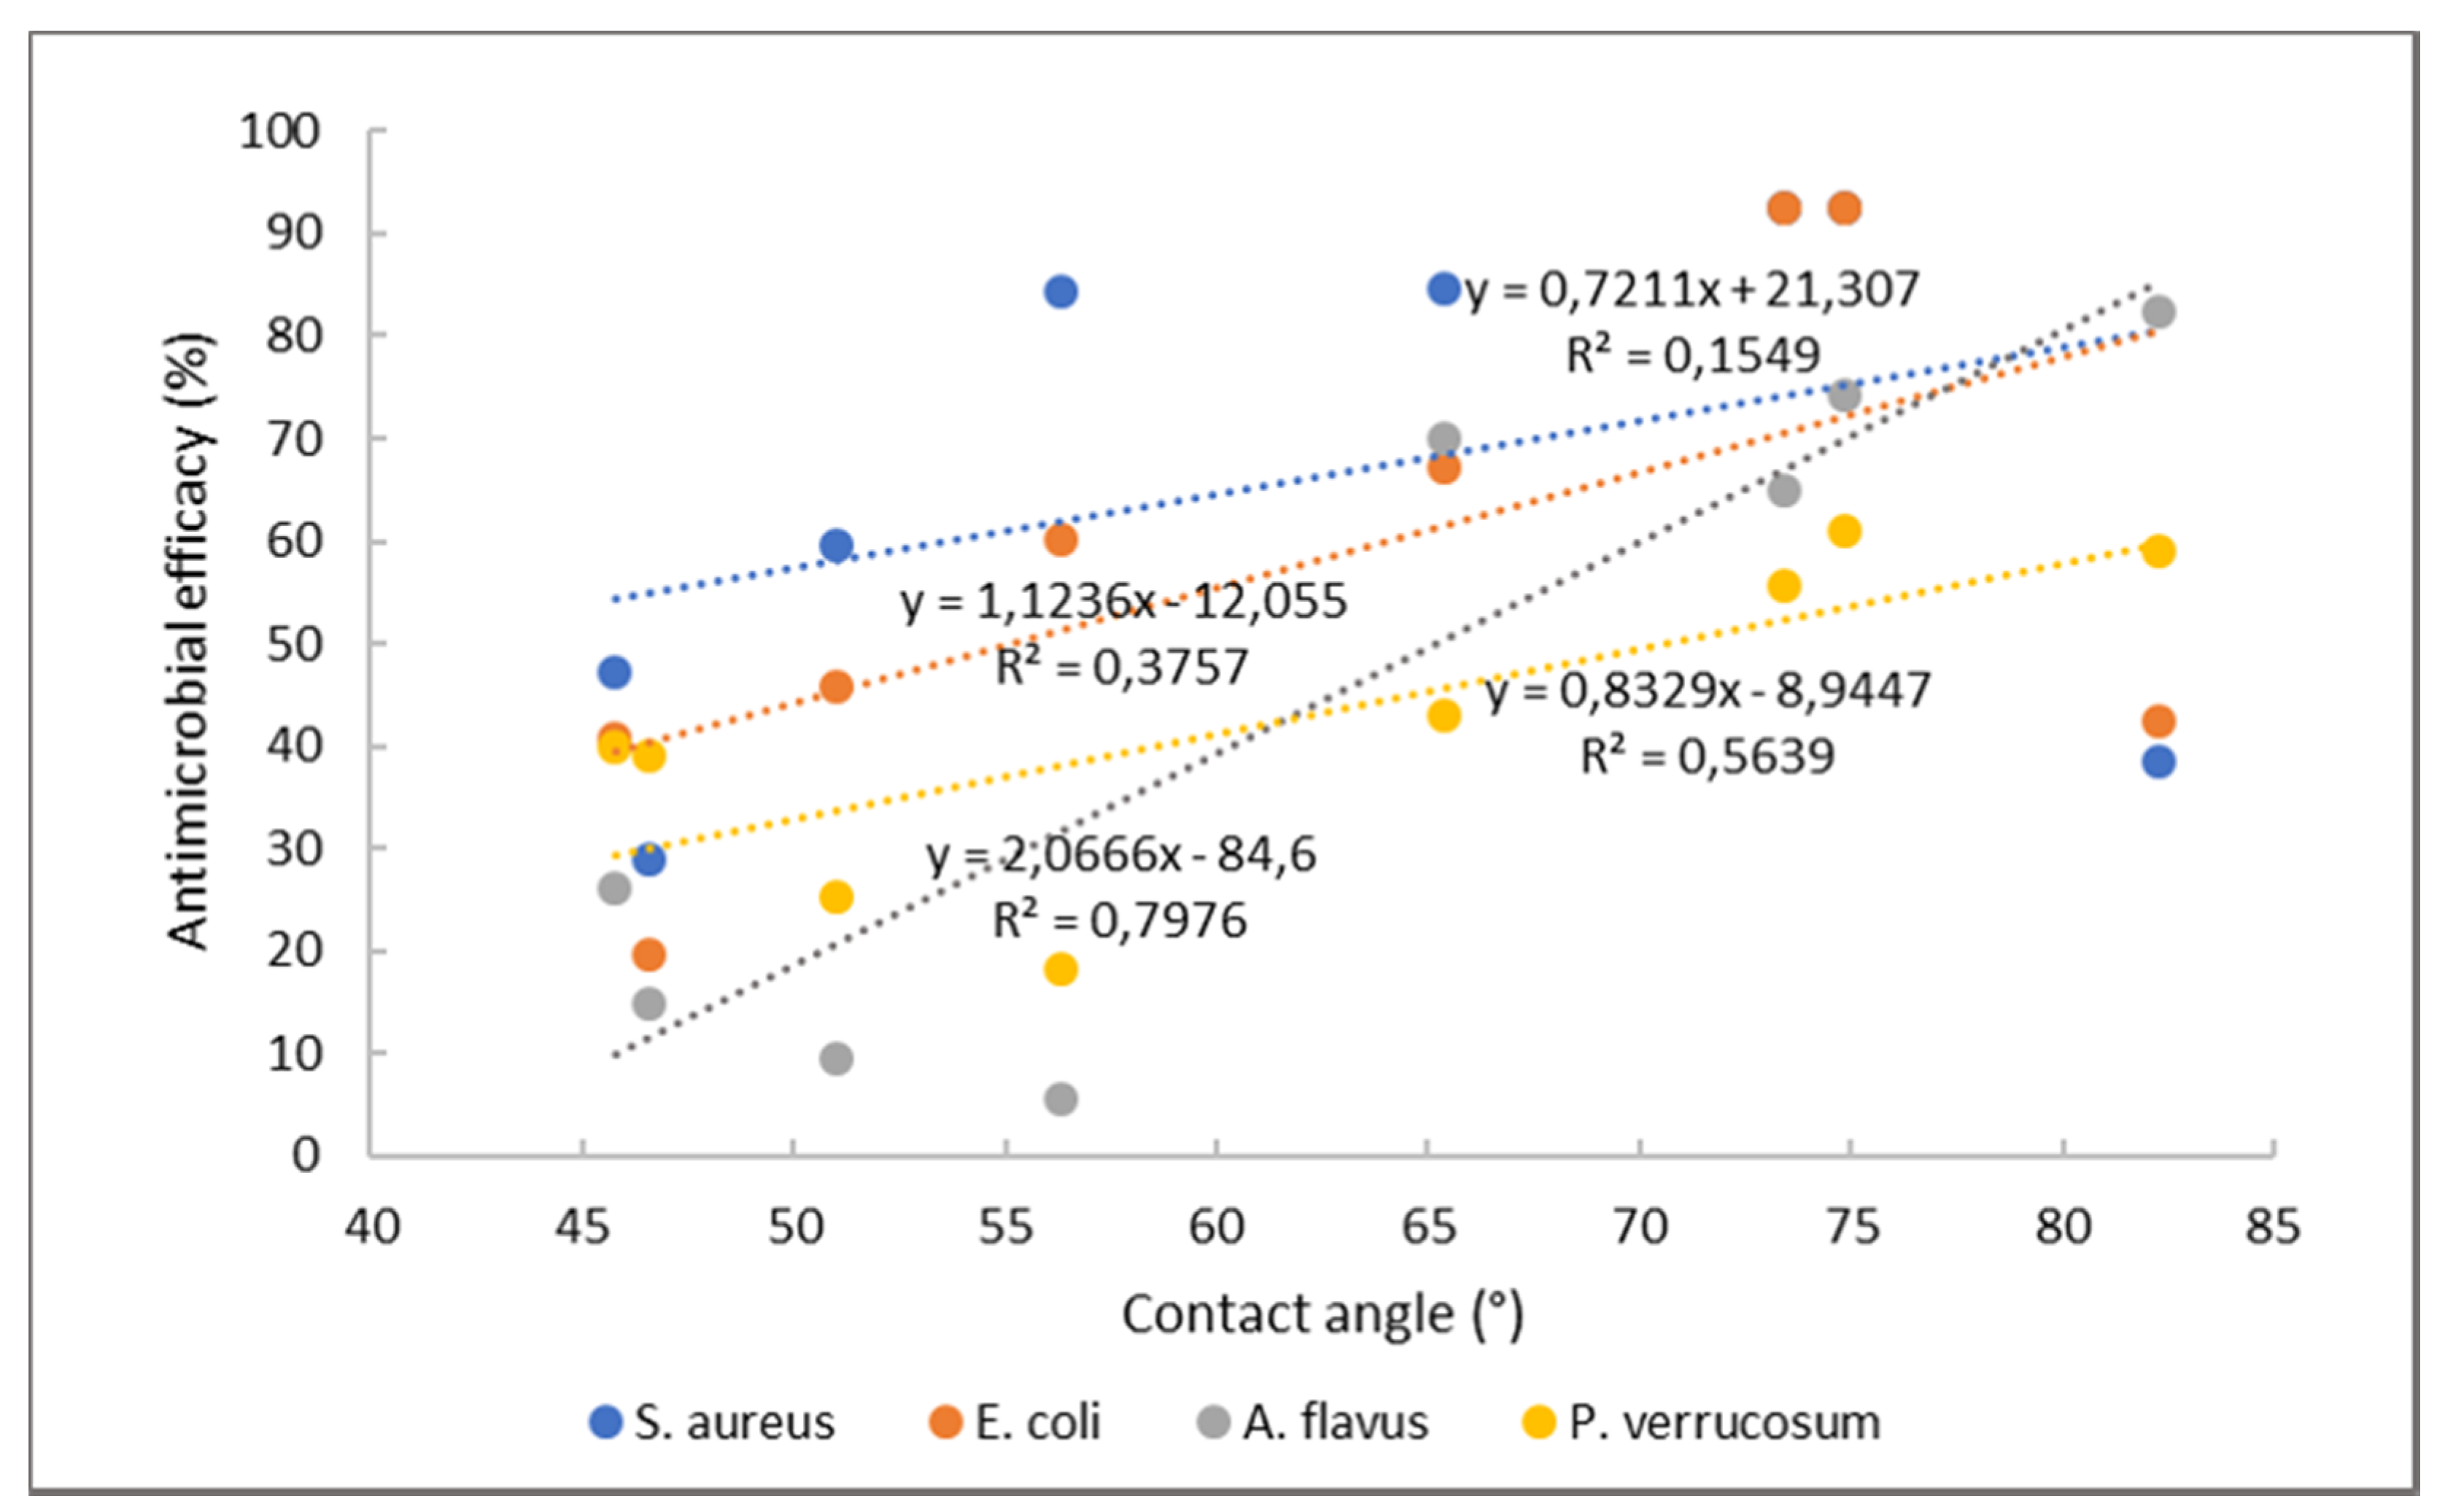
Antimicrobial Activity
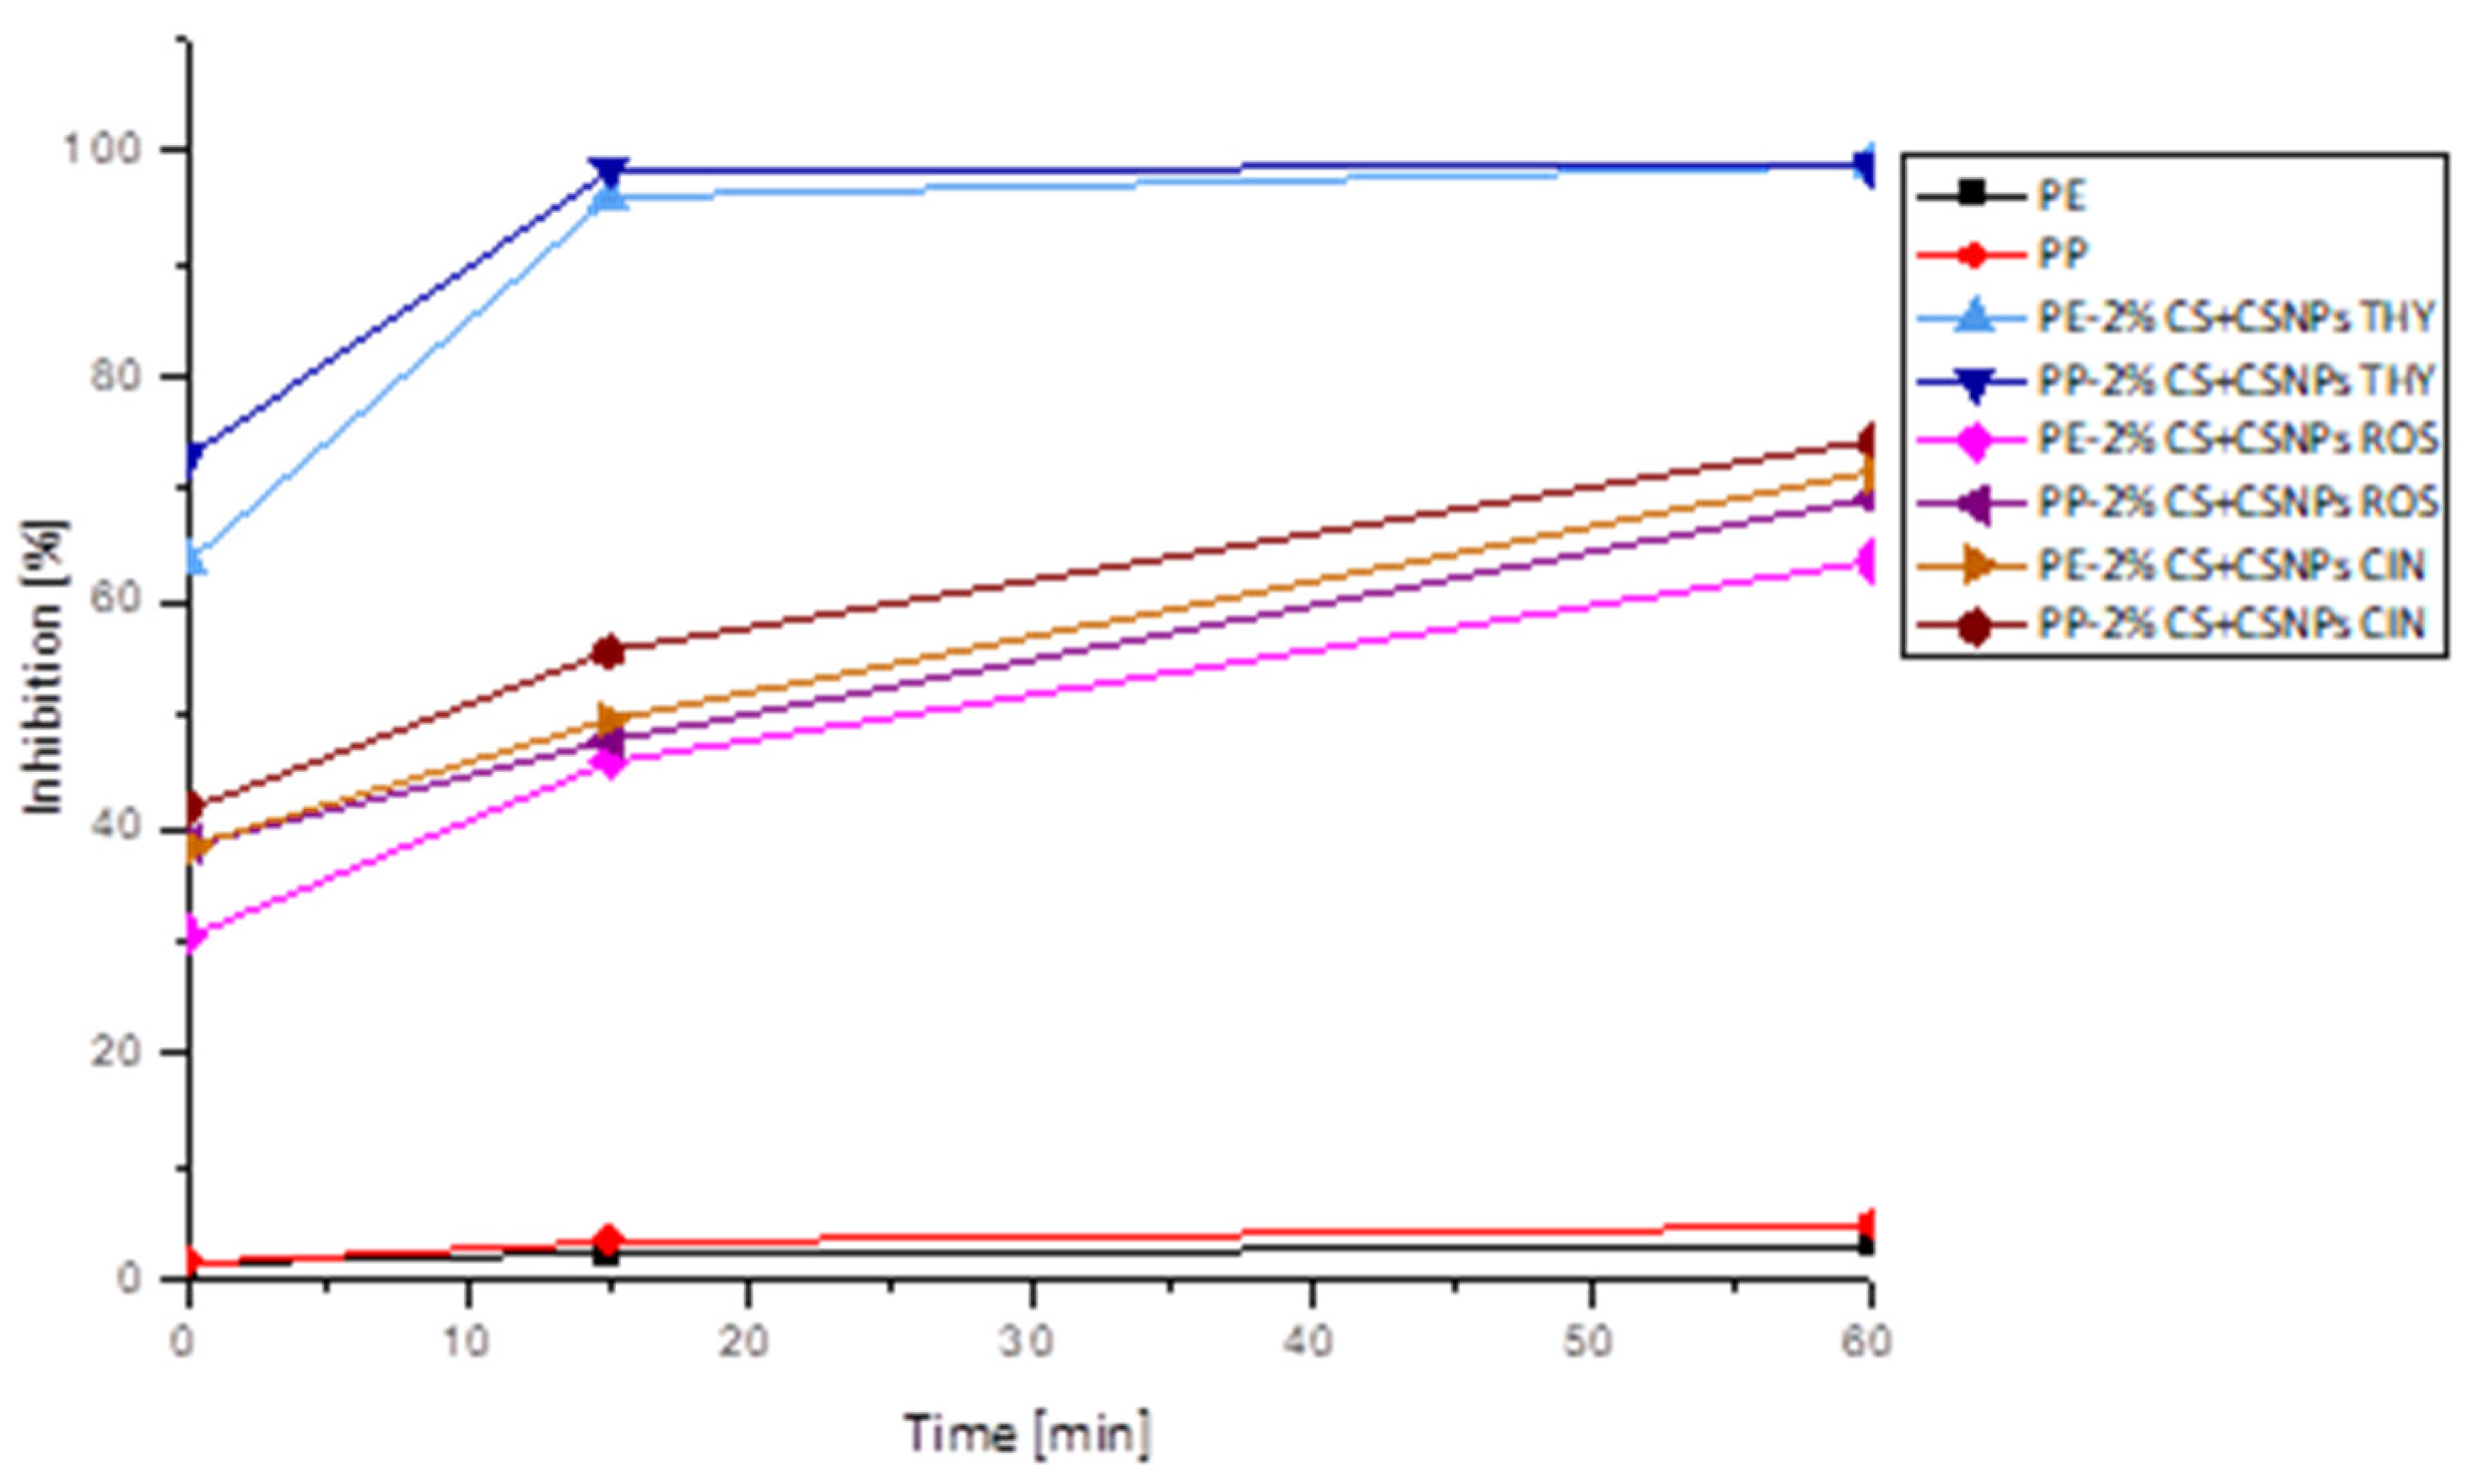
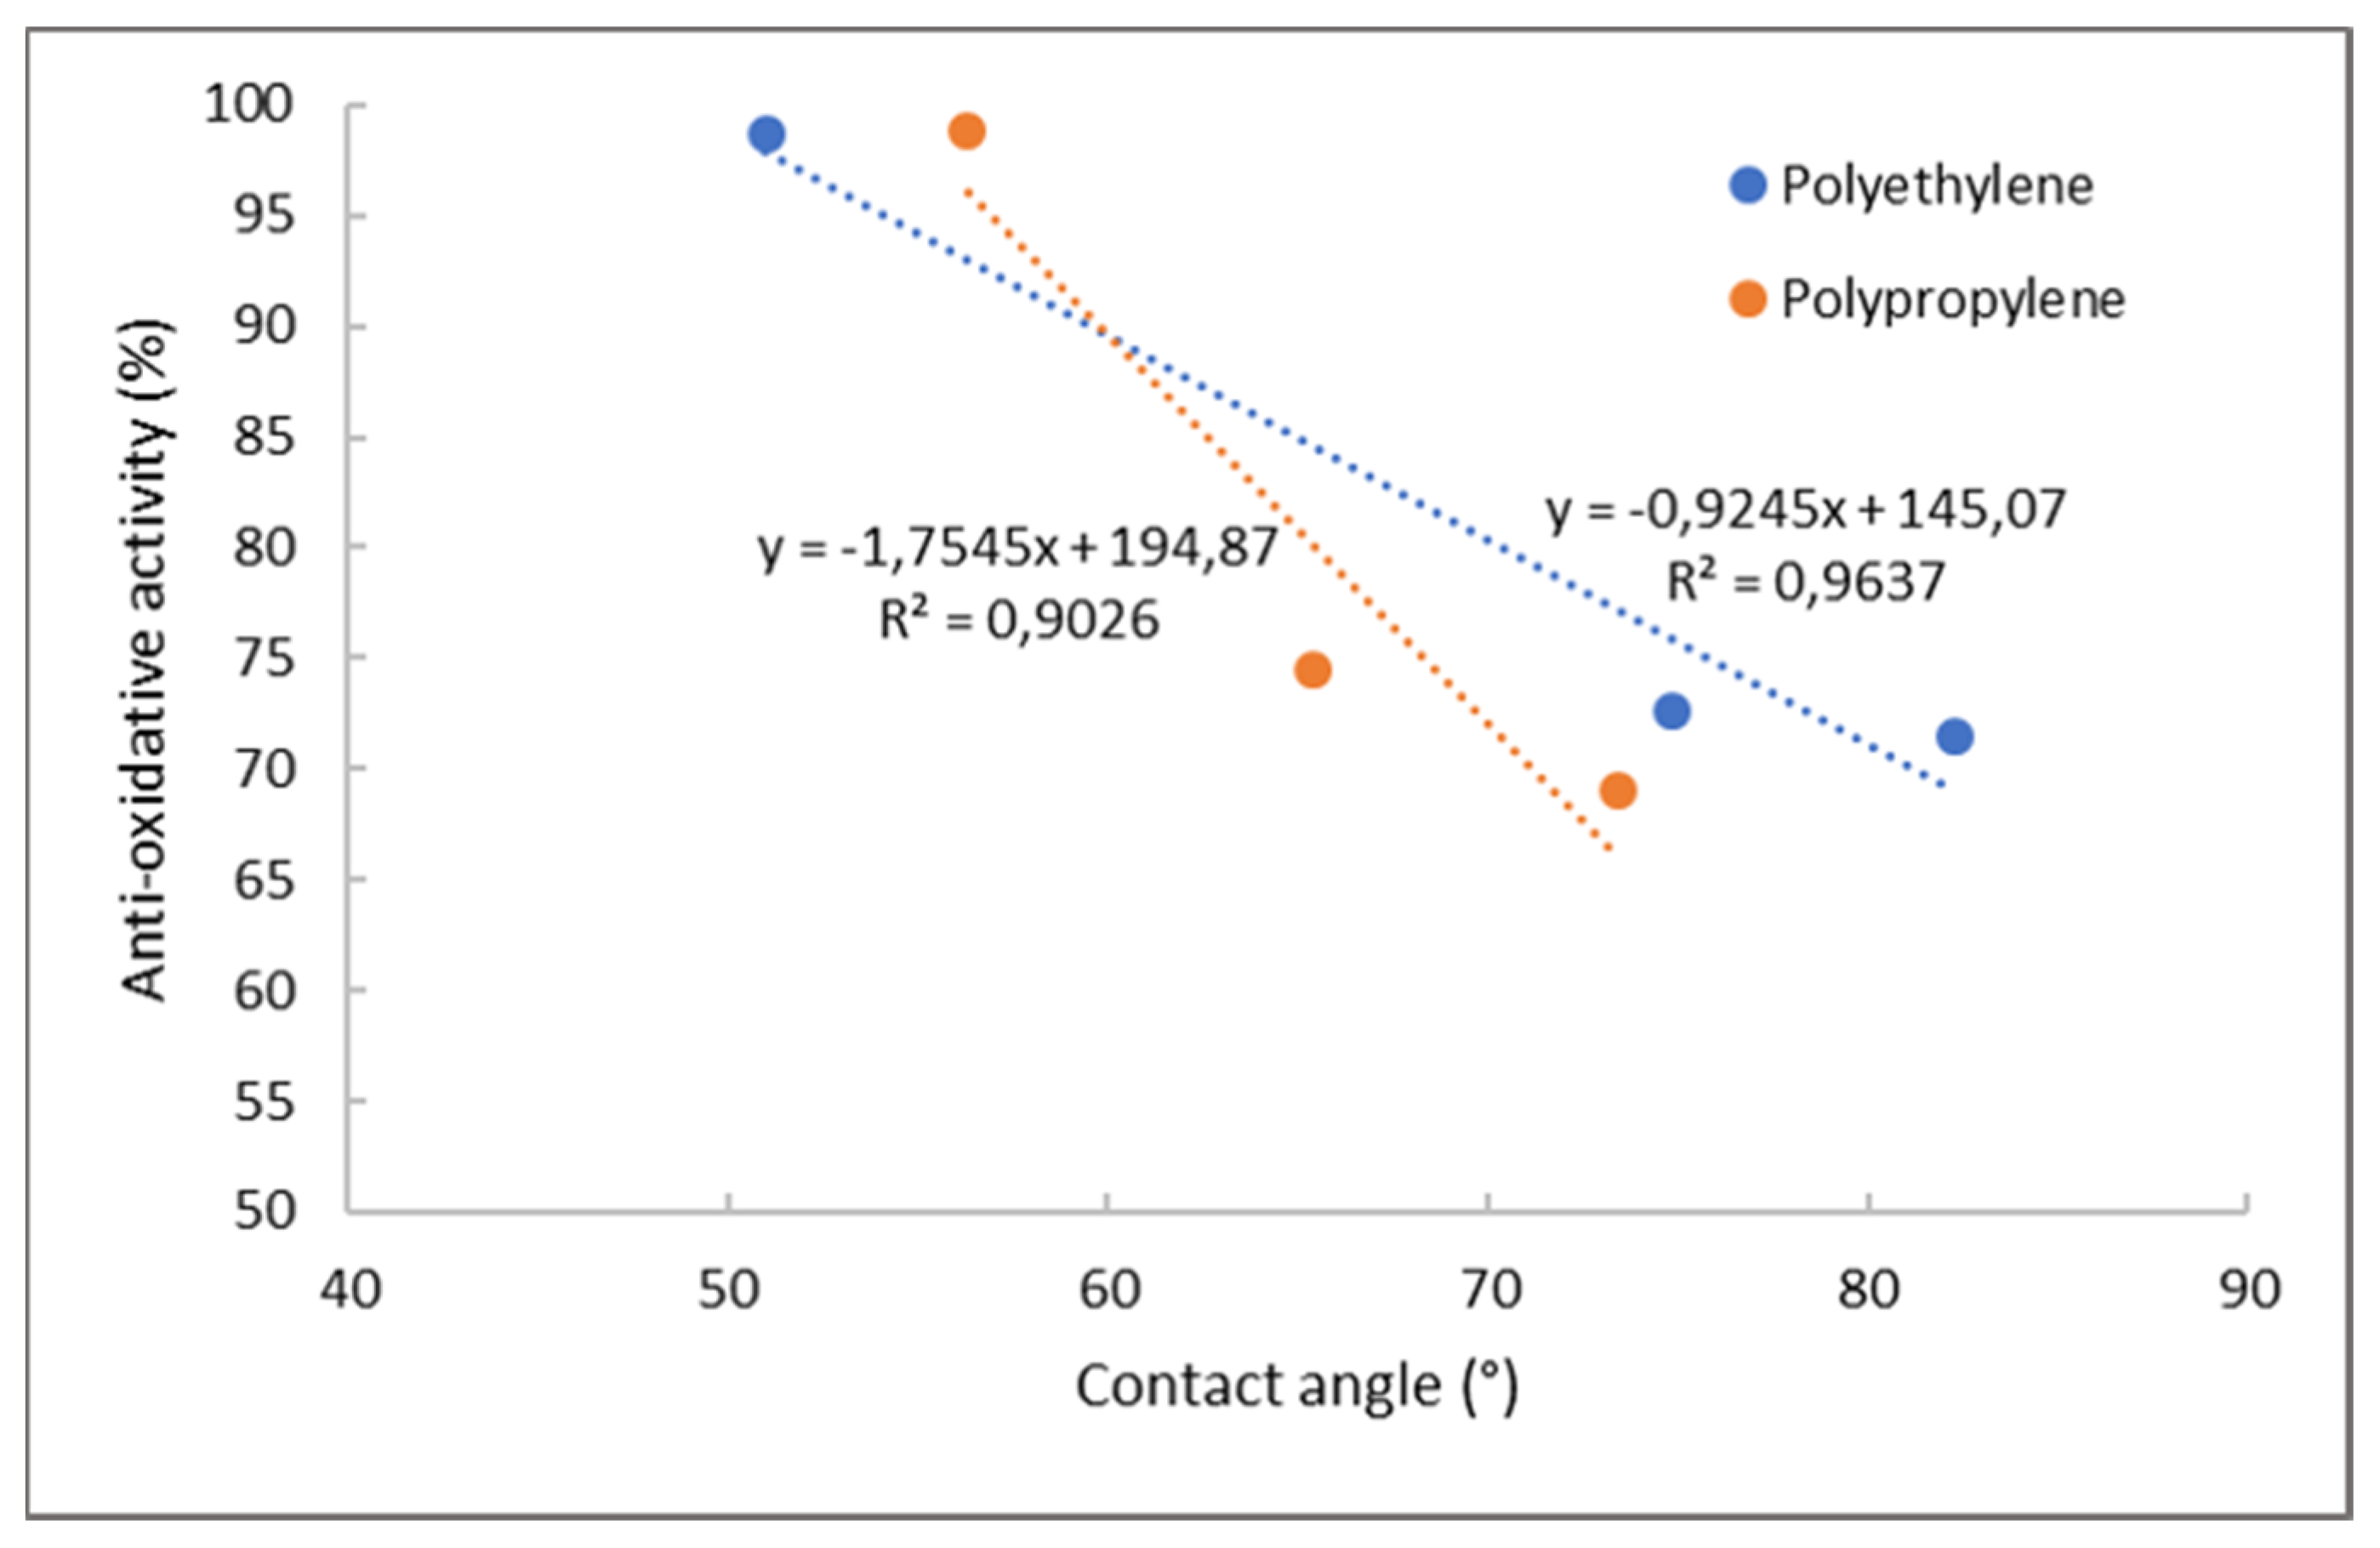
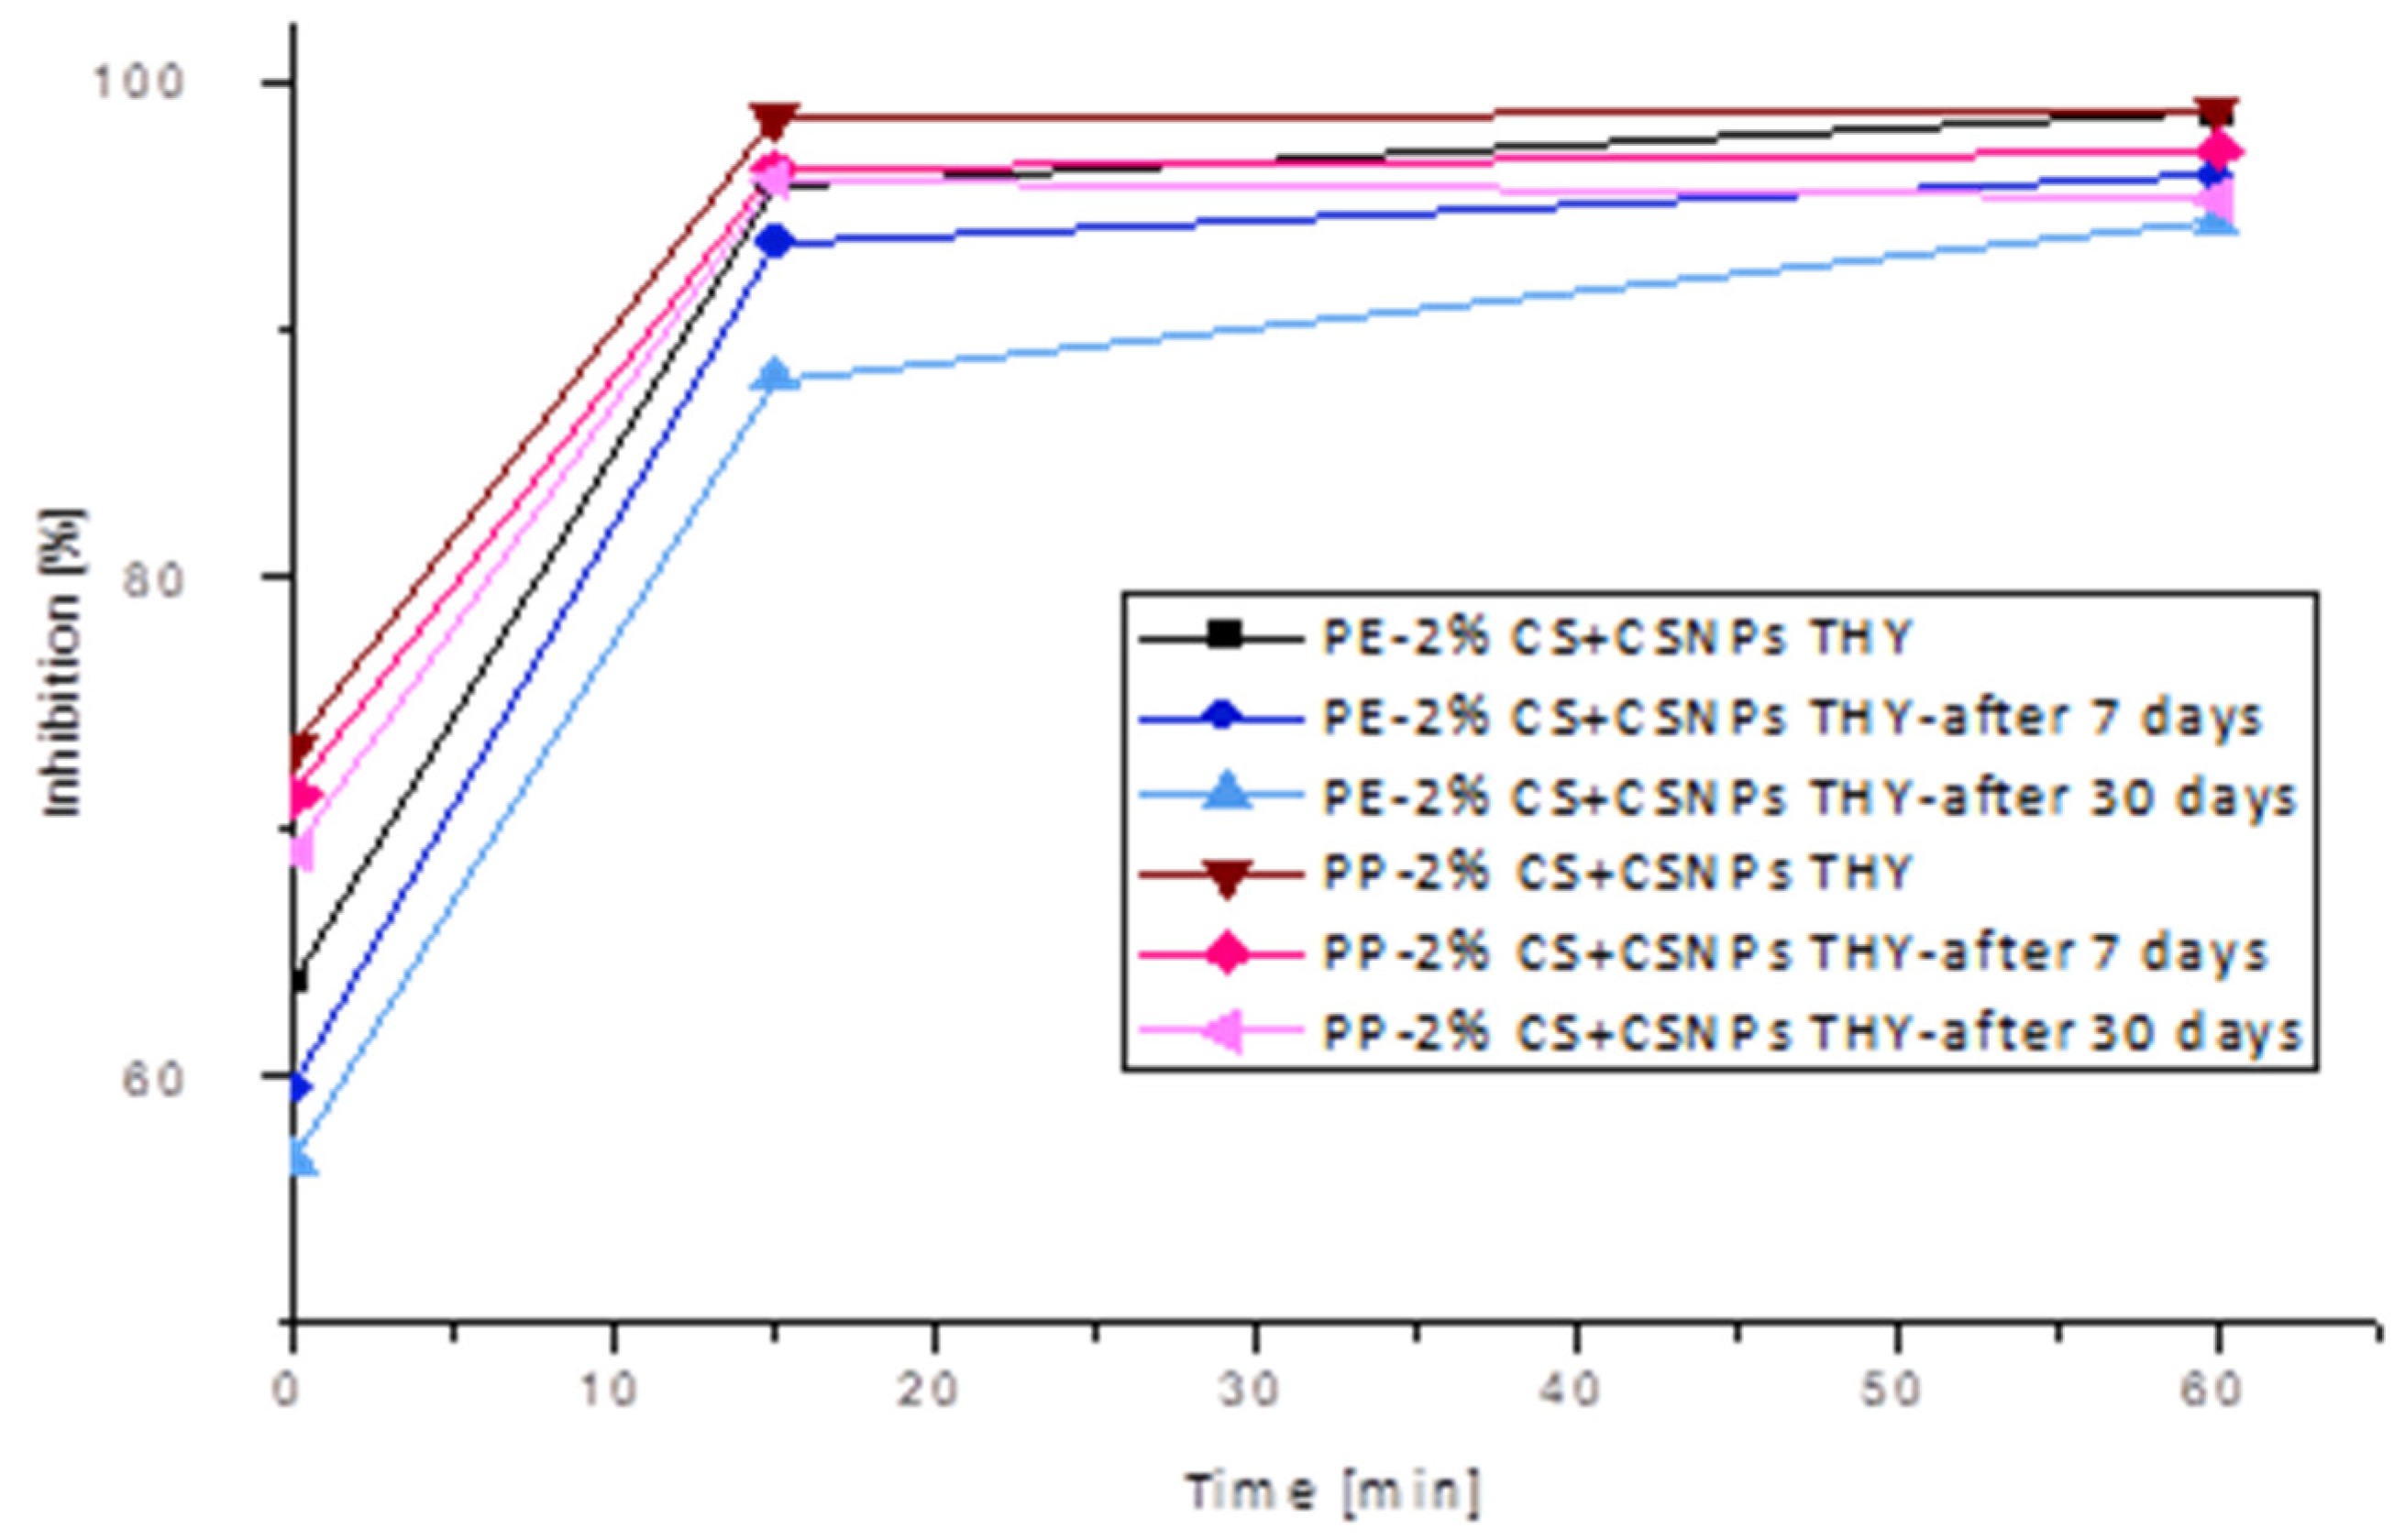
Antioxidative Activity by ABTS Assay
3. Materials and Methods
3.1. Materials
3.2. Solution and Functionalized Foil Preparation
3.3. Methods
3.3.1. Determination of Minimal Inhibitory Concentrations
3.3.2. Oxygen Permeability
3.3.3. Desorption Experiments
Preparation of Desorption Bath and Samples
Polyelectrolyte Titration
UV–Vis Spectroscopy
XPS
3.3.4. Evaluation of Antimicrobial Potential of Functionalized Foils
3.3.5. Antioxidative Activity (ABTS)
3.3.6. Statistical Analysis
4. Conclusions
Author Contributions
Funding
Acknowledgments
Conflicts of Interest
References
- Bastarrachea, L.J.; Wong, D.E.; Roman, M.J.; Lin, Z.; Goddard, J.M. Active packaging coatings. Coatings 2015, 5, 771–791. [Google Scholar] [CrossRef]
- Yildirim, S.; Röcker, B.; Pettersen, M.K.; Nilsen-Nygaard, J.; Ayhan, Z.; Rutkaite, R.; Radusin, T.; Suminska, P.; Marcos, B.; Coma, V. Active packaging applications for food. Compr. Rev. Food Sci. Food Saf. 2018, 17, 165–199. [Google Scholar] [CrossRef]
- Drake, P.L.; Hazelwood, K.J. Exposure-related health effects of silver and silver compounds: A review. Ann. Occup. Hyg. 2005, 49, 575–585. [Google Scholar] [PubMed]
- Torres-Arreola, W.; Soto-Valdez, H.; Peralta, E.; Cárdenas-López, J.L.; Ezquerra-Brauer, J.M. Effect of a low-density polyethylene film containing butylated hydroxytoluene on lipid oxidation and protein quality of Sierra fish (Scomberomorus sierra) muscle during frozen storage. J. Agric. food Chem. 2007, 55, 6140–6146. [Google Scholar] [CrossRef] [PubMed]
- Shahidi, F.; Zhong, Y. Novel antioxidants in food quality preservation and health promotion. Eur. J. Lipid Sci. Technol. 2010, 112, 930–940. [Google Scholar] [CrossRef]
- Aziz, M.; Karboune, S. Natural antimicrobial/antioxidant agents in meat and poultry products as well as fruits and vegetables: A review. Crit. Rev. Food Sci. Nutr. 2018, 58, 486–511. [Google Scholar] [CrossRef]
- Barbosa-Pereira, L.; Aurrekoetxea, G.P.; Angulo, I.; Paseiro-Losada, P.; Cruz, J.M. Development of new active packaging films coated with natural phenolic compounds to improve the oxidative stability of beef. Meat Sci. 2014, 97, 249–254. [Google Scholar] [CrossRef]
- Pokorný, J. Are natural antioxidants better–and safer–than synthetic antioxidants? Eur. J. Lipid Sci. Technol. 2007, 109, 629–642. [Google Scholar] [CrossRef]
- Realini, C.E.; Marcos, B. Active and intelligent packaging systems for a modern society. Meat Sci. 2014, 98, 404–419. [Google Scholar] [CrossRef]
- Redondo-Cuevas, L.; Castellano, G.; Raikos, V. Natural antioxidants from herbs and spices improve the oxidative stability and frying performance of vegetable oils. Int. J. Food Sci. Technol. 2017, 52, 2422–2428. [Google Scholar] [CrossRef]
- Shahidi, F. Antioxidants in food and food antioxidants. Food/nahrung 2000, 44, 158–163. [Google Scholar] [CrossRef]
- Donsì, F.; Annunziata, M.; Sessa, M.; Ferrari, G. Nanoencapsulation of essential oils to enhance their antimicrobial activity in foods. LWT-Food Sci. Technol. 2011, 44, 1908–1914. [Google Scholar] [CrossRef]
- Noshirvani, N.; Ghanbarzadeh, B.; Mokarram, R.R.; Hashemi, M. Novel active packaging based on carboxymethyl cellulose-chitosan-ZnO NPs nanocomposite for increasing the shelf life of bread. Food Packag. Shelf Life 2017, 11, 106–114. [Google Scholar] [CrossRef]
- Özogul, F.; Öztekin, R.; Kulawik, P. Biogenic amine formation and microbiological quality of anchovy (Engraulis encrasicolus) treated with lavender and lemon balm ethanol extracts. J. Food Sci. 2017, 82, 1278–1284. [Google Scholar] [CrossRef]
- Pola, C.C.; Medeiros, E.A.; Pereira, O.L.; Souza, V.G.; Otoni, C.G.; Camilloto, G.P.; Soares, N.F. Cellulose acetate active films incorporated with oregano (Origanum vulgare) essential oil and organophilic montmorillonite clay control the growth of phytopathogenic fungi. Food Packag. Shelf Life 2016, 9, 69–78. [Google Scholar] [CrossRef]
- Jayasena, D.D.; Jo, C. Essential oils as potential antimicrobial agents in meat and meat products: A review. Trends Food Sci. Technol. 2013, 34, 96–108. [Google Scholar] [CrossRef]
- Hyldgaard, M.; Mygind, T.; Meyer, R.L. Essential oils in food preservation: Mode of action, synergies, and interactions with food matrix components. Front. Microbiol. 2012, 3, 12. [Google Scholar] [CrossRef]
- Malhotra, B.; Keshwani, A.; Kharkwal, H. Antimicrobial food packaging: Potential and pitfalls. Front. Microbiol. 2015, 6, 611. [Google Scholar] [CrossRef]
- De Dicastillo, C.L.; Bustos, F.; Guarda, A.; Galotto, M.J. Cross-linked methyl cellulose films with murta fruit extract for antioxidant and antimicrobial active food packaging. Food Hydrocoll. 2016, 60, 335–344. [Google Scholar] [CrossRef]
- Glaser, T.K.; Plohl, O.; Vesel, A.; Ajdnik, U.; Ulrih, N.P.; Hrnčič, M.K.; Bren, U.; Fras Zemljič, L. Functionalization of polyethylene (PE) and polypropylene (PP) material using chitosan nanoparticles with incorporated resveratrol as potential active packaging. Materials 2019, 12, 2118. [Google Scholar] [CrossRef]
- Gutiérrez, M.Q.; Echeverría, I.; Ihl, M.; Bifani, V.; Mauri, A.N. Carboxymethylcellulose–montmorillonite nanocomposite films activated with murta (Ugni molinae Turcz) leaves extract. Carbohydr. Polym. 2012, 87, 1495–1502. [Google Scholar] [CrossRef]
- Stoleru, E.; Munteanu, S.B.; Dumitriu, R.P.; Coroaba, A.; Drobotă, M.; Zemljic, L.F.; Pricope, G.M.; Vasile, C. Polyethylene materials with multifunctional surface properties by electrospraying chitosan/vitamin E formulation destined to biomedical and food packaging applications. Iran. Polym. J. 2016, 25, 295–307. [Google Scholar] [CrossRef]
- Zemljič, L.F.; Plohl, O.; Vesel, A.; Luxbacher, T.; Potrč, S. Physicochemical Characterization of Packaging Foils Coated by Chitosan and Polyphenols Colloidal Formulations. Int. J. Mol. Sci. 2020, 21, 495. [Google Scholar] [CrossRef] [PubMed]
- Zemljič, L.F.; Tkavc, T.; Vesel, A.; Šauperl, O. Chitosan coatings onto polyethylene terephthalate for the development of potential active packaging material. Appl. Surf. Sci. 2013, 265, 697–703. [Google Scholar] [CrossRef]
- Han, J.W.; Ruiz-Garcia, L.; Qian, J.P.; Yang, X.T. Food packaging: A comprehensive review and future trends. Compr. Rev. Food Sci. Food Saf. 2018, 17, 860–877. [Google Scholar] [CrossRef]
- Milinčić, D.D.; Popović, D.A.; Lević, S.M.; Kostić, A.Ž.; Tešić, Ž.L.; Nedović, V.A.; Pešić, M.B. Application of Polyphenol-Loaded Nanoparticles in Food Industry. Nanomaterials 2019, 9, 1629. [Google Scholar] [CrossRef] [PubMed]
- Yang, W.; Owczarek, J.; Fortunati, E.; Kozanecki, M.; Mazzaglia, A.; Balestra, G.; Kenny, J.; Torre, L.; Puglia, D. Antioxidant and antibacterial lignin nanoparticles in polyvinyl alcohol/chitosan films for active packaging. Ind. Crops Prod. 2016, 94, 800–811. [Google Scholar] [CrossRef]
- European Commission. Union Guidelines on Regulation (EU) No 10/2011 on Plastic Materials and Articles Intended to Come into Contact with Food. Available online: https://ec.europa.eu/food/safety/chemical_safety/food_contact_materials/legislation_en (accessed on 16 January 2020).
- Liu, Q.; Meng, X.; Li, Y.; Zhao, C.-N.; Tang, G.-Y.; Li, H.-B. Antibacterial and antifungal activities of spices. Int. J. Mol. Sci. 2017, 18, 1283. [Google Scholar] [CrossRef]
- Fei, L.U.; Ding, Y.C.; Ye, X.Q.; Ding, Y.T. Antibacterial effect of cinnamon oil combined with thyme or clove oil. Agric. Sci. China 2011, 10, 1482–1487. [Google Scholar]
- Guynot, M.; Marin, S.; Setu, L.; Sanchis, V.; Ramos, A. Screening for antifungal activity of some essential oils against common spoilage fungi of bakery products. Food Sci. Technol. Int. 2005, 11, 25–32. [Google Scholar] [CrossRef]
- Riaz, A.; Lei, S.; Akhtar, H.M.S.; Wan, P.; Chen, D.; Jabbar, S.; Abid, M.; Hashim, M.M.; Zeng, X. Preparation and characterization of chitosan-based antimicrobial active food packaging film incorporated with apple peel polyphenols. Int. J. Biol. Macromol. 2018, 114, 547–555. [Google Scholar] [CrossRef] [PubMed]
- Nieto, G.; Ros, G.; Castillo, J. Antioxidant and antimicrobial properties of rosemary (Rosmarinus officinalis, L.): A Review. Medicines 2018, 5, 98. [Google Scholar] [CrossRef] [PubMed]
- Abreu, A.C.; McBain, A.J.; Simoes, M. Plants as sources of new antimicrobials and resistance-modifying agents. Nat. Prod. Rep. 2012, 29, 1007–1021. [Google Scholar] [CrossRef] [PubMed]
- Calo, J.R.; Crandall, P.G.; O’Bryan, C.A.; Ricke, S.C. Essential oils as antimicrobials in food systems–A review. Food Control 2015, 54, 111–119. [Google Scholar] [CrossRef]
- Ristić, T.; Hribernik, S.; Fras-Zemljič, L. Electrokinetic properties of fibres functionalised by chitosan and chitosan nanoparticles. Cellulose 2015, 22, 3811–3823. [Google Scholar] [CrossRef]
- Ristić, T. Antimicrobial Medical Textiles Based on Chitosan Nanoparticles for Gynaecological Treatment. Ph.D. Thesis, Univerza v Mariboru, Maribor, Slovenia, 2014. [Google Scholar]
- Helander, I.; Nurmiaho-Lassila, E.-L.; Ahvenainen, R.; Rhoades, J.; Roller, S. Chitosan disrupts the barrier properties of the outer membrane of Gram-negative bacteria. Int. J. Food Microbiol. 2001, 71, 235–244. [Google Scholar] [CrossRef]
- Bordes, C.; Bouarab-Chibane, L.; Forquet, V.; Lantéri, P.; Clément, Y.; Leonard, L.; Oulahal, N.; Degraeve, P. Antibacterial properties of polyphenols: Characterization and QSAR (Quantitative structure–activity relationship) models. Front. Microbiol. 2019, 10, 829. [Google Scholar]
- Zhang, X.; Wang, L.; Levänen, E. Superhydrophobic surfaces for the reduction of bacterial adhesion. Rsc Adv. 2013, 3, 12003–12020. [Google Scholar] [CrossRef]
- Cuero, R.G. Antimicrobial action of exogenous chitosan. Exs 1999, 87, 315–333. [Google Scholar]
- Hernandez-Lauzardo, A.N.; Bautista-Baños, S.; Velazquez-Del Valle, M.G.; Méndez-Montealvo, M.; Sánchez-Rivera, M.; Bello-Perez, L.A. Antifungal effects of chitosan with different molecular weights on in vitro development of Rhizopus stolonifer (Ehrenb.: Fr.) Vuill. Carbohydr. Polym. 2008, 73, 541–547. [Google Scholar] [CrossRef]
- Rice-Evans, C.A.; Miller, N.J.; Paganga, G. Structure-antioxidant activity relationships of flavonoids and phenolic acids. Free Radic. Biol. Med. 1996, 20, 933–956. [Google Scholar] [CrossRef]
- López-Mata, M.A.; Ruiz-Cruz, S.; Silva-Beltrán, N.P.; Ornelas-Paz, J.D.J.; Ocaño-Higuera, V.M.; Rodríguez-Félix, F.; Cira-Chávez, L.A.; Del-Toro-Sánchez, C.; Shirai, K. Physicochemical and antioxidant properties of chitosan films incorporated with cinnamon oil. Int. J. Polym. Sci. 2015, 2015. [Google Scholar] [CrossRef]
- Klančnik, A.; Piskernik, S.; Jeršek, B.; Možina, S.S. Evaluation of diffusion and dilution methods to determine the antibacterial activity of plant extracts. J. Microbiol. Methods 2010, 81, 121–126. [Google Scholar] [CrossRef] [PubMed]


| Microorganism | Thyme (mg/mL) | Rosemary (mg/mL) | Cinnamon (mg/mL) |
|---|---|---|---|
| Staphylococcus aureus | 3.10 | 0.03 | 0.23 |
| Escherichia coli | 6.30 | 0.47 | 1.25 |
| Aspergillus flavus | 12.50 | >6.25 | >5.00 |
| Penicillium verrucosum | 6.30 | >6.25 | >5.00 |
| Sample | OTR (cm3/m2∙d) | OTR (%) | Permeability Reduction (%) |
|---|---|---|---|
| PE | 3226 ± 62 | 100 ± 2 | / |
| PP | 1078 ± 36 | 100 ± 3 | / |
| PE-2%CS + CSNPs THY | 789 ± 35 | 24 ± 3 | 76 ± 3 |
| PP-2%CS + CSNPs THY | 359 ± 9 | 33 ± 1 | 67 ± 1 |
| PE-2%CS + CSNPs ROS | 1260 ± 8 | 39 ± 1 | 61 ± 1 |
| PP-2%CS + CSNPs ROS | 464 ± 10 | 43 ± 1 | 57 ± 1 |
| PE-2%CS + CSNPs CIN | 1250 ± 51 | 39 ± 2 | 61 ± 2 |
| PP-2%CS + CSNPs CIN | 580 ± 8 | 54 ± 1 | 46 ± 1 |
| Sample/Desorption of Chitosan | PE-2%CS + CSNPs | PP-2%CS + CSNPs |
|---|---|---|
| mmol/kg | 5.2 ± 0.2 | 3.8 ± 0.1 |
| Extract | Thyme | Rosemary | Cinnamon |
|---|---|---|---|
| Sample | PE-2%CS + CSNPs THY | PE-2%CS + CSNPs ROS | PE-2%CS + CSNPs CIN |
| Desorption (mg/kg) | 49.0 ± 1.0 | 19.0 ± 3.0 | 6.6 ± 0.1 |
| Extract | Thyme | Rosemary | Cinnamon |
|---|---|---|---|
| Sample | PP-2%CS + CSNPs THY | PP-2%CS + CSNPs ROS | PP + 2%CS + CSNPs CIN |
| Desorption (mg/kg) | 86.0 ± 1.0 | 52.0 ± 4.0 | 17.6 ± 0.8 |
| Sample | C | N | O | Na | P |
|---|---|---|---|---|---|
| PE-2%CS + CSNPs THY | 62.2 | 4.1 | 31.5 | 0.3 | 0.6 |
| PP-2%CS + CSNPs THY | 59.3 | 4.8 | 33.4 | 0.1 | 1.1 |
| After 24 h desorption: PE-2%CS + CSNPs THY | 57.4 | 2.4 | 28.4 | / | / |
| PP-2%CS + CSNPs THY | 55.2 | 2.1 | 29.4 | / | / |
| Difference: PE-2%CS + CSNPs THY | −4.8 | −1.7 | −3.1 | −0.3 | −0.6 |
| PP-2%CS + CSNPs THY | −4.1 | −2.7 | −4.0 | −0.1 | −1.1 |
| Sample | C | N | O | Na | P |
|---|---|---|---|---|---|
| PE-2%CS + CSNPs ROS | 66.7 | 4.0 | 26.8 | 0.4 | 0.2 |
| PP-2%CS + CSNPs ROS | 62.0 | 3.8 | 27.8 | 0.3 | 0.3 |
| After 24 h desorption: PE-2%CS + CSNPs ROS | 55.5 | 2.1 | 29.0 | / | / |
| PP-2%CS + CSNPs ROS | 53.0 | 1.8 | 29.3 | / | / |
| Difference: PE-2%CS + CSNPs ROS | −11.2 | −1.9 | 2.2 | −0.4 | −0.2 |
| PP-2%CS + CSNPs ROS | −9.0 | −2.0 | 1.5 | −0.3 | −0.3 |
| Sample | C | N | O | Na | P |
|---|---|---|---|---|---|
| PE-2%CS + CSNPs CIN | 63.3 | 4.0 | 27.4 | 0.7 | 0.3 |
| PP-2%CS + CSNPs CIN | 62.2 | 3.2 | 28.4 | 0.2 | 0.1 |
| After 24 h desorption: PE-2%CS + CSNPs CIN | 62.5 | 3.3 | 27.9 | / | / |
| PP-2%CS + CSNPs CIN | 58.0 | 3.1 | 29.1 | / | / |
| Difference: PE-2%CS + CSNPs CIN | −0.8 | −0.7 | 0.5 | −0.7 | −0.3 |
| PP-2%CS + CSNPs CIN | −4.2 | −0.1 | 0.7 | −0.2 | −0.1 |
| Material | Bacteria | |||
|---|---|---|---|---|
| S. aureus | E. coli | |||
| N | R | N | R | |
| Control foil | 5.33 ± 0.17 | / | 5.46 ± 0.16 | / |
| PE-2%CS + CSNPs THY | 2.19 ± 0.24 * | 3.14 | 3.02 ± 0.45 * | 2.44 |
| PP-2%CS + CSNPs THY | 0.85 ± 0.40 * | 4.48 | 2.22 ± 0.79 * | 3.24 |
| PE-2%CS + THYME | 3.86 ± 0.38 * | 1.47 | 4.45 ± 0.24 * | 1.01 |
| PP-2%CS + THYME | 2.86 ± 0.33 * | 2.47 | 3.30 ± 0.16 * | 2.16 |
| PE-2%CS + CSNPs ROS | <0.40 * | >4.93 | <0.40 * | >5.06 |
| PP-2%CS + CSNPs ROS | <0.40 * | >4.93 | <0.40 * | >5.06 |
| PE-2%CS + CSNPs CIN | 3.23 ± 0.18 * | 2.10 | 3.24 ± 0.60 * | 2.22 |
| PP-2%CS + CSNPs CIN | 0.81 ± 0.31 * | 4.52 | 1.77 ± 0.27 * | 3.69 |
| Material | Fungi | |||
|---|---|---|---|---|
| A. flavus | P. verrucosum | |||
| N | R | N | R | |
| Control foil | 5.36 ± 0.22 | / | 5.19 ± 0.21 | / |
| PE-2%CS + CSNPs THY | 5.23 ± 0.16 | 0.13 | 4.20 ± 0.12 * | 0.99 |
| PP-2%CS + CSNPs THY | 5.03 ± 0.18 | 0.33 | 3.83 ± 0.28 * | 1.36 |
| PE-2%CS + THYME | 4.69 ± 0.14 * | 0.67 | 3.12 ± 0.47 * | 2.07 |
| PP-2%CS + THYME | 4.08 ± 0.22 * | 1.28 | 3.08 ± 0.23 * | 2.11 |
| PE-2%CS + CSNPs ROS | 1.34 ± 0.18 * | 4.02 | 2.05 ± 0.24 * | 3.14 |
| PP-2%CS + CSNPs ROS | 1.82 ± 0.62 * | 3.54 | 2.32 ± 0.10 * | 2.87 |
| PE-2%CS + CSNPs CIN | 1.09 ± 0.25 * | 4.27 | 2.12 ± 0.24 * | 3.07 |
| PP-2%CS + CSNPs CIN | 1.56 ± 0.33 * | 3.80 | 3.00 ± 0.15 * | 2.19 |
| Sample Notation | Description of Sample |
|---|---|
| PE PP PE-UV/OZONE PP-UV/OZONE CS THY ROS CIN CSNPs CSNPs THY CSNPs ROS CSNPs CIN PE-2%CS + CSNPs THY PP-2%CS + CSNPs THY PE-THYME PP-THYME PE-2%CS + CSNPs ROS PP-2%CS + CSNPs ROS PE-2%CS + CSNPs CIN PP-2%CS + CSNPs CIN PE-2%CS PP-2%CS | Polyethylene foil Polypropylene foil PE foil treated with UV/ozone system PP foil treated with UV/ozone system Chitosan powder Thyme extract, Thymus vulgaris L. Rosemary extract, Rosmarinus officinalis L. Cinnamon extract Chitosan nanoparticle dispersion Dispersion of chitosan nanoparticles with encapsulated thyme extract Dispersion of chitosan nanoparticles with encapsulated rosemary extract Dispersion of chitosan nanoparticles with encapsulated cinnamon extract UV/ozone-treated PE foil, coated with 2% CS and CSNPs THY (2 layers) UV/ozone-treated PP foil, coated with 2% CS and CSNPs THY (2 layers) UV/ozone-treated PE foil, coated with thyme extract solution UV/ozone-treated PP foil, coated with thyme extract solution UV/ozone-treated PE foil, coated with 2% CS and CSNPs ROS (2 layers) UV/ozone-treated PP foil, coated with 2% CS and CSNPs ROS (2 layers) UV/ozone-treated PE foil, coated with 2% CS and CSNPs CIN (2 layers) UV/ozone-treated PP foil, coated with 2% CS and CSNPs CIN (2 layers) PE foil treated with UV/ozone, with 2% CS PP foil treated with UV/ozone, with 2% CS |
© 2020 by the authors. Licensee MDPI, Basel, Switzerland. This article is an open access article distributed under the terms and conditions of the Creative Commons Attribution (CC BY) license (http://creativecommons.org/licenses/by/4.0/).
Share and Cite
Potrč, S.; Sterniša, M.; Smole Možina, S.; Knez Hrnčič, M.; Fras Zemljič, L. Bioactive Characterization of Packaging Foils Coated by Chitosan and Polyphenol Colloidal Formulations. Int. J. Mol. Sci. 2020, 21, 2610. https://doi.org/10.3390/ijms21072610
Potrč S, Sterniša M, Smole Možina S, Knez Hrnčič M, Fras Zemljič L. Bioactive Characterization of Packaging Foils Coated by Chitosan and Polyphenol Colloidal Formulations. International Journal of Molecular Sciences. 2020; 21(7):2610. https://doi.org/10.3390/ijms21072610
Chicago/Turabian StylePotrč, Sanja, Meta Sterniša, Sonja Smole Možina, Maša Knez Hrnčič, and Lidija Fras Zemljič. 2020. "Bioactive Characterization of Packaging Foils Coated by Chitosan and Polyphenol Colloidal Formulations" International Journal of Molecular Sciences 21, no. 7: 2610. https://doi.org/10.3390/ijms21072610
APA StylePotrč, S., Sterniša, M., Smole Možina, S., Knez Hrnčič, M., & Fras Zemljič, L. (2020). Bioactive Characterization of Packaging Foils Coated by Chitosan and Polyphenol Colloidal Formulations. International Journal of Molecular Sciences, 21(7), 2610. https://doi.org/10.3390/ijms21072610