Article

Genome-Wide Analysis of Phosphorus Transporter Genes in Brassica and Their Roles in Heavy Metal Stress Tolerance

1
Chongqing Engineering Research Center for Rapeseed, College of Agronomy and Biotechnology, Southwest University, No. 2 Tiansheng Road, Beibei, Chongqing 400715, China
2
Academy of Agricultural Sciences, Southwest University, Chongqing 400715, China
*
Authors to whom correspondence should be addressed.
These authors contributed equally to this work.
Int. J. Mol. Sci. 2020, 21(6), 2209; https://doi.org/10.3390/ijms21062209
Submission received: 22 February 2020 / Revised: 19 March 2020 / Accepted: 20 March 2020 / Published: 23 March 2020
(This article belongs to the Section Molecular Genetics and Genomics)

Abstract

:
Phosphorus transporter (PHT) genes encode H2PO4−/H+ co-transporters that absorb and transport inorganic nutrient elements required for plant development and growth and protect plants from heavy metal stress. However, little is known about the roles of PHTs in Brassica compared to Arabidopsis thaliana. In this study, we identified and extensively analyzed 336 PHTs from three diploid (B. rapa, B. oleracea, and B. nigra) and two allotetraploid (B. juncea and B. napus) Brassica species. We categorized the PHTs into five phylogenetic clusters (PHT1PHT5), including 201 PHT1 homologs, 15 PHT2 homologs, 40 PHT3 homologs, 54 PHT4 homologs, and 26 PHT5 homologs, which are unevenly distributed on the corresponding chromosomes of the five Brassica species. All PHT family genes from Brassica are more closely related to Arabidopsis PHTs in the same vs. other clusters, suggesting they are highly conserved and have similar functions. Duplication and synteny analysis revealed that segmental and tandem duplications led to the expansion of the PHT gene family during the process of polyploidization and that members of this family have undergone purifying selection during evolution based on Ka/Ks values. Finally, we explored the expression profiles of BnaPHT family genes in specific tissues, at various developmental stages, and under heavy metal stress via RNA-seq analysis and qRT-PCR. BnaPHTs that were induced by heavy metal treatment might mediate the response of rapeseed to this important stress. This study represents the first genome-wide analysis of PHT family genes in Brassica species. Our findings improve our understanding of PHT family genes and provide a basis for further studies of BnaPHTs in plant tolerance to heavy metal stress.

1. Introduction

Phosphorus (Pi), one of the three major mineral nutrients required for plant growth and development, plays an important role in the plant lifecycle [1]. Phosphorus transporter (PHT) genes encode H2PO4−/H+ co-transporters that are responsible for the absorption and transport of soil-available phosphorus in plant roots, which are divided into five subfamilies: PHT1, PHT2, PHT3, PHT4, and PHT5 [2]. Among these, PHT1 (plasma membrane) genes have been well characterized in a wide range of species, such as Arabidopsis thaliana [3], B. napus [4,5], graminaceous species [6,7,8,9,10], solanaceous species [11,12], and legumes [13,14,15,16]. The main function of PHT1 transporters is to mediate the absorption and transport of Pi from the soil [17]. Most PHT1 family genes are expressed exclusively or predominantly in both roots and shoots, which are strongly induced by Pi starvation or by inoculation with arbuscular mycorrhiza [3,6,9,10,15,18].
In general, PHT1s function in Pi acquisition from the soil, whereas PHT2 (plastid inner envelope), PHT3 (mitochondrial inner membrane), PHT4 (mostly plastid envelope and one Golgi-localized transporter), and PHT5 (vacuole membrane) family genes are mainly responsible for maintaining the Pi distribution within the plant [19] and have thus far received less attention than PHT1 family genes [20]. For example, the chloroplast envelope-localized gene PHT2 is primarily expressed in green tissues and encodes a protein thought to function in Pi transport into leaves and tolerance to Pi starvation [1,21,22,23]. The first putative mitochondrial Pi transporter genes identified [24] were PHT3 genes, which are highly conserved within the mitochondrial transporter family [2] and are involved in Pi exchange between the mitochondrial matrix and cytosol [25]. PHT4 family genes also function in multiple biological processes, as they not only play important roles in Pi transport in plastids and the Golgi apparatus [26,27], but they might also be involved in plant growth [28], carbon metabolism [29,30], pathogen resistance [31,32], and salt tolerance [33]. PHT3 and PHT4 family members might also contribute to Pi transport within the plant tissues under Pi starvation [27,34]. PHT5 family proteins, also known as SYG1, PHO81, and XPR1 (SPX)-Major Facility Superfamily (MFS) proteins, are located in the vacuole membrane and are involved in maintaining Pi homeostasis within the plant [35,36,37]. These studies focused on the roles of PHT family proteins in Pi uptake from the soil and distribution within plants [1,19,20].
In nature, many heavy metals serve as essential trace elements for plant growth and development, including copper, manganese, cobalt, zinc, and chromium [38]. However, when the content of a heavy metal in the environment exceeds a certain critical value, it can have toxic effects on plants, disrupting plant metabolic processes, inhibiting plant growth or causing plant death [39,40]. Many species or genotypes of Brassica have a strong ability to absorb and enrich heavy metals, making them ideal for the phytoremediation of heavy metal-contaminated soils, particularly B. juncea and B. napus [39,41,42,43,44,45]. The uptake of Pi and arsenic depends on the same transport system in plants [46,47,48]. PHT1 family genes function in the acquisition of As and Pi, such as PHT1;1 and PHT1;4 in Arabidopsis [49,50], OsPHT1;8 in rice [51], and PvPHT1;3 in Pteris vittata [46]. However, a comprehensive analysis of the entire PHT family (PHT1, PHT2, PHT3, PHT4, and PHT5) in Brassica species has not been reported, and the mechanisms that contribute to the tolerance of Brassica plants to heavy metals are unclear.
B. rapa (AA, 2n = 20), B. nigra (BB, 2n = 16), and B. oleracea (CC, 2n = 18) contain three diploid genomes. Interspecific hybridization of these plants led to the formation of three amphidiploid plants, B. juncea (AABB, 2n = 36), B. napus (AACC, 2n = 38), and B. carinata (BBCC, 2n = 34), and their relationships among these plants are described by the U’s triangle model [52], providing an excellent evolutionary model for investigating the expansion of gene families [53]. In the present study, using genome-wide analysis, we comprehensively identified the phosphorus transporter gene family in five Brassica species (B. rapa, B. nigra, B. oleracea, B. juncea, and B. napus), including the PHT1, PHT2, PHT3, PHT4, and PHT5 gene families. We analyzed their duplication and classification, chromosome distribution, and motifs and performed a phylogenetic analysis. Finally, we investigated the expression patterns of all BnaPHT genes in various tissues and the expression profiles of various genes in B. napus in response to cadmium and arsenic treatment. Our results provide a foundation for functional genomic studies of the PHT gene family in Brassica.

2. Results

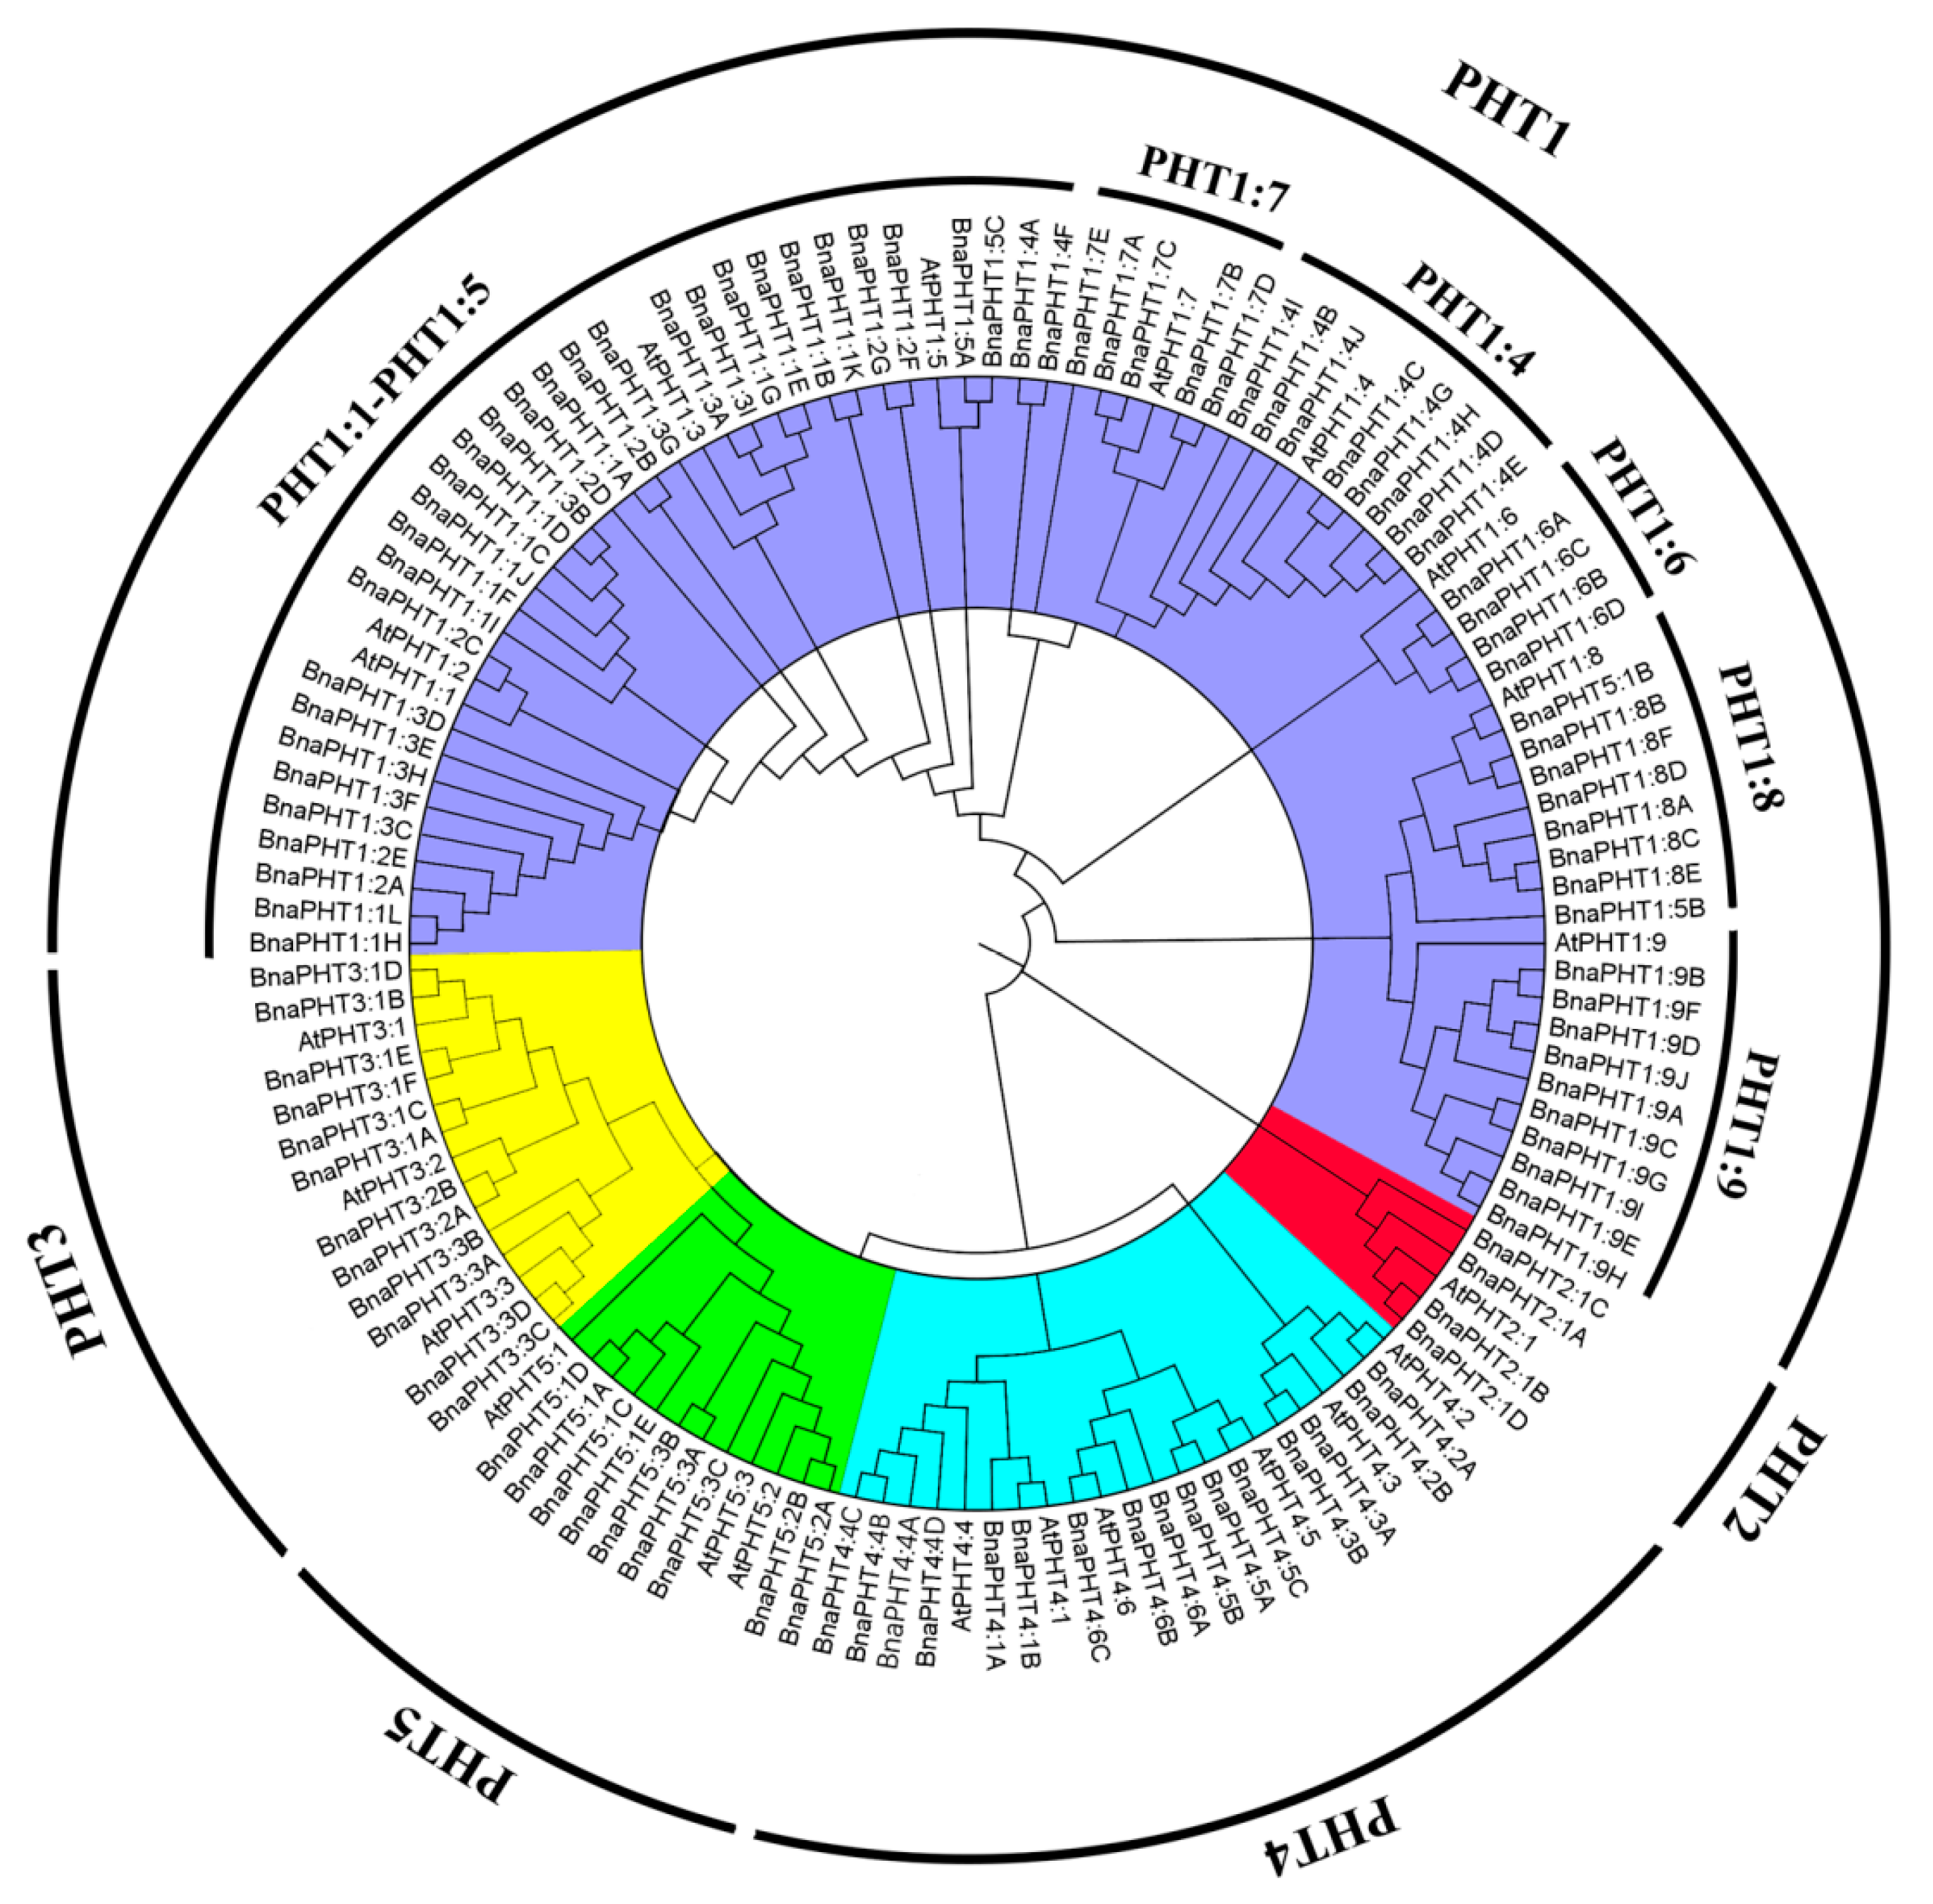
2.1. Identification and Evolutionary Relationships of PHT Family Genes

We identified 336 PHT genes in the genomes of five Brassica plants (54 from B. rapa, 34 from B. oleracea, 55 from B. nigra, 85 from B. juncea, and 108 from B. napus) using the protein sequences of 22 PHT family genes as queries in the The Arabidopsis Information Resource (TAIR10) database (Table 1 and Table S1). We aligned the deduced amino acid sequences of all 108 PHT proteins with those of A. thaliana and performed phylogenetic analysis. The phylogenetic tree was divided into five subgroups, PHT1 to PHT5 (Figure 1 and Table S1). All PHT proteins in Brassica were classified into known subfamilies with A. thaliana, suggesting that they diverged from a common ancestor. Of the five subgroups identified, subgroup PHT1 contained the largest number of PHT genes (201 PHT1s), representing 59.82% of the total number of PHT genes among the five Brassica species. The encoded proteins ranged from 57 amino acids (BnaPHT1:2E) to 1958 amino acids long (BjuPHT1:1A). All PHT1 subfamily members were divided into nine subgroups (PHT1:1, PHT1:2, PHT1:3, PHT1:4, PHT1:5, PHT1:6, PHT1:7, PHT1:8, and PHT1:9), including 24, 23, 23, 31, 8, 17, 15, 19, and 41 PHT1 family members. PHT1:1, PHT1:2, and PHT1:3 were grouped in the same subcluster (Table 1 and Table S1), suggesting they share a closer relationship than the others.
Additionally, we analyzed the physical and chemical properties of all PHT family genes and encoded proteins, including their chromosome locations, molecular weights (MWs), and theoretical Isoelectric points (pIs) (Table S1). For example, the 15 genes in the PHT2 subfamily encode deduced proteins ranging from 433 (BolPHT2:1C) to 760 (BjuPHT2:1B) amino acids long, representing the smallest subgroups. The 40 PHT3 subfamily genes encode 211 (BnaPHT3:3C) to 849 (BjuPHT3:2A) amino acid proteins, the 54 PHT4 subfamily genes encode 102 (BjuPHT4:2A) to 1318 (BniPHT4:3A) amino acid proteins, and the 26 PHT5 subfamily genes encode 138 (BnaPHT5:1B) to 1056 (BolPHT5:3A) amino acid proteins (Table S1). These results suggest that this protein family might have lost partial amino acid sequences in Brassica during the process of polyploidization [54]. We, therefore, comprehensively investigated the expansion mechanisms and functional characteristics of PHT family genes in A. thaliana and five Brassica species.

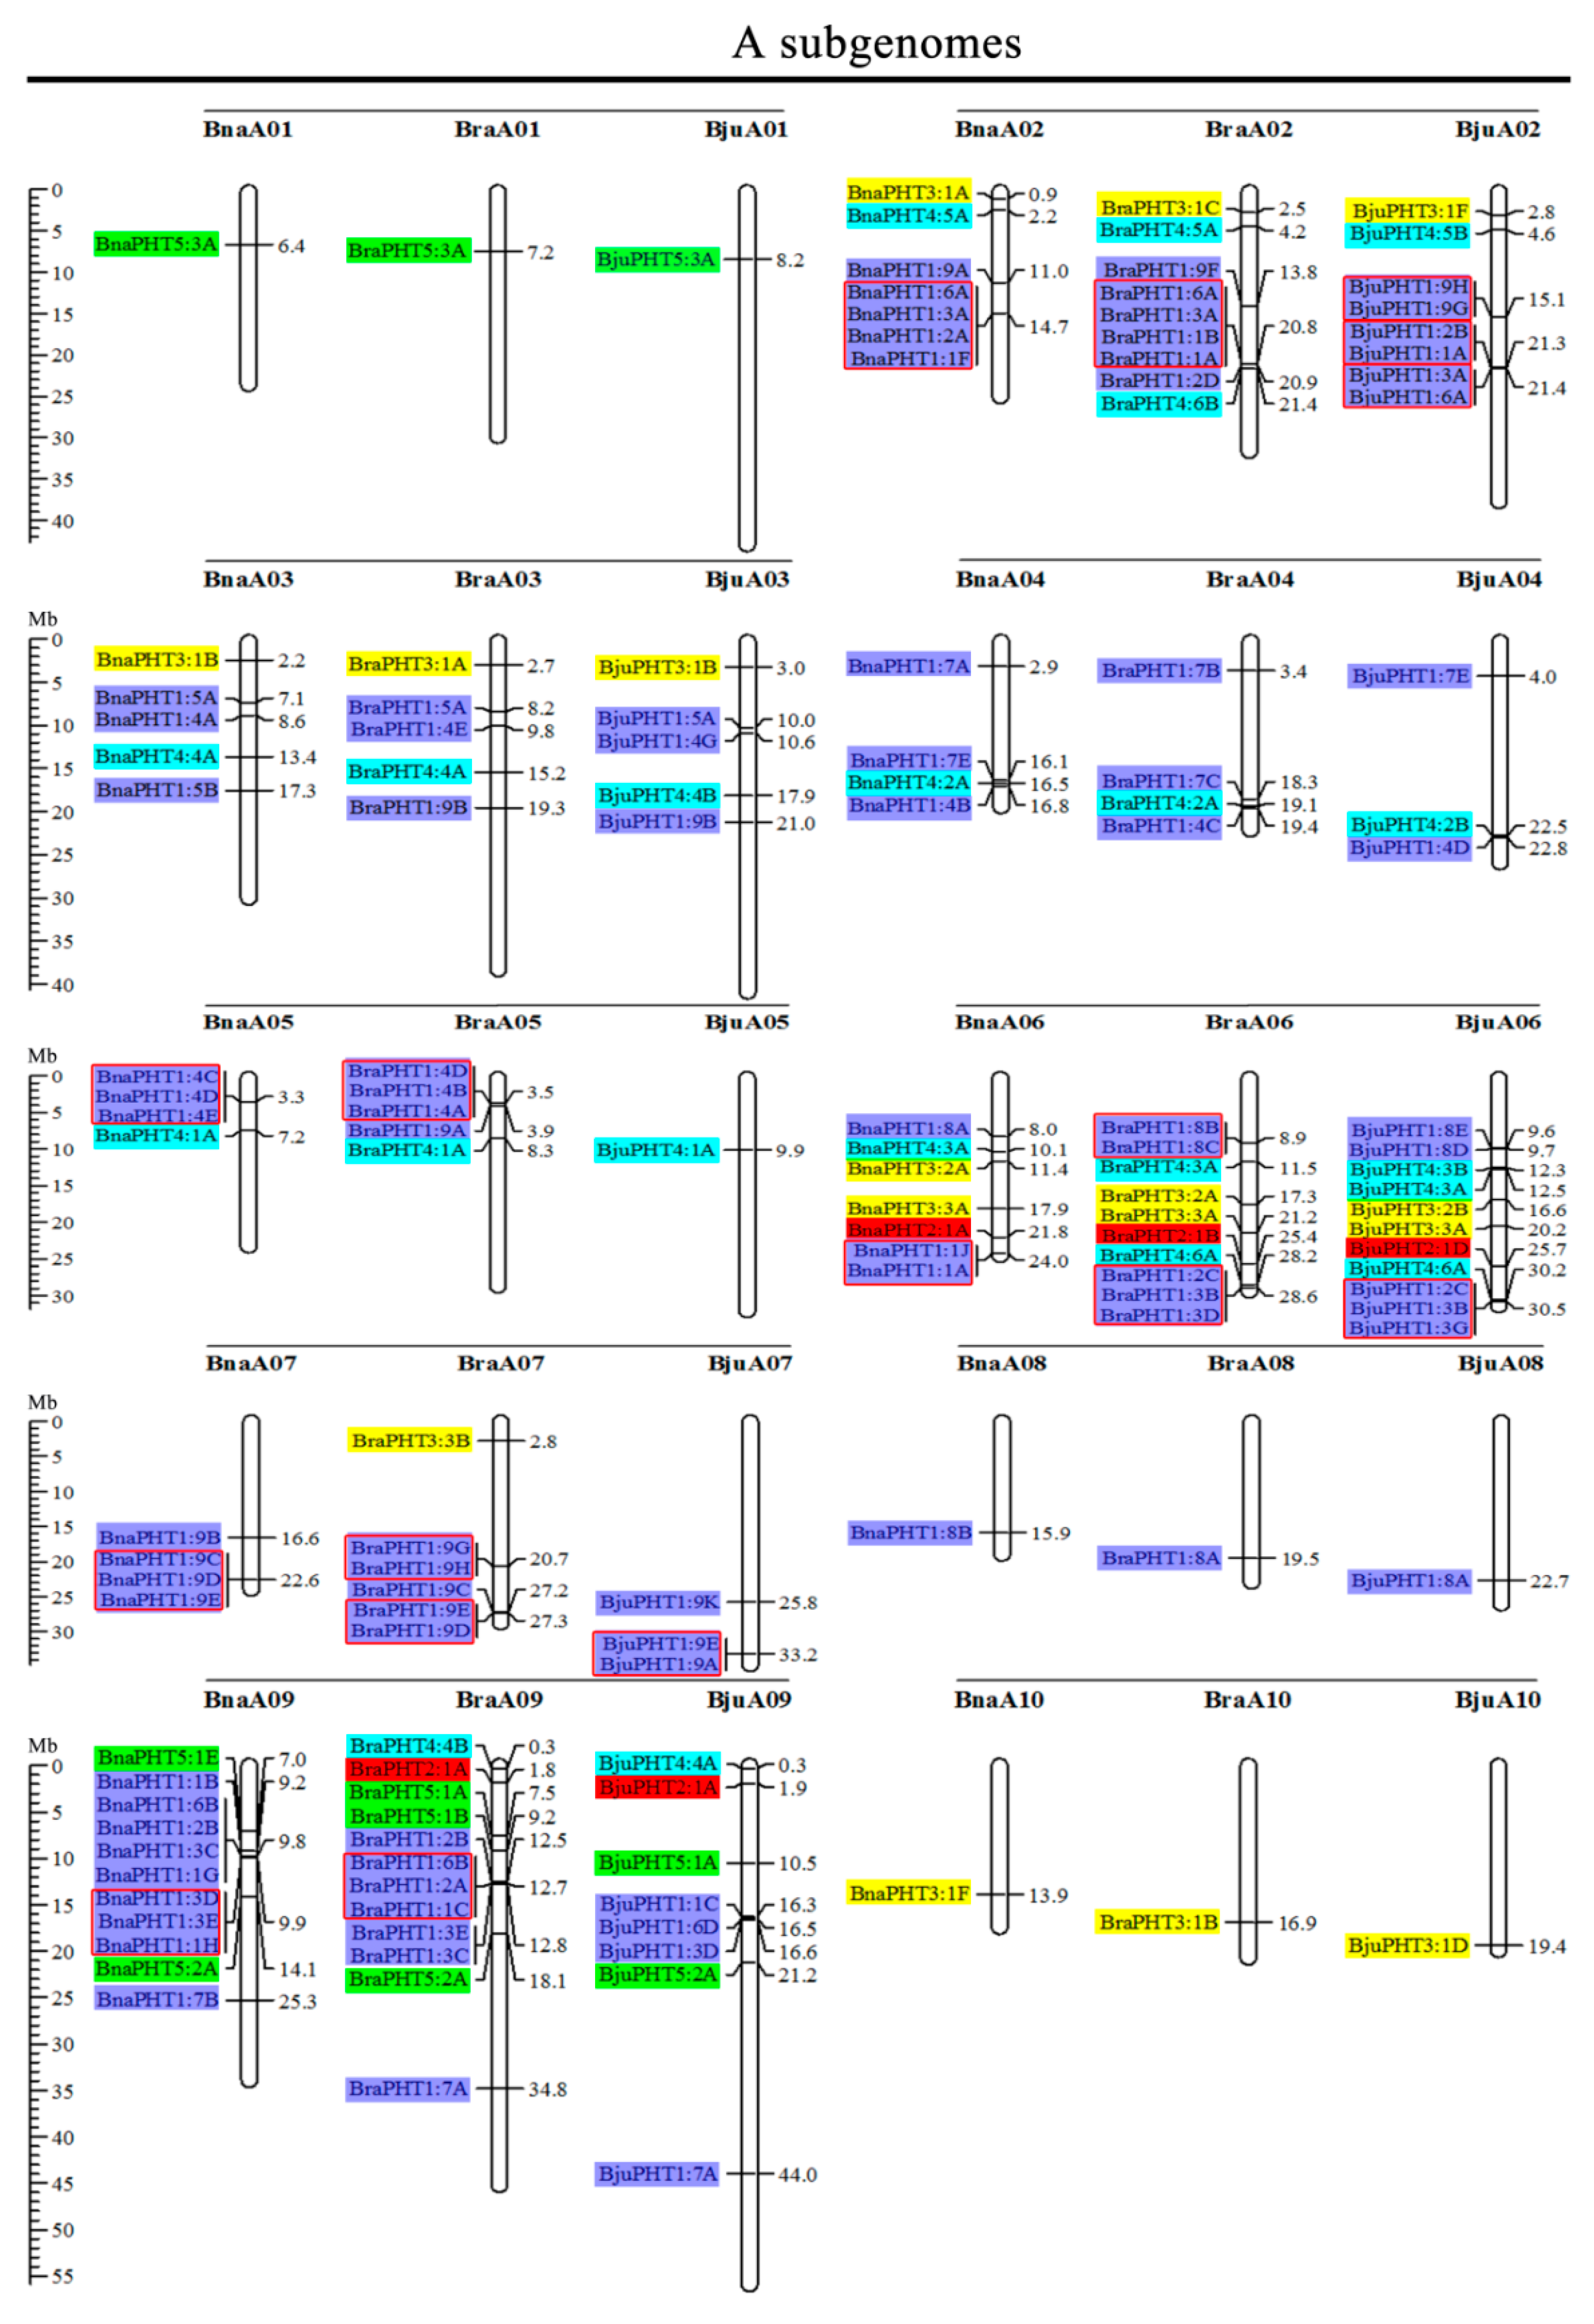
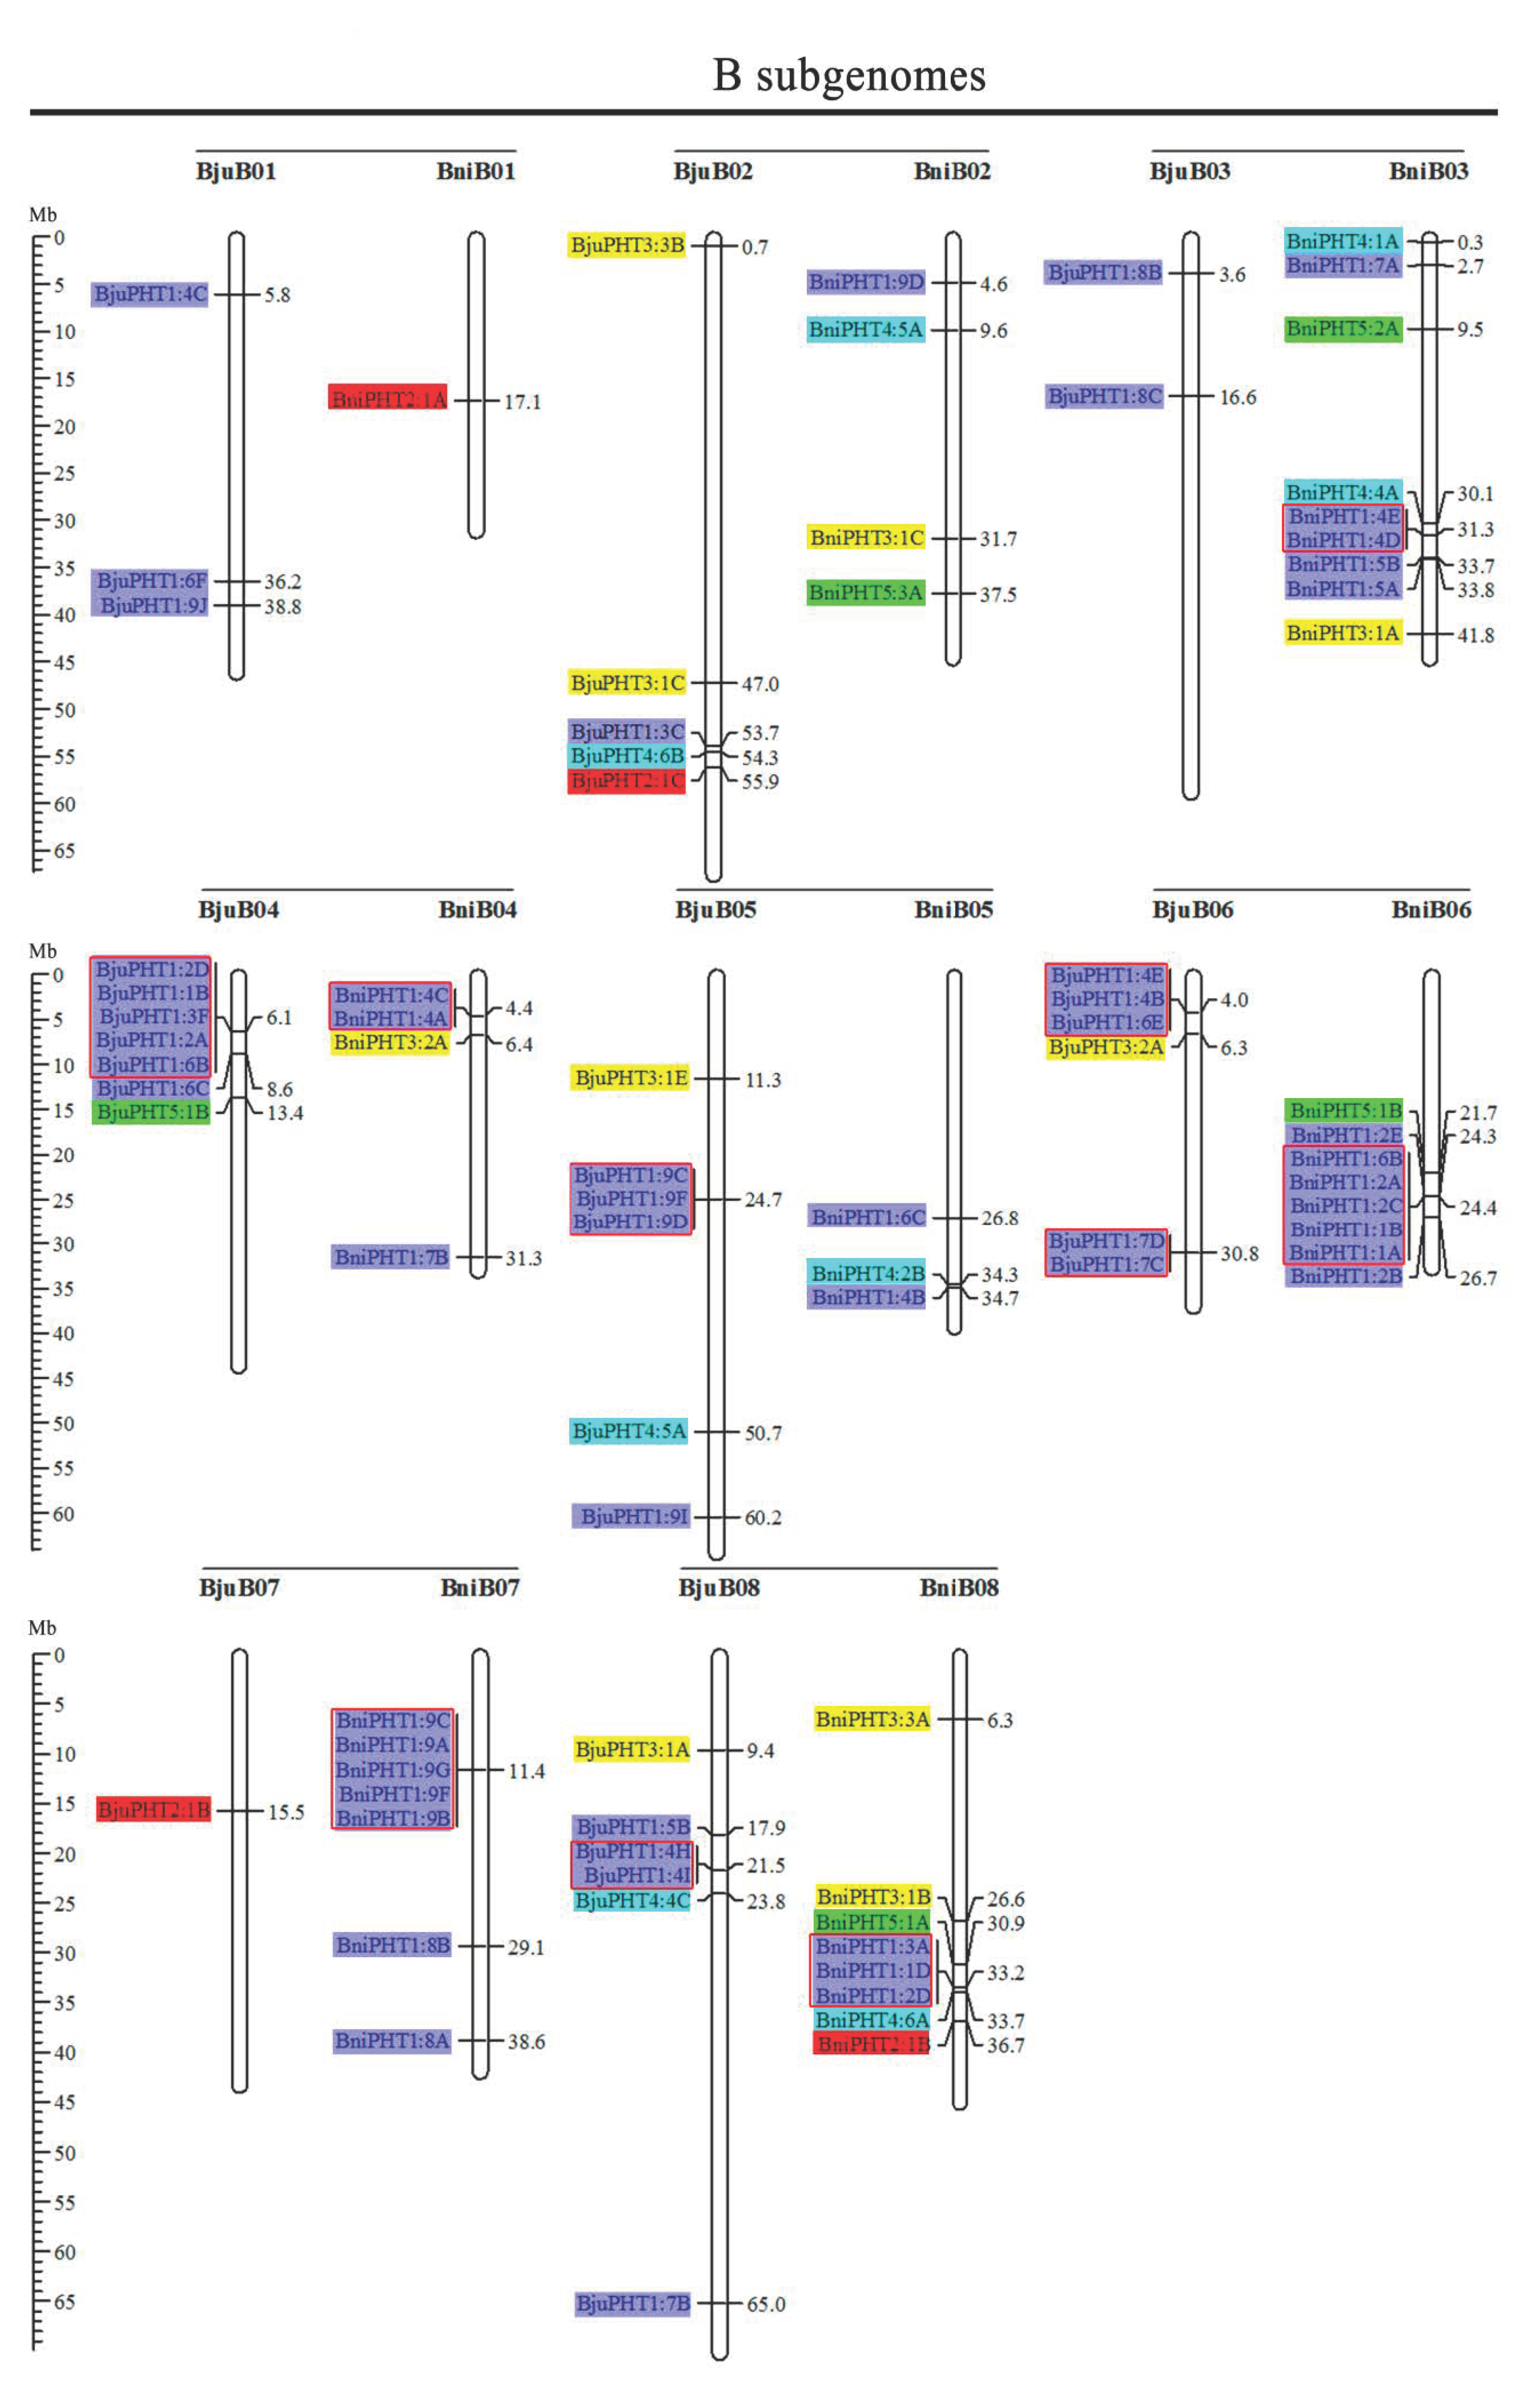
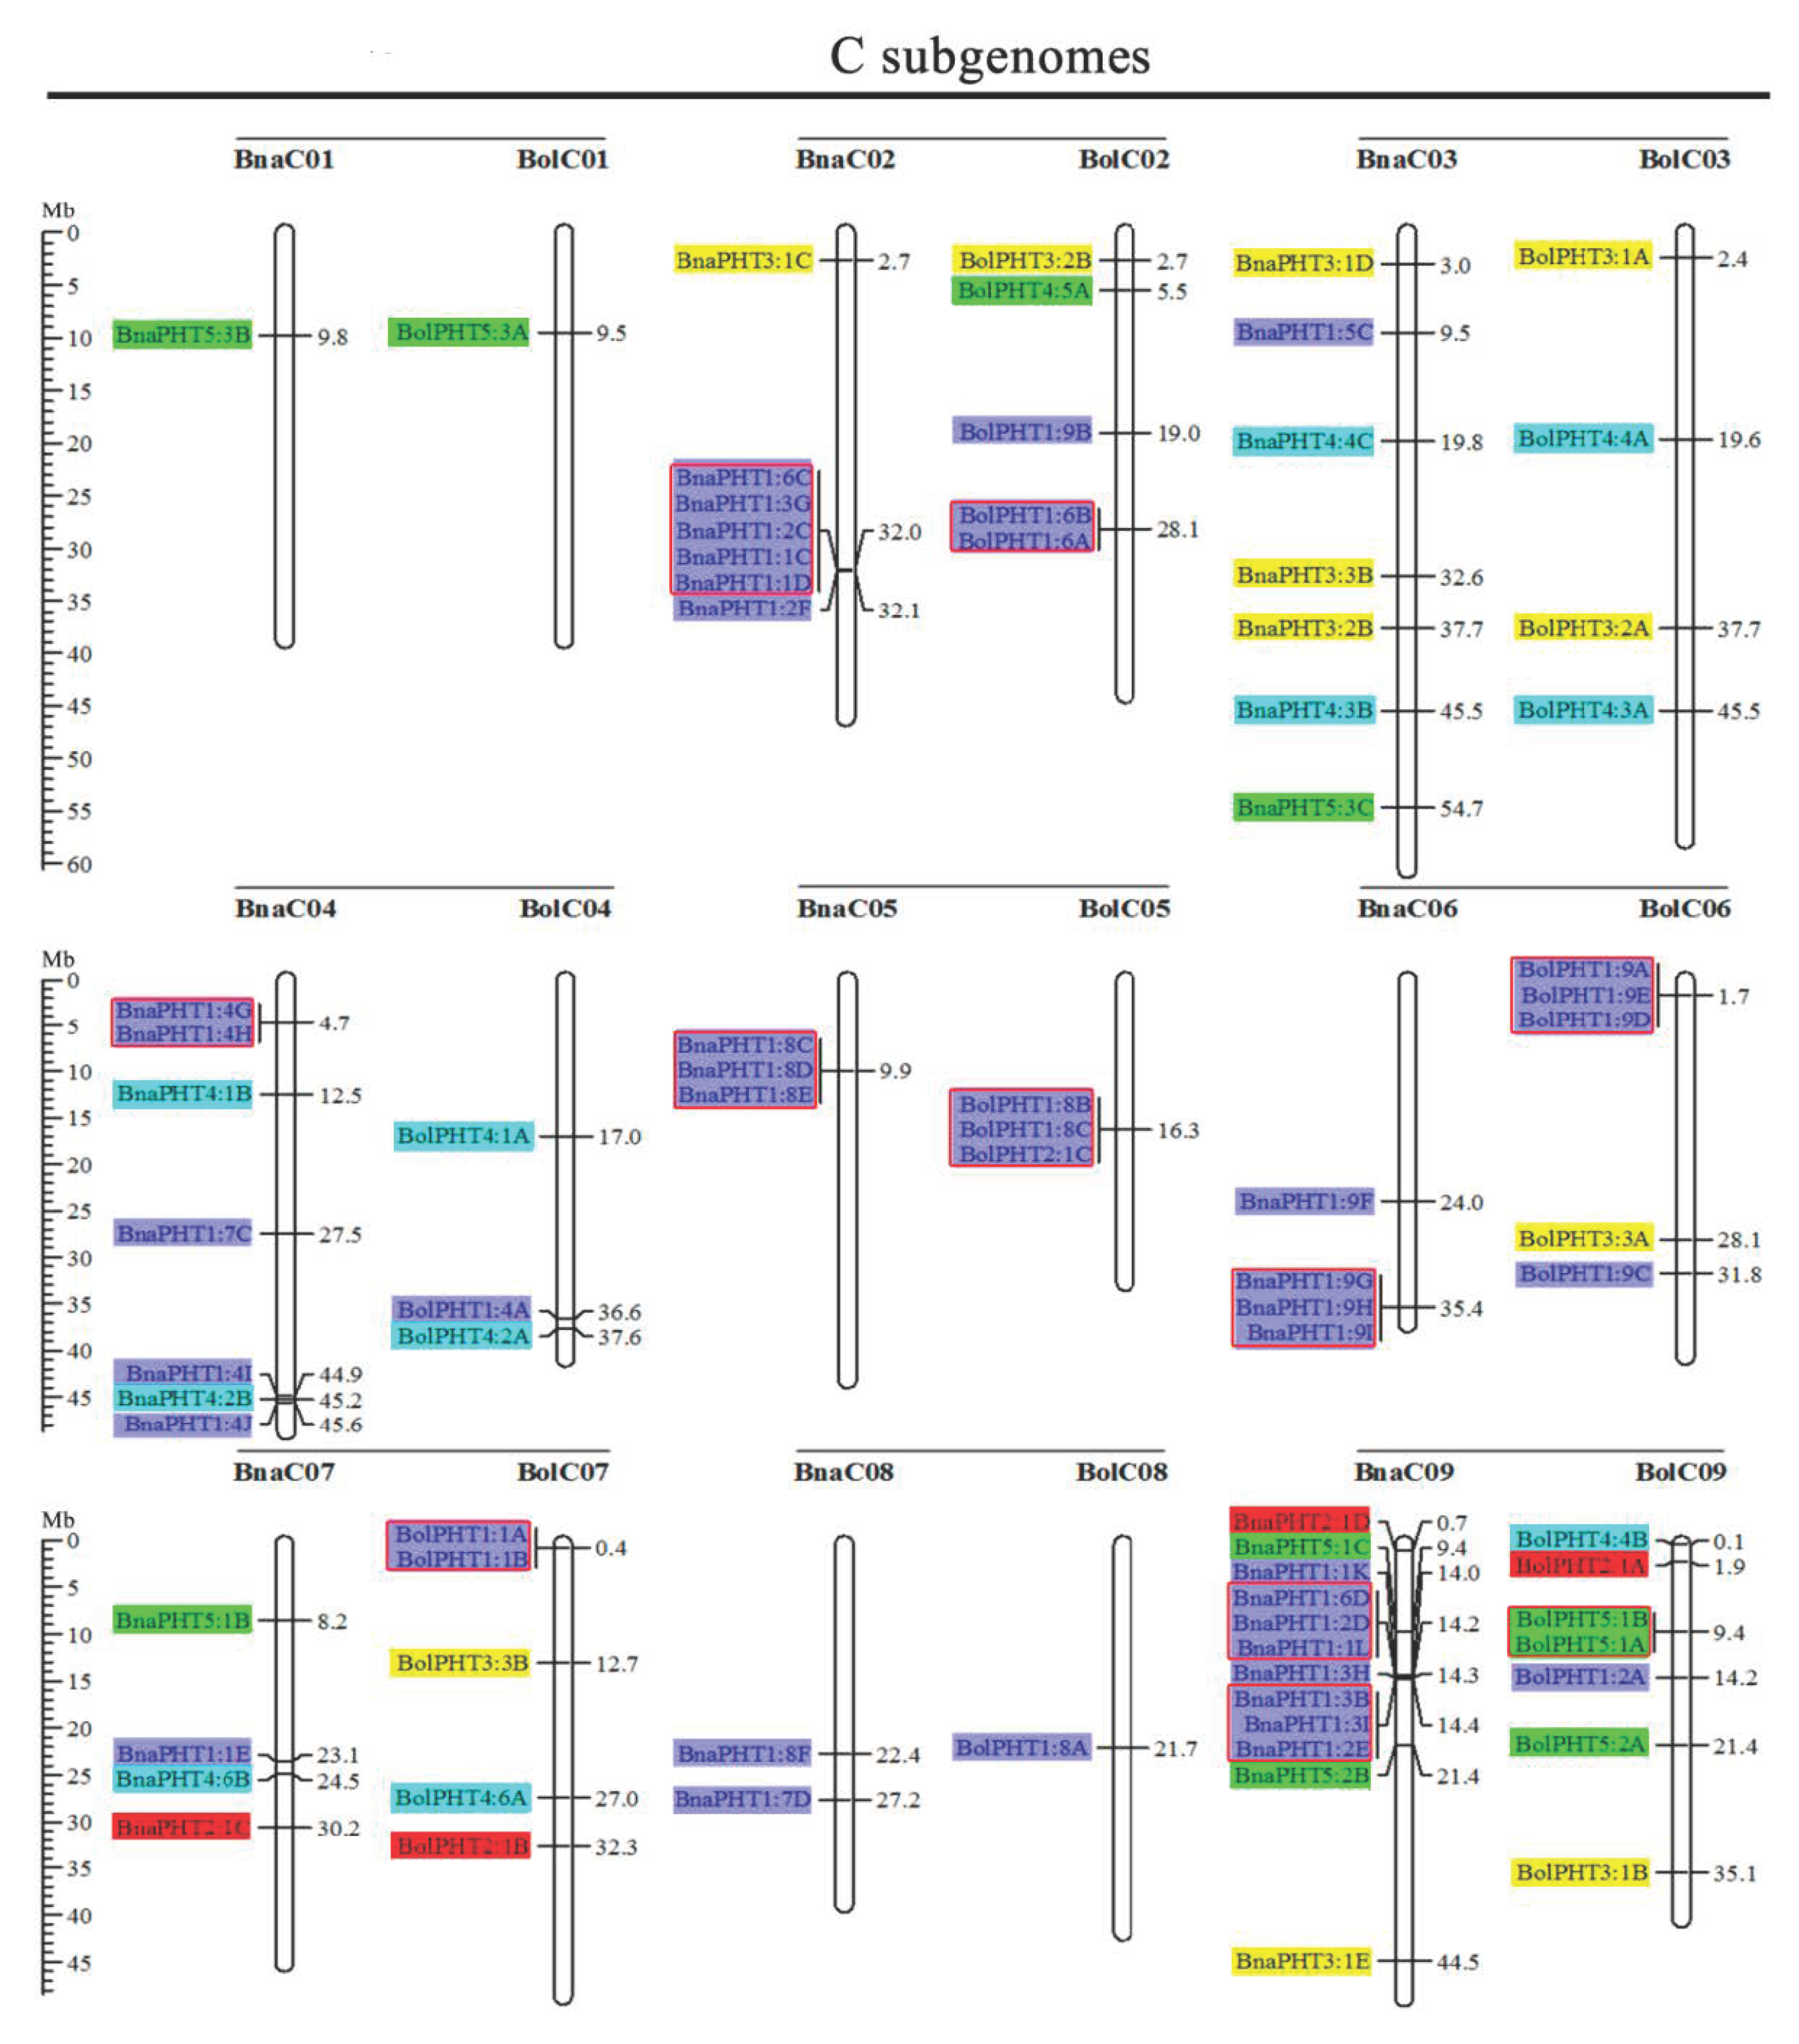
2.2. Chromosome Localizations of PHT Genes in the Five Brassica Species

Based on the physical positions of the PHT genes annotated in the general feature format GFF files in the Brassica Database (BRAD), we marked the physical locations of 336 Brassica PHT genes on the physical maps of B. rapa, B. oleracea, B. nigra, B. juncea, and B. napus (Figure 2). In the B. rapa genome, 12 PHT genes are located on chromosome BraA09, which contains the most PHT genes, whereas chromosomes BraA01, BraA08, and BraA10 each contain only one PHT gene. In the B. oleracea genome, chromosome BolC09 contains the most PHT genes (7), whereas chromosomes BolC01 and BolC08 each contain only one PHT gene. In the B. nigra genome, chromosome BniB09 contains the most PHT genes (9), whereas chromosome BniB01 contains only one PHT gene. In the B. juncea genome, chromosome BjuA06 contains the most PHT genes (11), whereas chromosomes BjuA01, BjuA08, BjuA10, and BjuB07 each contain only one PHT gene. Finally, in the B. napus genome, 12 PHT genes are located on chromosome BnaC09, which contains the largest number of PHT genes, whereas chromosomes BnaA01, BnaA08, BnaA10, and BnaC01 each contain only one PHT gene. A total of 302 PHT family members were accurately mapped onto the 69 (BraA, BolC, BniB, BjuA, BjuB, BnaA, and BnaC) chromosomes (Figure 2), but the others (34 genes) were located in the 17 scaffold fragments (Table S1), and which were unevenly distributed on all the whole chromosomes, and generally more abundant at the both ends of the chromosomes in the five Brassica species (Figure 2).

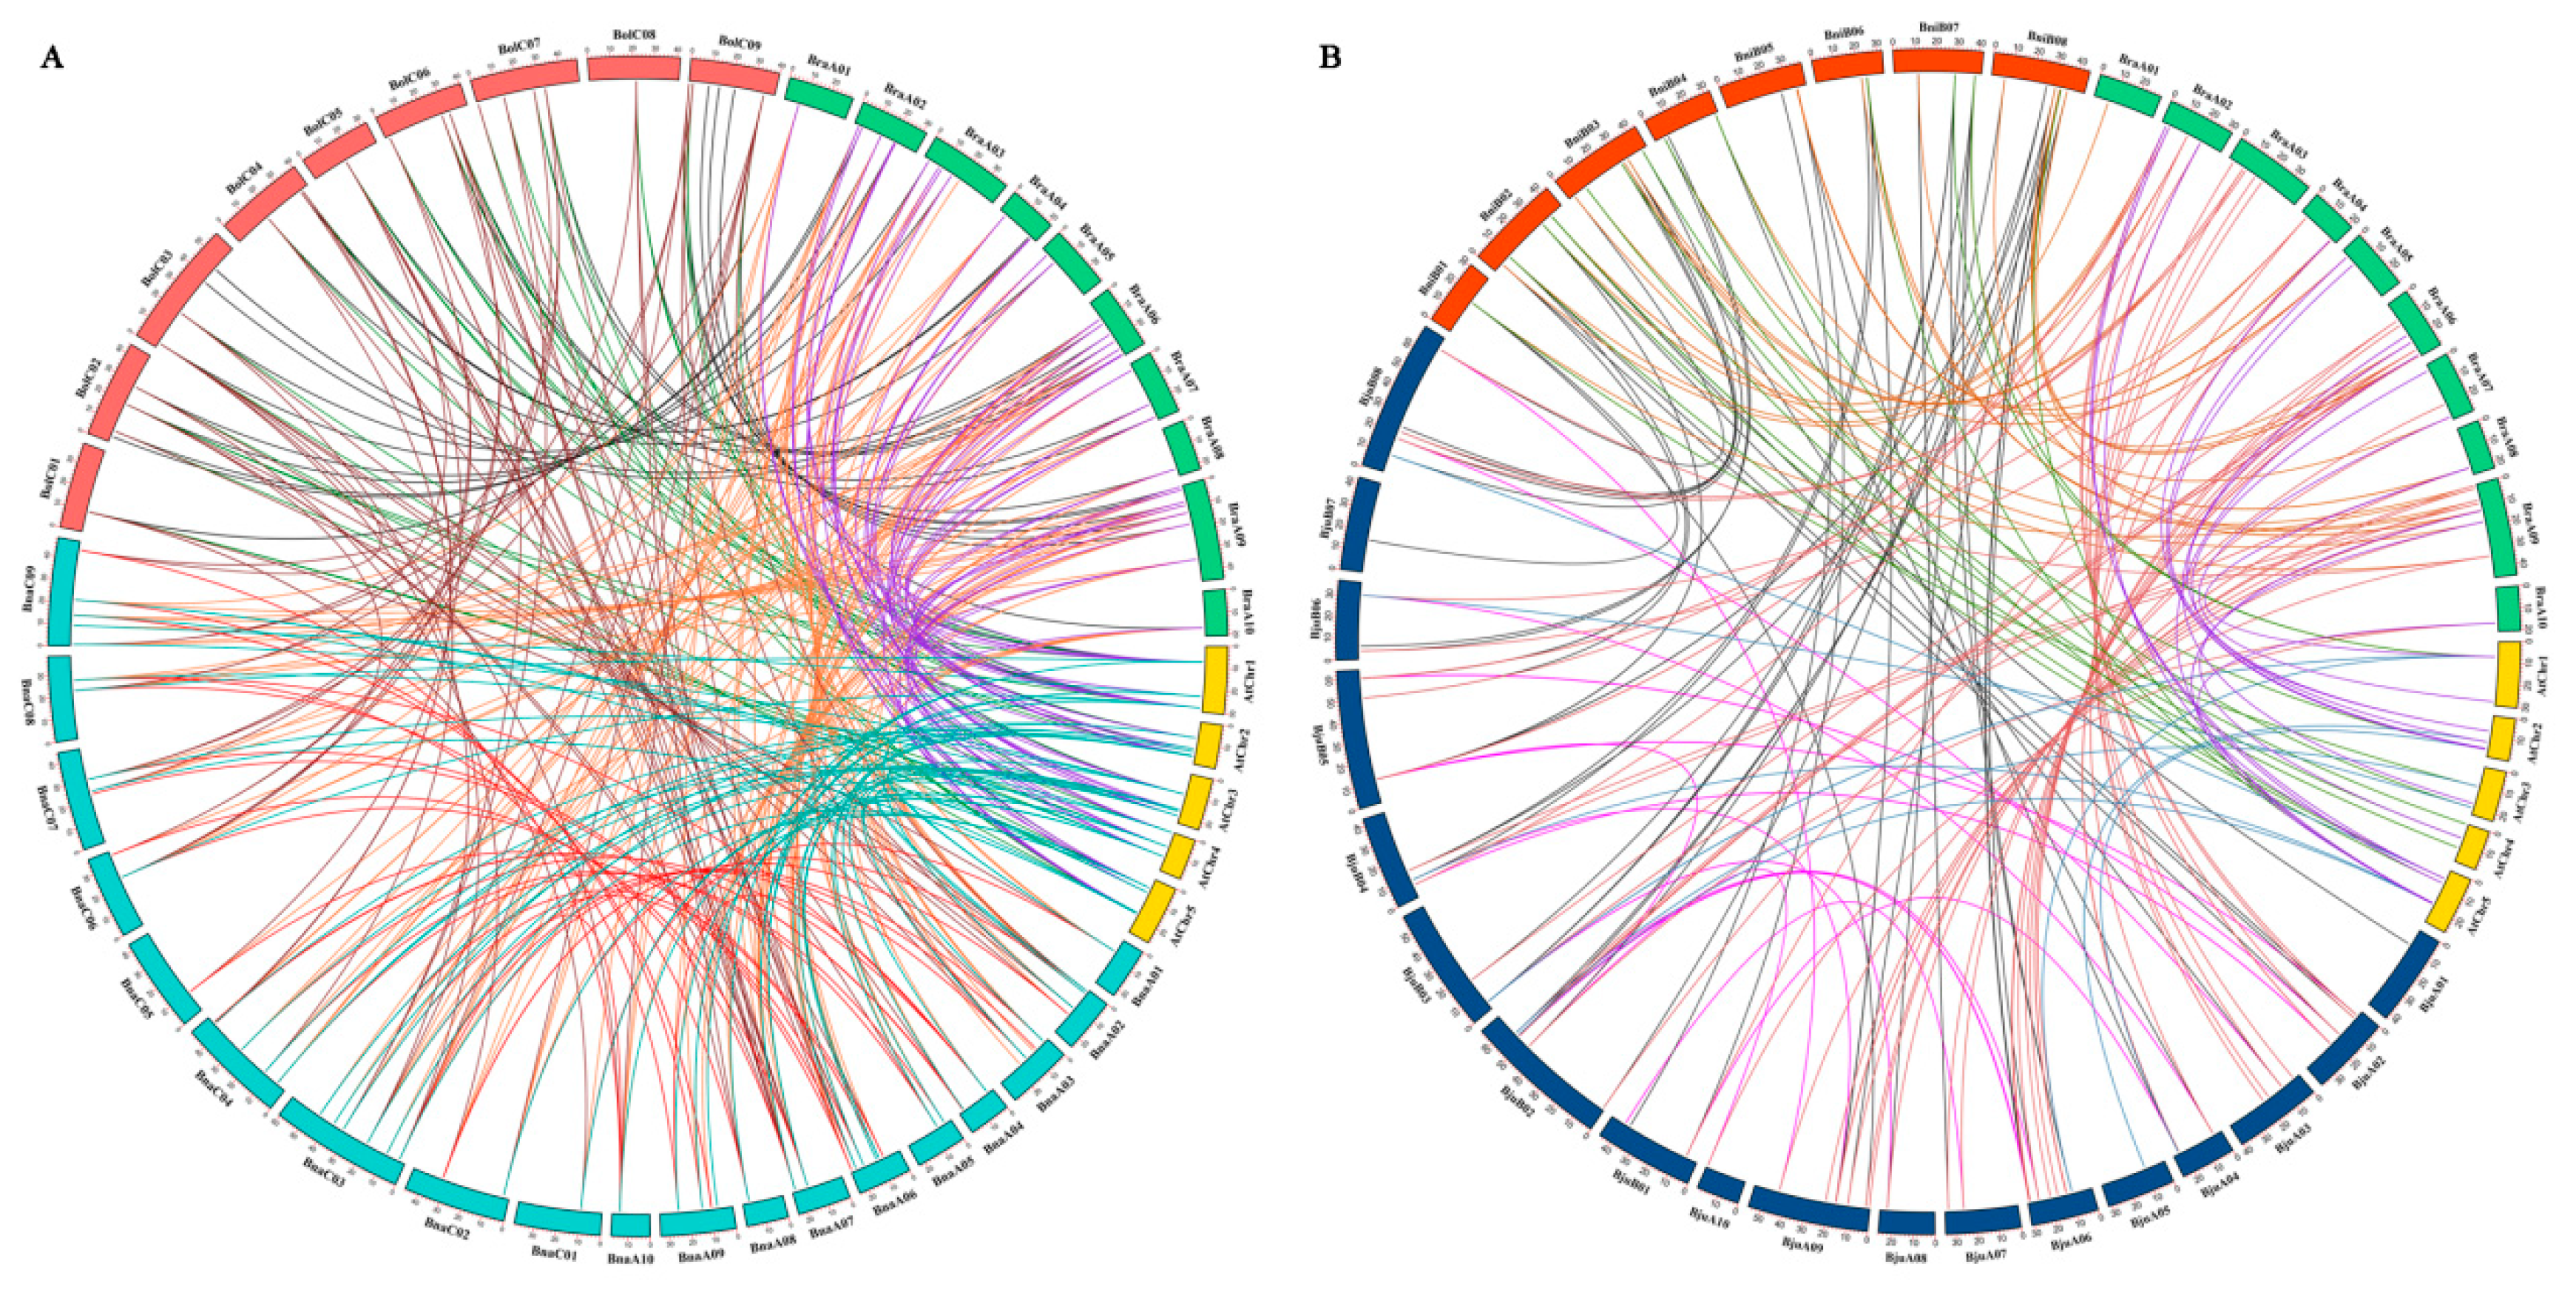
2.3. Analysis of Duplication and Synteny of PHT Genes Among the Five Brassica Species

Segmental and tandem duplications play important roles in the occurrence of new gene functions and the amplification of gene families [55]. Thus, we analyzed the duplication events of the PHT genes. The number of PHTs in the allotetraploid B. napus (108) is approximately 1.2-fold than in diploid B. rapa (54) plus B. oleracea (34). The number of PHTs in the allotetraploid B. juncea (85) is less than that in B. rapa (54) plus B. nigra (55) (Figure 2 and Table 1). These findings suggest that the PHT family evolved from diploid B. rapa and B. oleracea to tetraploid B. napus mainly through whole-genome duplication (WGD) but that it evolved from diploid B. rapa and B. nigra to tetraploid B. juncea mainly through gene loss. As shown in Figure 2, most homologous gene pairs between different genomes were contained in the corresponding localization blocks. For example, members of subgroups PHT5:3, PHT3:1, and PHT4:5 were mapped to the tops of chromosomes A01 (BnaA01, BraA01, and BjuA01) and A02 (BnaA02, BraA02, and BjuA02), and PHT4:2 and PHT1:4 were localized to the bottom of chromosome A04 (BnaA04, BraA04, and BjuA04). Therefore, most PHT family members were localized to the corresponding positions of chromosomes with high levels of synteny among the five Brassica species (Figure 2). In addition, few PHTs were mapped onto chromosome BjuA05 (1), BjuB03 (2), and BjuB07 (1), and there were fewer PHTs in the allotetraploid species than in diploid species B. rapa and B. nigra (Figure 2), suggesting that they might have lost PHT genes after the polyploidization events.
Gene clusters (included two or more genes) within a 100-kb range of the same chromosomal regions were defined as tandem duplication [55]. We identified 114 PHT family members that were clustered into 40 tandem duplication event regions in the A, B, and C subgenomes from B. rapa (8), B. oleracea (5), B. nigra (5), B. juncea (10), and B. napus (12) (Figure 2). However, different orthologous copies of most PHT1 gene(s) were retained in the tandem duplication regions, such as PHT1:4 in chromosomes BnaA05, BraA05, and BniB04 and PHT1:9 in chromosomes BnaA07, BraA07, BjuA07, and BniB07 (Figure 2).
To explore the amplification mechanism of PHT family genes, we performed synteny analysis of PHTs among A. thaliana and the five Brassica species. Collinearity analysis indicated that most syntenic orthologous PHT family gene pairs among the five Brassica species were retained in collinear blocks in different subgenomes (Figure 3, Figure S1 and Table S2). We identified 101, 27, and 59 orthologous PHT genes between B. rapa and B. napus, B. rapa and B. oleracea, and B. oleracea and B. napus (Figure 3A and Figure S1A) and 60, 32, and 53 orthologous PHT genes between B. rapa and B. juncea, B. rapa and B. nigra, and B. nigra and B. juncea, respectively (Figure 3B and Figure S1B). In addition, 32 and 16 orthologous PHT genes were detected in the BnaA and BnaC subgenomes of B. napus and the BjuA and BjuB subgenomes of B. juncea, respectively. These results indicate that these PHT family genes have a high degree of retention among the five Brassica species or experienced less loss when the diploid species (B. rapa, B. oleracea, and B. nigra) hybridized with the allotetraploids (B. juncea and B. napus) on the corresponding chromosomes during evolution [56].
We estimated the nonsynonymous substitution rate (Ka), synonymous substitution rate (Ks), and Ka/Ks ratio for each pair of duplicated genes among A. thaliana and the five Brassica species. The Ka/Ks ratios of the duplicates were less than 1, except for BraA02g031250 and BjuO002713, BjuB020400 and BniB012386, BnaA09g16490D and BnaC09g17550D, and BraA03g039090 and BnaA03g35470D (Table S2). These results suggest that most of these PHT family genes were subjected to purifying selection after duplication.

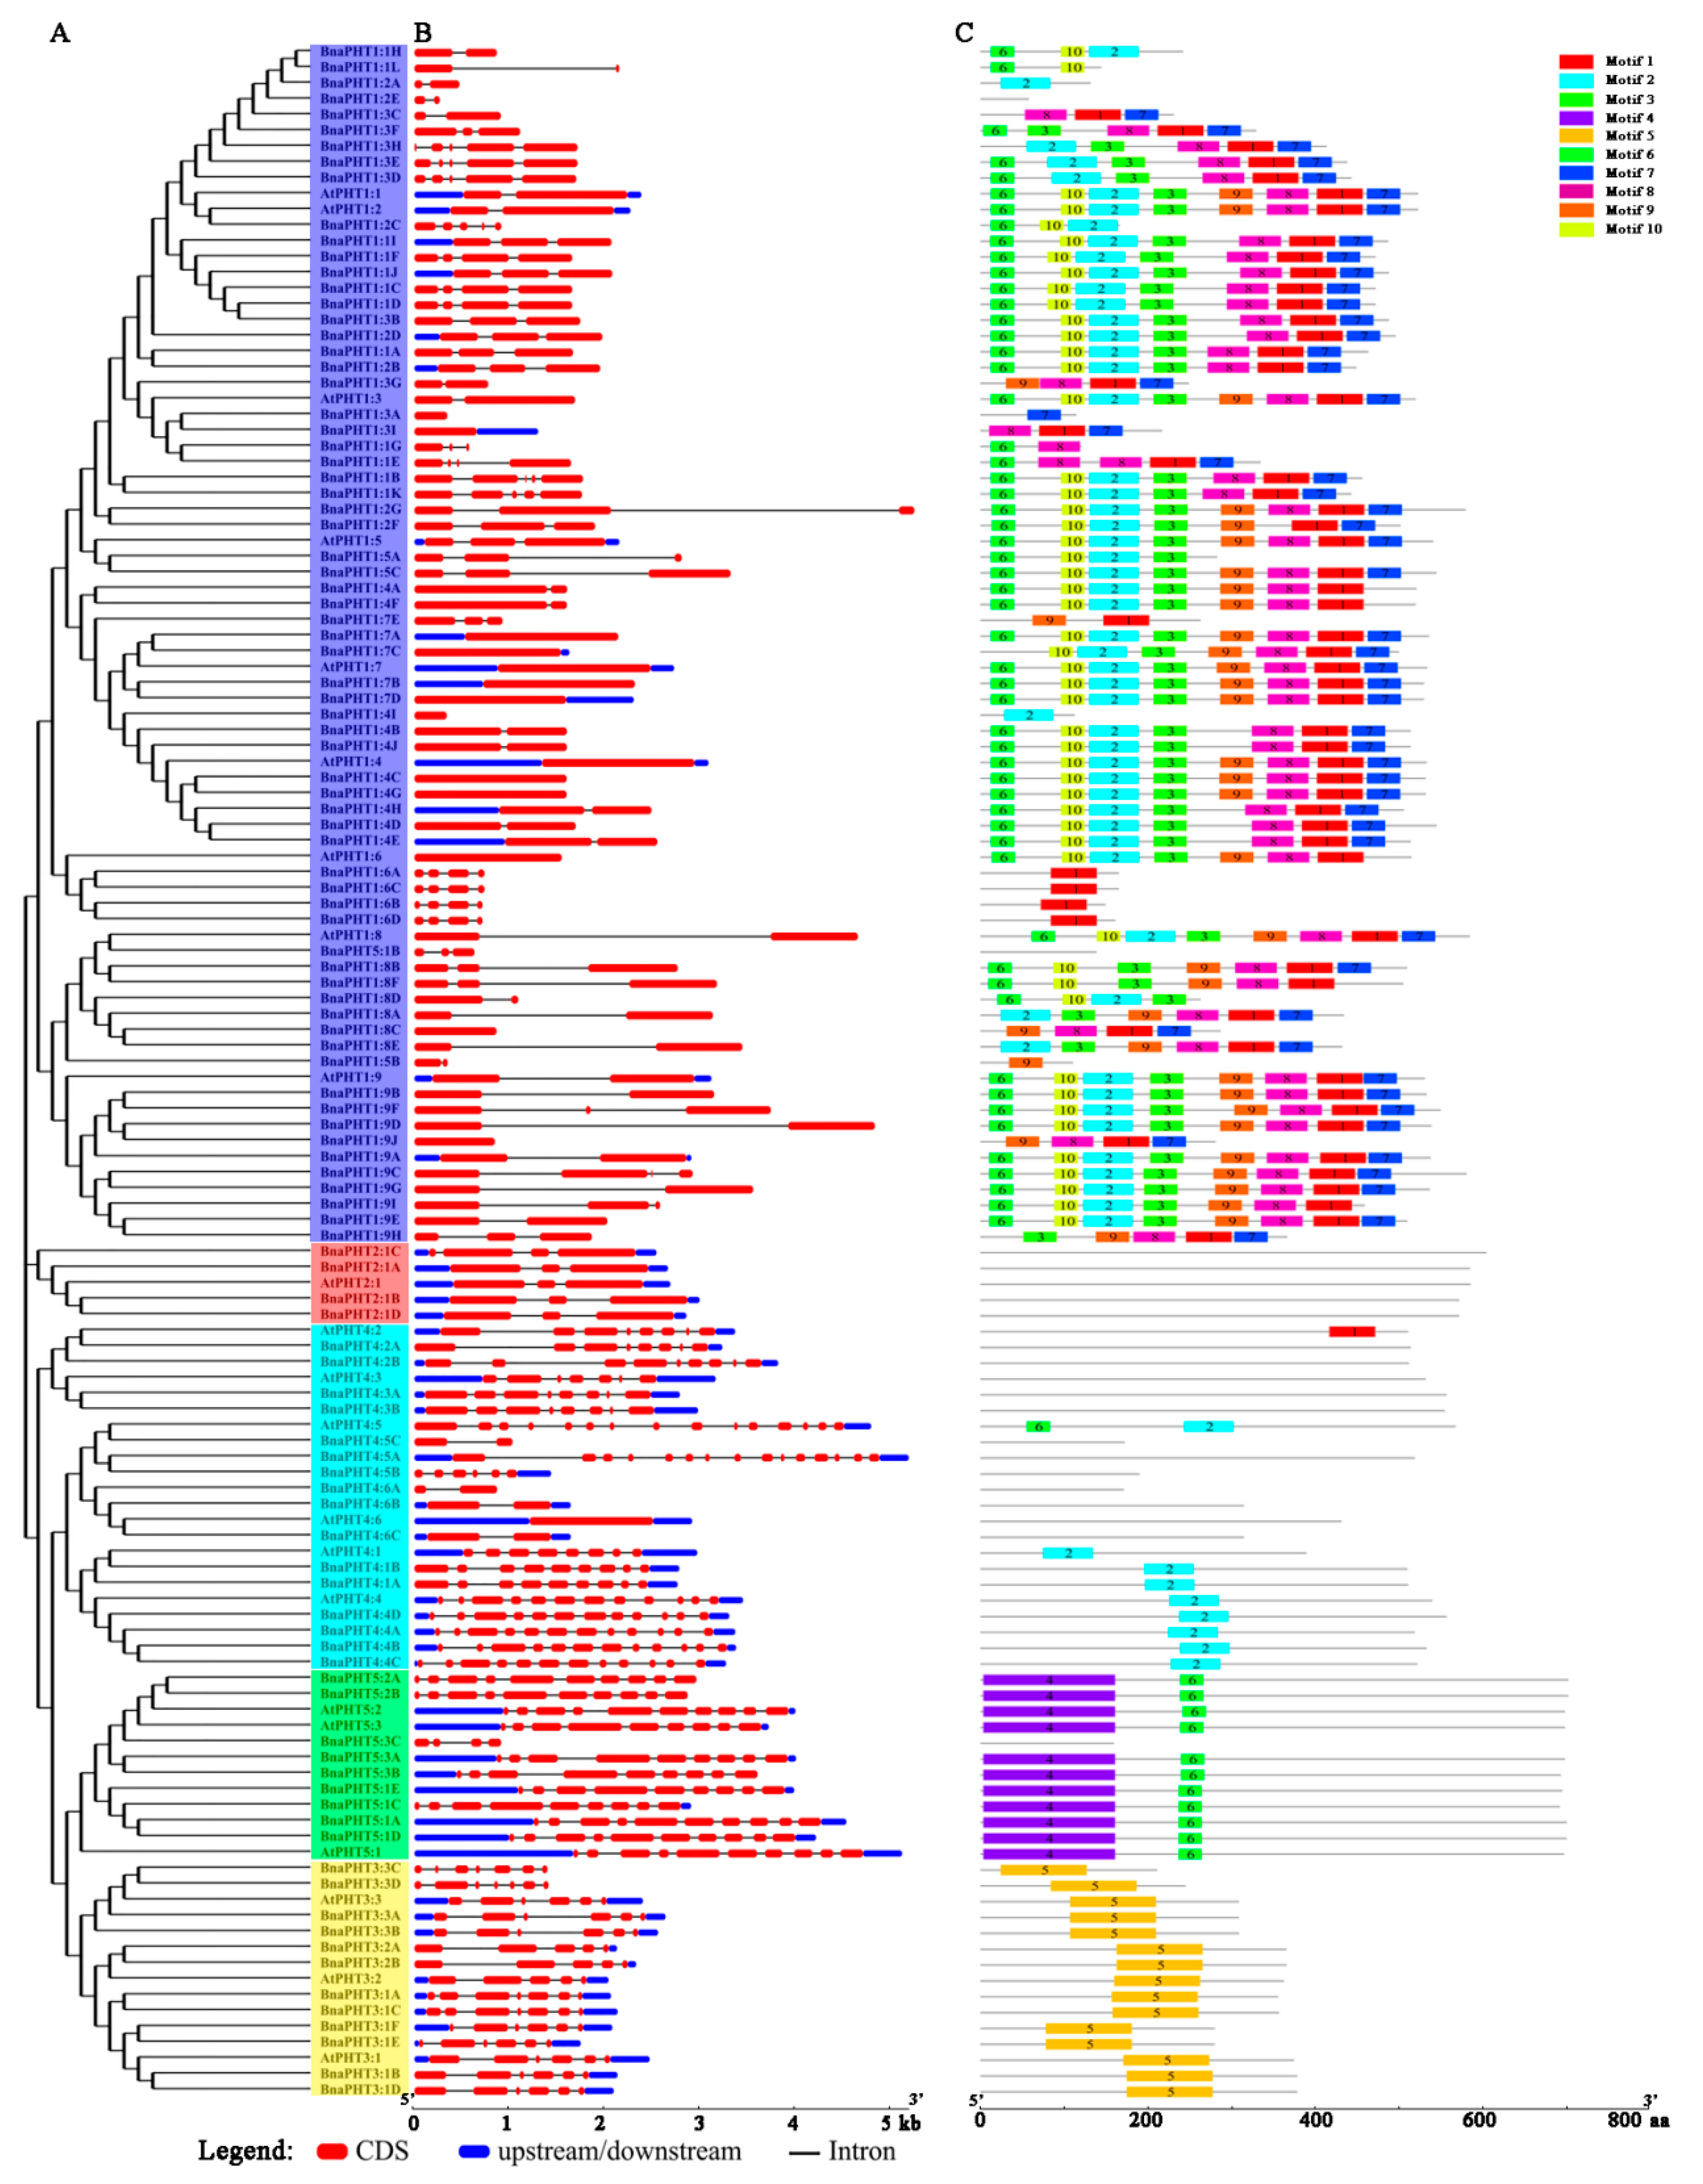
2.4. Gene Structural and Conserved Motif Analyses of PHT Family Genes in B. napus

To further explore the structural components of the BnaPHT genes, we analyzed the exon/intron arrangements of 22 AtPHTs and 108 BnaPHTs by comparing the full-length coding sequences (CDS) and the corresponding genomic DNA sequences using GSDS v2.0 (http://gsds.cbi.pku.edu.cn/index.php) based on phylogenetic analysis (Figure 4A). The 130 PHTs contained multiple numbers of exons varying from 1 to 15, indicating a high degree of divergence among genes (Figure 4B and Table S1). For example, members of the PHT1 and PHT2 subgroups contained fewer than five exons, whereas members of the PHT3, PHT4, and PHT5 subgroups appeared to be more variable, with exon numbers ranging from 2 to 15 (Figure 4B). In general, the most closely grouped genes had highly similar structures in terms of intron numbers or exon lengths, and BnaPHT genes in different categories exhibited different exon/intron structural features.
Subsequently, we compared the distribution of conserved motifs to better explore the specific regions of the 22 AtPHT and 108 BnaPHT proteins. Ten distinct conserved motifs (named Motif 1–10) were captured by MEME v4.12.0 (http://meme-suite.org/tools/meme) (Figure 4C). The motifs ranged from 10 to 159 amino acids in size (Figure S2). Similar conserved motif compositions were shared among members of each group identified by phylogenetic analysis. Whereas variable motifs, including motif 1, 2, 3, 6, 7, 8, 9, and 10, were widely detected in the PHT1 proteins, and motifs 6 and 7 were comprised on the N and C-terminal domains of PHT1, respectively, and BnaPHT1:6 only contained motif 1. In addition, members of the PHT2 subgroup had no motifs, PHT3 subgroup members only contained motif 5, PHT4 subgroup members had different motif compositions (motif 2 in PHT4:1 and PHT4:4, others contained few motifs), and all PHT5 subgroup members contained motifs 4 (in N-terminal) and 6, except for BnaPHT5:3C (Figure 4C). In summary, the same conserved motifs are widely shared among paralogous/orthologous genes, suggesting they encode proteins with similar functions.

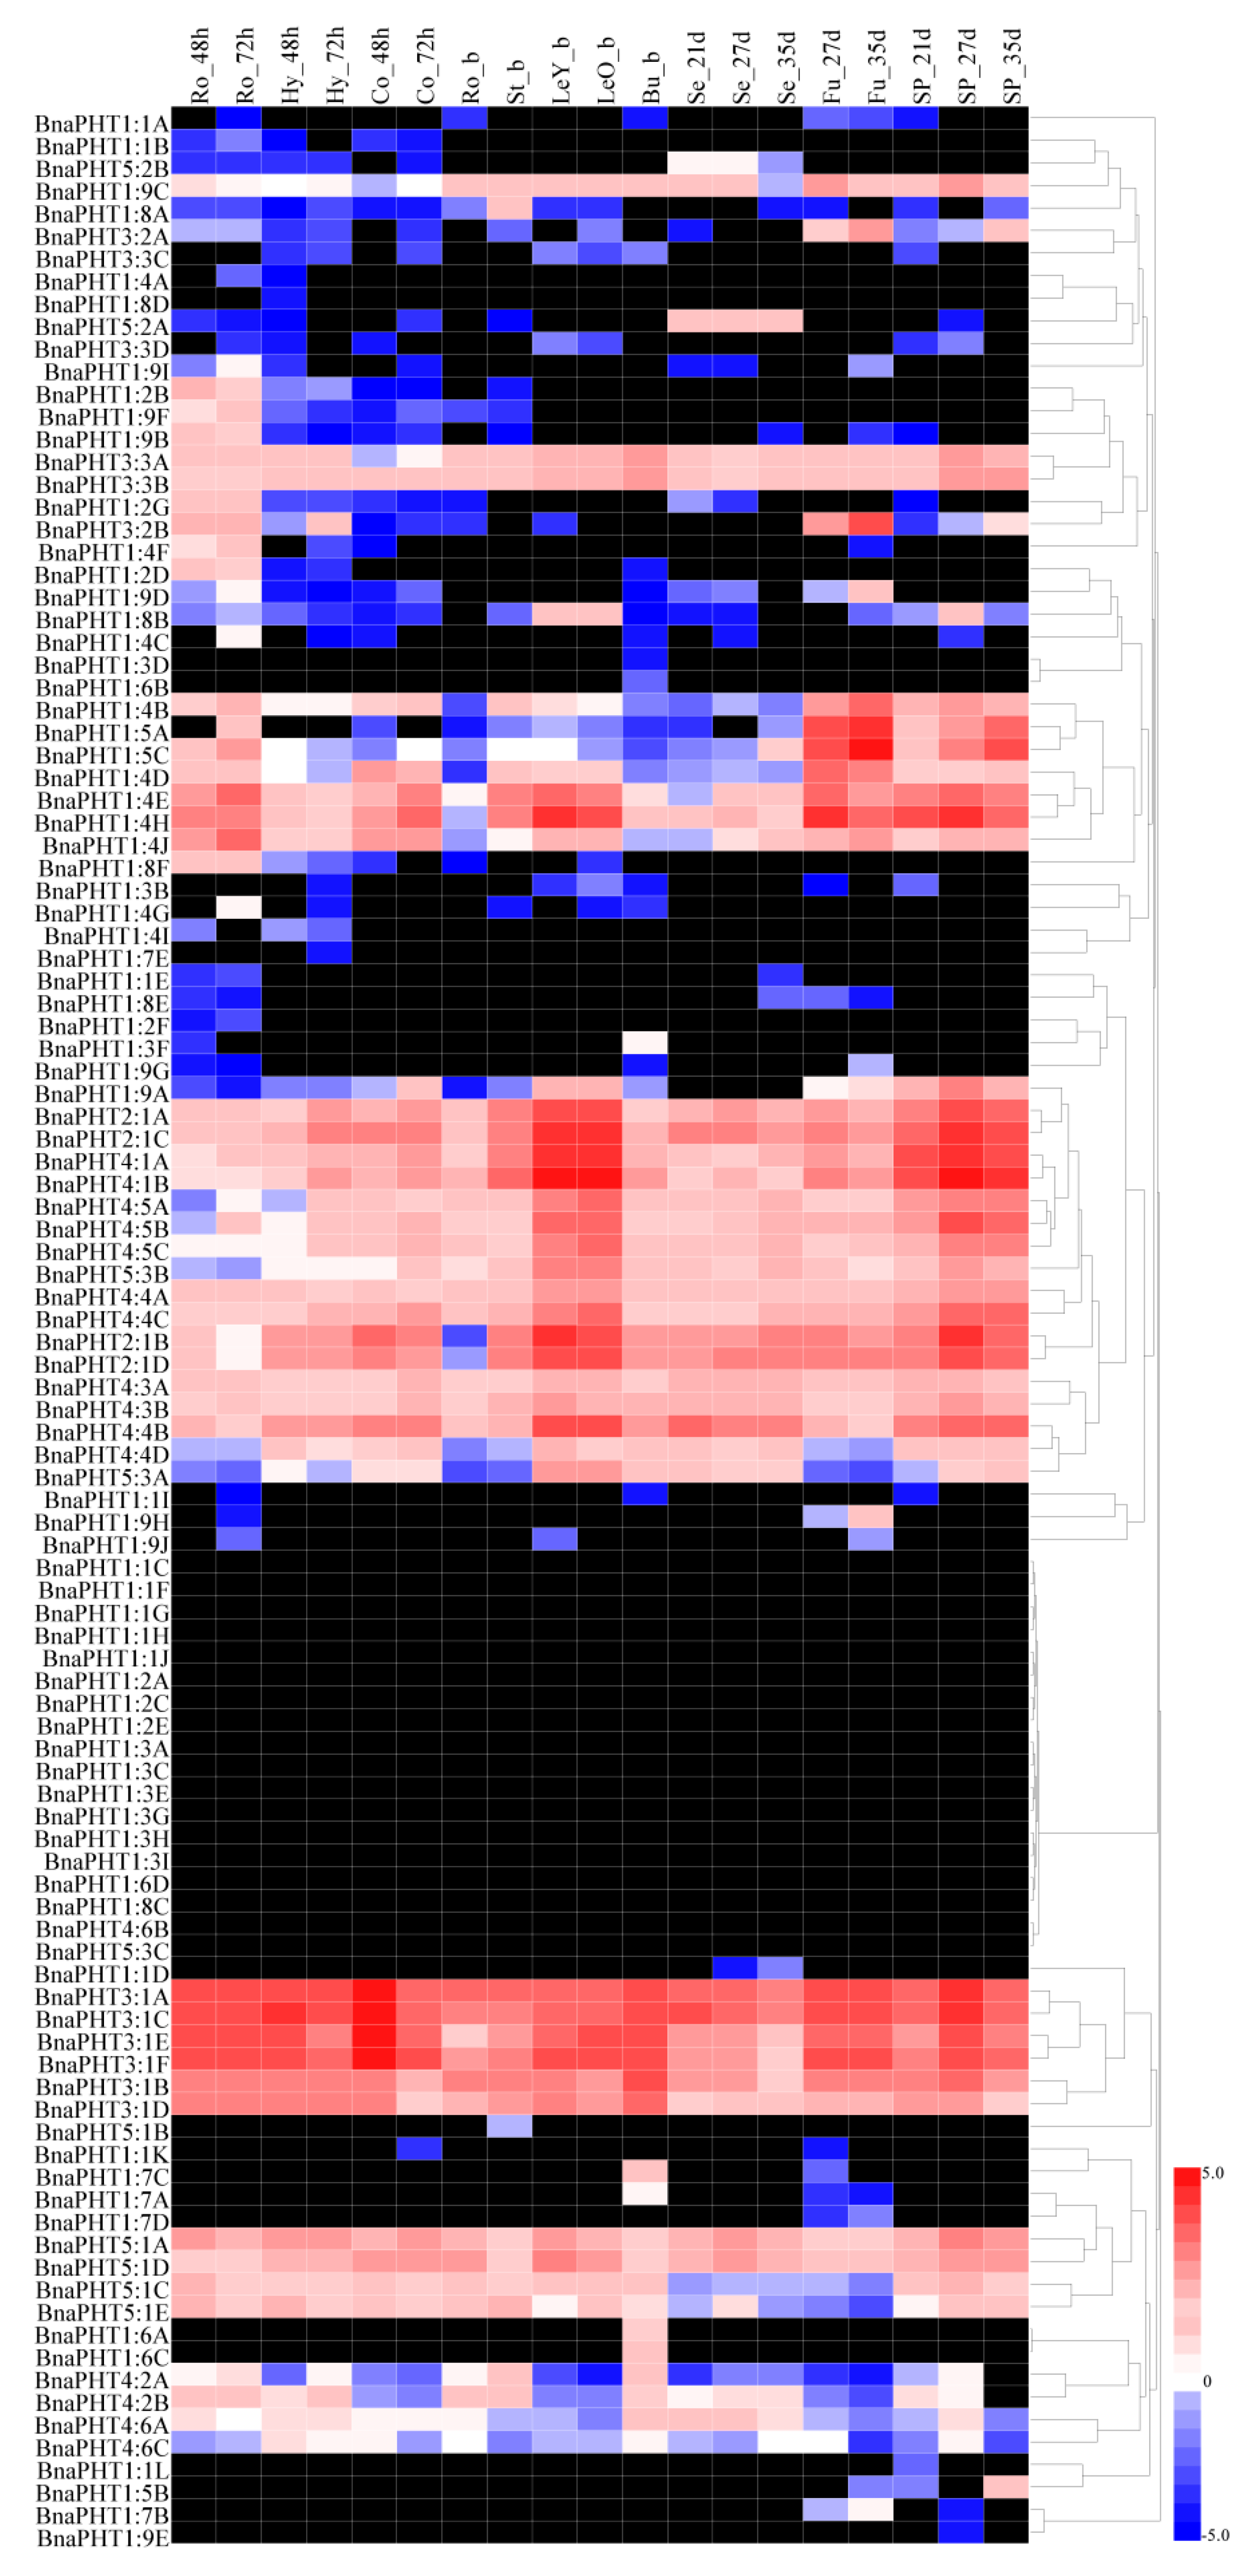
2.5. Transcriptional Patterns of BnaPHT Family Genes in B. napus

Based on a transcriptional sequencing data set for B. napus ZS11 (BioProject ID PRJNA358784), we characterized the expression profiles of BnaPHT genes in different tissues, including radicle, hypocotyl, cotyledon, root, stalk, young leaf, old leaf, bud, seed, funicle, and seed coat tissue (Table S3). Heat map analysis showed that most BnaPHTs were differentially expressed in different tissues at different stages of development in B. napus (Figure 5 and Table S4). For instance, most BnaPHT1 subfamily members showed little or no detectable expression, but BnaPHT2, BnaPHT3, BnaPHT4, and BnaPHT5 were consistently expressed at high levels in most tissues, suggesting that BnaPHTs are involved in multiple processes during plant growth and development. Most BnaPHT1 genes showed almost no expression in any tissue, whereas most BnaPHT1:4 and BnaPHT1:5 genes were expressed at high levels during B. napus development (Figure 5 and Table S4). However, most members of subgroups BnaPHT2 to BnaPHT5 showed different expression patterns except for BnaPHT4:6B, BnaPHT5:1B, and BnaPHT5:3C. For instance, four BnaPHT2:1 subgroup members (BnaPHT2:1A-D) and six BnaPHT3:1 subgroup members (BnaPHT3:1A to BnaPHT3:1F) were expressed at relatively high levels throughout development, whereas BnaPHT4 subgroup members were primarily expressed in leaves (Figure 5). The expression patterns of BnaPHT family genes also corresponded with the results of phylogenetic analysis (Figure 1). For example, the expression patterns of BnaPHT3:1E and BnaPHT3:1F, BnaPHT3:1A and BnaPHT3:1C, and BnaPHT4:1A and BnaPHT4:1B were similar. These genes were classified into the same sister groups and are syntenic genes (Figure 1 and Figure 5). These results demonstrate that most BnaPHTs have tissue-specific or preferential expression patterns.

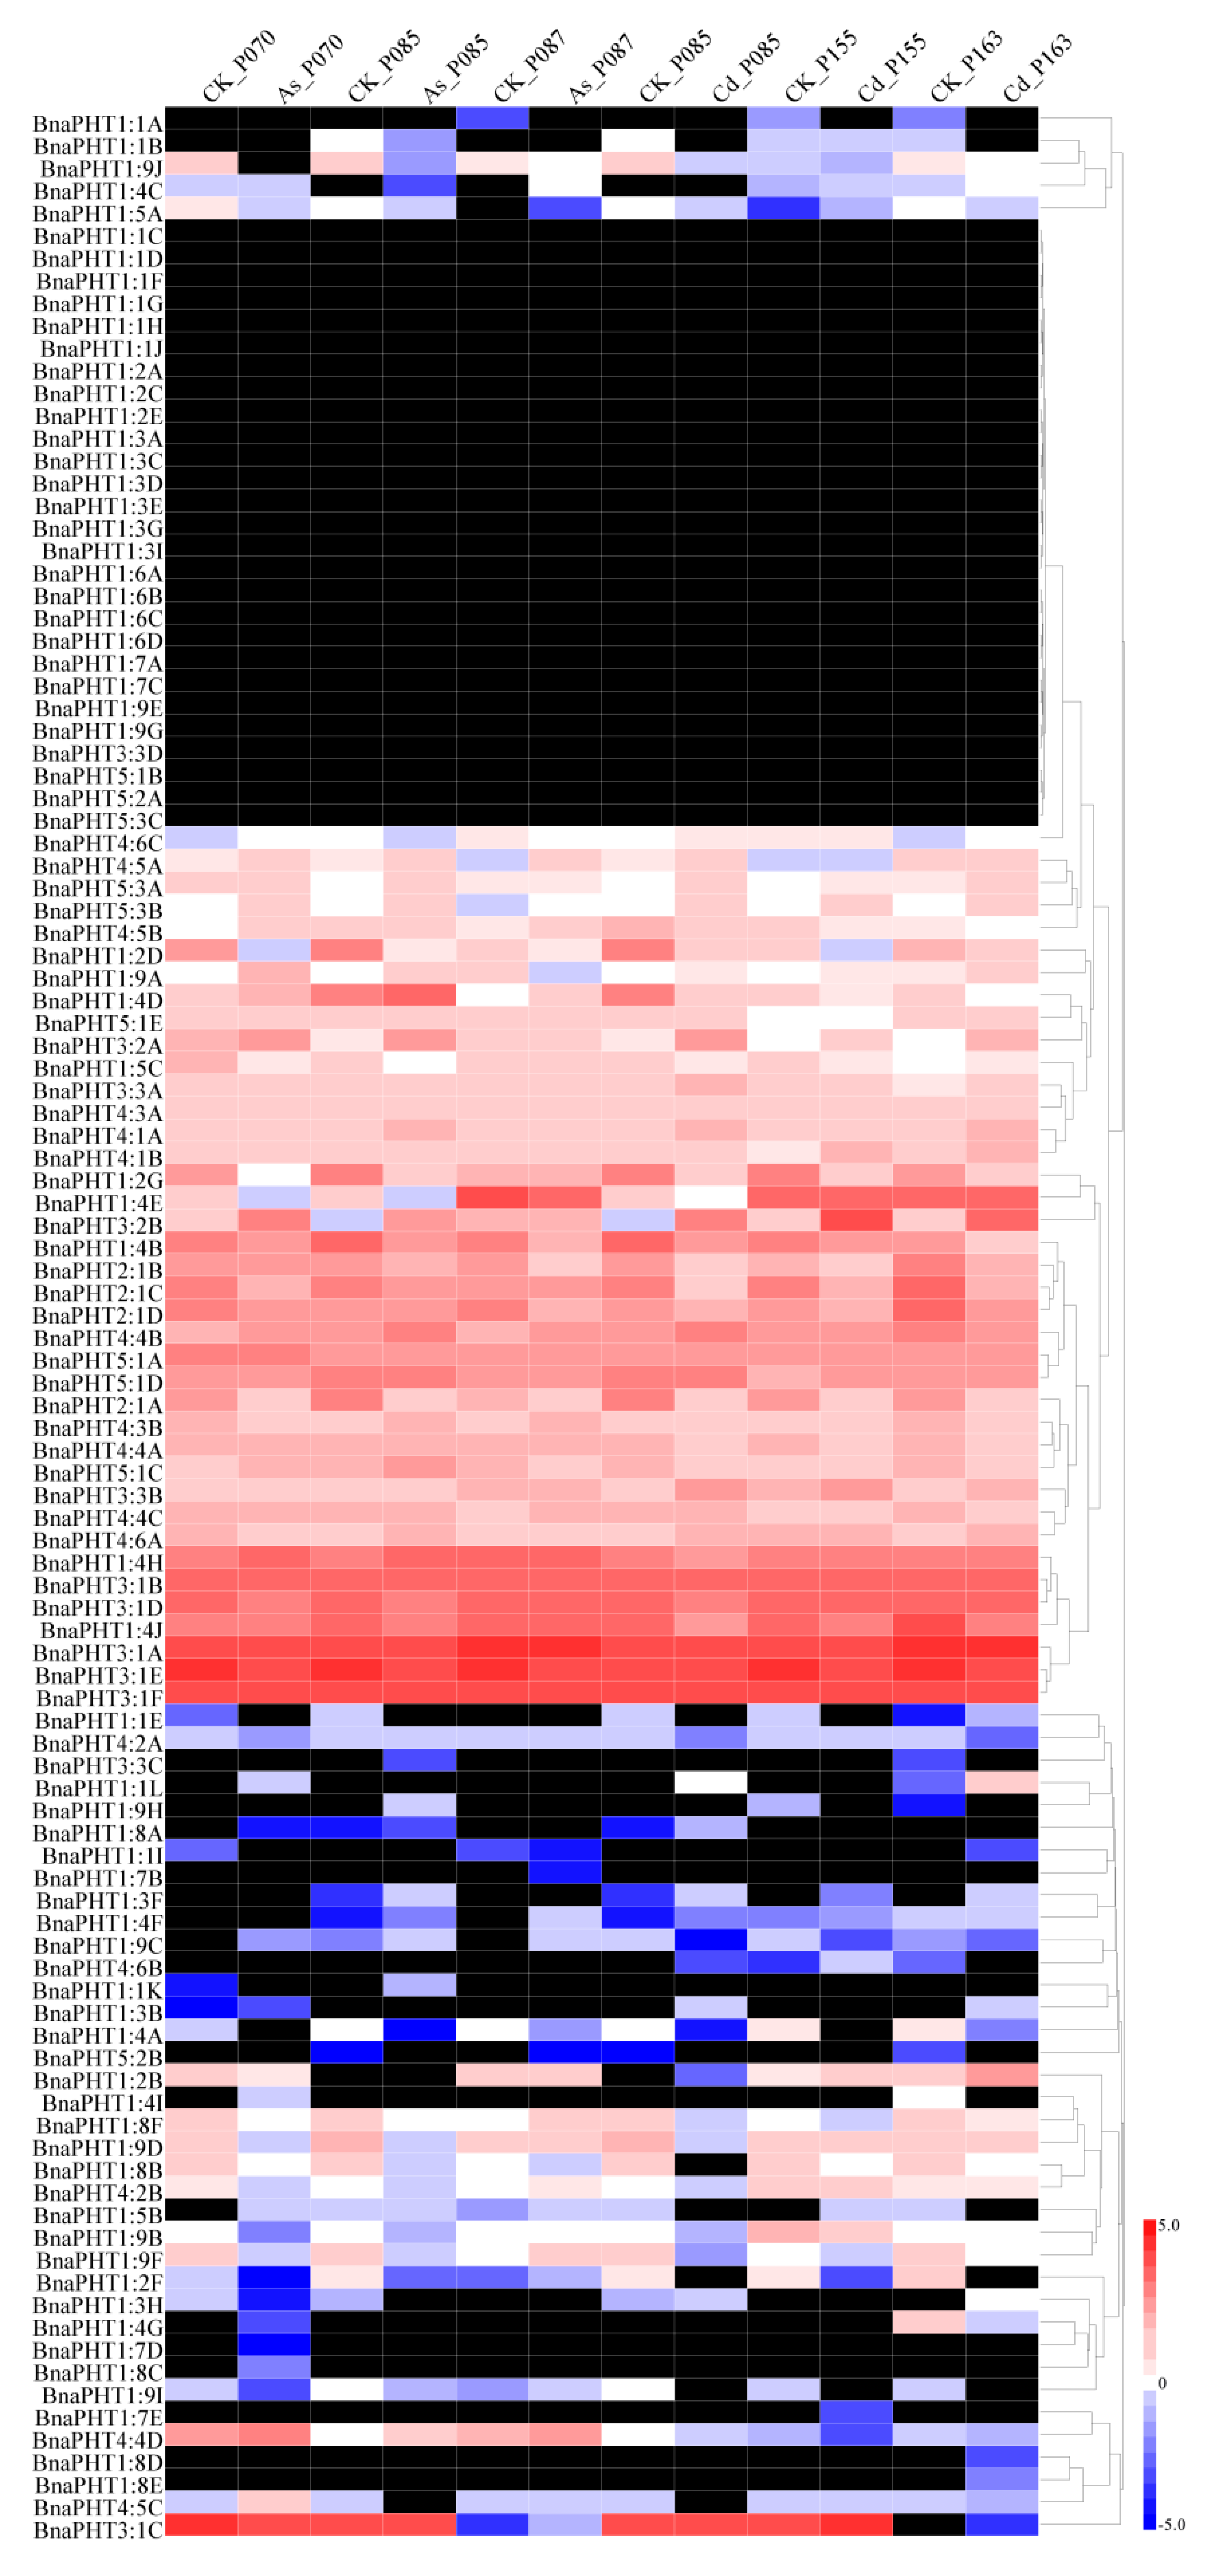
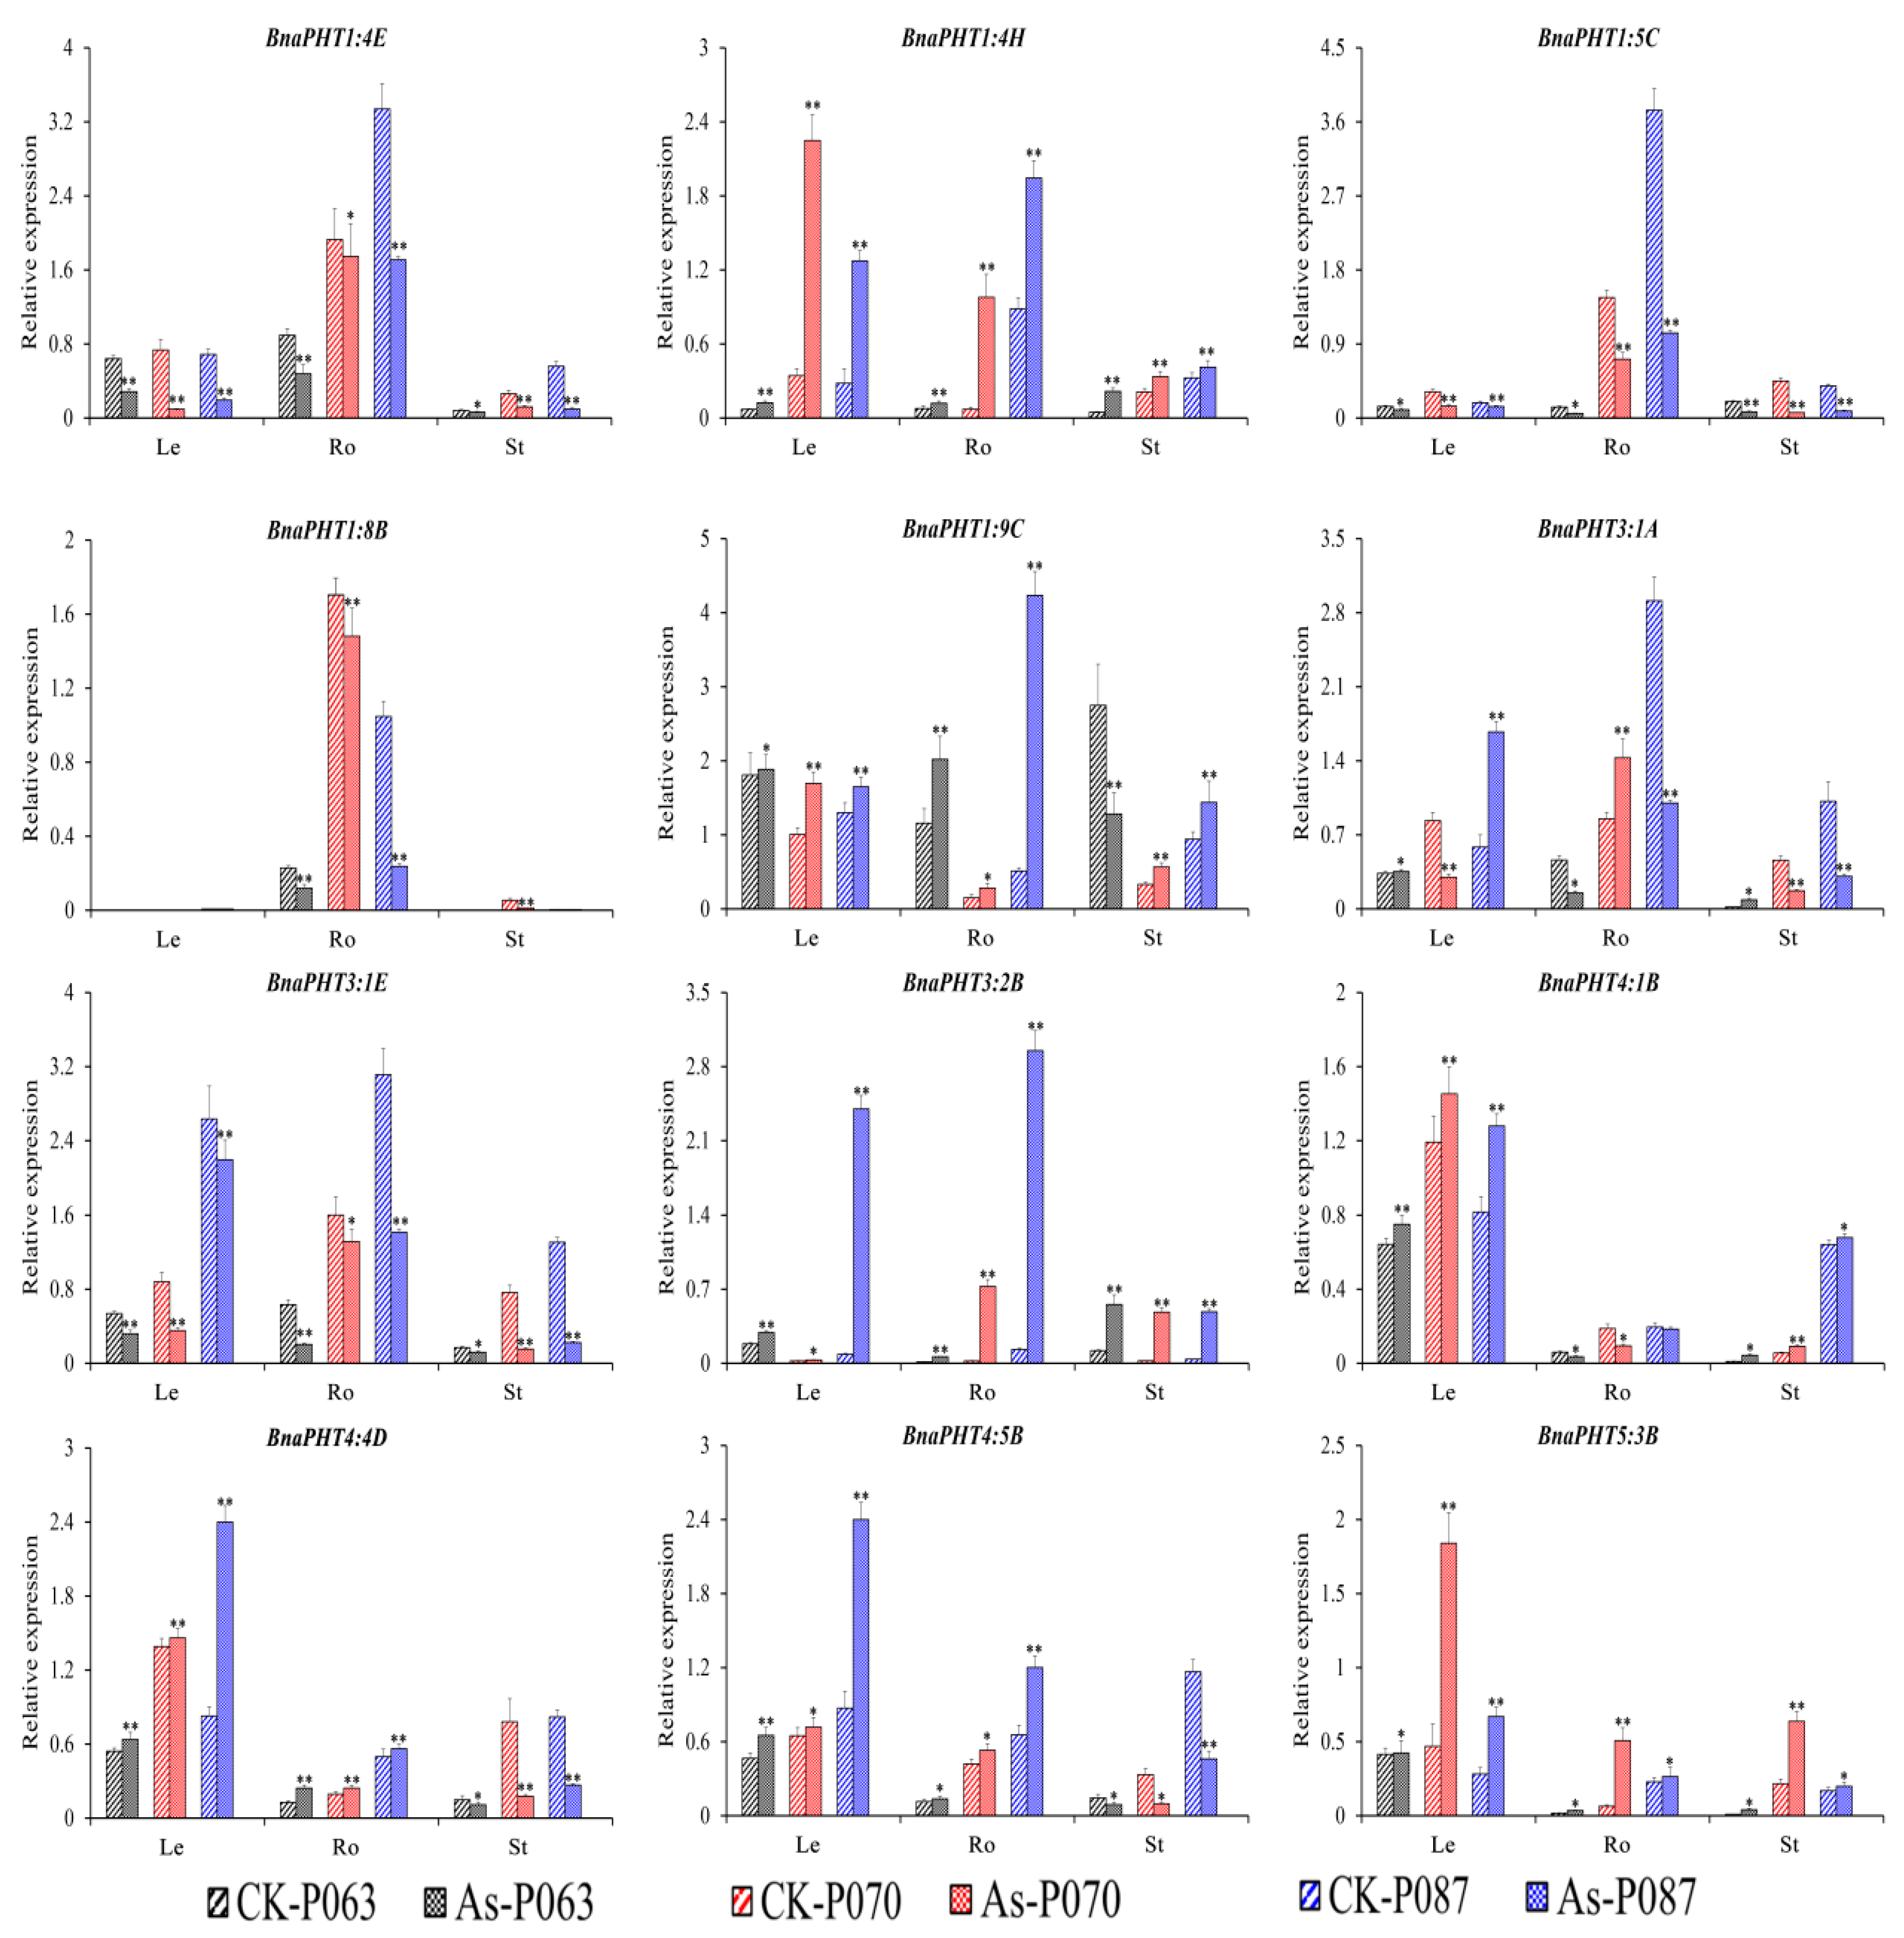
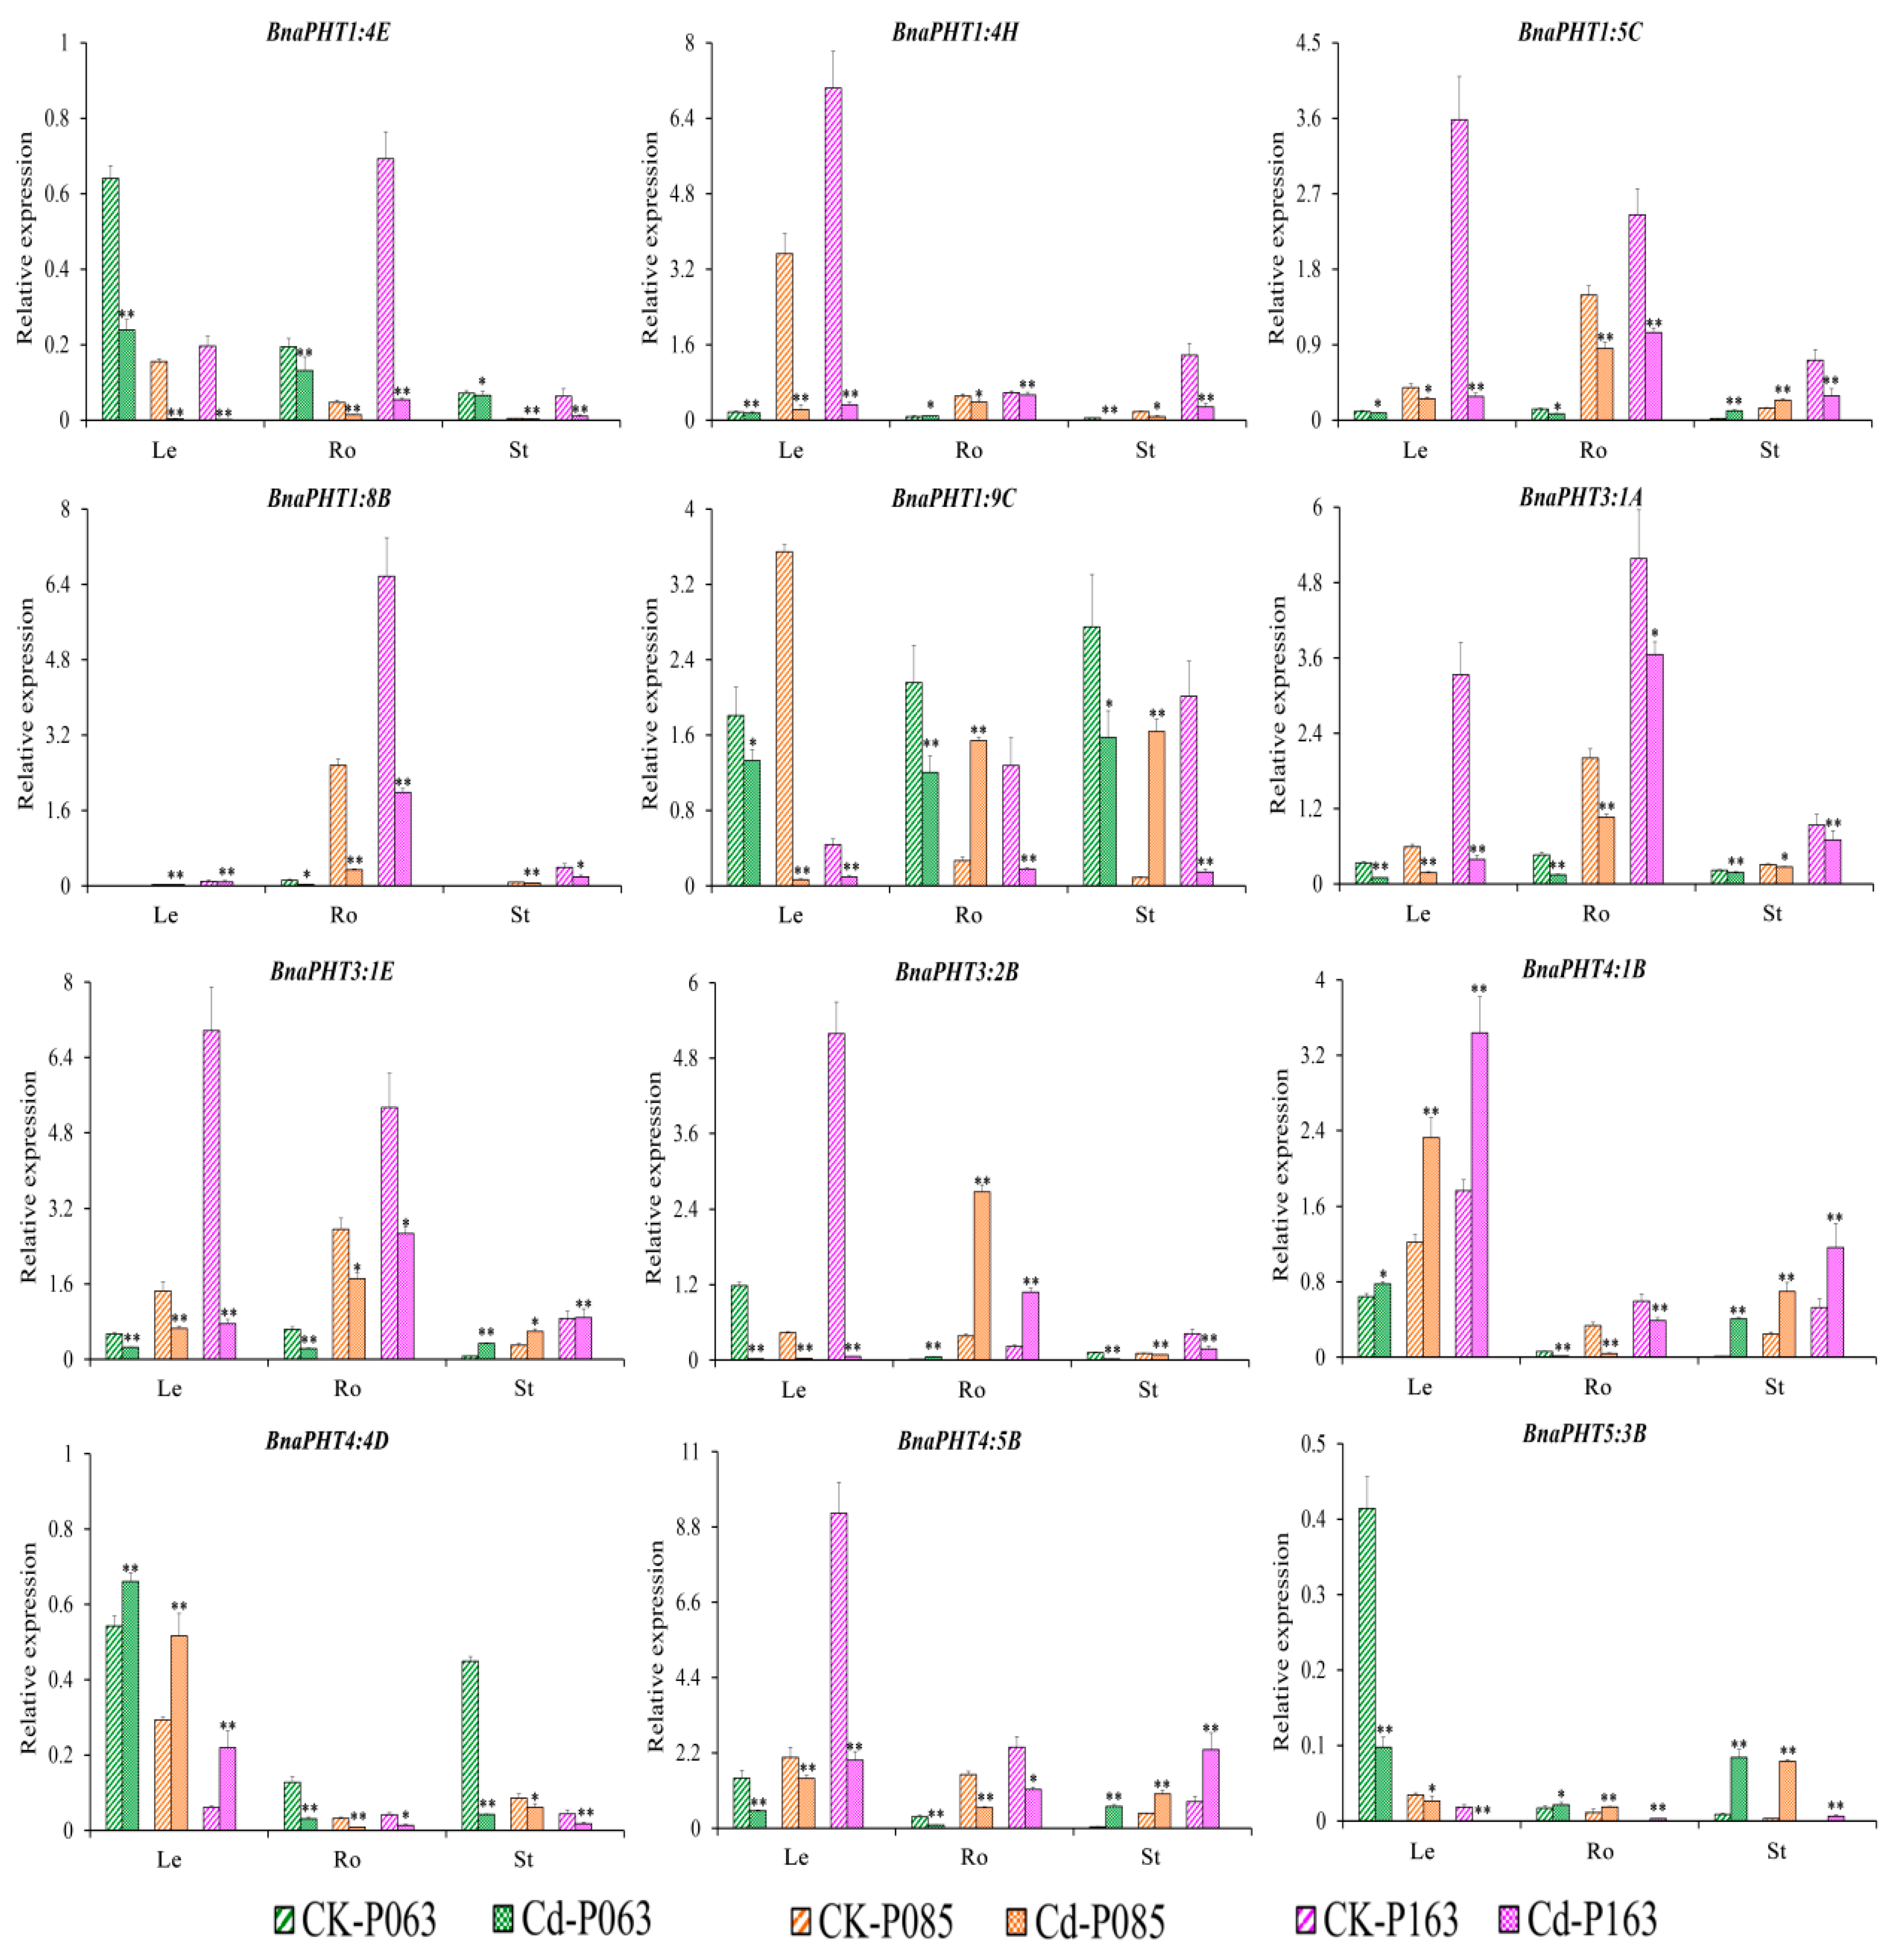
2.6. BnaPHT Transcript Patterns in Response to As3+ and Cd2+ Treatment

As PHT family proteins also function in the acquisition of heavy metals [46,49,50,51], we next selected rapeseed accessions with different levels of resistance to As3+ (3) and Cd2+ (3) and subjected them to 15 mg/L As3+ and 30 mg/L Cd2+ treatment (Figure S3). Subsequently, we compared the expression levels of PHT genes in the rapeseed accessions under As3+ and Cd2+ treatment using a recently developed RNA-seq method. Most BnaPHT genes were not obviously induced by either heavy metal (As3+ or Cd2+), including BnaPHT1:1, BnaPHT1:3, BnaPHT1:6, and BnaPHT1:7, while a few PHT family members were up- or downregulated by these treatments. For example, BnaPHT1:4A, BnaPHT1:4B, BnaPHT1:4E, BnaPHT2:1, and BnaPHT4:2 were downregulated by treatment with both heavy metals (As3+ and Cd2+), and BnaPHT1:9A, BnaPHT3:2, BnaPHT4:5A, BnaPHT5:1D, BnaPHT5:3A, and BnaPHT5:3B were upregulated by both treatments (Figure 6 and Table S5). In addition, a few PHT family members showed different expression patterns after treatment with As3+ vs. Cd2+. For instance, BnaPHT1:4D, BnaPHT1:4H, BnaPHT1:9C, and BnaPHT4:5B were upregulated by As3+ treatment but downregulated by Cd2+ treatment, and BnaPHT3:3A and BnaPHT3:3B showed the reverse expression pattern (Figure 6 and Table S5). PHT family members including BnaPHT1:2B, BnaPHT1:8F, BnaPHT4:4A, BnaPHT4:4C, BnaPHT4:5C, and BnaPHT5:1C were repressed by Cd2+ but not As3+ treatment (Figure 6 and Table S5).
In summary, our results indicate that BnaPHT family genes have a wide variety of expression patterns in B. napus, and a few BnaPHTs are obviously induced by heavy metals, providing useful information for further elucidating the roles of BnaPHTs in the response of B. napus to heavy metal stress.

2.7. Expression Analysis of BnaPHTs under As3+ and Cd2+ Treatment

To confirm the role of BnaPHTs in plant tolerance to heavy metal stress, we subjected various rapeseed accessions to one week of heavy metal treatment (As3+ or Cd2+). Different accessions showed different responses to these treatments (Figure S3). Based on the transcriptome data, we selected 16 genes of interest for further verification by qRT-PCR (Table S6). The expression patterns of the BnaPHTs identified by qRT-PCR were similar to the patterns identified by RNA-seq (Table S5), with different expression profiles detected among different rapeseed accessions (Figure 7 and Figure 8). The expression profiles of four genes (BnaPHT1:1C, BnaPHT1:7C, BnaPHT3:3D, and BnaPHT5:1B) are not shown because they were expressed at very low levels in all organs under As3+ and Cd2+ treatment.
Under As3+ treatment, four BnaPHTs (BnaPHT1:4E, BnaPHT1:5C, BnaPHT1:8B, and BnaPHT3:1E) were downregulated and three BnaPHTs (BnaPHT1:4H, BnaPHT3:2B, and BnaPHT5:3B) were upregulated in different organs (roots, hypocotyls, and cotyledons), with similar trends in expression. However, the relative expression levels of these genes significantly differed among samples and tissues (Figure 7), suggesting they represent important candidate genes that function in As3+ stress resistance in B. napus. Under As3+ treatment, BnaPHT1:9C, BnaPHT4:4D, and BnaPHT4:5B were significantly induced in leaves and roots, whereas BnaPHT4:4D and BnaPHT4:5B were significantly repressed in stems. BnaPHT4:1B was significantly induced in leaves and stems but repressed in roots in response to As3+ treatment (Figure 7). These results suggest that these genes have different functions in different organs.
Under Cd2+ treatment, various genes (BnaPHT1:4E, BnaPHT1:4H, BnaPHT1:8B, and BnaPHT3:1A) were significantly downregulated in different organs (roots, hypocotyls, and cotyledons). By contrast, BnaPHT4:1B was upregulated in leaves and stems but downregulated in roots under Cd2+ treatment, while BnaPHT5:3B was significantly upregulated in roots and stems but downregulated in leaves (Figure 8). In addition, BnaPHT3:1E, BnaPHT3:2B, and BnaPHT4:4D were upregulated in stems, roots, and leaves but downregulated in other organs in response to Cd2+ treatment (Figure 8). These results suggest that these genes have different functions in the plant response to Cd2+ stress.
In summary, several genes (BnaPHT1:4E, BnaPHT1:8B, and BnaPHT4:1B) showed similar expression patterns in response to As3+ and Cd2+ stress, suggesting they might function in heavy metal tolerance. However, other genes were also induced by As3+ or Cd2+ stress to a certain extent but showed different expression patterns in different organs. Therefore, the specific mechanism that regulates the expression of the genes that affect heavy metal stress tolerance in rapeseed requires further investigation.

3. Discussion

Plants of the genus Brassica are widely used as oilseed and vegetable crops and to produce condiments and animal feed worldwide. The major Brassica crops include three diploid species (B. rapa, B. nigra, and B. oleracea) and three allotetraploid species (B. napus, B. juncea, and B. carinata) [57,58,59]. With the completion of the genome sequences of these Brassica species, the genetic and molecular functions of interesting genes, such as AP2/ERF, MYB, BOR, CO-like, and GRAS genes, have been widely studied in B. rapa and B. napus [60,61,62,63,64,65]. PHT genes encode H2PO4/H+ co-transporters that are responsible for the absorption and transport of phosphorus in plant roots. The functions of PHT family members have been studied in Arabidopsis, rice, populous, and soybean (Glycine max) [1,66,67], but few studies have focused on PHT genes in Brassica species.
The PHT1 family in Arabidopsis has nine members, eight of which are expressed in roots (e.g., AtPHT1;1, AtPHT1;4, AtPHT1;8, and AtPHT1;9) and play crucial roles in Pi acquisition in both low- and high-P environments. In rice (Oryza sativa), the PHT1 family has 13 members, including OsPHT1;2, OsPHT1;6, OsPHT1;1, and OsPHT1;8, which play redundant roles in root-to-shoot Pi translocation. The PHT1 family has also been studied in Medicago truncatula. MtPT1;1, MtPT1;2, MtPT1;3 and MtPT1;5 are highly expressed in roots under Pi deprivation, but at lower levels in response to high Pi levels [14]. In addition, 49 PHT1 family members were identified in B. napus. These genes might be involved in maintaining the external status of P, N, K, S, and Fe, as well as responses to salt and drought stress [4], but only BnaPHT1:4 was demonstrated to be preferentially expressed in cotyledons during early seedling development [68]. Whereas few reports were focused on the PHT3, PHT4, and PHT5 family genes, and PHT3 family was first reported after cloning the plant mitochondrial transporter genes, which were highly conserved in the mitochondrial transporter family, PHT4 family was similarly expressed in both mutant and wild-type plants, and PHT4:1 may affect salicylic acid-mediated defense. Its expression was regulated by the circadian clock, whereas PHT5:1 played an important role in the adaptation of plants to climatic fluctuation [26,32,69,70,71]. Recently, the entire PHT family (PHT1, PHT2, PHT3, PHT4, and PHT5) was identified from different plants [1,5,71]. In the present study, we conducted comprehensive analysis and identified 336 putative PHT family genes in B. rapa (54), B. oleracea (34), B. nigra (55), B. juncea (85), and B. napus (108). These genes were classified into five subgroups (PHT1, PHT2, PHT3, PHT4, and PHT5; Figure 1 and Table S1) based on the PHT subfamilies in A. thaliana, indicating that they share similar functions. We identified 201 PHT1s, including 34 in B. rapa, 14 in B. oleracea, 35 in B. nigra, 52 in B. juncea, and 66 in B. napus, indicating that this subfamily is larger in Brassica species than in others plants, such as Arabidopsis (9), barley (8), rice (13), populus (14), and tomato (8) [1,66,72,73,74]. In addition, we also identified 15 PHT2s, 40 PHT3s, 54 PHT4s, and 26 PHT5s in the five Brassica species. The number of members of each subgroup ranged from 2 to 4 for PHT2, 5 to 12 for PHT3, 7 to 16 for PHT4, and 4 to 10 for PHT5 (Table S1). These results indicate that the PHT subgroups contain different numbers of members in different species and that they are larger in Brassica species than in Arabidopsis [2,21,26] and poplar [1]. The PHT1 and PHT2 subgroups contain 201 and 15 members, making them the largest and smallest groups in Brassica, respectively, suggesting that they play universal and unique roles in plants [75]. Interestingly, the numbers of PHTs were larger in this study than in previous studies except for PHT2 family genes, such as 49 and 45 PHT1 family genes in B. napus [4,5], while 66 in this study. The number of PHT2 was consistent with the published results [5]. The results indicate that some PHTs were further identified in the future.
Polyploidy is widespread in plants and has been identified in more than 90% of flowering plants [76]. The allotetraploid Brassica species (B. juncea and B. napus) have experienced many duplication events after hybridizing with their diploid progenitors (B. rapa, B. oleracea, and B. nigra), and their gene numbers have increased during evolution, making them ideal plants for studying the role of polyploidization in evolution [76,77,78]. We determined that some PHT subfamilies were either larger or smaller in the allotetraploid species (B. juncea and B. napus) than the combined numbers in their corresponding diploid progenitors (B. rapa, B. oleracea, and B. nigra), suggesting that gene expansion and loss occurred in the PHT family in Brassica during the process of polyploidization, and showed the similar patterns with the published results [5]. A comparison of the genomes of the Brassica species (BraA, BolC, BniB, BjuA, BjuB, BnaA, and BnaC) revealed that the chromosomal distributions and gene numbers were consistent in the corresponding localization blocks between the diploid ancestral species and allotetraploid species, including members of subgroups PHT5:3, PHT3:1, PHT4:5, PHT4:2, and PHT1:4 (Figure 2). Furthermore, we detected 40 tandem duplications (five in B. oleracea, eight in B. rapa, five in B. nigra, 10 in B. juncea, and 12 in B. napus) among the five Brassica species, including 114 PHTs, suggesting that these PHT family genes are functionally redundant. Additionally, our results indicate that purifying selection played a primary role in PHT family gene expansion among the five Brassica species, suggesting that these duplicate genes might still retain their ancestral functions.
Rapeseed is a good winter fallow crop and an excellent crop for remediating heavy metal pollution in soil due to its rapid growth, high biomass, and strong heavy metal tolerance due to its ability to absorb and accumulate these toxins [44,45]. Therefore, we further characterized the BnaPHT family genes, including their gene structures, motifs, localization patterns, and expression patterns (Figure 4, Figure 5, Figure 6, Figure 7 and Figure 8 and Table S2). BnaPHTs and AtPHTs within the same subgroups share similar gene structures, motifs, and localization patterns (Figure 4). In general, most BnaPHT1 subgroup members share the fewest exons with multiple motifs. Most BnaPHT2 subgroup members contain three exons but no conserved motifs. The PHT3, PHT4, and PHT5 subgroups have more variable numbers of exons but contain specific motifs, such as motif 5 in PHT3 and motif 4 in PHT5 (Figure 4). Therefore, our classification and evolutionary analysis of PHT genes in B. napus suggested that PHTs within the same subgroup share relatively conserved roles [5], providing guidance for subsequent functional research.
The syntenic genes were highly conserved in terms of both their structures and expression patterns. A structural comparison of syntenic genes highlighted several similarities between PHT family genes among the five Brassica species and A. thaliana (Figure 2 and Figure 3 and Figure S1). To investigate the functions of these PHT genes in more detail, we examined their transcriptional patterns, which can provide important clues about their functions. We constructed a heatmap based on the relative expression levels of PHT genes in different B. napus ZS11 tissues, including radicle, hypocotyl, cotyledon, root, stalk, young leaf, old leaf, bud, seed, funicle, and seed coat tissue (Figure 5). In general, homologous PHT family genes had different expression patterns in different tissues [1]. For instance, most BnaPHT1 family members were not expressed in any tissue examined, but 14 PHT1 family genes showed high expression levels in roots, in consistent with the function that they might involve in Pi uptake and translocation [3,5,15,18]. In addition, BnaPHT1:4 showed the higher levels in developmental seeds, which also play an important role involved in the embryo development [5,79]. However, four BnaPHT2:1 family members were highly expressed in leaves (Figure 5), and the homologs of these genes are predominantly expressed in green tissues in Arabidopsis [19] and rapeseed [5]. Our results supported the facts that functions of PHT2s are in the plastid inner envelope [19]. Recently, the genome-wide identification and analysis of the whole PHT family genes have been carried out in many plants [1,5,71], and other PHT family genes (PHT3 to 5) were also identified, but few genes of them were still functionally characterized in plants. Here, we found that several gene pairs (BnaPHT3:1E and BnaPHT3:1F, BnaPHT3:1A and BnaPHT3:1C) have similar expression patterns, and are especially expressed in germinating seed tissues, highlighting the structural and functional similarity of syntenic genes and laying the foundation for complementation experiments to verify their functions. In addition, BnaPHT5:3A is located in the BnaAn genome and is syntenic to BraPHT5:3A, and BnaPHT5:3A is located in the BnaCn genome and is syntenic to BolPHT5:3A (Figure 2 and Figure 3). These genes belong to the PHOSPHATE TRANSPORTER 5 family (PHT5, also known as vacuolar phosphate transporter (VPT)), encoding vacuolar Pi transporters [70], which showed high expression levels in leaf and siliques (Figure 5). However, there were also cases in which there were large differences in expression levels between gene pairs. For example, BnaPHT3:1F was highly expressed in cotyledons, but BnaPHT3:1D was expressed at very low levels in this tissue (Figure 5). Perhaps the loss of genetic information during evolution resulted in structural changes to genes in these pairs, resulting in different protein functions. In addition, the results showed that BnaPHT4s were relatively divergent [5], but we found most BnaPHT4s had higher expression levels in leaf and siliques (Figure 5), which were mostly located in the plastid envelope and one Golgi-localized transporter basal defense [19]. Furthermore, BnaPHT4:4 had higher expression profiles in leaf and siliques, which are in agreement with their biological roles in a chloroplast-localized ascorbate transporter [29]. Similarly, we also found BnaPHT5:1 had the stable expression levels, supporting the facts that PHT5 genes are required for fitness and plant growth [70]. In brief, our results suggest that PHT genes have different functions, since they are expressed in a wide range of tissues in B. napus.
In addition, PHT family genes are specifically expressed in various tissues in response to heavy metal stress [46,49,50,51]. Therefore, we analyzed the expression patterns of BnaPHT genes in response to As3+ and Cd2+ treatment by RNA-seq analysis. The expression patterns of BnaPHT family genes differed under As3+ and Cd2+ induction. For example, while BnaPHT1:1, BnaPHT1:3, BnaPHT1:6, and BnaPHT1:7 were not induced in rapeseed in response to As3+ or Cd2+ treatment, BnaPHT1:4A, BnaPHT1:4B, BnaPHT1:4E, BnaPHT2:1, and BnaPHT4:2 were downregulated and BnaPHT1:9A, BnaPHT3:2, BnaPHT4:5A, BnaPHT5:1D, BnaPHT5:3A, and BnaPHT5:3B were upregulated by these treatments (Figure 6). These results were further confirmed by qRT-PCR analysis, pointing to the reproducibility and reliability of our results. For example, BnaPHT1:4E, BnaPHT1:8B, and BnaPHT4:1B shared similar expression patterns in different organs under As3+ and Cd2+ treatment, whereas most BnaPHTs showed different expression patterns (Figure 7 and Figure 8), suggesting they play different roles in different stress responses. This study represents the first comprehensive analysis of BnaPHT family genes under heavy metal stress, laying the foundation for further elucidating the roles of PHT genes in heavy metal tolerance.

4. Materials and Methods

4.1. Identification of PHT Family Genes in Brassica

The amino acid sequences of the PHTs were downloaded from The Arabidopsis Information Resource (TAIR10) database (ftp://ftp.arabidopsis.org), which was used as queries for protein basic local alignment search tool (BLASTp) [80] analysis against whole-genome sequences in the Brassica database. The hidden Markov model (HMM) search program (HMMER v3.0, http://hmmer.janelia.org/) was used to identify and validate candidate sequences with E-value ≤ 1 × 10⁻²⁰. BLAST analysis of the PHTs was performed against a Brassica protein database constructed using Geneious v4.8.5 software (http://www.geneious.com/, Biomatters, Auckland, New Zealand). The coding sequences (CDS) of the PHTs were identified by BLASTn searches against the Brassica genome database. The candidate proteins were named using the species abbreviation of the source organism (italicized), the gene family name, and the positions in the subtribe, e.g., AtPHT1;1 and BnaPHT1;1A. The physicochemical properties of the predicted PHT proteins, such as isoelectric point (pI), MW, instability index, and grand average of hydropathicity (GRAVY), were analyzed using the ProtParam tool of ExPASy server [80] (https://web.expasy.org/protparam/).

4.2. Multiple Sequence Alignment and Phylogenetic Analysis of PHTs in Brassica

The deduced amino acid sequences of PHT proteins from A. thaliana and various Brassica species, including B. rapa, B. oleracea, B. napus, B. juncea, and B. nigra, were subjected to multiple protein sequence alignment using ClustalW software [81] with default settings. To illustrate the evolutionary relationships of the PHTs in Brassica, a neighbor-joining [27] phylogenetic tree was generated using the MEGA v7.0 program (Tokyo Metropolitan University, Tokyo, Japan) [82] with the Jones-Taylor-Thornton (JTT) + invariant sites (I) + Gamma (G) substitution model and a bootstrap test with 1000 replicates. The phylogenetic trees were visualized using FigTree v1.4.2 (http://tree.bio.ed.ac.uk/software/figtree/).

4.3. Conserved Motif Recognition and Gene Structure Analysis

The CDS of the PHTs from the five Brassica species were retrieved based on their protein sequences, and the corresponding genomic sequences were extracted from the Brassica genome sequences. The exon-intron structures of the PHTs were analyzed online using the Gene Structure Display Server (GSDS v2.0, http://gsds.cbi.pku.edu.cn/index.php). Conserved motifs were identified using Multiple Expectation Maximization for Motif Elucidation (MEME v4.12.0, http://meme-suite.org/tools/meme) [83] with the following parameters: Number of repetitions, any; maximum number of motifs, 10; and optimum width of each motif, between 6 and 300 residues. Each motif with an E-value < 1 × 10⁻¹⁰ was retained for motif detection.

4.4. Chromosomal Locations of PHT Family Genes

The PHT family genes were mapped to the Brassica chromosomes based on their physical distances in the general feature format (GFF) genome files, which were downloaded from the Brassica database (BRAD, http://brassicadb.org). Then the MapChart v2.0 [84] was used to construct the chromosome localization map of the PHTs.

4.5. Analysis of Duplication and Synteny of PHT Family Genes in A. thaliana and Five Brassica Species

Ancient duplication events were investigated to confirm the gene duplication events. The nonsynonymous substitution rate (Ka), synonymous substitution rate (Ks), and Ka/Ks ratio for each pair of duplicated genes among A. thaliana and the five Brassica species were computed between pairs of genes identified as homologous using TBtools_JRE1.6 with default settings [85]. To explore the amplification mechanism of PHT family genes, we performed synteny analysis of PHTs among A. thaliana and the five Brassica species. We used information such as chromosome length, gene location, and homologous gene information derived from TBtools and used TBtools-Multiple Synteny Plotter with default parameters to perform synteny detection. Simultaneously, TBtools-Amazing Super Circos was used to illustrate the homologous genetic relationships between different species.

4.6. Plant Materials and Metal Stress Treatments

B. napus seeds were obtained from the Rapeseed Engineering Research Center of Southwest University in Chongqing, China (CERCR). Then we performed a trial to identify the optimal concentration of as and Cd treatment in B. napus. Moreover, the length of root and radicle of five randomly selected rapeseed showed wider variation under 15 mg/L As and 30 mg/L Cd treatment than in other concentrations (0, 5, 10, 15, and 20 mg/L As, and 0, 10, 20, 30, and 40 mg/L Cd). Thus, 15 mg/L As and 30 mg/L Cd were used as a most optimal concentration in this study. Subsequently, 200 B. napus accessions were treated with different concentrations of two heavy metals (As3+ and Cd2+), and 14 accessions with extreme phenotypes (strong or weak resistance) were obtained based on phenotypic differences in their growth.
The healthy seeds (0.3 g) were selected from each accession and sown on four layers of filter paper in the Petri dishes (d = 9 cm) with distilled water (the control) and 15 mg/L As or 30 mg/L Cd. Seeds were generated at 25 °C with long-day conditions (16 h light/8 h dark, 5000 Lux). After 7 days, whole roots, hypocotyls, and cotyledons were sampled to analyze PHT gene expression patterns. The tissues were snap frozen in liquid nitrogen and stored at −80 °C prior to total RNA extraction.

4.7. Total RNA Extraction and qRT-PCR Analysis

The growth of B. napus accessions P063, P070, and P087 was significantly inhibited under treatment with the heavy metal As, and the growth of P063, P085, and P163 was significantly inhibited under Cd treatment. These accessions were, therefore, used for expression analysis. Total RNA was isolated from the samples using a DNAaway RNA Mini-prep Kit (Sangon Biotech, Shanghai, China). For tissue-specific expression analysis, RNA was extracted from roots, hypocotyls, and cotyledons and pretreated with genomic DNA (gDNA) Eraser (Takara, Dalian, China). Subsequently, 1 μg total RNA was used to synthesize first-strand complementary DNA (cDNA) with an RNA PCR Kit (AMV) Ver. 3.0 (Takara, Dalian, China). The cDNA was subjected to qRT-PCR analysis using SYBR Premix Ex Taq II (Takara, Dalian, China) on a Bio-Rad CFX96 Real Time System (Bio-Rad Laboratories, Hercules, CA, USA) as previously described [86]. BnACTIN7 (EV116054) was employed as a reference gene to normalize PHT gene expression levels via the 2−∆∆Ct method [87]. All experiments were performed with three technical replicates, and the values represent the average + standard error (SE). One-way ANOVA (** p < 0.01, * p < 0.05) was used to determine the significance level of the data using Excel software. The specific primer sequences used in this study were obtained from the qPCR Primer Database [88] and are listed in Table S6.

5. Conclusions

In the present study, we identified 336 PHT genes from five Brassica species and divided them into five subgroups: PHT1, PHT2, PHT3, PHT4, and PHT5. We performed a comprehensive bioinformatics analysis, including an analysis of the chromophore position, gene structure, conserved domain structure, and evolutionary relationships of the genes, to characterize PHT family genes in the five species. Our analysis suggests that segmental and tandem duplications and gene loss events occurred during the expansion of the PHT gene family during the process of polyploidization. Moreover, purifying selection played a major role in the expansion of PHT family genes among the five Brassica species. Finally, we explored the expression profiles of the BnaPHT family genes in specific tissues, at various developmental stages, and in response to heavy metal stress via RNA-seq analysis and qRT-PCR. The results shed light on the evolution of PHT family genes and provide a reference for future polyploidization analysis. Our findings provide a basis for further studies of the roles of BnaPHTs in plant tolerance to heavy metal stress.

Supplementary Materials

Supplementary materials can be found at https://www.mdpi.com/1422-0067/21/6/2209/s1. Table S1. List of PHT genes identified in the A. thaliana and Brassica genomes; Table S2. One-to-one orthologous relationships between A. thaliana and other five plant species; Table S3. B. napus ZS11 tissues and organs used in this study; Table S4. The FPKM values of PHT family genes in B. napus by RNA-Seq analysis; Table S5. The relative expression values of PHT family genes in B. napus by RNA-Seq analysis under As3+ and Cd2+ treatment; Table S6. Primers used to amplify the PHT genes and reference genes using qRT-PCR; Figure S1. Collinearity analysis of PHT family genes among Arabidopsis and five Brassica species; Figure S2. The detailed information of motif logos are obtained from the MEME Suite website; Figure S3. The phenotypes of rapeseed under As3+ and Cd2+ stress.

Author Contributions

C.Q. (Cunmin Qu) and K.L. conceived and designed the experiments; Y.W. and Z.W. conducted the experiments; J.X., S.S., and M.G. collected and analyzed the data; M.Z., C.Q. (Cailin Qiao), and F.S. carried out the experiments and performed software; Y.W., K.L., and C.Q. (Cunmin Qu) wrote the manuscript; Y.L. and J.L. reviewed the manuscript. All authors have read and agreed to the published version of the manuscript.

Funding

This work was supported by The National Key Research and Development Plan (2016YFD0100202), National Key Research and Development Plan (2018YFD0100500), Fundamental Research Funds for the Central Universities (XDJK2019C099), the Department of Agriculture projects of modern agricultural technology system (CARS-12, CARS-13), National Science Foundation of China (31871653), the 111 Project (B12006).

Acknowledgments

We would like to thank Kathy Farquharson for critical reading of this manuscript.

Conflicts of Interest

The authors declare no conflict of interest.

References

  1. Zhang, C.; Meng, S.; Li, M.; Zhao, Z. Genomic Identification and Expression Analysis of the Phosphate Transporter Gene Family in Poplar. Front. Plant Sci. 2016, 7, 1398. [Google Scholar] [CrossRef] [PubMed] [Green Version]
  2. Rausch, C.; Bucher, M. Molecular mechanisms of phosphate transport in plants. Planta 2002, 216, 23–37. [Google Scholar] [CrossRef] [PubMed]
  3. Mudge, S.R.; Rae, A.L.; Diatloff, E.; Smith, F.W. Expression analysis suggests novel roles for members of the PHT1 family of phosphate transporters in Arabidopsis. Plant J. 2002, 31, 341–353. [Google Scholar] [CrossRef] [PubMed]
  4. Li, Y.; Wang, X.; Zhang, H.; Wang, S.; Ye, X.; Shi, L.; Xu, F.; Ding, G. Molecular identification of the phosphate transporter family 1 (PHT1) genes and their expression profiles in response to phosphorus deprivation and other abiotic stresses in Brassica napus. PLoS ONE 2019, 14, e0220374. [Google Scholar] [CrossRef] [Green Version]
  5. Yang, J.; Zhou, J.; Zhou, H.J.; Wang, M.M.; Liu, M.M.; Ke, Y.Z.; Li, P.F.; Li, J.N.; Du, H. Global Survey and Expressions of the Phosphate Transporter Gene Families in Brassica napus and Their Roles in Phosphorus Response. Int. J. Mol. Sci. 2020, 21, 1752. [Google Scholar] [CrossRef] [Green Version]
  6. Paszkowski, U.; Kroken, S.; Roux, C.; Briggs, S.P. Rice phosphate transporters include an evolutionarily divergent gene specifically activated in arbuscular mycorrhizal symbiosis. Proc. Natl. Acad. Sci. USA 2002, 99, 13324–13329. [Google Scholar] [CrossRef] [Green Version]
  7. Schunmann, P.H.; Richardson, A.E.; Smith, F.W.; Delhaize, E. Characterization of promoter expression patterns derived from the Pht1 phosphate transporter genes of barley (Hordeum vulgare L.). J. Exp. Bot. 2004, 55, 855–865. [Google Scholar] [CrossRef] [Green Version]
  8. Schunmann, P.H.; Richardson, A.E.; Vickers, C.E.; Delhaize, E. Promoter Analysis of the Barley Pht1;1 Phosphate Transporter Gene Identifies Regions Controlling Root Expression and Responsiveness to Phosphate Deprivation. Plant Physiol. 2004, 136, 4205–4214. [Google Scholar] [CrossRef] [Green Version]
  9. Nagy, R.; Vasconcelos, M.; Zhao, S.; McElver, J.; Bruce, W.; Amrhein, N.; Raghothama, K.G.; Bucher, M. Differential Regulation of Five Pht1 Phosphate Transporters from Maize (Zea mays L.). Plant Biology 2006, 8, 186–197. [Google Scholar] [CrossRef]
  10. Ai, P.; Sun, S.; Zhao, J.; Fan, X.; Xin, W.; Guo, Q.; Yu, L.; Shen, Q.; Wu, P.; Miller, A.J.; et al. Two rice phosphate transporters, OsPht1;2 and OsPht1;6, have different functions and kinetic properties in uptake and translocation. Plant J. 2009, 57, 798–809. [Google Scholar] [CrossRef]
  11. Liu, C.; Muchhal, U.S.; Uthappa, M.; Kononowicz, A.K.; Raghothama, K.G. Tomato Phosphate Transporter Genes Are Differentially Regulated in Plant Tissues by Phosphorus. Plant Physiol. 1998, 116, 91–99. [Google Scholar] [CrossRef] [Green Version]
  12. Nagy, R.; Drissner, D.; Amrhein, N.; Jakobsen, I.; Bucher, M. Mycorrhizal phosphate uptake pathway in tomato is phosphorus-repressible and transcriptionally regulated. New Phytol. 2009, 181, 950–959. [Google Scholar] [CrossRef]
  13. Wu, Z.; Zhao, J.; Gao, R.; Hu, G.; Gai, J.; Xu, G.; Xing, H. Molecular Cloning, Characterization and Expression Analysis of Two Members of the Pht1 Family of Phosphate Transporters in Glycine max. PLoS ONE 2011, 6, e19752. [Google Scholar] [CrossRef] [PubMed] [Green Version]
  14. Liu, J.; Versaw, W.K.; Pumplin, N.; Gomez, S.K.; Blaylock, L.A.; Harrison, M.J. Closely related members of the Medicago truncatula PHT1 phosphate transporter gene family encode phosphate transporters with distinct biochemical activities. J. Biol. Chem. 2008, 283, 24673–24681. [Google Scholar] [CrossRef] [PubMed] [Green Version]
  15. Javot, H.; Penmetsa, R.V.; Terzaghi, N.; Cook, D.R.; Harrison, M.J. A Medicago truncatula phosphate transporter indispensable for the arbuscular mycorrhizal symbiosis. Proc. Natl. Acad. Sci. USA 2007, 104, 1720–1725. [Google Scholar] [CrossRef] [Green Version]
  16. Maria, J.H.; Dewbre, G.R.; Liu, J. A Phosphate Transporter from Medicago truncatula Involved in the Acquisition of Phosphate Released by Arbuscular Mycorrhizal Fungi. Plant Cell 2002, 14, 2413–2429. [Google Scholar]
  17. Ayadi, A.; David, P.; Arrighi, J.F.; Chiarenza, S.; Thibaud, M.; Nussaume, L.; Marin, E. Reducing the genetic redundancy of Arabidopsis PHOSPHATE TRANSPORTER1 transporters to study phosphate uptake and signaling. Plant Physiol. 2015, 167, 1511–1526. [Google Scholar] [CrossRef] [PubMed] [Green Version]
  18. Chang, M.X.; Gu, M.; Xia, Y.W.; Dai, X.L.; Dai, C.R.; Zhang, J.; Wang, S.C.; Qu, H.Y.; Yamaji, N.; Feng, M.J.; et al. OsPHT1;3 Mediates Uptake, Translocation, and Remobilization of Phosphate under Extremely Low Phosphate Regimes. Plant Physiol. 2019, 179, 656–670. [Google Scholar] [CrossRef] [Green Version]
  19. Wang, D.; Lv, S.; Jiang, P.; Li, Y. Roles, Regulation, and Agricultural Application of Plant Phosphate Transporters. Front. Plant Sci. 2017, 8, 817. [Google Scholar] [CrossRef] [Green Version]
  20. Gu, M.; Chen, A.; Sun, S.; Xu, G. Complex Regulation of Plant Phosphate Transporters and the Gap between Molecular Mechanisms and Practical Application: What Is Missing? Mol. Plant 2016, 9, 396–416. [Google Scholar] [CrossRef] [Green Version]
  21. Daram, P.; Brunner, S.; Rausch, C.; Steiner, C.; Amrhein, N.; Bucher, M. Pht2;1 Encodes a Low-Affinity Phosphate Transporter from Arabidopsis. Plant Cell 1999, 11, 2153–2166. [Google Scholar] [CrossRef] [PubMed] [Green Version]
  22. Versaw, W.K.; Harrison, M.J. A chloroplast phosphate transporter, PHT2;1, influences allocation of phosphate within the plant and phosphate-starvation responses. Plant Cell 2002, 14, 1751–1766. [Google Scholar] [CrossRef] [PubMed] [Green Version]
  23. Zhao, L.; Versaw, W.K.; Liu, J.; Harrison, M.J. A phosphate transporter from Medicago truncatula is expressed in the photosynthetic tissues of the plant and located in the chloroplast envelope. New Phytol. 2003, 157, 291–302. [Google Scholar] [CrossRef]
  24. Takabatake, R.; Hata, S.; Taniguchi, M.; Kouchi, H.; Sugiyama, T.; Izui, K. Isolation and characterization of cDNAs encoding mitochondrial phosphate transporters in soybean, maize, rice, and Arabidopsis. Plant Mol. Biol. 1999, 40, 479–486. [Google Scholar] [CrossRef]
  25. Shukla, V.; Kaur, M.; Aggarwal, S.; Bhati, K.K.; Kaur, J.; Mantri, S.; Pandey, A.K. Tissue specific transcript profiling of wheat phosphate transporter genes and its association with phosphate allocation in grains. Sci. Rep. 2016, 6, 39293. [Google Scholar] [CrossRef] [Green Version]
  26. Guo, B.; Jin, Y.; Wussler, C.; Blancaflor, E.B.; Motes, C.M.; Versaw, W.K. Functional analysis of the Arabidopsis PHT4 family of intracellular phosphate transporters. New Phytol. 2008, 177, 889–898. [Google Scholar] [CrossRef] [Green Version]
  27. Hassler, S.; Lemke, L.; Jung, B.; Möhlmann, T.; Krüger, F.; Schumacher, K.; Espen, L.; Martinoia, E.; Neuhaus, H.E. Lack of the Golgi phosphate transporter PHT4;6 causes strong developmental defects, constitutively activated disease resistance mechanisms and altered intracellular phosphate compartmentation in Arabidopsis. Plant J. 2012, 72, 732–744. [Google Scholar] [CrossRef]
  28. Karlsson, P.M.; Herdean, A.; Adolfsson, L.; Beebo, A.; Nziengui, H.; Irigoyen, S.; Ünnep, R.; Zsiros, O.; Nagy, G.; Garab, G.; et al. The Arabidopsis thylakoid transporter PHT4;1 influences phosphate availability for ATP synthesis and plant growth. Plant J. 2015, 84, 99–110. [Google Scholar] [CrossRef] [Green Version]
  29. Irigoyen, S.; Karlsson, P.M.; Kuruvilla, K.; Spetea, C.; Versaw, W.K. The sink-specific plastidic phosphate transporter PHT4;2 influences starch accumulation and leaf size in Arabidopsis. Plant Physiol. 2011, 157, 1765–1777. [Google Scholar] [CrossRef] [Green Version]
  30. Miyaji, T.; Kuromori, T.; Takeuchi, Y.; Yamaji, N.; Yokosho, K.; Shimazawa, A.; Sugimoto, E.; Omote, H.; Ma, J.F.; Shinozaki, K. AtPHT4;4 is a chloroplast-localized ascorbate transporter in Arabidopsis. Nature Commun. 2015, 6, 5928. [Google Scholar] [CrossRef] [Green Version]
  31. Wang, G.; Shi, J.; Ng, G.; Battle, S.L.; Zhang, C.; Lu, H. Circadian Clock-Regulated Phosphate Transporter PHT4;1 Plays an Important Role in Arabidopsis Defense. Mol. Plant 2011, 4, 516–526. [Google Scholar] [CrossRef] [PubMed] [Green Version]
  32. Wang, G.; Zhang, C.; Battle, S.; Lu, H. The phosphate transporter PHT4;1 is a salicylic acid regulator likely controlled by the circadian clock protein CCA1. Front. Plant Sci. 2014, 5, 701. [Google Scholar] [CrossRef] [PubMed] [Green Version]
  33. Cubero, B.; Nakagawa, Y.; Jiang, X.; Miura, K.; Fang, L.; Raghothama, K.G.; Bressan, R.A.; Hasegawab, P.M.; Pardo, J.M. The Phosphate Transporter PHT4;6 Is a Determinant of Salt Tolerance that Is Localized to the Golgi Apparatus of Arabidopsis. Mol. Plant 2009, 2, 535–552. [Google Scholar] [CrossRef] [PubMed] [Green Version]
  34. Arpat, A.B.; Magliano, P.; Wege, S.; Rouached, H.; Stefanovic, A.; Poirier, Y. Functional expression of PHO1 to the Golgi and trans -Golgi network and its role in export of inorganic phosphate. Plant J. 2012, 71, 479–491. [Google Scholar] [CrossRef] [Green Version]
  35. Wang, C.; Yue, W.; Ying, Y.; Wang, S.; Secco, D.; Liu, Y.; Whelan, J.; Tyerman, S.D.; Shou, H. Rice SPX-Major Facility Superfamily3, a Vacuolar Phosphate Efflux Transporter, Is Involved in Maintaining Phosphate Homeostasis in Rice. Plant Physiol. 2015, 169, 2822–2831. [Google Scholar]
  36. Puga, M.I.; Mateos, I.; Charukesi, R.; Wang, Z.; Franco-Zorrilla, J.M.; Lorenzo, L.; Irigoyen, M.L.; Masiero, S.; Bustos, R.; Rodríguez, J.; et al. SPX1 is a phosphate-dependent inhibitor of Phosphate Starvation Response 1 in Arabidopsis. Proc. Natl. Acad. Sci. USA 2014, 111, 14947–14952. [Google Scholar] [CrossRef] [Green Version]
  37. Velasco, V.M.; Mansbridge, J.; Bremner, S.; Carruthers, K.; Summers, P.S.; Sung, W.W.; Champigny, M.J.; Weretilnyk, E.A. Acclimation of the crucifer Eutrema salsugineum to phosphate limitation is associated with constitutively high expression of phosphate-starvation genes. Plant Cell Environ. 2016, 39, 1818–1834. [Google Scholar] [CrossRef]
  38. Nagajyoti, P.C.; Lee, K.D.; Sreekanth, T.V.M. Heavy metals, occurrence and toxicity for plants: A review. Environ. Chem. Lett. 2010, 8, 199–216. [Google Scholar] [CrossRef]
  39. Ebbs, S.; Uchil, S. Cadmium and zinc induced chlorosis in Indian mustard [Brassica juncea (L.) Czern] involves preferential loss of chlorophyll b. Photosynthetica 2008, 46, 49–55. [Google Scholar] [CrossRef]
  40. Lingua, G.; Franchin, C.; Todeschini, V.; Stefano, C.; Castiglione, S.; Biondi, S.; Burlando, B.; Parravicini, V.; Torrigiani, P.; Berta, G. Arbuscular mycorrhizal fungi differentially affect the response to high zinc concentrations of two registered poplar clones. Environ. Pollut. 2008, 153, 137–147. [Google Scholar] [CrossRef]
  41. Sridhar, B.B.M.; Diehl, S.V.; Han, F.X.; Monts, D.L.; Su, Y. Anatomical changes due to uptake and accumulation of Zn and Cd in Indian mustard (Brassica juncea). Environ. Exp. Bot. 2005, 54, 131–141. [Google Scholar] [CrossRef]
  42. An, Z.; Li, C.; Zu, Y.; Du, Y.; Andreas, W.; Gromes, R.; Rausch, T. Expression of BjMT2, a metallothionein 2 from Brassica juncea, increases copper and cadmium tolerance in Escherichia coli and Arabidopsis thaliana, but inhibits root elongation in Arabidopsis thaliana seedlings. J. Exp. Bot. 2006, 57, 3575–3582. [Google Scholar]
  43. Gasic, K.; Korban, S.S. Expression of Arabidopsis phytochelatin synthase in Indian mustard (Brassica juncea) plants enhances tolerance for Cd and Zn. Planta 2007, 225, 1277–1285. [Google Scholar] [CrossRef] [PubMed]
  44. Marchiol, L.; Assolari, S.; Sacco, P.; Zerbi, G. Phytoextraction of heavy metals by canola (Brassica napus) and radish (Raphanus sativus) grown on multicontaminated soil. Environ. Pollut. 2004, 132, 21–27. [Google Scholar] [CrossRef]
  45. Cojocaru, P.; Gusiatin, Z.M.; Cretescu, I. Phytoextraction of Cd and Zn as single or mixed pollutants from soil by rape (Brassica napus). Environ. Sci. Poll. R. 2016, 23, 10693–10701. [Google Scholar] [CrossRef]
  46. Ditusa, S.F.; Fontenot, E.B.; Wallace, R.W.; Silvers, M.A.; Steele, T.N.; Elnagar, A.H.; Dearman, K.M.; Smith, A.P. A member of the Phosphate transporter 1 (Pht1) family from the arsenic-hyperaccumulating fern Pteris vittata is a high-affinity arsenate transporter. New Phytol. 2016, 209, 762–772. [Google Scholar] [CrossRef]
  47. Wang, J.; Zhao, F.; Meharg, A.A.; Andrea, R.; Feldmann, J.; Mcgrath, S.P. Mechanisms of arsenic hyperaccumulation in Pteris vittata. Uptake kinetics, interactions with phosphate, and arsenic speciation. Plant Physiol. 2002, 130, 1552–1561. [Google Scholar] [CrossRef] [Green Version]
  48. Zhu, Y.G.; Geng, C.N.; Tong, Y.P.; Smith, S.E.; Smith, F.A. Phosphate (Pi) and Arsenate Uptake by Two Wheat (Triticum aestivum) Cultivars and Their Doubled Haploid Lines. Ann. Bot. 2006, 98, 631–636. [Google Scholar] [CrossRef] [Green Version]
  49. Catarecha, P.; Segura, M.D.; Franco-Zorrilla, J.M.; García-Ponce, B.; Lanza, M.; Solano, R.; Paz-Ares, J.; Leyva, A. A mutant of the Arabidopsis phosphate transporter PHT1;1 displays enhanced arsenic accumulation. Plant Cell 2007, 19, 1123–1133. [Google Scholar] [CrossRef] [Green Version]
  50. Shin, H.; Shin, H.S.; Dewbre, G.R.; Harrison, M.J. Phosphate transport in Arabidopsis: Pht1;1 and Pht1;4 play a major role in phosphate acquisition from both low- and high-phosphate environments. Plant J. 2004, 39, 629–642. [Google Scholar] [CrossRef]
  51. Wu, Z.; Ren, H.; Mcgrath, S.P.; Wu, P.; Zhao, F. Investigating the contribution of the phosphate transport pathway to arsenic accumulation in rice. Plant Physiol. 2011, 157, 498–508. [Google Scholar] [CrossRef] [PubMed] [Green Version]
  52. Nagaharu, U. Genome analysis in Brassica with special reference to the experimental formation of B. napus and peculiar mode of fertilisation. J. Jpn. Bot. 1935, 7, 389–452. [Google Scholar]
  53. Yu, J.; Hu, F.; Dossa, K.; Wang, Z.; Ke, T. Genome-wide analysis of UDP-glycosyltransferase super family in Brassica rapa and Brassica oleracea reveals its evolutionary history and functional characterization. BMC Genom. 2017, 18, 474. [Google Scholar] [CrossRef] [PubMed] [Green Version]
  54. Li, M.; Wang, R.; Liang, Z.; Wu, X.; Wang, J. Genome-wide identification and analysis of the EIN3/EIL gene family in allotetraploid Brassica napus reveal its potential advantages during polyploidization. BMC Plant Biol. 2019, 19, 110. [Google Scholar] [CrossRef] [PubMed]
  55. Cannon, S.B.; Mitra, A.; Baumgarten, A.; Young, N.D.; May, G. The roles of segmental and tandem gene duplication in the evolution of large gene families in Arabidopsis thaliana. BMC Plant Biol. 2004, 4, 10. [Google Scholar] [CrossRef] [PubMed] [Green Version]
  56. Tang, H.; Bowers, J.E.; Wang, X.; Ming, R.; Alam, M.; Paterson, A.H. Synteny and Collinearity in Plant Genomes. Science 2008, 320, 486–488. [Google Scholar] [CrossRef] [Green Version]
  57. Zhao, J.; Wang, X.; Deng, B.; Lou, P.; Wu, J.; Sun, R.; Xu, Z.; Vromans, J.; Koornneef, M.; Bonnema, G. Genetic relationships within Brassica rapa as inferred from AFLP fingerprints. Theor. App. Genet. 2005, 110, 1301–1314. [Google Scholar] [CrossRef]
  58. Cheng, F.; Wu, J.; Wang, X. Genome triplication drove the diversification of Brassica plants. Hortic. Res. 2014, 1, 14024. [Google Scholar] [CrossRef] [Green Version]
  59. Cheng, F.; Sun, R.; Hou, X.; Zheng, H.; Zhang, F.; Zhang, Y.; Liu, B.; Liang, J.; Zhuang, M.; Liu, Y.; et al. Subgenome parallel selection is associated with morphotype diversification and convergent crop domestication in Brassica rapa and Brassica oleracea. Nat. Genet. 2016, 48, 1218. [Google Scholar] [CrossRef]
  60. Song, X.; Liu, T.; Duan, W.; Ma, Q.; Ren, J.; Wang, Z.; Li, Y.; Hou, X. Genome-wide analysis of the GRAS gene family in Chinese cabbage (Brassica rapa ssp. pekinensis). Genomics 2014, 103, 135–146. [Google Scholar] [CrossRef] [Green Version]
  61. Song, X.; Duan, W.; Huang, Z.; Liu, G.; Wu, P.; Liu, T.; Li, Y.; Hou, X. Comprehensive analysis of the flowering genes in Chinese cabbage and examination of evolutionary pattern of CO-like genes in plant kingdom. Sci. Rep. 2015, 5, 14631. [Google Scholar] [CrossRef] [PubMed]
  62. Hajiebrahimi, A.; Owji, H.; Shiva, H. Genome-wide identification, functional prediction, and evolutionary analysis of the R2R3-MYB superfamily in Brassica napus. Genome 2017, 60, 797–814. [Google Scholar] [CrossRef] [PubMed]
  63. Chen, H.; Zhang, Q.; He, M.; Wang, S.; Shi, L.; Xu, F. Molecular characterization of the genome-wide BOR transporter gene family and genetic analysis of BnaC04.BOR1;1c in Brassica napus. BMC Plant Biol. 2018, 18, 193. [Google Scholar] [CrossRef] [PubMed]
  64. Song, X.; Li, Y.; Hou, X. Genome-wide analysis of the AP2/ERF transcription factor superfamily in Chinese cabbage (Brassica rapa ssp. pekinensis). BMC Genom. 2013, 14, 573. [Google Scholar] [CrossRef] [Green Version]
  65. Song, X.; Wang, J.; Ma, X.; Li, Y.; Lei, T.; Wang, L.; Ge, W.; Guo, D.; Wang, Z.; Li, C.; et al. Origination, Expansion, Evolutionary Trajectory, and Expression Bias of AP2/ERF Superfamily in Brassica napus. Front. Plant Sci. 2016, 7, 1186. [Google Scholar] [CrossRef] [Green Version]
  66. Muchhal, U.S.; Pardo, J.M.; Raghothama, K.G. Phosphate transporters from the higher plant Arabidopsis thaliana. Proc. Natl. Acad Sci. USA 1996, 93, 10519–10523. [Google Scholar] [CrossRef] [Green Version]
  67. Qin, L.; Zhao, J.; Tian, J.; Chen, L.; Sun, Z.; Guo, Y.; Lu, X.; Gu, M.; Xu, G.; Liao, H. The high-affinity phosphate transporter GmPT5 regulates phosphate transport to nodules and nodulation in soybean. Plant Physiol. 2012, 159, 1634–1643. [Google Scholar] [CrossRef] [Green Version]
  68. Huang, K.L.; Wang, H.; Wei, Y.L.; Jia, H.X.; Zha, L.; Zheng, Y.; Ren, F.; Li, X.B. The high-affinity transporter BnPHT1;4 is involved in phosphorus acquisition and mobilization for facilitating seed germination and early seedling growth of Brassica napus. BMC Plant Biol. 2019, 19, 156. [Google Scholar] [CrossRef]
  69. Okumura, S.; Mitsukawa, N.; Shirano, Y.; Shibata, D. Phosphate Transporter Gene Family of Arabidopsis thaliana. DNA Res. 1998, 5, 261–269. [Google Scholar] [CrossRef] [Green Version]
  70. Liu, T.Y.; Huang, T.K.; Yang, S.Y.; Hong, Y.T.; Huang, S.M.; Wang, F.N.; Chiang, S.F.; Tsai, S.Y.; Lu, W.C.; Chiou, T.J. Identification of plant vacuolar transporters mediating phosphate storage. Nat. Commun. 2016, 7, 11095. [Google Scholar] [CrossRef] [Green Version]
  71. Liu, B.; Zhao, S.; Wu, X.; Wang, X.; Nan, Y.; Wang, D.; Chen, Q. Identification and characterization of phosphate transporter genes in potato. J. Biotechnol. 2017, 264, 17–28. [Google Scholar] [CrossRef] [PubMed]
  72. Rae, A.L.; Cybinski, D.H.; Jarmey, J.M.; Smith, F.W. Characterization of two phosphate transporters from barley; evidence for diverse function and kinetic properties among members of the Pht1 family. Plant Mol. Biol. 2003, 53, 27–36. [Google Scholar] [CrossRef] [PubMed]
  73. Liu, F.; Chang, X.J.; Ye, Y.; Xie, W.B.; Wu, P.; Lian, X.M. Comprehensive sequence and whole-life-cycle expression profile analysis of the phosphate transporter gene family in rice. Mol. Plant 2011, 4, 1105–1122. [Google Scholar] [CrossRef] [Green Version]
  74. Chen, A.; Chen, X.; Wang, H.; Liao, D.; Gu, M.; Qu, H.; Sun, S.; Xu, G. Genome-wide investigation and expression analysis suggest diverse roles and genetic redundancy of Pht1 family genes in response to Pi deficiency in tomato. BMC Plant Biol. 2014, 14, 61. [Google Scholar] [CrossRef] [PubMed] [Green Version]
  75. Wang, J.; Yang, Y.; Liao, L.; Xu, J.; Liang, X.; Liu, W. Genome-Wide Identification and Functional Characterization of the Phosphate Transporter Gene Family in Sorghum. Biomolecules 2019, 9, 670. [Google Scholar] [CrossRef] [Green Version]
  76. Wu, A.; Hao, P.; Wei, H.; Sun, H.; Cheng, S.; Chen, P.; Ma, Q.; Gu, L.; Zhang, M.; Wang, H.; et al. Genome-Wide Identification and Characterization of Glycosyltransferase Family 47 in Cotton. Front. Genet. 2019, 10, 824. [Google Scholar] [CrossRef] [Green Version]
  77. Cheng, F.; Liang, J.; Cai, C.; Cai, X.; Wu, J.; Wang, X. Genome sequencing supports a multi-vertex model for Brassiceae species. Curr. Opin. Plant Biol. 2017, 36, 79–87. [Google Scholar] [CrossRef]
  78. Chalhoub, B.; Denoeud, F.; Liu, S.Y.; Parkin, I.A.P.; Tang, H.B.; Wang, X.Y.; Chiquet, J.; Belcram, H.; Tong, C.B.; Samans, B.; et al. Early allopolyploid evolution in the post-Neolithic Brassica napus oilseed genome. Science 2014, 345, 950–953. [Google Scholar] [CrossRef] [Green Version]
  79. Zhang, F.; Sun, Y.F.; Pei, W.X.; Jain, A.; Sun, R.; Cao, Y.; Wu, X.N.; Jiang, T.T.; Zhang, L.; Fan, X.R.; et al. Involvement of OsPht1;4 in phosphate acquisition and mobilization facilitates embryo development in rice. Plant J. 2015, 82, 556–569. [Google Scholar] [CrossRef]
  80. Altschul, S.F.; Madden, T.L.; Schaffer, A.A.; Zhang, J.; Zhang, Z.; Miller, W.; Lipman, D.J. Gapped BLAST and PSI-BLAST: A new generation of protein database search programs. Nucleic Acids Res. 1997, 25, 3389–3402. [Google Scholar] [CrossRef] [Green Version]
  81. Larkin, M.A.; Blackshields, G.; Brown, N.; Chenna, R.; McGettigan, P.; McWilliam, H.; Valentin, F.; Wallace, I.M.W.; Wilm, A.; Lopez, R.; et al. Clustal W and Clustal X Version 2.0. Bioinformatics 2007, 23, 2947–2948. [Google Scholar] [CrossRef] [PubMed] [Green Version]
  82. Tamura, K.; Stecher, G.; Peterson, D.; Filipski, A.; Kumar, S. MEGA6: Molecular Evolutionary Genetics Analysis version 6.0. Mol. Biol. Evol. 2013, 30, 2725–2729. [Google Scholar] [CrossRef] [PubMed] [Green Version]
  83. Bailey, T.L.; Boden, M.; Buske, F.A.; Frith, M.; Grant, C.E.; Clementi, L.; Ren, J.; Li, W.W.; Noble, W.S. MEME SUITE: Tools for motif discovery and searching. Nucleic Acids Res. 2009, 37, W202–W208. [Google Scholar] [CrossRef] [PubMed]
  84. Voorrips, R.E. MapChart: Software for the graphical presentation of linkage maps and QTLs. J. Hered. 2002, 93, 77–78. [Google Scholar] [CrossRef] [PubMed] [Green Version]
  85. Chen, C.; Xia, R.; Chen, H.; He, Y. TBtools, a Toolkit for Biologists integrating various biological data handling tools with a user-friendly interface. BioRxiv 2018, 289660. [Google Scholar]
  86. Qu, C.; Fu, F.; Lu, K.; Zhang, K.; Wang, R.; Xu, X.; Wang, M.; Lu, J.; Wan, H.; Tang, Z.; et al. Differential accumulation of phenolic compounds and expression of related genes in black- and yellow-seeded Brassica napus. J. Exp. Bot. 2013, 64, 2885–2898. [Google Scholar] [CrossRef] [Green Version]
  87. Wu, G.; Zhang, L.; Wu, Y.; Cao, Y.; Lu, C. Comparison of Five Endogenous Reference Genes for Specific PCR Detection and Quantification of Brassica napus. J. Agric. Food Chem. 2010, 58, 2812–2817. [Google Scholar] [CrossRef]
  88. Lu, K.; Li, T.; He, J.; Chang, W.; Zhang, R.; Liu, M.; Yu, M.; Fan, Y.; Ma, J.; Sun, W.; et al. qPrimerDB: A thermodynamics-based gene-specific qPCR primer database for 147 organisms. Nucleic Acids Res. 2018, 46, D1229–D1236. [Google Scholar] [CrossRef]
Figure 1. Phylogenetic tree of PHT proteins from A. thaliana and five Brassica species. The phylogenetic tree was constructed using the neighbor-joining method with 1000 bootstrap replicates in MEGA7 (https://www.megasoftware.net/) and visualized using FigTree v1.4.4 (http://tree.bio.ed.ac.uk/software/figtree/). The PHTs were divided into five subfamilies (PHT1–PHT5), which are indicated by different colors. Gene names and accession numbers are shown in Table S1.
Ijms 21 02209 g001
Figure 2. Chromosomal distribution and analysis of duplication events in PHT family genes among Brassica species. Genes from the same subtribe are indicated by the same color, which matches the color used for the corresponding family in the evolutionary tree. The labels on the corresponding chromosomes indicate the names of the source organism and the subgenome. The scales indicate the sizes of various Brassica plant genomes. Any two or more adjacent homologous genes on the same chromosome less than 100 kb apart are highlighted by red boxes. Bra, B. rapa; Bol, B. oleracea; Bni, B. nigra; Bna, B. napus; and Bju, B. juncea.
Ijms 21 02209 g002aIjms 21 02209 g002bIjms 21 02209 g002c
Figure 3. Genome-wide synteny analysis of PHT family genes among Arabidopsis and five Brassica species. (A) Collinearity analysis of PHT family genes among Arabidopsis, B. napus, B. rapa, and B. oleracea. (B) Collinearity analysis of PHT family genes among Arabidopsis, B. juncea, B. rapa, and B. nigra. Five Arabidopsis chromosomes (AtChr1–5), 19 B. napus chromosomes (BnaA01-10 and BnaC01-09), 18 B. juncea chromosomes (BjuA01-10 and BjuB01-08), 10 B. rapa chromosomes (BraA01-10), 9 B. oleracea chromosomes (BolC01-09), and 8 B. nigra chromosomes (BniB01-08) are shown, which are represented by different colored bars. Different gene pairs are represented by different colored lines in the figure.
Ijms 21 02209 g003
Figure 4. Analysis, gene structures, and protein motifs of PHT genes between A. thaliana and B. napus. (A) Phylogenetic tree. Full-length coding sequence (CDS) were aligned with Clustal X 2.0, and the phylogenetic tree was constructed using the neighbor-joining method. (B) Gene structures. Red boxes represent exons and gray lines represent introns. The untranslated regions (UTRs) are indicated by blue boxes. The sizes of the exons and introns can be estimated using the scale at the bottom. (C) Protein motifs. Conserved motifs (1–10) are represented by different colored boxes, whereas nonconserved sequences are indicated by gray lines.
Ijms 21 02209 g004
Figure 5. Heatmap of the expression profiles of BnaPHT family genes in different tissues and organs. The abbreviations above the heatmap indicate the different tissues and organs/developmental stages of B. napus ZS11 (Table S3). The expression data were obtained from RNA-seq data and are shown as log2 values, as calculated based on FPKM values (fragments per kilobase of exon model per million). The heatmap was generated using Heatmap Illustrator 1.0 (HemI 1.0). The black indicates that the BnaPHT had no expression (FPKM = 0) levels in this study (Table S4).
Ijms 21 02209 g005
Figure 6. Heatmap of the expression profiles of BnaPHT family genes in different rapeseed accessions treated with As3+ and Cd2+. The samples and treatments are shown above the heatmap. The results were obtained by RNA-seq analysis. The relative expression values in the bars were calculated based on FPKM values (fragments per kilobase of exon model per million) compared to the control samples. The heatmap was generated using Heatmap Illustrator 1.0 (HemI 1.0). The black indicates that the BnaPHT had no expression (FPKM = 0) levels in this study (Table S5).
Ijms 21 02209 g006
Figure 7. Expression profiles of 12 BnaPHT genes in B. napus under As3+ treatment, as revealed by qRT-PCR. The CK is the control sample, and As represents samples treated with As3+ stress. The samples (P063, P070, and P087) are B. napus accessions. Error bars show the standard deviation of three biological replicates. Single and double asterisks represent significant differences from the control sample at the 0.05 and 0.01 levels (t-test), respectively.
Ijms 21 02209 g007
Figure 8. Expression profiles of 12 BnaPHT genes in B. napus under Cd2+ treatment, as revealed by qRT-PCR. The CK is the control sample, and Cd represents samples treated with Cd2+ stress. The samples (P063, P085, and P0163) are B. napus accessions. Error bars show the standard deviation of three biological replicates. Single and double asterisks represent significant differences from the control sample at the 0.05 and 0.01 levels (t-test), respectively.
Ijms 21 02209 g008
Table 1. Statistics of PHT genes in each PHT subroup between Arabidopsis thaliana and five Brassica species.
TypeFamilyA. thalianaB. rapaB. oleraceaB. nigraB. junceaB. napus
PHT1PHT1:11324312
PHT1:2141747
PHT1:315/369
PHT1:415151010
PHT1:511/223
PHT1:6122364
PHT1:713/255
PHT1:8123356
PHT1:918571110
PHT2PHT2:1123244
PHT3PHT3:1132366
PHT3:2112122
PHT3:3122134
PHT4PHT4:1111222
PHT4:2111222
PHT4:3111122
PHT4:4122234
PHT4:5111123
PHT4:6121133
PHT5PHT5:1122225
PHT5:2111112
PHT5:3111113

