Role of Autophagy in Von Willebrand Factor Secretion by Endothelial Cells and in the In Vivo Thrombin-Antithrombin Complex Formation Promoted by the HIV-1 Matrix Protein p17


 , , ,
, , ,  , ,
, , 
Abstract
1. Introduction
2. Results
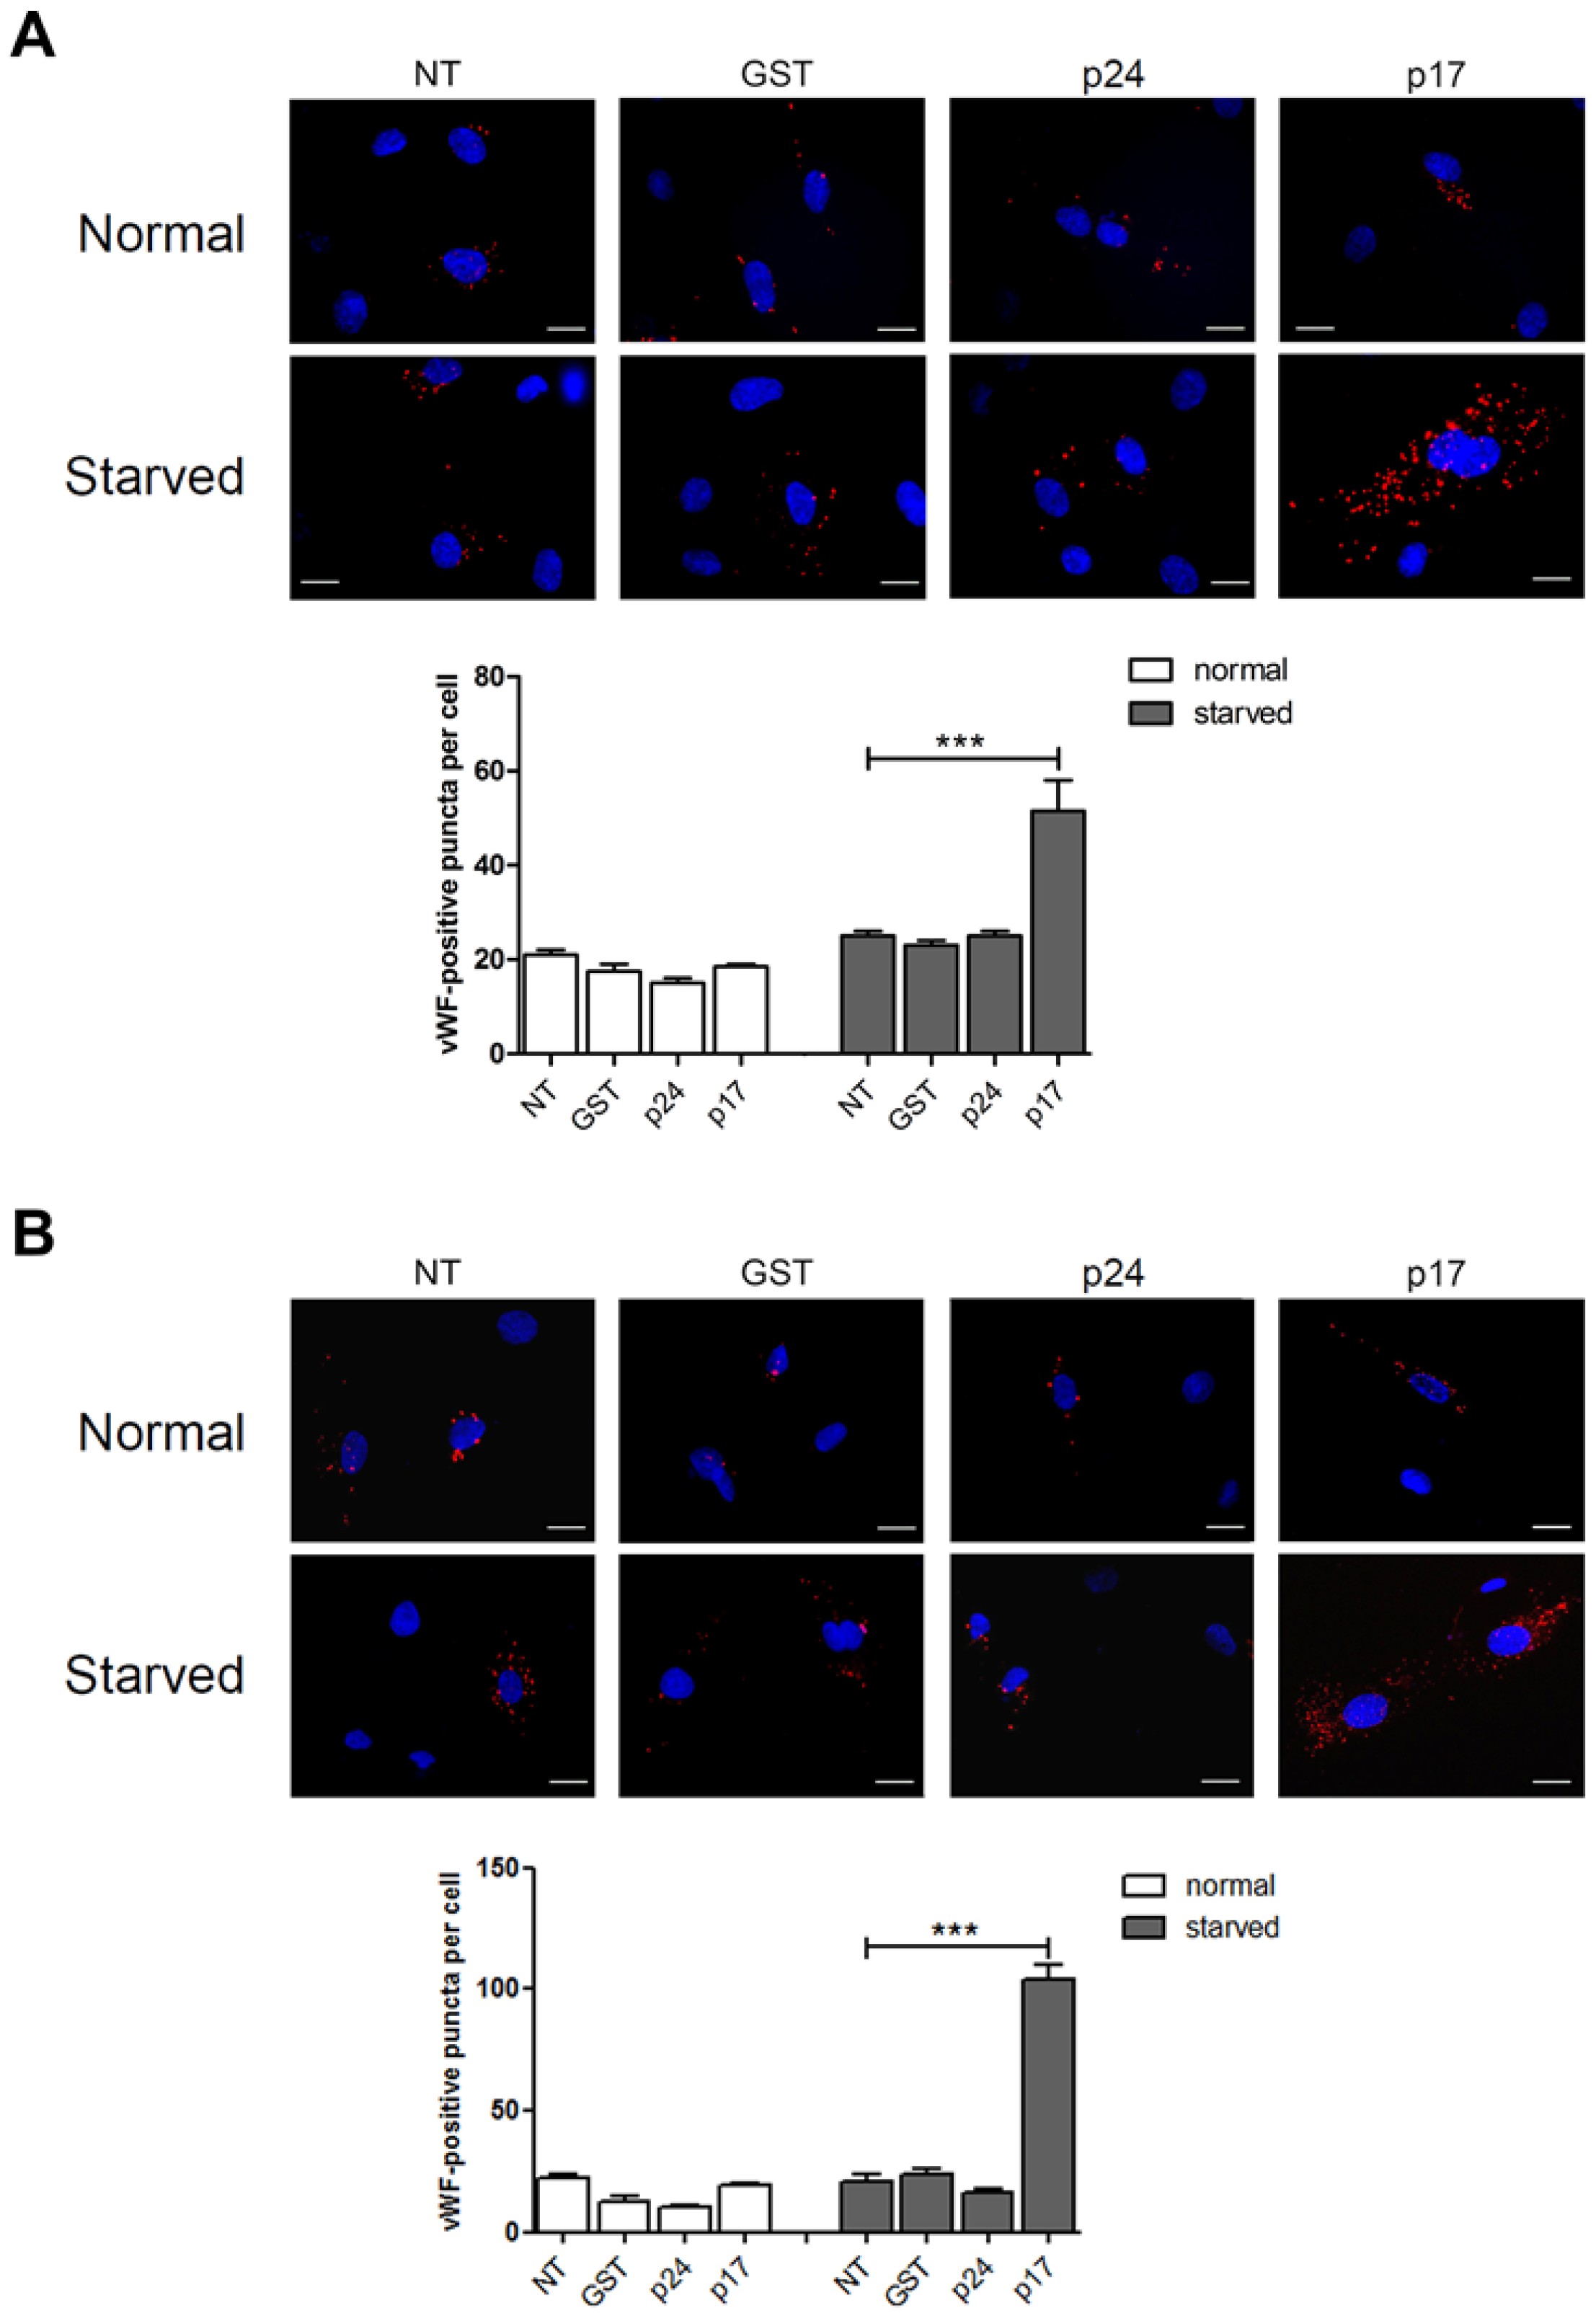
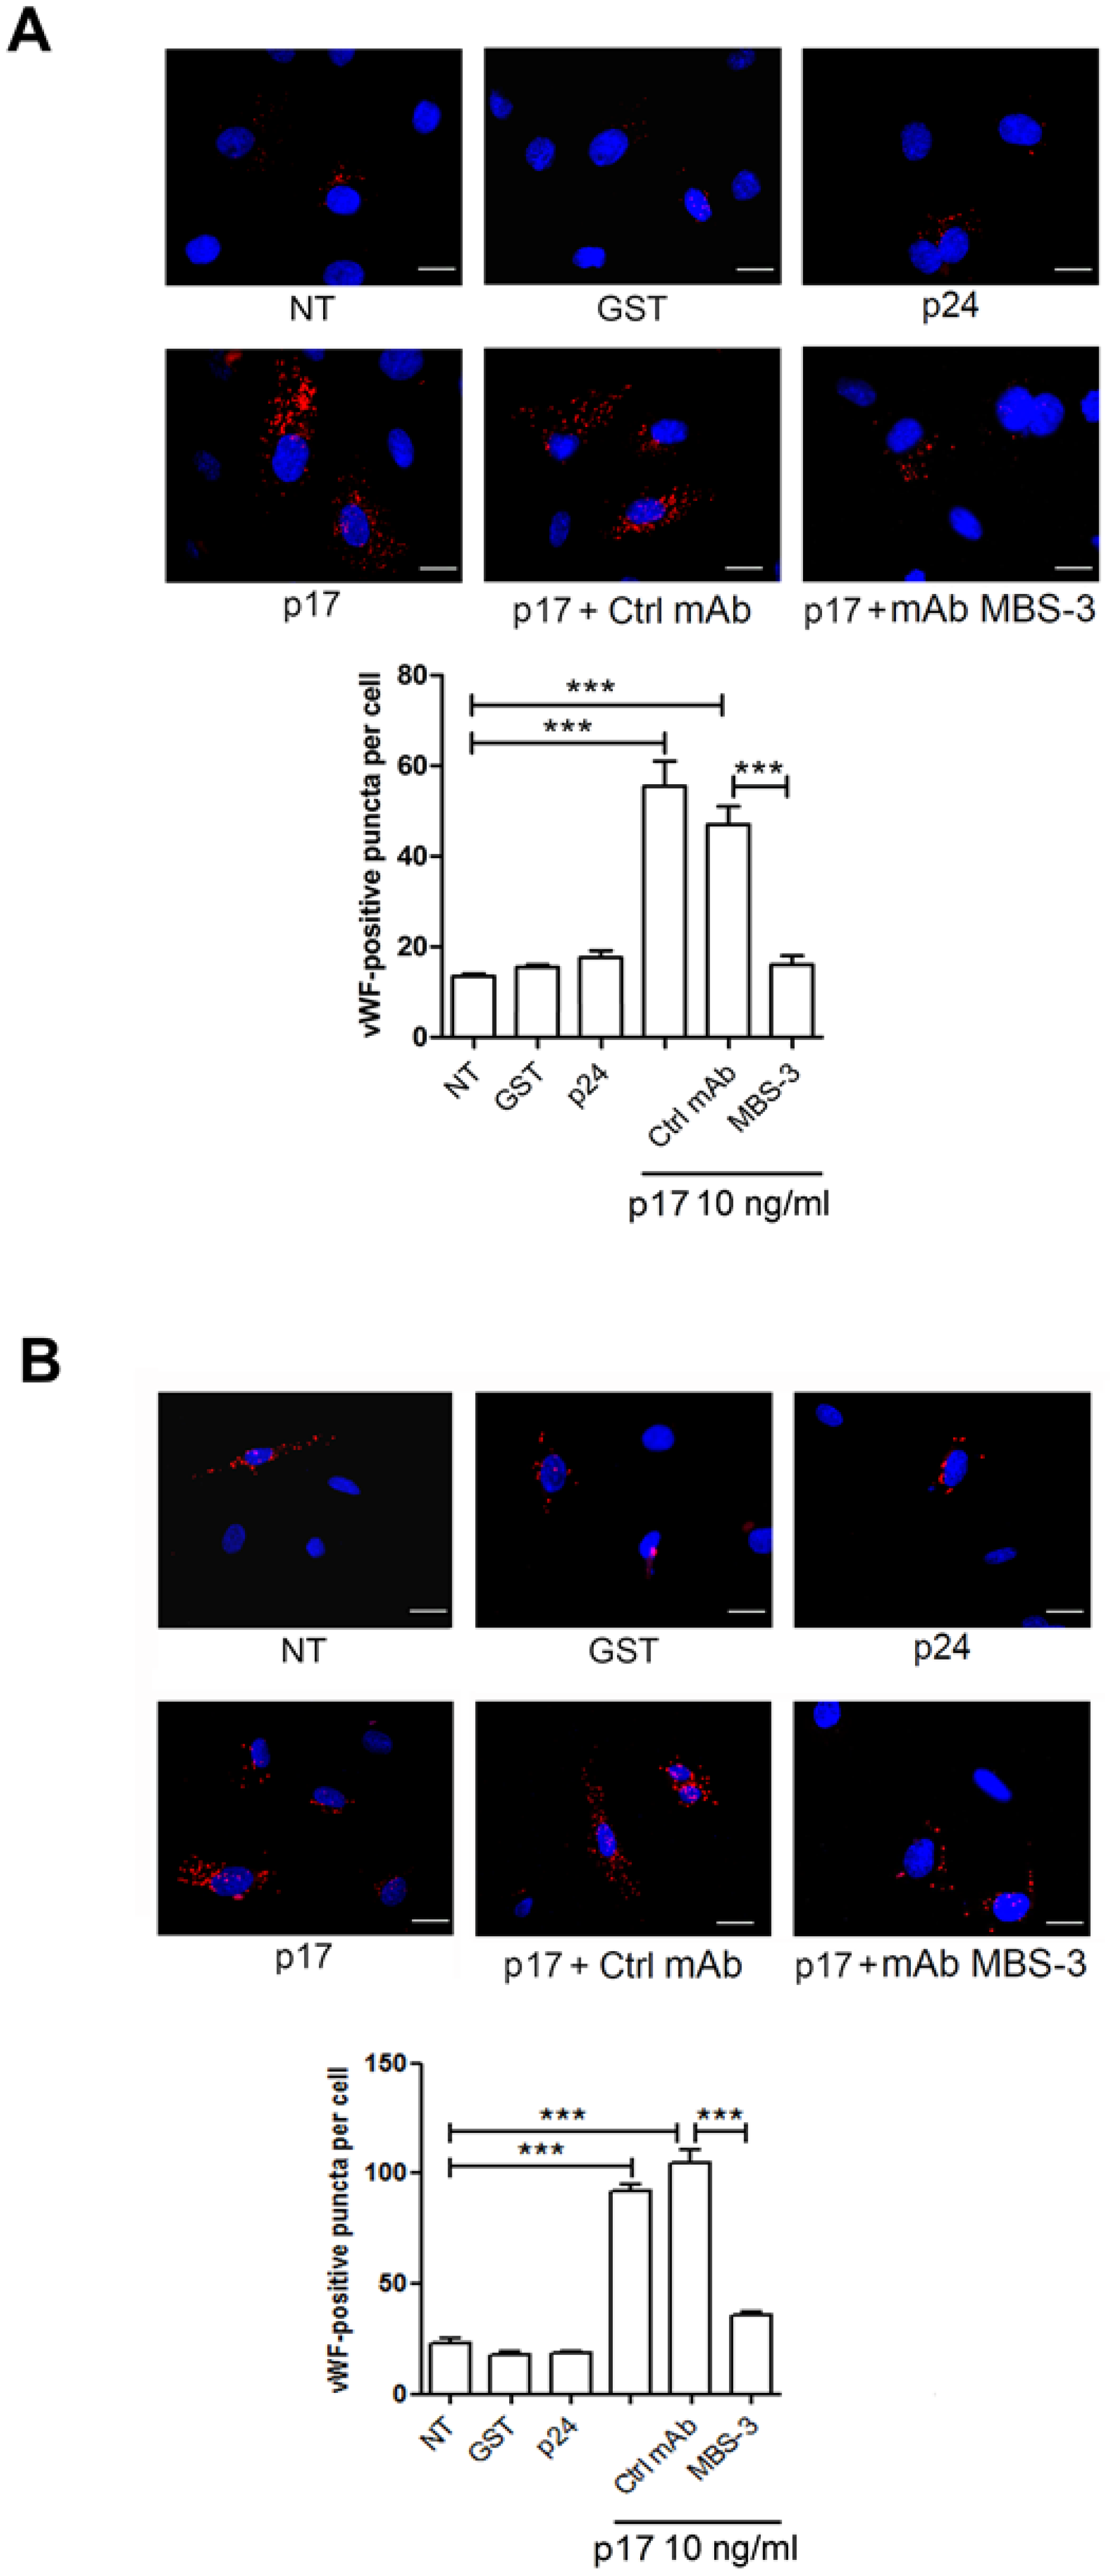
2.1. The HIV-1 Matrix Protein p17 Induces vWF Cytoplasmic Accumulation in ECs
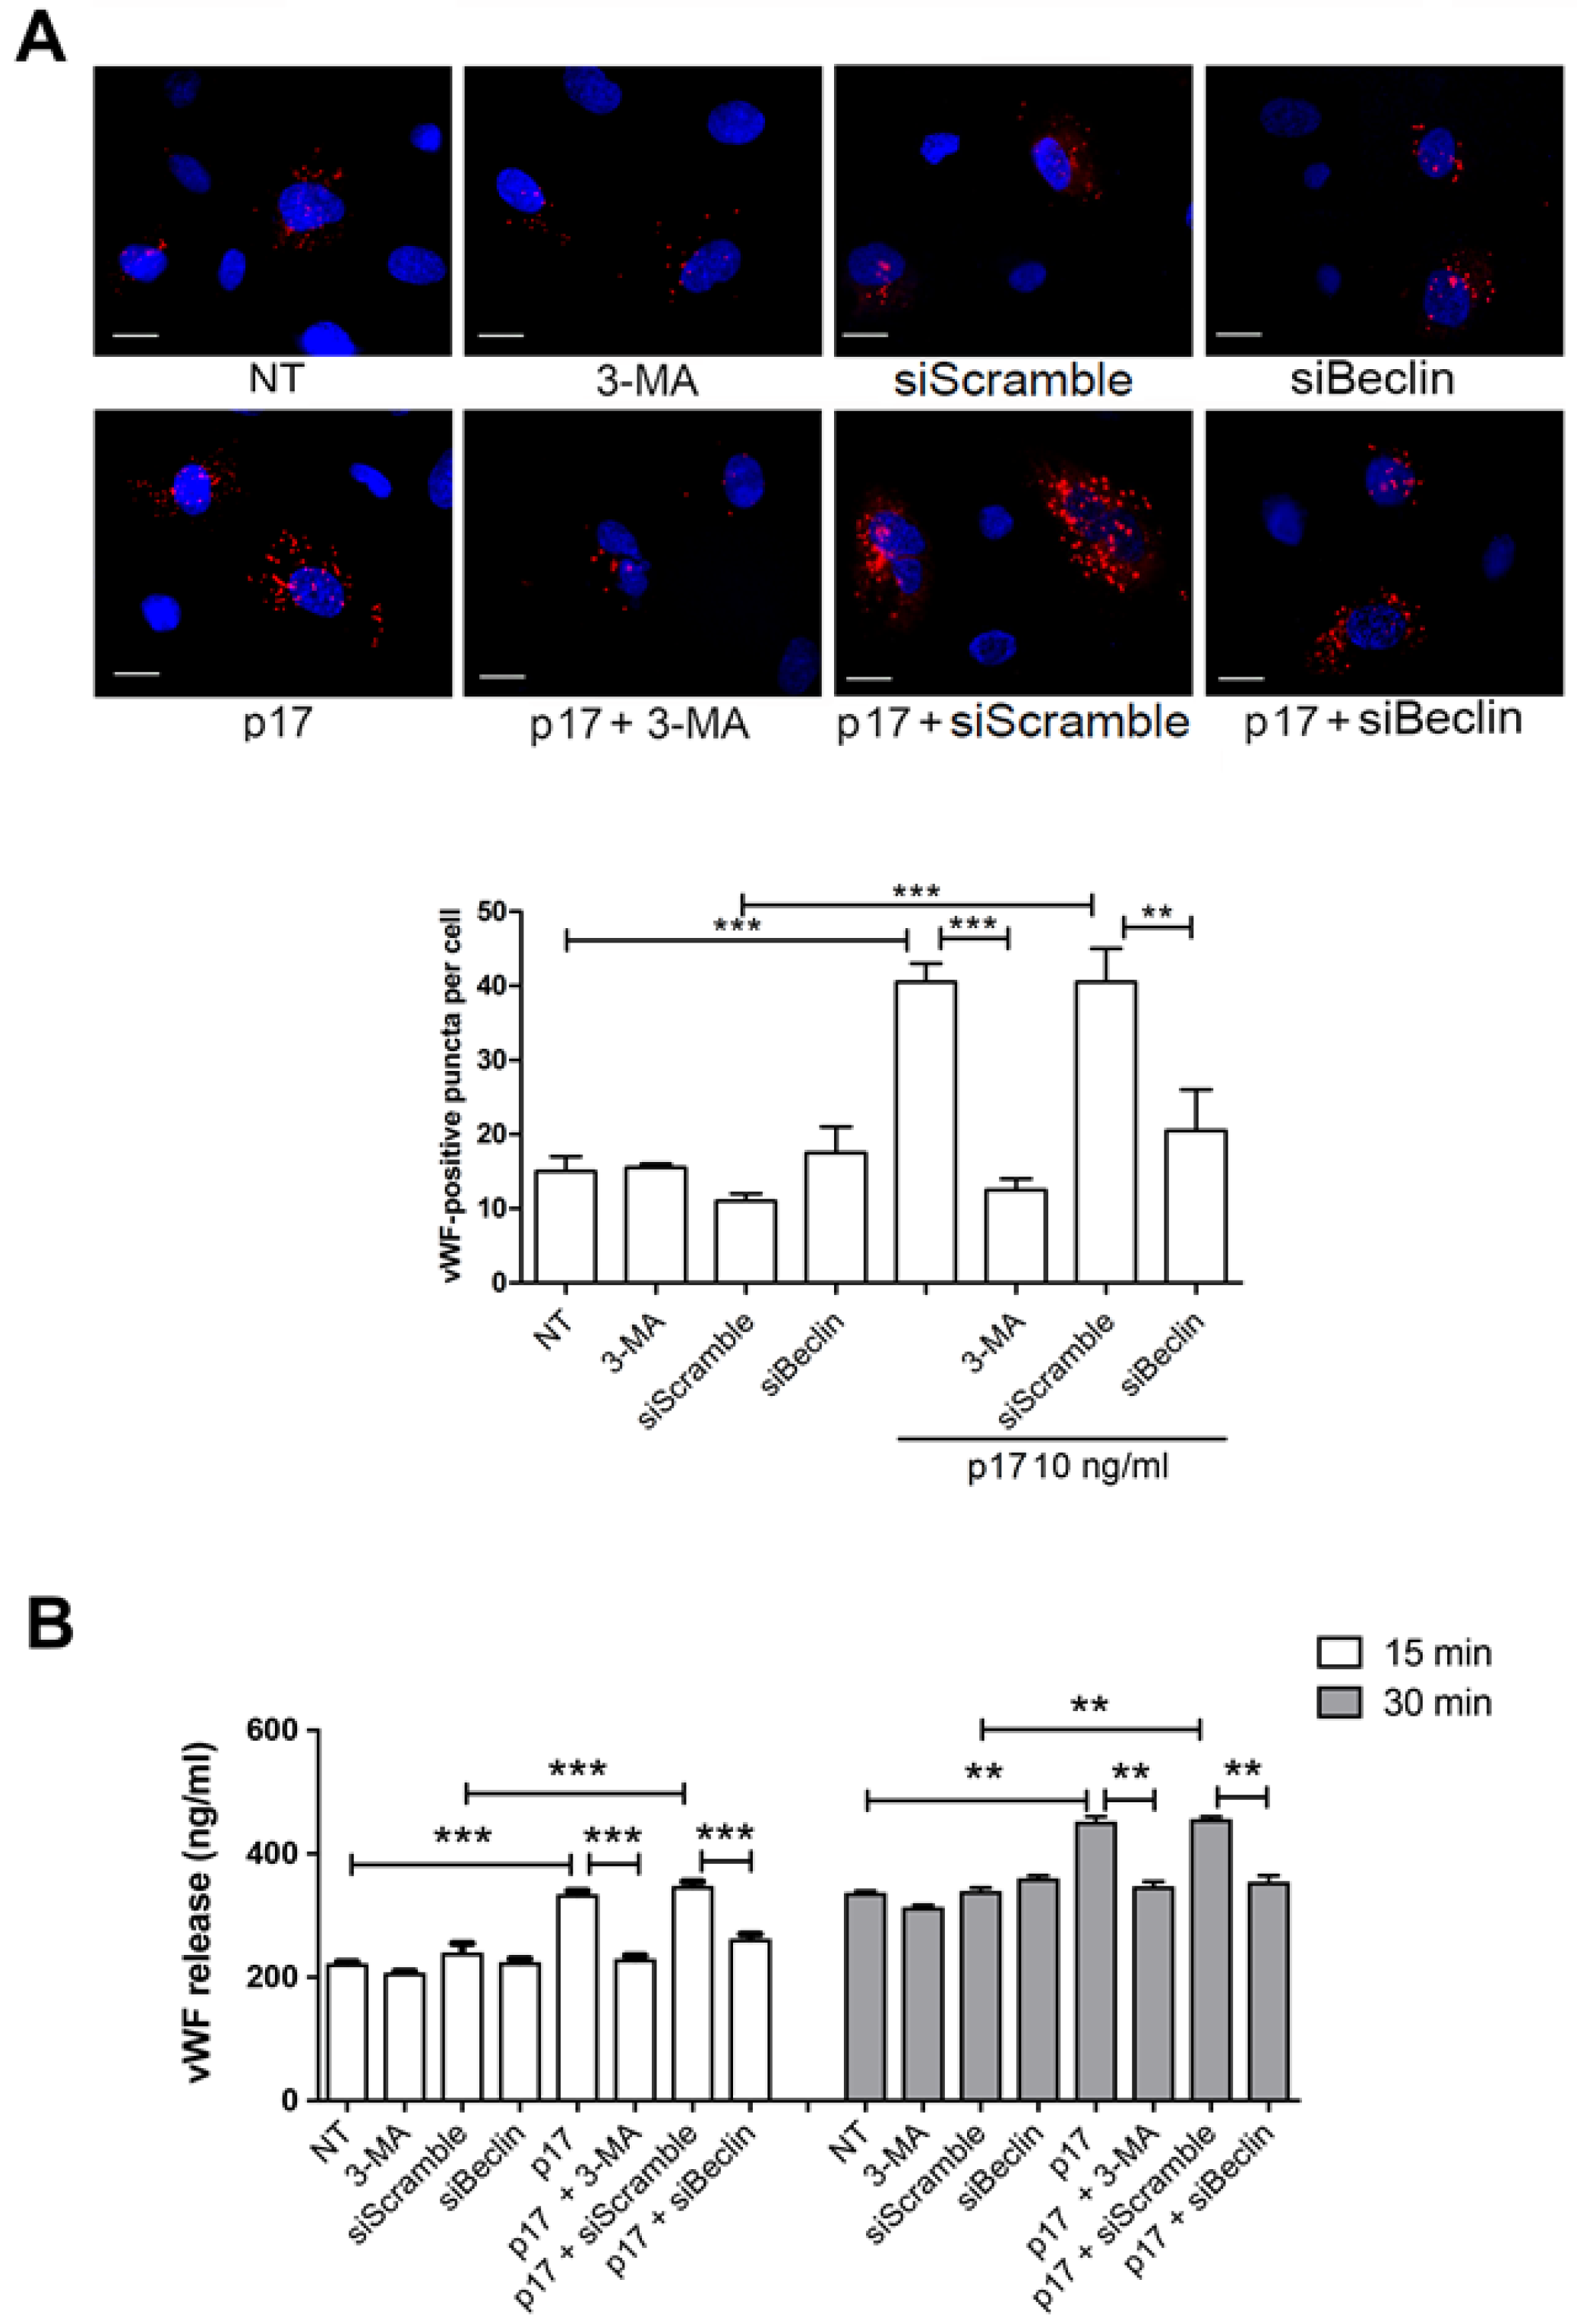
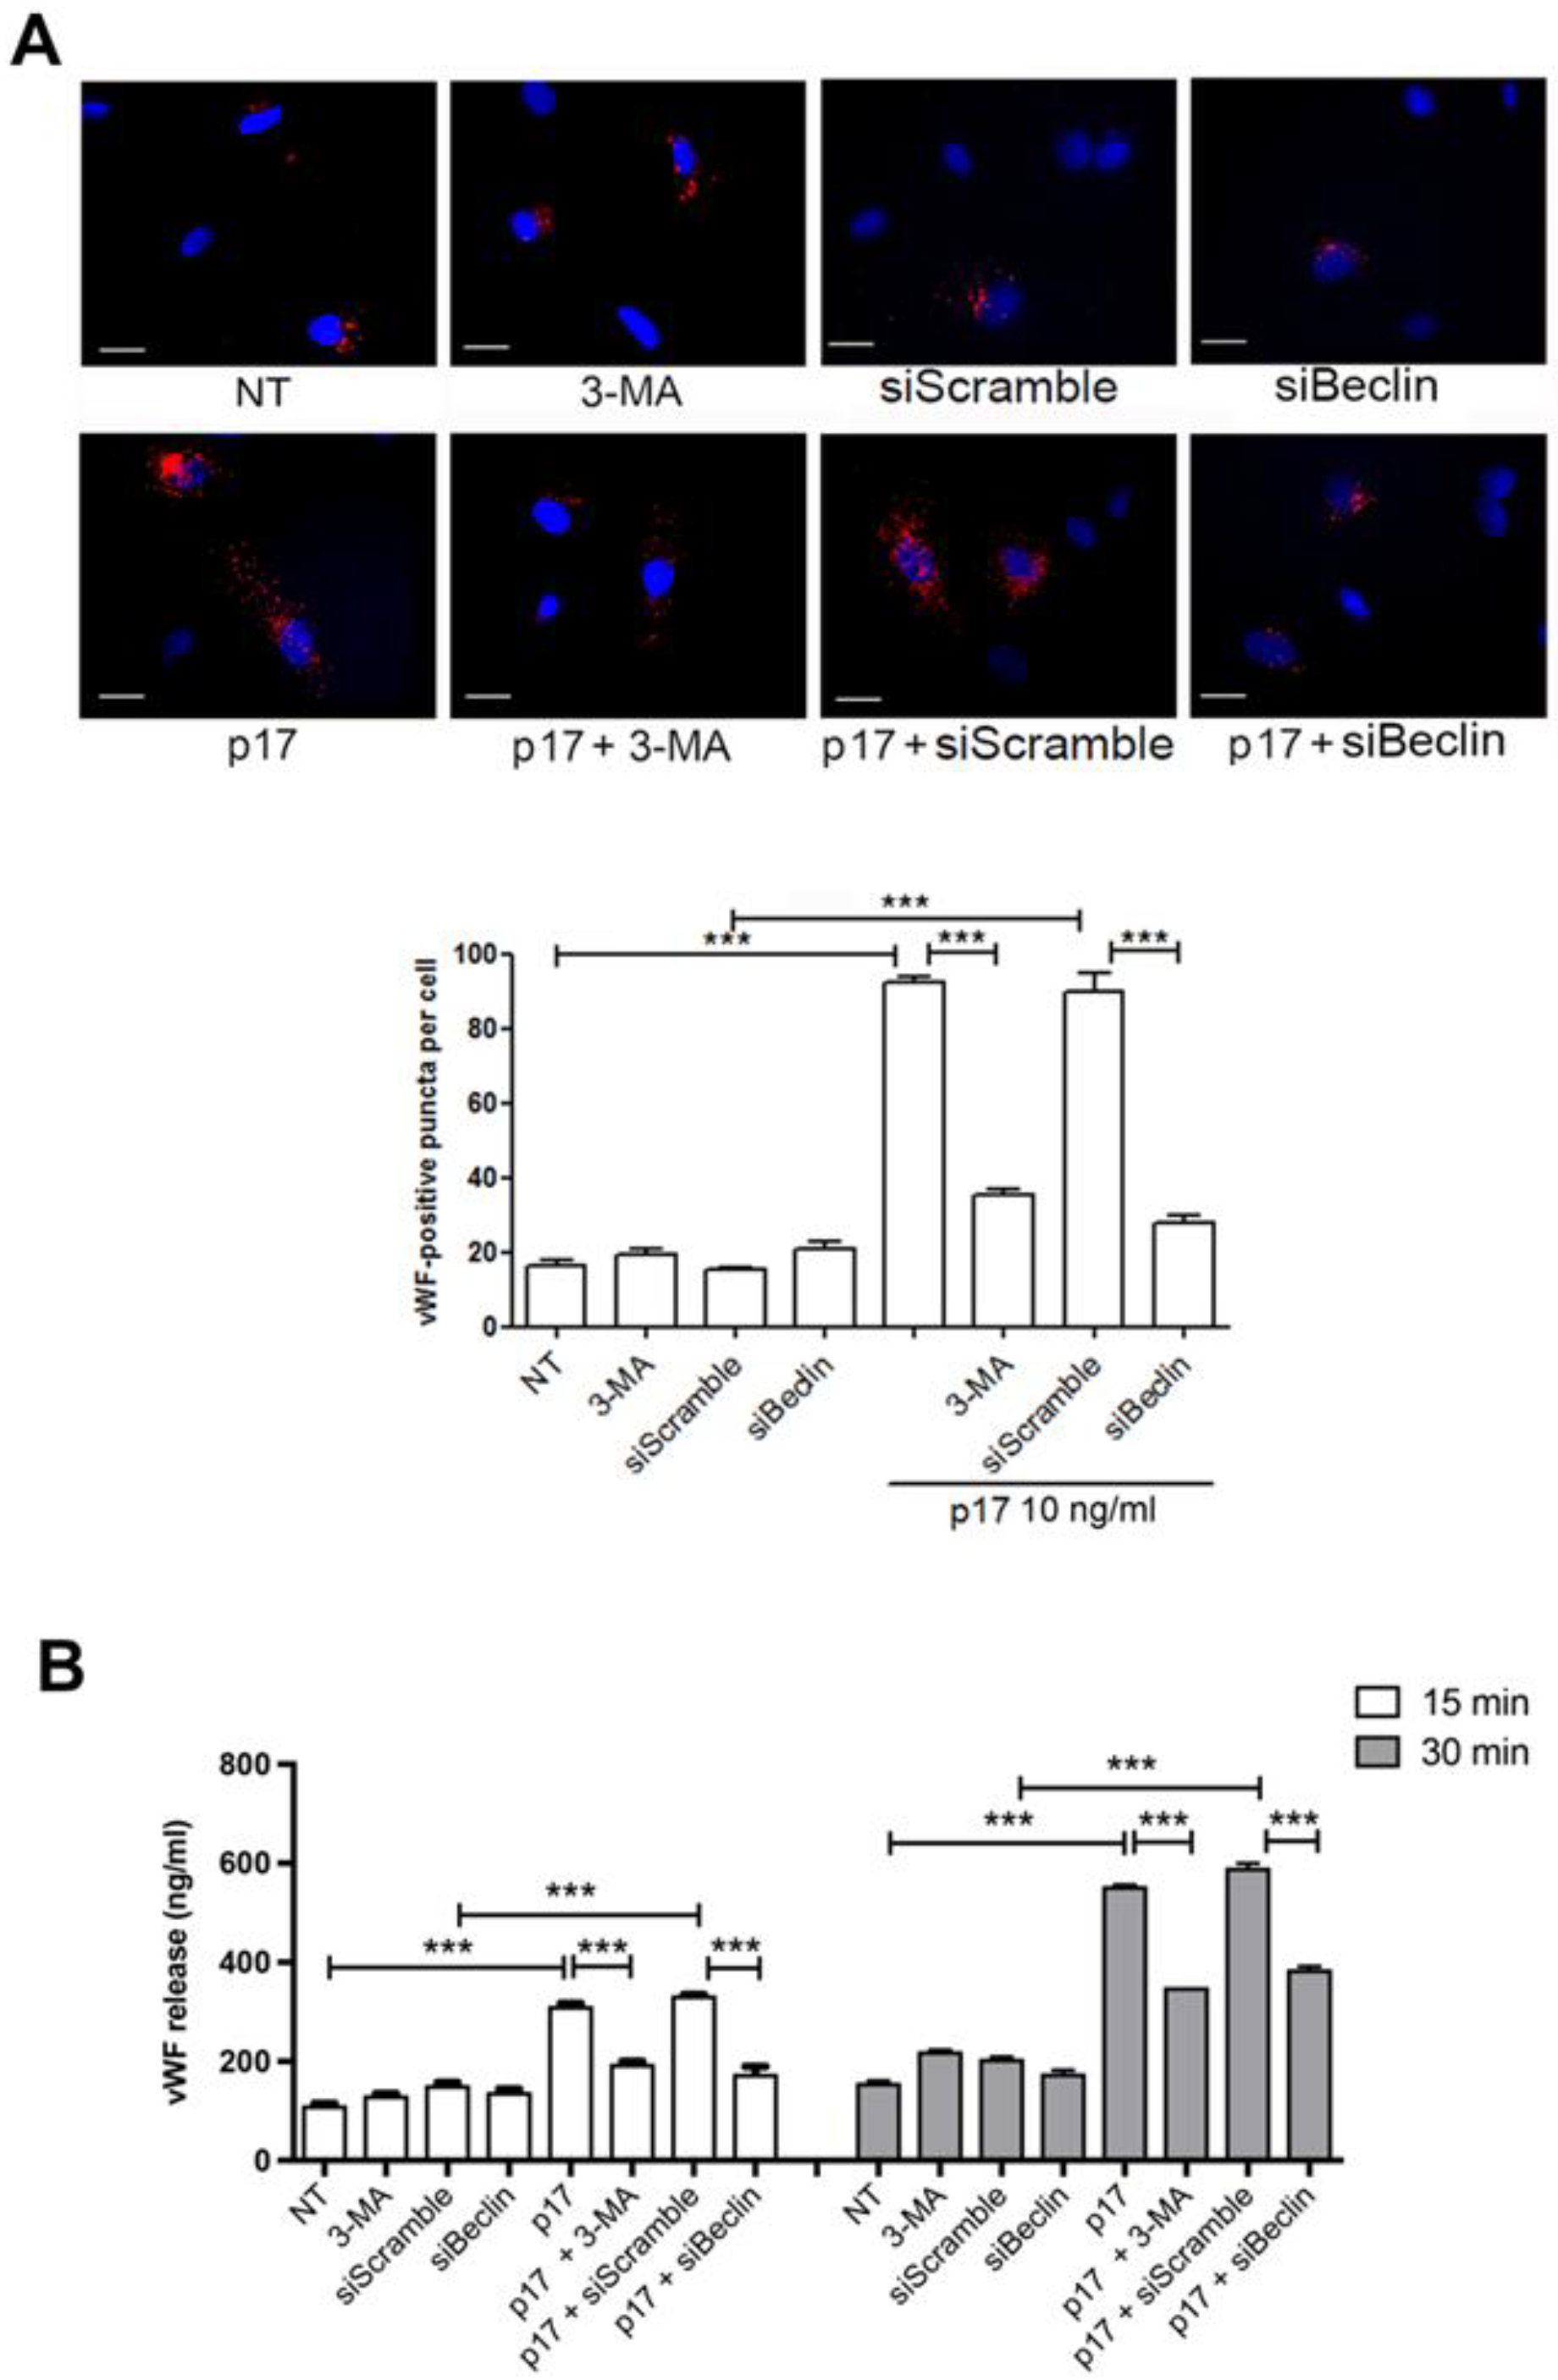
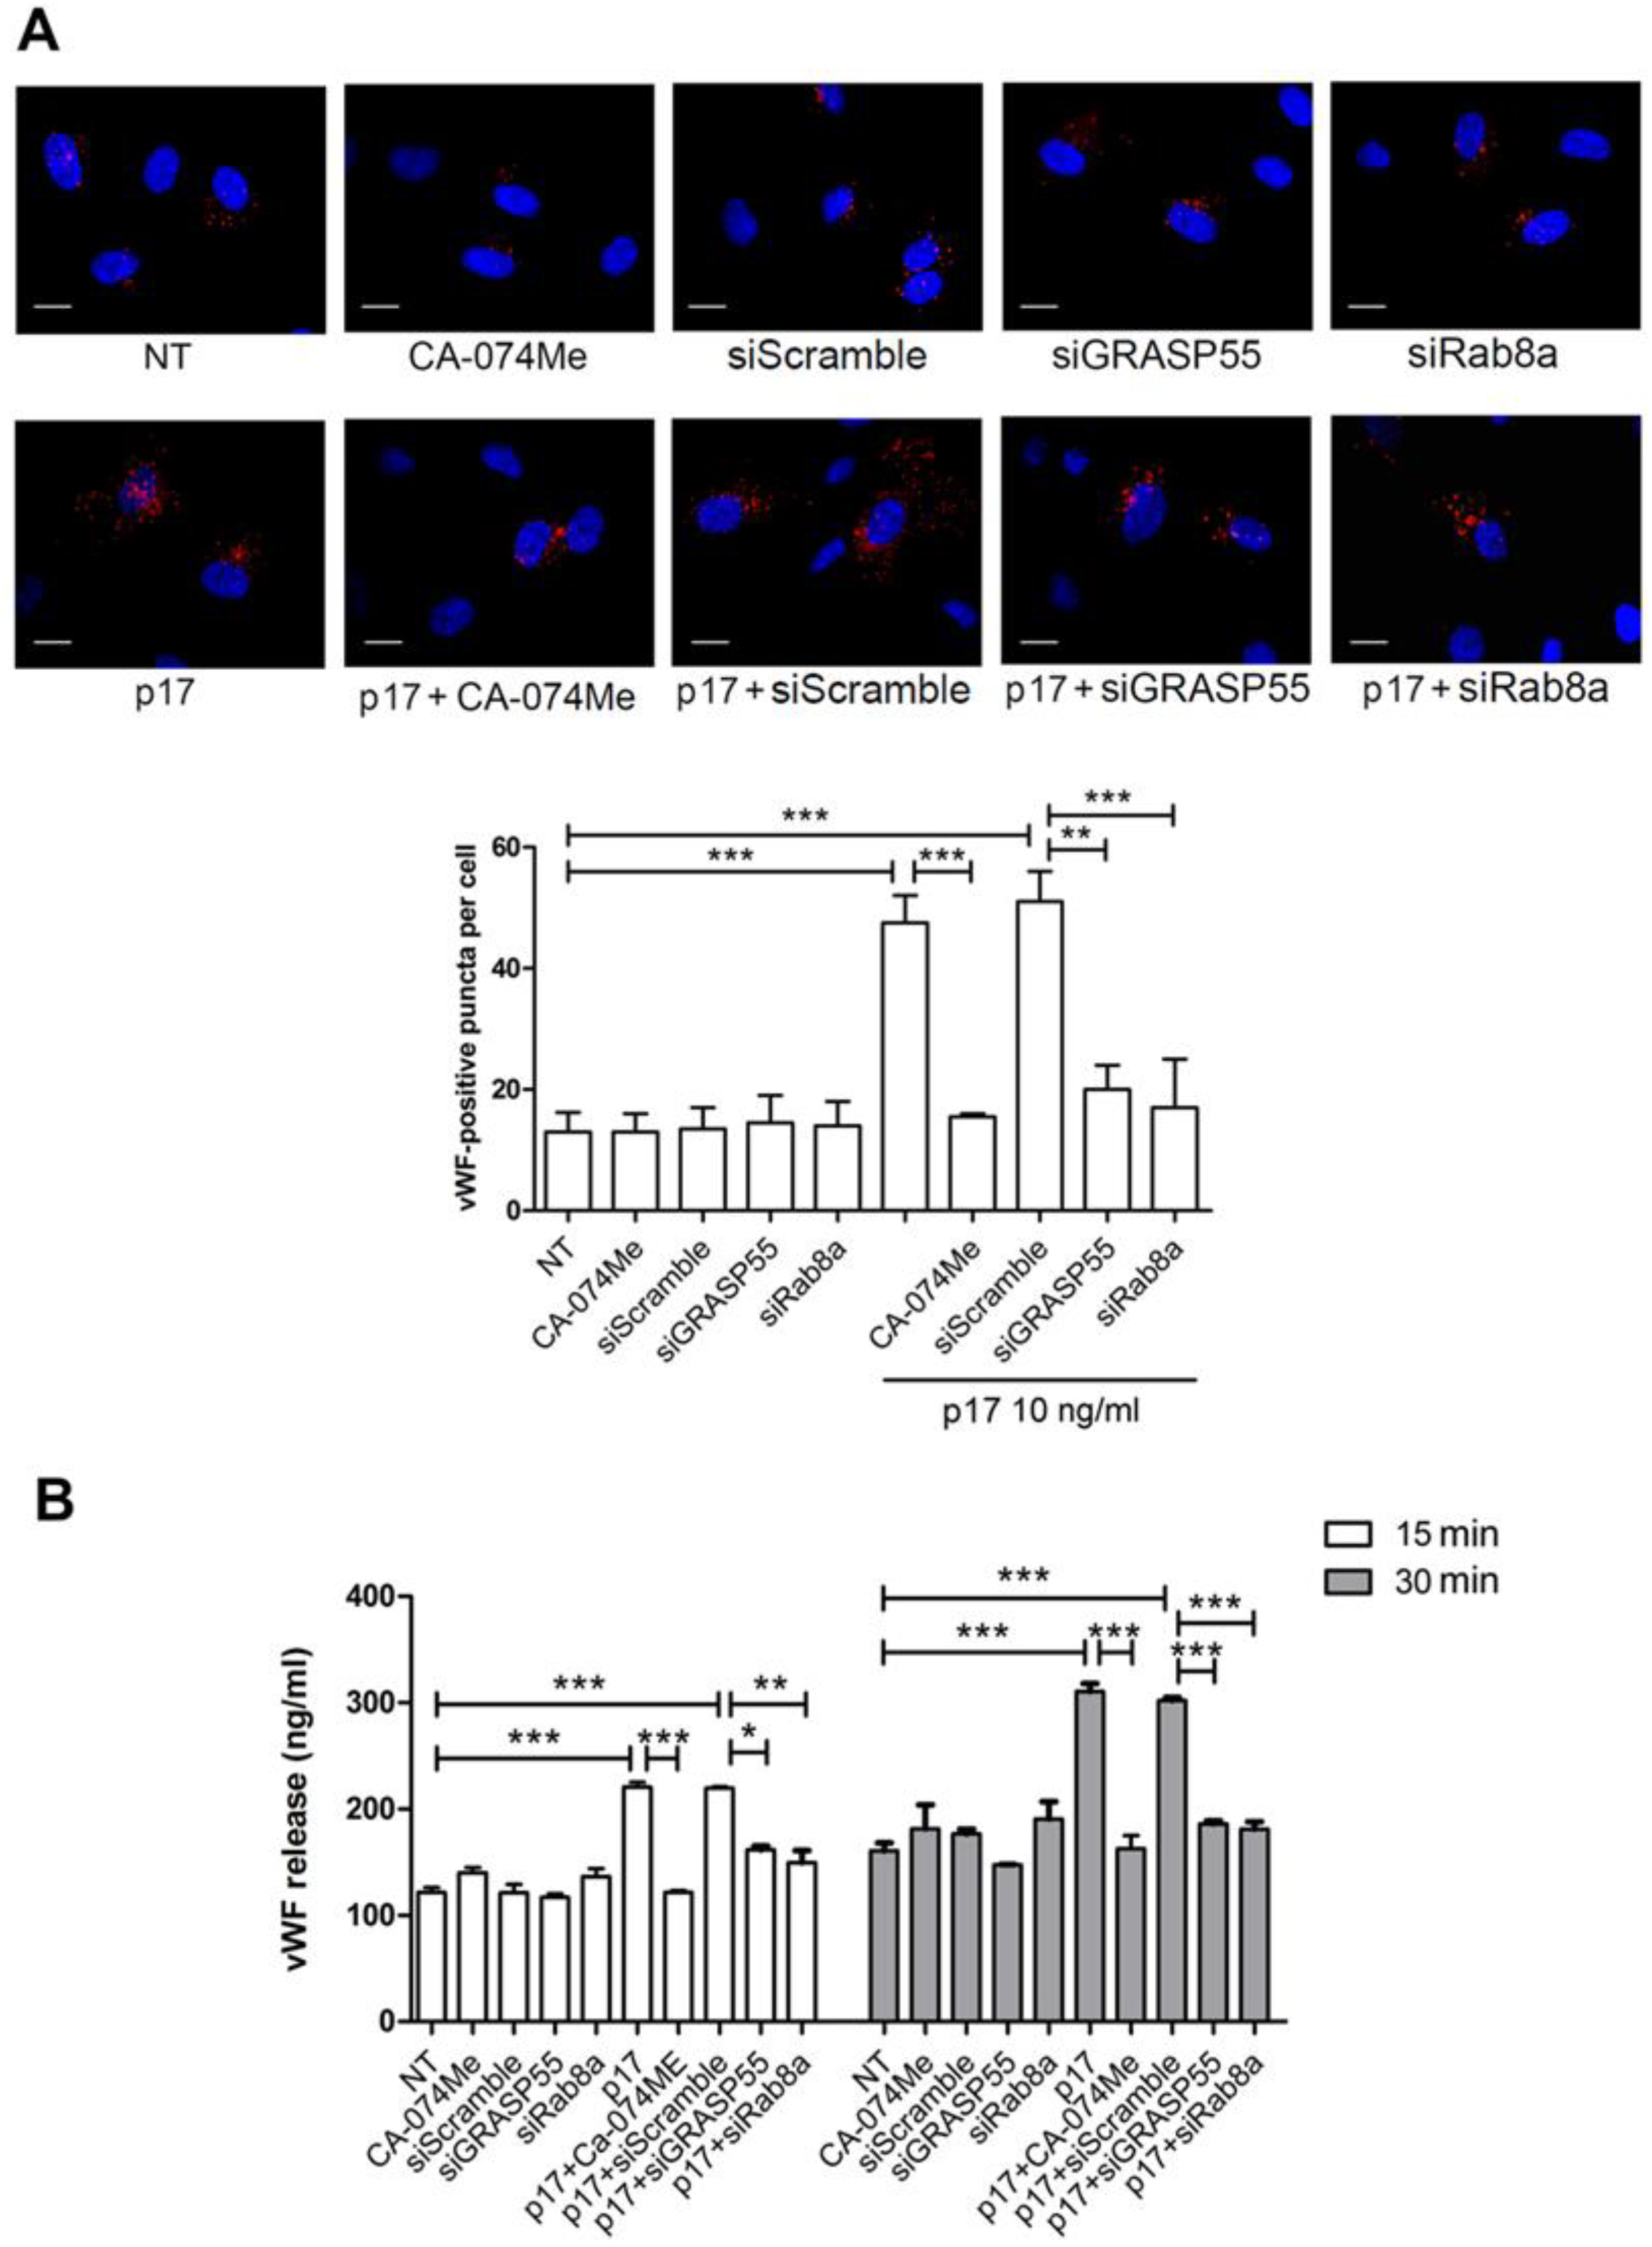
2.2. Autophagy Controls the Storage and Secretion of vWF Upon p17 Stimulation
2.3. Mechanistic Insight in the p17-Triggered Processing of vWF
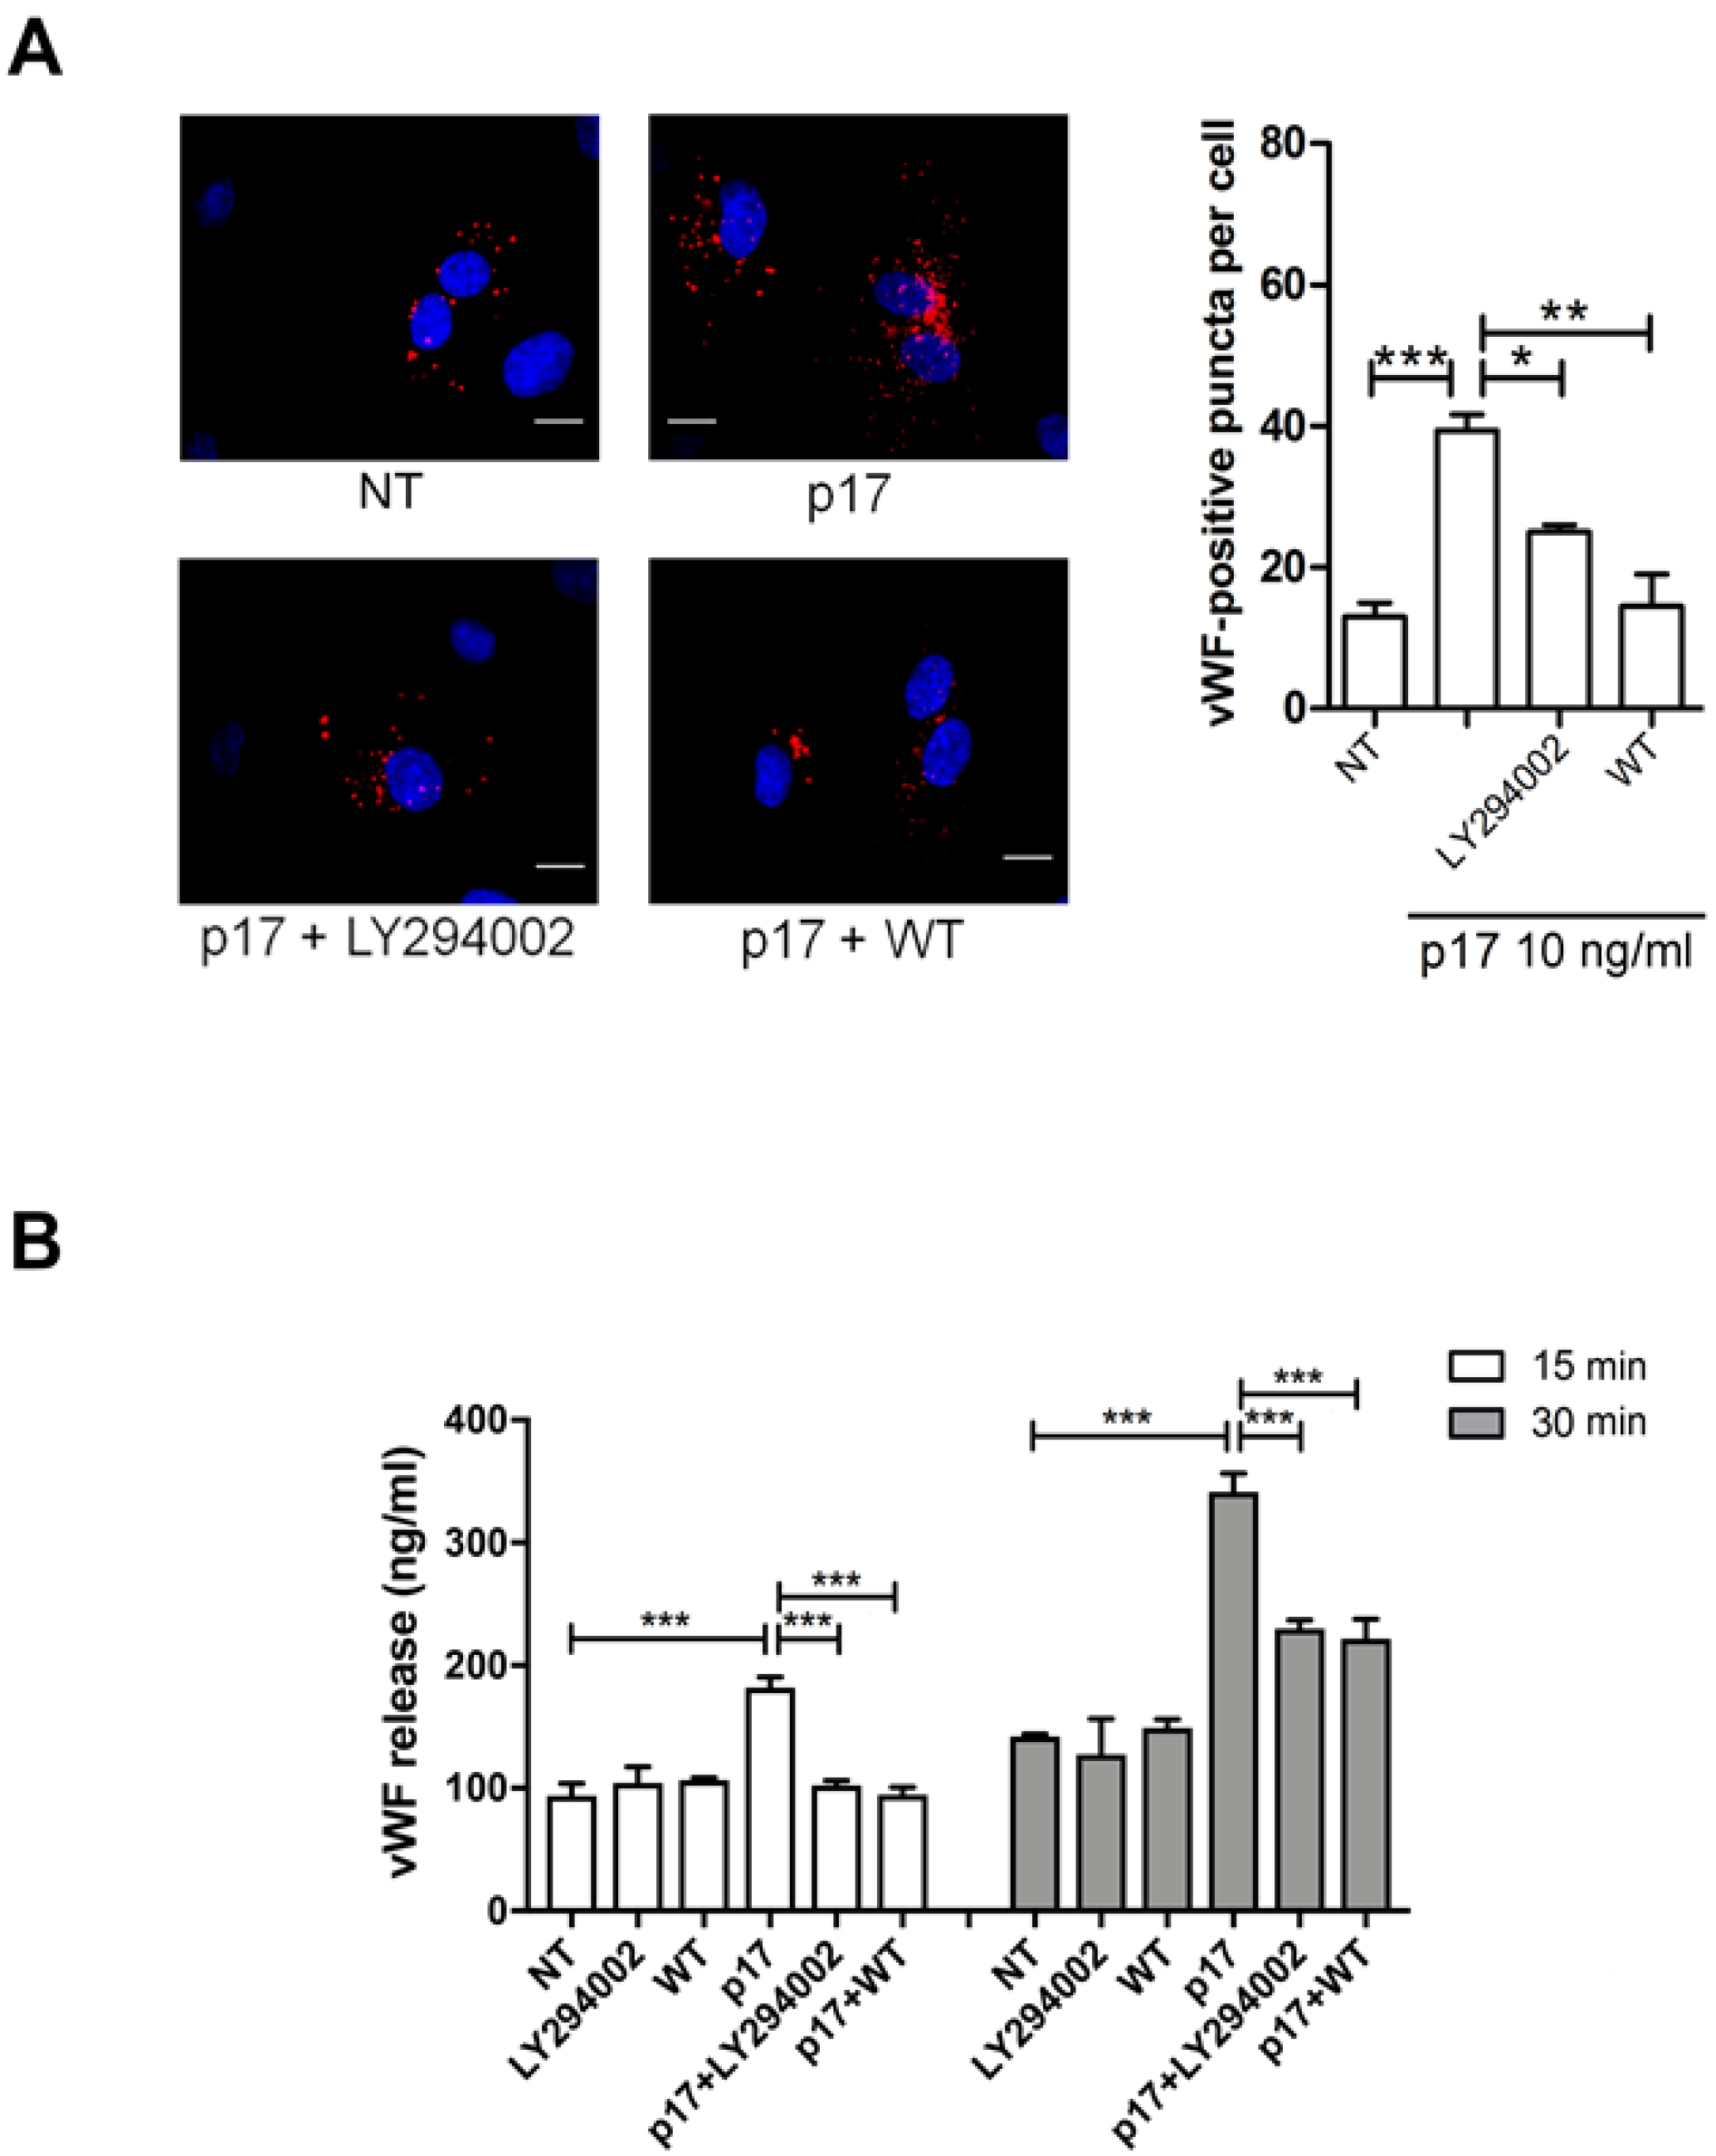
2.4. P17-Triggered vWF Storage and Secretion Requires Activation of PI3K
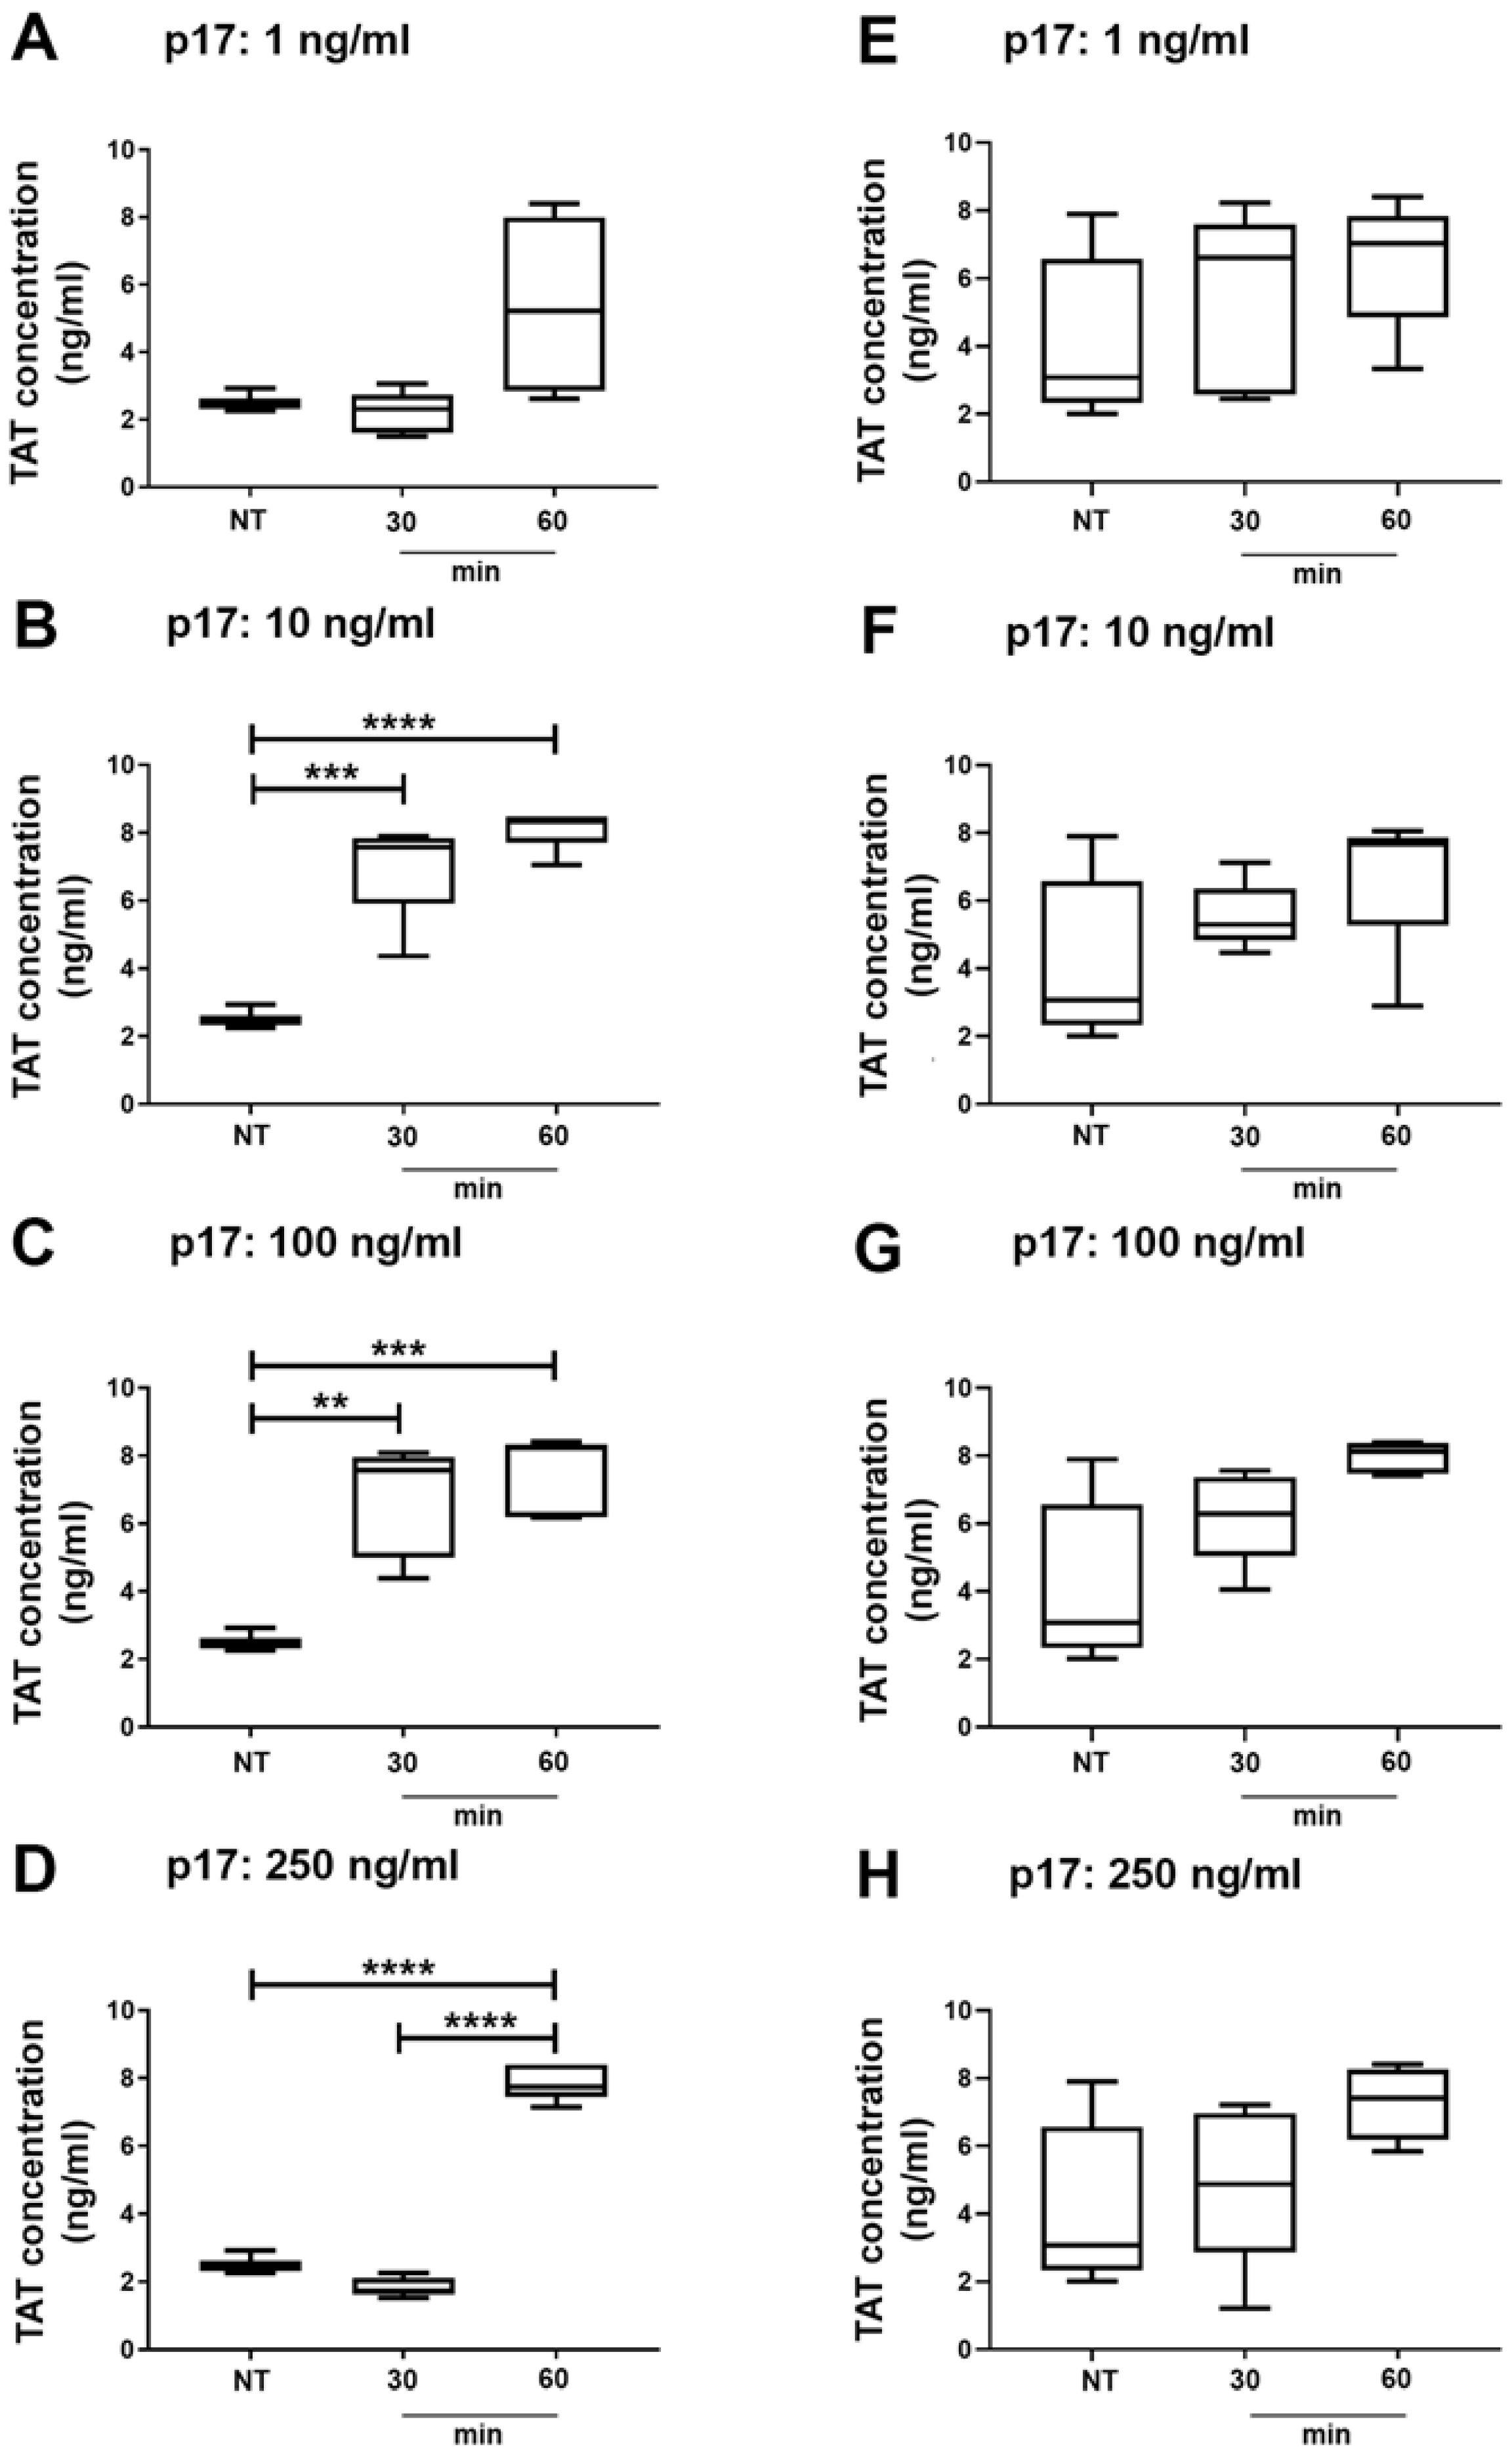
2.5. Thrombin Antithrombin (TAT) Complex Formation in Wild Type and Autophagy Deficient Mice Treated With p17
3. Discussion
4. Materials and Methods
4.1. Recombinant Proteins and mAb to p17
4.2. Cell Cultures
4.3. Fluorescent vWF Expression and Quantification
4.4. Silencing of Autophagy Related Genes by siRNA Technique
4.5. Human vWF Quantitative ELISA
4.6. Quantification of Murine TAT Complexes by ELISA
4.7. Statistical Analysis
Supplementary Materials
Author Contributions
Acknowledgments
Conflicts of Interest
Abbreviations
| 3-MA | 3-methyladenine |
| AIDS | acquired immune deficiency syndrome |
| cART | combined antiretroviral therapy |
| ECs | endothelial cells |
| ET-1 | endothelin-1 |
| GRASP | Golgi reassembly stacking protein |
| GST | glutathione S-transferase |
| HIV-1 | human immunodeficiency virus type 1 |
| p24 | HIV-1 capsid protein p24 |
| HMVEC-L | human lung microvascular endothelial cells |
| HUVEC | human umbilical vein endothelial cells |
| mAb | monoclonal antibody |
| PI3K | phosphatidylinositol 3-kinase |
| Rab8 | Ras-related protein 8 |
| TAT | thrombin anti-thrombin |
| vWF | von Willebrand factor |
| WPBs | Weibel-Palade bodies |
References
- Duran, J.M.; Anjard, C.; Stefan, C.; Loomis, W.F.; Malhotra, V. Unconventional secretion of Acb1 is mediated by autophagosomes. J. Cell. Biol. 2010, 188, 527–536. [Google Scholar] [CrossRef]
- Manjithaya, R.; Anjard, C.; Loomis, W.F.; Subramani, S. Unconventional secretion of Pichia pastoris Acb1 is dependent on GRASP protein, peroxisomal functions, and autophagosome formation. J. Cell. Biol. 2010, 188, 537–546. [Google Scholar] [CrossRef] [PubMed]
- Dupont, N.; Jiang, S.; Pilli, M.; Ornatowski, W.; Bhattacharya, D.; Deretic, V. Autophagy-based unconventional secretory pathway for extracellular delivery of IL-1β. EMBO J. 2011, 30, 4701–4711. [Google Scholar] [CrossRef] [PubMed]
- Narita, M.; Young, A.R.; Arakawa, S.; Samarajiwa, S.A.; Nakashima, T.; Yoshida, S.; Hong, S.; Berry, L.S.; Reichelt, S.; Ferreira, M.; et al. Spatial coupling of mTOR and autophagy augments secretory phenotypes. Science 2011, 332, 966–970. [Google Scholar] [CrossRef] [PubMed]
- Cadwell, K.; Liu, J.Y.; Brown, S.L.; Miyoshi, H.; Loh, J.; Lennerz, J.K.; Kishi, C.; Kc, W.; Carrero, J.A.; Hunt, S.; et al. A key role for autophagy and the autophagy gene Atg16l1 in mouse and human intestinal Paneth cells. Nature 2008, 456, 259–263. [Google Scholar] [CrossRef] [PubMed]
- Cadwell, K.; Patel, K.K.; Maloney, N.S.; Liu, T.C.; Ng, A.C.; Storer, C.E.; Head, R.D.; Xavier, R.; Stappenbeck, T.S.; Virgin, H.W. Virus-plus-susceptibility gene interaction determines Crohn’s disease gene Atg16L1 phenotypes in intestine. Cell 2010, 141, 1135–1145. [Google Scholar] [CrossRef] [PubMed]
- Lowenstein, C.J.; Morrell, C.N.; Yamakuchi, M. Regulation of Weibel-Palade body exocytosis. Trends Cardiovasc. Med. 2005, 15, 302–308. [Google Scholar] [CrossRef]
- Valentijn, K.M.; Sadler, J.E.; Valentijn, J.A.; Voorberg, J.; Eikenboom, J. Functional architecture of Weibel-Palade bodies. Blood 2011, 117, 5033–5043. [Google Scholar] [CrossRef]
- Lenting, P.J.; Christophe, O.D.; Denis, C.V. von Willebrand factor biosynthesis, secretion, and clearance: Connecting the far ends. Blood 2015, 125, 2019–2028. [Google Scholar] [CrossRef]
- Rodeghiero, F.; Castaman, G.; Dini, E. Epidemiological investigation of the prevalence of von Willebrand’s disease. Blood 1987, 69, 454–459. [Google Scholar] [CrossRef]
- Dayananda, K.M.; Singh, I.; Mondal, N.; Neelamegham, S. von Willebrand factor self-association on platelet GpIbalpha under hydrodynamic shear: Effect on shear-induced platelet activation. Blood 2010, 116, 3990–3998. [Google Scholar] [CrossRef] [PubMed]
- Crawley, J.T.; de Groot, R.; Xiang, Y.; Luken, B.M.; Lane, D.A. Unraveling the scissile bond: How ADAMTS13 recognizes and cleaves von Willebrand factor. Blood 2011, 118, 3212–3221. [Google Scholar] [CrossRef] [PubMed]
- Torisu, T.; Torisu, K.; Lee, I.H.; Liu, J.; Malide, D.; Combs, C.A.; Wu, X.S.; Rovira, I.I.; Fergusson, M.M.; Weigert, R.; et al. Autophagy regulates endothelial cell processing, maturation and secretion of von Willebrand factor. Nat. Med. 2013, 19, 1281–1287. [Google Scholar] [CrossRef]
- Mocroft, A.; Reiss, P.; Gasiorowski, J.; Ledergerber, B.; Kowalska, J.; Chiesi, A.; Gatell, J.; Rakhmanova, A.; Johnson, M.; Kirk, O.; et al. Serious fatal and nonfatal non-AIDS-defining illnesses in Europe. J. Acquir. Immune. Defic. Syndr. 2010, 55, 262–270. [Google Scholar] [CrossRef] [PubMed]
- Freiberg, M.S.; Chang, C.C.; Kuller, L.H.; Skanderson, M.; Lowy, E.; Kraemer, K.L.; Butt, A.A.; Bidwell Goetz, M.; Leaf, D.; Oursler, K.A.; et al. HIV infection and the risk of acute myocardial infarction. JAMA Int. Med. 2013, 173, 614–622. [Google Scholar] [CrossRef] [PubMed]
- Bibas, M.; Biava, G.; Antinori, A. HIV-Associated Venous Thromboembolism. Mediterr. J. Hematol. Infect. Dis. 2011, 3, e2011030. [Google Scholar] [CrossRef] [PubMed]
- Baker, J.V. Chronic HIV disease and activation of the coagulation system. Thromb. Res. 2013, 132, 495–499. [Google Scholar] [CrossRef]
- Van den Dries, L.W.; Gruters, R.A.; Hövels-van der Borden, S.B.; Kruip, M.J.; de Maat, M.P.; van Gorp, E.C.; van der Ende, M.E. von Willebrand Factor is elevated in HIV patients with a history of thrombosis. Front. Microbiol. 2015, 6, 180. [Google Scholar] [CrossRef]
- Funderburg, N.T. Markers of coagulation and inflammation often remain elevated in ART-treated HIV-infected patients. Curr. Opin. HIV AIDS 2014, 9, 80–86. [Google Scholar] [CrossRef]
- Mazzuca, P.; Caruso, A.; Caccuri, F. HIV-1 infection, microenvironment and endothelial cell dysfunction. New Microbiol. 2016, 39, 163–173. [Google Scholar]
- Fiorentini, S.; Riboldi, E.; Facchetti, F.; Avolio, M.; Fabbri, M.; Tosti, G.; Becker, P.D.; Guzman, C.A.; Sozzani, S.; Caruso, A. HIV-1 matrix protein p17 induces human plasmacytoid dendritic cells to acquire a migratory immature cell phenotype. Proc. Natl. Acad. Sci. USA 2008, 105, 3867–3872. [Google Scholar] [CrossRef] [PubMed]
- Wiley, E.L.; Nightingale, S.D. Opportunistic events and p17 expression in the bone marrow of human immunodeficiency virus-infected patients. J. Infect. Dis. 1994, 169, 617–620. [Google Scholar] [CrossRef] [PubMed]
- Fiorentini, S.; Marini, E.; Caracciolo, S.; Caruso, A. Functions of the HIV-1 matrix protein p17. New Microbiol. 2006, 29, 1–10. [Google Scholar] [PubMed]
- Zeinolabediny, Y.; Caccuri, F.; Colombo, L.; Morelli, F.; Romeo, M.; Rossi, A.; Schiarea, S.; Ciaramelli, C.; Airoldi, C.; Weston, R.; et al. HIV-1 matrix protein p17 misfolding forms toxic amyloidogenic assemblies that induce neurocognitive disorders. Sci. Rep. 2017, 7, 10313. [Google Scholar] [CrossRef]
- Popovic, M.; Tenner-Racz, K.; Pelser, C.; Stellbrink, H.J.; van Lunzen, J.; Lewis, G.; Kalyanaraman, V.S.; Gallo, R.C.; Racz, P. Persistence of HIV-1 structural proteins and glycoproteins in lymph nodes of patients under highly active antiretroviral therapy. Proc. Natl. Acad. Sci. USA 2005, 102, 14807–14812. [Google Scholar] [CrossRef]
- Caccuri, F.; Giagulli, C.; Bugatti, A.; Benetti, A.; Alessandri, G.; Ribatti, D.; Marsico, S.; Apostoli, P.; Slevin, M.A.; Rusnati, M.; et al. HIV-1 matrix protein p17 promotes angiogenesis via chemokine receptors CXCR1 and CXCR2. Proc. Natl. Acad. Sci. USA 2012, 109, 14580–14585. [Google Scholar] [CrossRef]
- Pace, M.J.; Graf, E.H.; Agosto, L.M.; Mexas, A.M.; Male, F.; Brady, T.; Bushman, F.D.; O’Doherty, U. Directly infected resting CD4+T cells can produce HIV Gag without spreading infection in a model of HIV latency. PLoS Pathog. 2012, 8, e1002818. [Google Scholar] [CrossRef]
- Caccuri, F.; Iaria, M.L.; Campilongo, F.; Varney, K.; Rossi, A.; Mitola, S.; Schiarea, S.; Bugatti, A.; Mazzuca, P.; Giagulli, C.; et al. Cellular aspartyl proteases promote the unconventional secretion of biologically active HIV-1 matrix protein p17. Sci. Rep. 2016, 6, 38027. [Google Scholar] [CrossRef]
- De Francesco, M.A.; Baronio, M.; Fiorentini, S.; Signorini, C.; Bonfanti, C.; Poiesi, C.; Popovic, M.; Grassi, M.; Garrafa, E.; Bozzo, L.; et al. HIV-1 matrix protein p17 increases the production of proinflammatory cytokines and counteracts IL-4 activity by binding to a cellular receptor. Proc. Natl. Acad. Sci. USA 2002, 99, 9972–9977. [Google Scholar] [CrossRef]
- Vitale, M.; Caruso, A.; De Francesco, M.A.; Rodella, L.; Bozzo, L.; Garrafa, E.; Grassi, M.; Gobbi, G.; Cacchioli, A.; Fiorentini, S. HIV-1 matrix protein p17 enhances the proliferative activity of natural killer cells and increases their ability to secrete proinflammatory cytokines. Br. J. Haematol. 2003, 120, 337–343. [Google Scholar] [CrossRef]
- Marini, E.; Tiberio, L.; Caracciolo, S.; Tosti, G.; Guzman, C.A.; Schiaffonati, L.; Fiorentini, S.; Caruso, A. HIV-1 matrix protein p17 binds to monocytes and selectively stimulates MCP-1 secretion: Role of transcriptional factor AP-1. Cell. Microbiol. 2008, 10, 655–666. [Google Scholar] [CrossRef] [PubMed]
- Caccuri, F.; Rueckert, C.; Giagulli, C.; Schulze, K.; Basta, D.; Zicari, S.; Marsico, S.; Cervi, E.; Fiorentini, S.; Slevin, M.; et al. HIV-1 matrix protein p17 promotes lymphangiogenesis and activates the endothelin-1/endothelin B receptor axis. Arterioscler. Thromb. Vasc. Biol. 2014, 34, 846–856. [Google Scholar] [CrossRef] [PubMed]
- Mazzuca, P.; Marsico, S.; Schulze, K.; Mitola, S.; Pils, M.C.; Giagulli, C.; Guzman, C.A.; Caruso, A.; Caccuri, F. Role of Autophagy in HIV-1 Matrix Protein p17-Driven Lymphangiogenesis. J. Virol. 2017, 91, e00801–e00817. [Google Scholar] [CrossRef] [PubMed]
- Wu, Y.T.; Tan, H.L.; Shui, G.; Bauvy, C.; Huang, Q.; Wenk, M.R.; Ong, C.N.; Codogno, P.; Shen, H.M. Dual role of 3-methyladenine in modulation of autophagy via different temporal patterns of inhibition on class I and III phosphoinositide 3-kinase. J. Biol. Chem. 2010, 285, 10850–10861. [Google Scholar] [CrossRef] [PubMed]
- Liang, X.H.; Jackson, S.; Seaman, M.; Brown, K.; Kempkes, B.; Hibshoosh, H.; Levine, B. Induction of autophagy and inhibition of tumorigenesis by beclin 1. Nature 1999, 402, 672–676. [Google Scholar] [CrossRef]
- Malhotra, V. Unconventional protein secretion: An evolving mechanism. EMBO J. 2013, 32, 1660–1664. [Google Scholar] [CrossRef]
- Bilanges, B.; Posor, Y.; Vanhaesebroeck, B. PI3K isoforms in cell signaling and vesicle trafficking. Nat. Rev. 2019, 20, 515–534. [Google Scholar] [CrossRef]
- Yu, X.; Long, Y.C.; Shen, H.-M. Differential regulatory functions of three classes of phosphatidylinositol and phosphoinositide 3-kinase in autophagy. Autophagy 2015, 10, 1711–1728. [Google Scholar] [CrossRef]
- Axe, E.L.; Walker, S.A.; Manifava, M.; Chandra, P.; Roderick, H.L.; Habermann, A.; Griffiths, G.; Kristakis, N.T. Autophagosome formation from membrane compartments enriched in phosphatidylinositol 3-phosphate and dynamically connected in the endoplasmic reticulum. J. Cell. Biol. 2008, 182, 685–701. [Google Scholar] [CrossRef]
- Blummaart, E.F.; Krause, U.; Schellens, J.P.; Vreeling-Sindelarova, H.; Meijer, A.J. The phosphatidylinositol 3-kinase inhibitors wortmannin and LY294002 inhibit autophagy in isolated rat hepatocytes. Eur. J. Biochem. 1997, 243, 240–246. [Google Scholar] [CrossRef]
- Sirois, I.; Groleau, J.; Pallet, N.; Brassard, N.; Hamelin, K.; Londono, I.; Pshezhetsky, A.V.; Bendayan, M.; Hébert, M.J. Caspase activation regulates the extracellular export of autophagic vacuoles. Autophagy 2012, 8, 927–937. [Google Scholar] [CrossRef] [PubMed]
- Pallet, N.; Sirois, I.; Bell, C.; Hanafi, L.A.; Hamelin, K.; Dieudé, M.; Rondeau, C.; Thibault, P.; Desjardins, M.; Hebert, M.J. A comprehensive characterization of membrane vesicles released by autophagic human endothelial cells. Proteomics 2013, 13, 1108–1120. [Google Scholar] [CrossRef] [PubMed]
- Yoshioka, K.; Yoshida, K.; Cui, H.; Wakayama, T.; Takuwa, N.; Okamoto, Y.; Du, W.; Qi, X.; Asanuma, K.; Sugihara, K.; et al. Endothelial PI3K-C2α, a class II PI3K, has an essential role in angiogenesis and vascular barrier function. Nat. Med. 2012, 18, 1560–1569. [Google Scholar] [CrossRef] [PubMed]
- Boisclair, M.; Ireland, H.; Lane, D. Assessment of hypercoagulable states by measurement of activation fragments and peptides. Blood Rev. 1990, 4, 25–40. [Google Scholar] [CrossRef]
- Seitz, R.; Egbring, R.; Wagner, C.; Dati, F. Thrombin-antithrombin III complex (TAT): A marker for activation of intravascular coagulation. Internist 1990, 31, 69–74. [Google Scholar]
- Kario, K.; Matsuo, T.; Kodama, K.; Matsuo, M.; Yamamoto, K.; Kobayashi, H. Imbalance between thrombin and plasmin activity in disseminated intravascular coagulation. Assessment by the thrombin–antithrombin-III complex/plasmin–a2-antiplasmin complex ratio. Haemostasis 1992, 22, 179–186. [Google Scholar]
- Hoppensteadt, D.; Tsuruta, K.; Cunanan, J.; Hirman, J.; Kaul, I.; Osawa, Y.; Fareed, J. Thrombin generation mediators and markers in sepsis-associated coagulopathy and their modulation by recombinant thrombomodulin. Clin. Appl. Thromb. Hemost. 2014, 20, 129–135. [Google Scholar] [CrossRef]
- Mei, H.; Jiang, Y.; Luo, L.; Huang, R.; Su, L.; Hou, M.; Wang, X.; Deng, J.; Hu, Y. Evaluation the combined diagnostic value of TAT, PIC, tPAIC and sTM in disseminated intravascular coagulation: A multi-center prospective observational study. Thromb. Res. 2019, 173, 20–26. [Google Scholar] [CrossRef]
- Nakano, H.; Ushio, H. An unexpected role for autophagy in degranulation of mast cells. Autophagy 2011, 7, 657–659. [Google Scholar] [CrossRef]
- DeSelm, C.J.; Miller, B.C.; Zou, W.; Beatty, W.L.; van Meel, E.; Takahata, Y.; Klumperman, J.; Tooze, S.A.; Teitelbaum, S.L.; Virgin, H.W. Autophagy proteins regulate the secretory component of osteoclastic bone resorption. Dev. Cell. 2011, 21, 966–974. [Google Scholar] [CrossRef]
- Sullivan, P.S.; Dworkin, M.S.; Jones, J.L.; Hooper, W.C. Epidemiology of thrombosis inHIV-infected individuals. The adult/adolescent spectrum of HIV disease project. AIDS 2000, 14, 321–324. [Google Scholar] [CrossRef] [PubMed]
- Malek, J.; Rogers, R.; Kufera, J.; Hirshon, J.M. Venous thromboembolic disease in theHIV-infected patient. Am. J. Emerg. Med. 2011, 29, 278–282. [Google Scholar] [CrossRef] [PubMed]
- Hatano, H.; Delwart, E.L.; Norris, P.J.; Lee, T.H.; Neilands, T.B.; Kelley, C.F.; Hunt, P.W.; Hoh, R.; Linnen, J.M.; Martin, J.N.; et al. Evidence of persistent low-level viremia in long-term HAART-suppressed, HIV-infected individuals. AIDS 2010, 24, 2535–2539. [Google Scholar] [CrossRef] [PubMed]
- Hunt, P.W.; Martin, J.N.; Sinclair, E.; Epling, L.; Teague, J.; Jacobson, M.A.; Tracy, R.P.; Corey, L.; Deeks, S.G. Valganciclovir reduces T cell activation in HIV-infected individuals with incomplete CD4+ T cell recovery on antiretroviral therapy. J. Infect. Dis. 2011, 203, 1474–1483. [Google Scholar] [CrossRef] [PubMed]
- Klatt, N.R.; Chomont, N.; Douek, D.C.; Deeks, S.G. Immune activation and HIV persistence: Implications for curative approaches to HIV infection. Immunol. Rev. 2013, 254, 326–342. [Google Scholar] [CrossRef]
- Triant, V.A.; Lee, H.; Hadigan, C.; Grinspoon, S.K. Increased acute myocardial infarction rates and cardiovascular risk factors among patients with human immunodeficiency virus disease. J. Clin. Endocrinol. Metab. 2007, 92, 2506–2512. [Google Scholar] [CrossRef]
- Grinspoon, S.; Carr, A. Cardiovascular risk and body-fat abnormalities in HIV-infected adults. N. Engl. J. Med. 2005, 352, 48–62. [Google Scholar] [CrossRef]
- Caccuri, F.; Ronca, R.; Laimbacher, A.S.; Berenzi, A.; Steimberg, N.; Campilongo, F.; Mazzuca, P.; Giacomini, A.; Mazzoleni, G.; Benetti, A.; et al. U94 of human herpesvirus 6 down-modulates Src, promotes a partial mesenchymal-to-epithelial transition and inhibits tumor cell growth, invasion and metastasis. Oncotarget 2017, 27, 44533–44549. [Google Scholar] [CrossRef][Green Version]


© 2020 by the authors. Licensee MDPI, Basel, Switzerland. This article is an open access article distributed under the terms and conditions of the Creative Commons Attribution (CC BY) license (http://creativecommons.org/licenses/by/4.0/).
Share and Cite
Bugatti, A.; Marsico, S.; Mazzuca, P.; Schulze, K.; Ebensen, T.; Giagulli, C.; Peña, E.; Badimón, L.; Slevin, M.; Caruso, A.; et al. Role of Autophagy in Von Willebrand Factor Secretion by Endothelial Cells and in the In Vivo Thrombin-Antithrombin Complex Formation Promoted by the HIV-1 Matrix Protein p17. Int. J. Mol. Sci. 2020, 21, 2022. https://doi.org/10.3390/ijms21062022
Bugatti A, Marsico S, Mazzuca P, Schulze K, Ebensen T, Giagulli C, Peña E, Badimón L, Slevin M, Caruso A, et al. Role of Autophagy in Von Willebrand Factor Secretion by Endothelial Cells and in the In Vivo Thrombin-Antithrombin Complex Formation Promoted by the HIV-1 Matrix Protein p17. International Journal of Molecular Sciences. 2020; 21(6):2022. https://doi.org/10.3390/ijms21062022
Chicago/Turabian StyleBugatti, Antonella, Stefania Marsico, Pietro Mazzuca, Kai Schulze, Thomas Ebensen, Cinzia Giagulli, Esther Peña, Lina Badimón, Mark Slevin, Arnaldo Caruso, and et al. 2020. "Role of Autophagy in Von Willebrand Factor Secretion by Endothelial Cells and in the In Vivo Thrombin-Antithrombin Complex Formation Promoted by the HIV-1 Matrix Protein p17" International Journal of Molecular Sciences 21, no. 6: 2022. https://doi.org/10.3390/ijms21062022
APA StyleBugatti, A., Marsico, S., Mazzuca, P., Schulze, K., Ebensen, T., Giagulli, C., Peña, E., Badimón, L., Slevin, M., Caruso, A., Guzman, C. A., & Caccuri, F. (2020). Role of Autophagy in Von Willebrand Factor Secretion by Endothelial Cells and in the In Vivo Thrombin-Antithrombin Complex Formation Promoted by the HIV-1 Matrix Protein p17. International Journal of Molecular Sciences, 21(6), 2022. https://doi.org/10.3390/ijms21062022