Mitophagy in the Retinal Pigment Epithelium of Dry Age-Related Macular Degeneration Investigated in the NFE2L2/PGC-1α-/- Mouse Model

 , , ,
, , ,  ,
, 
Abstract
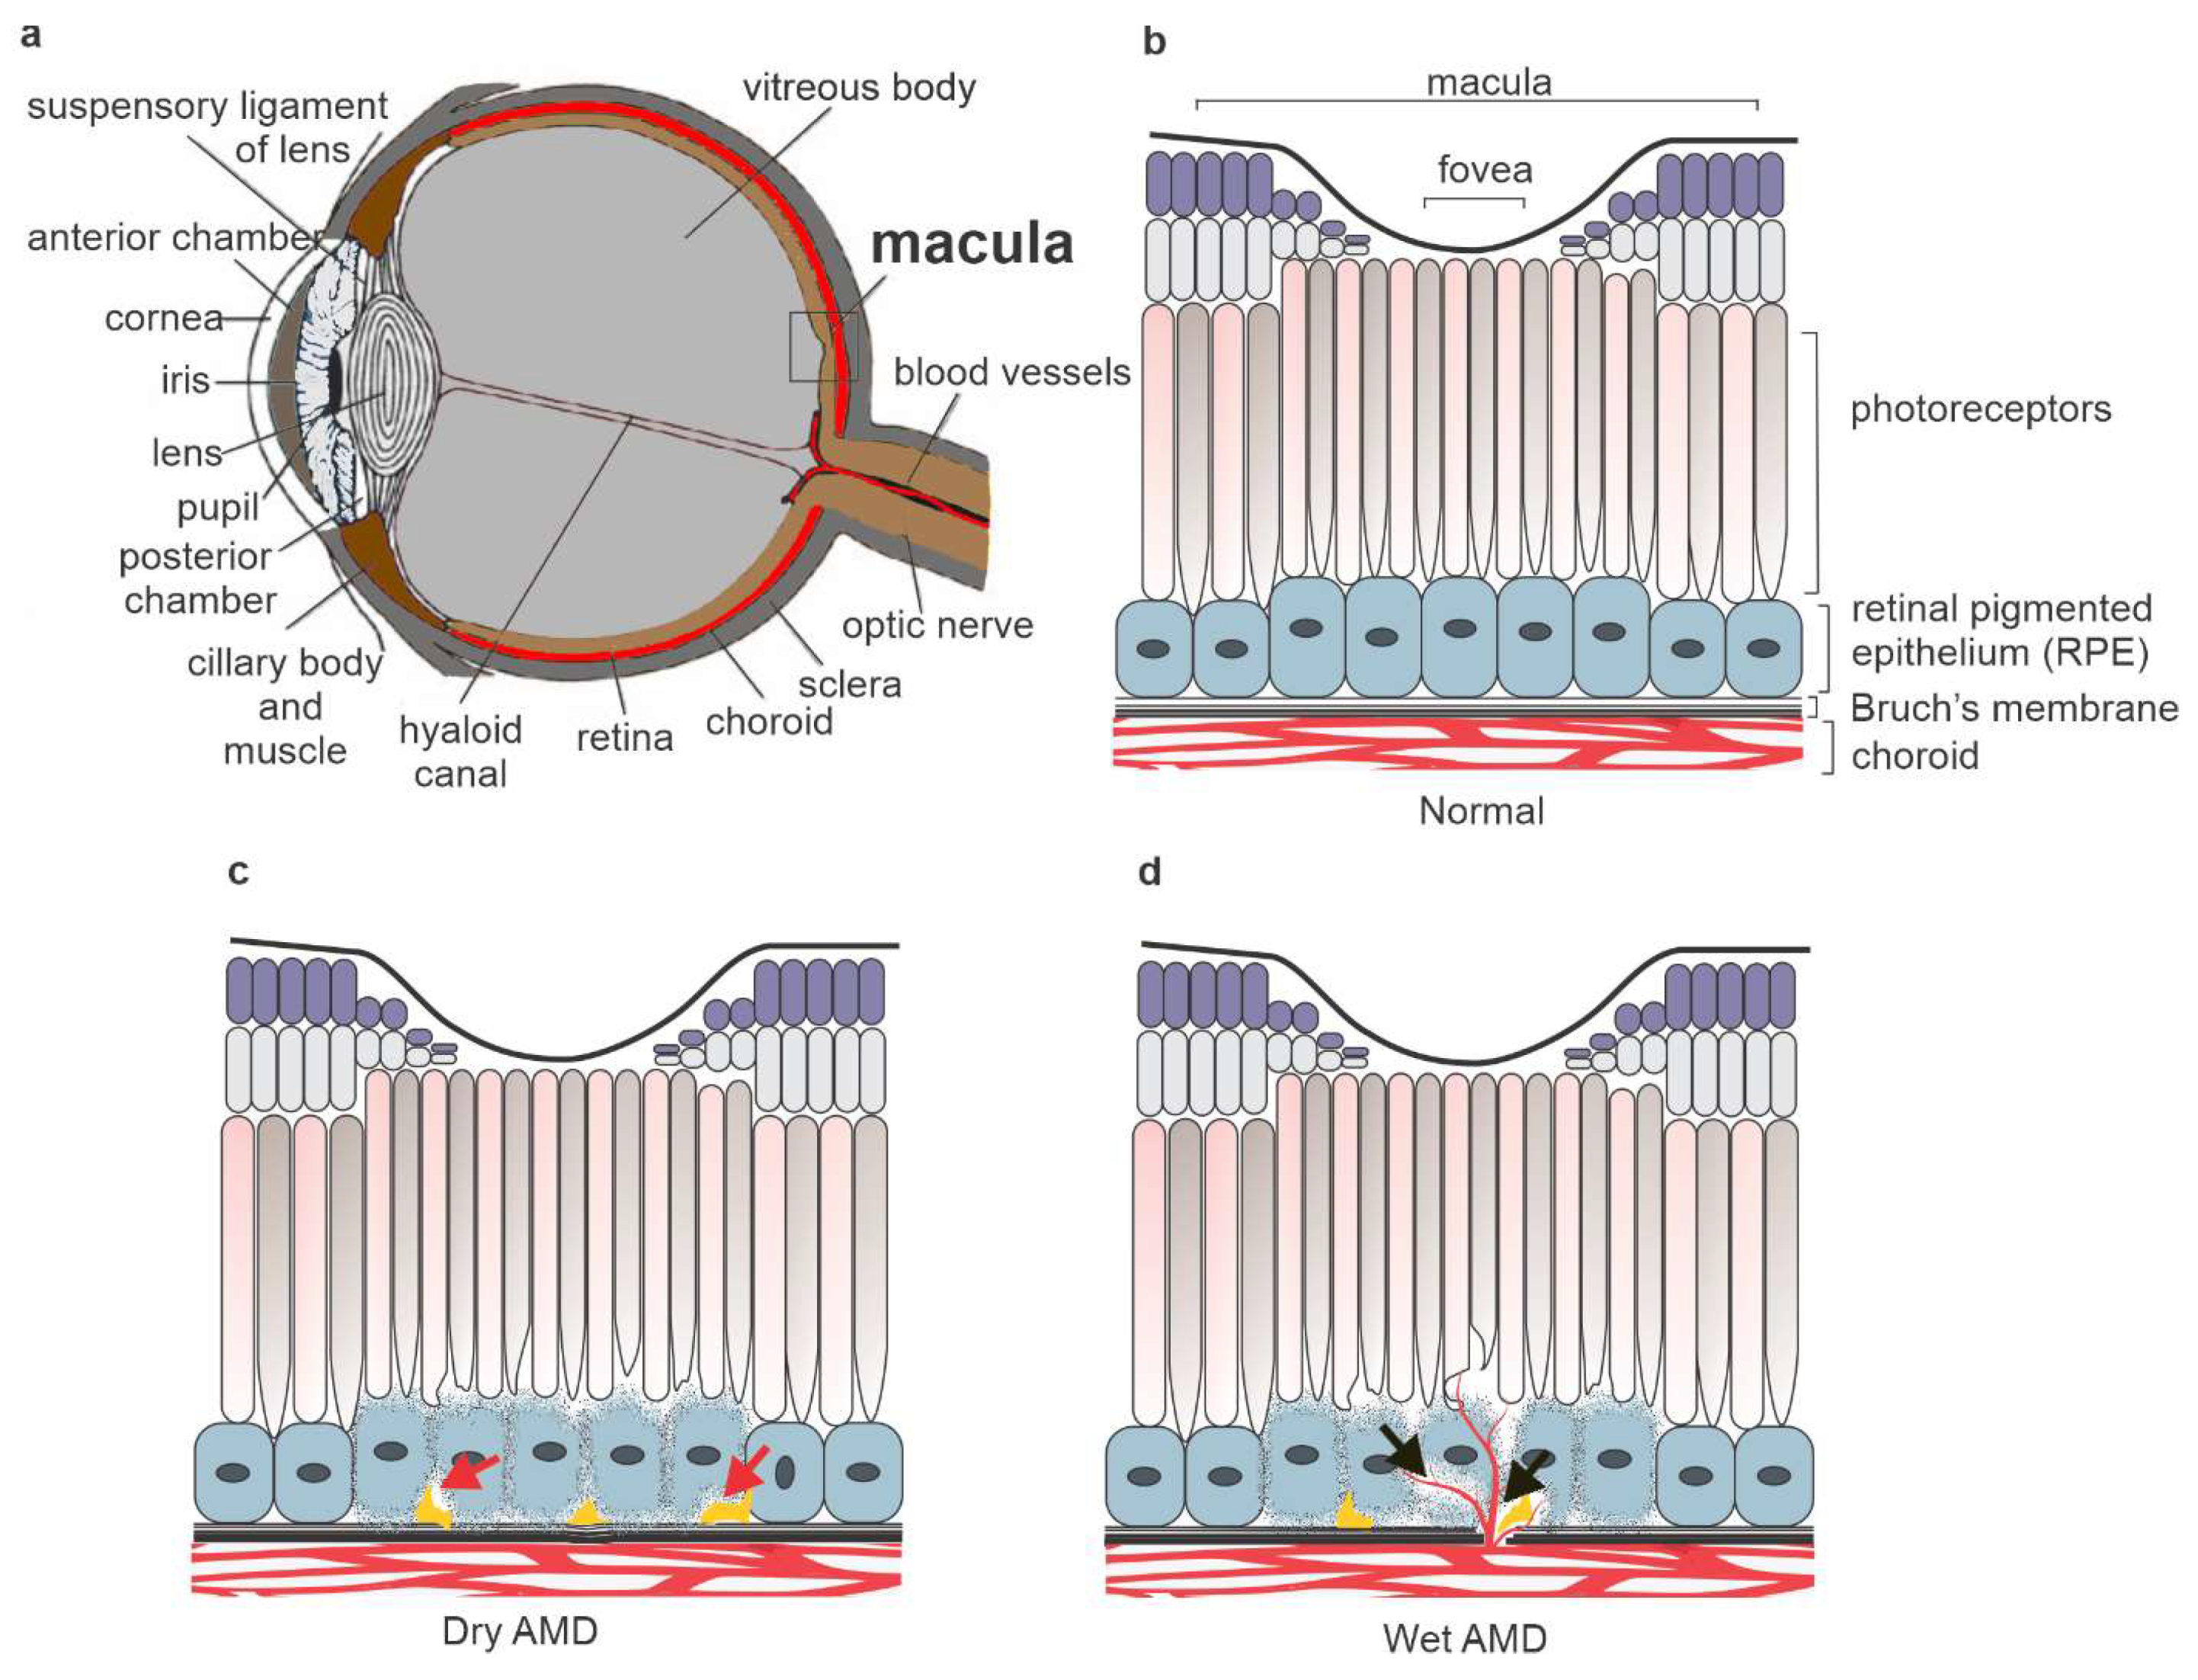
1. Introduction
2. Results
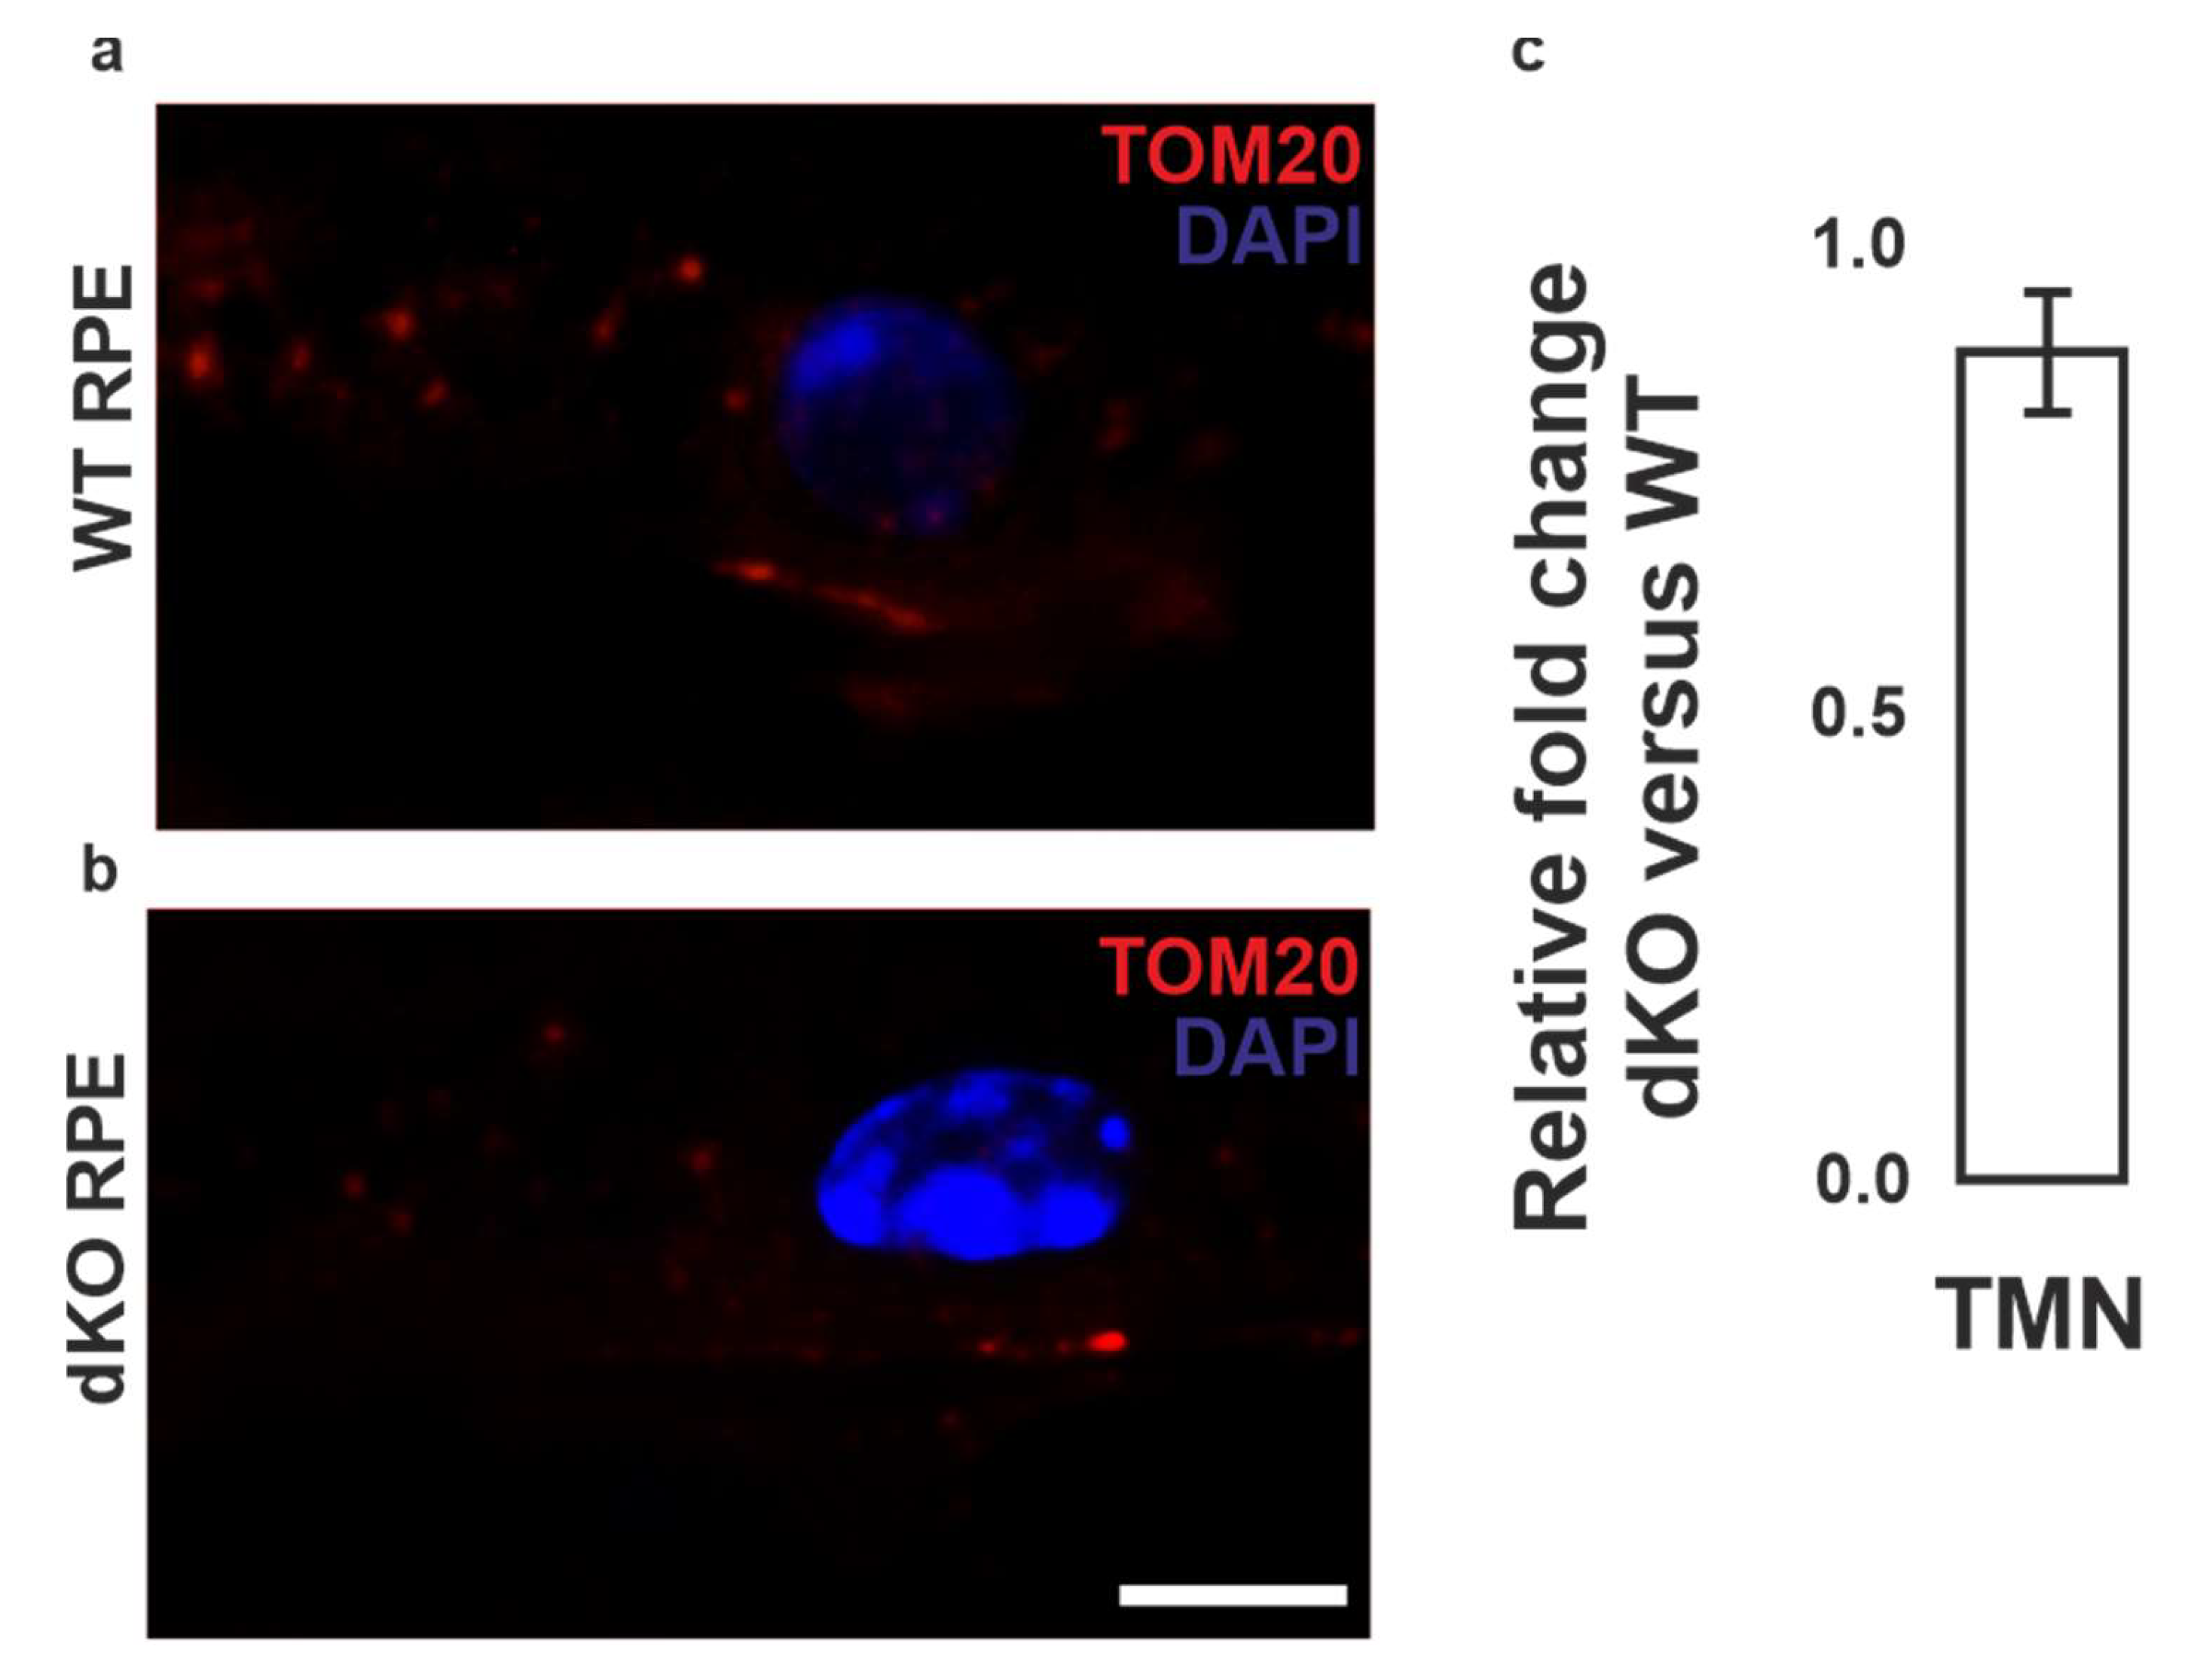
2.1. Mitochondria Validation
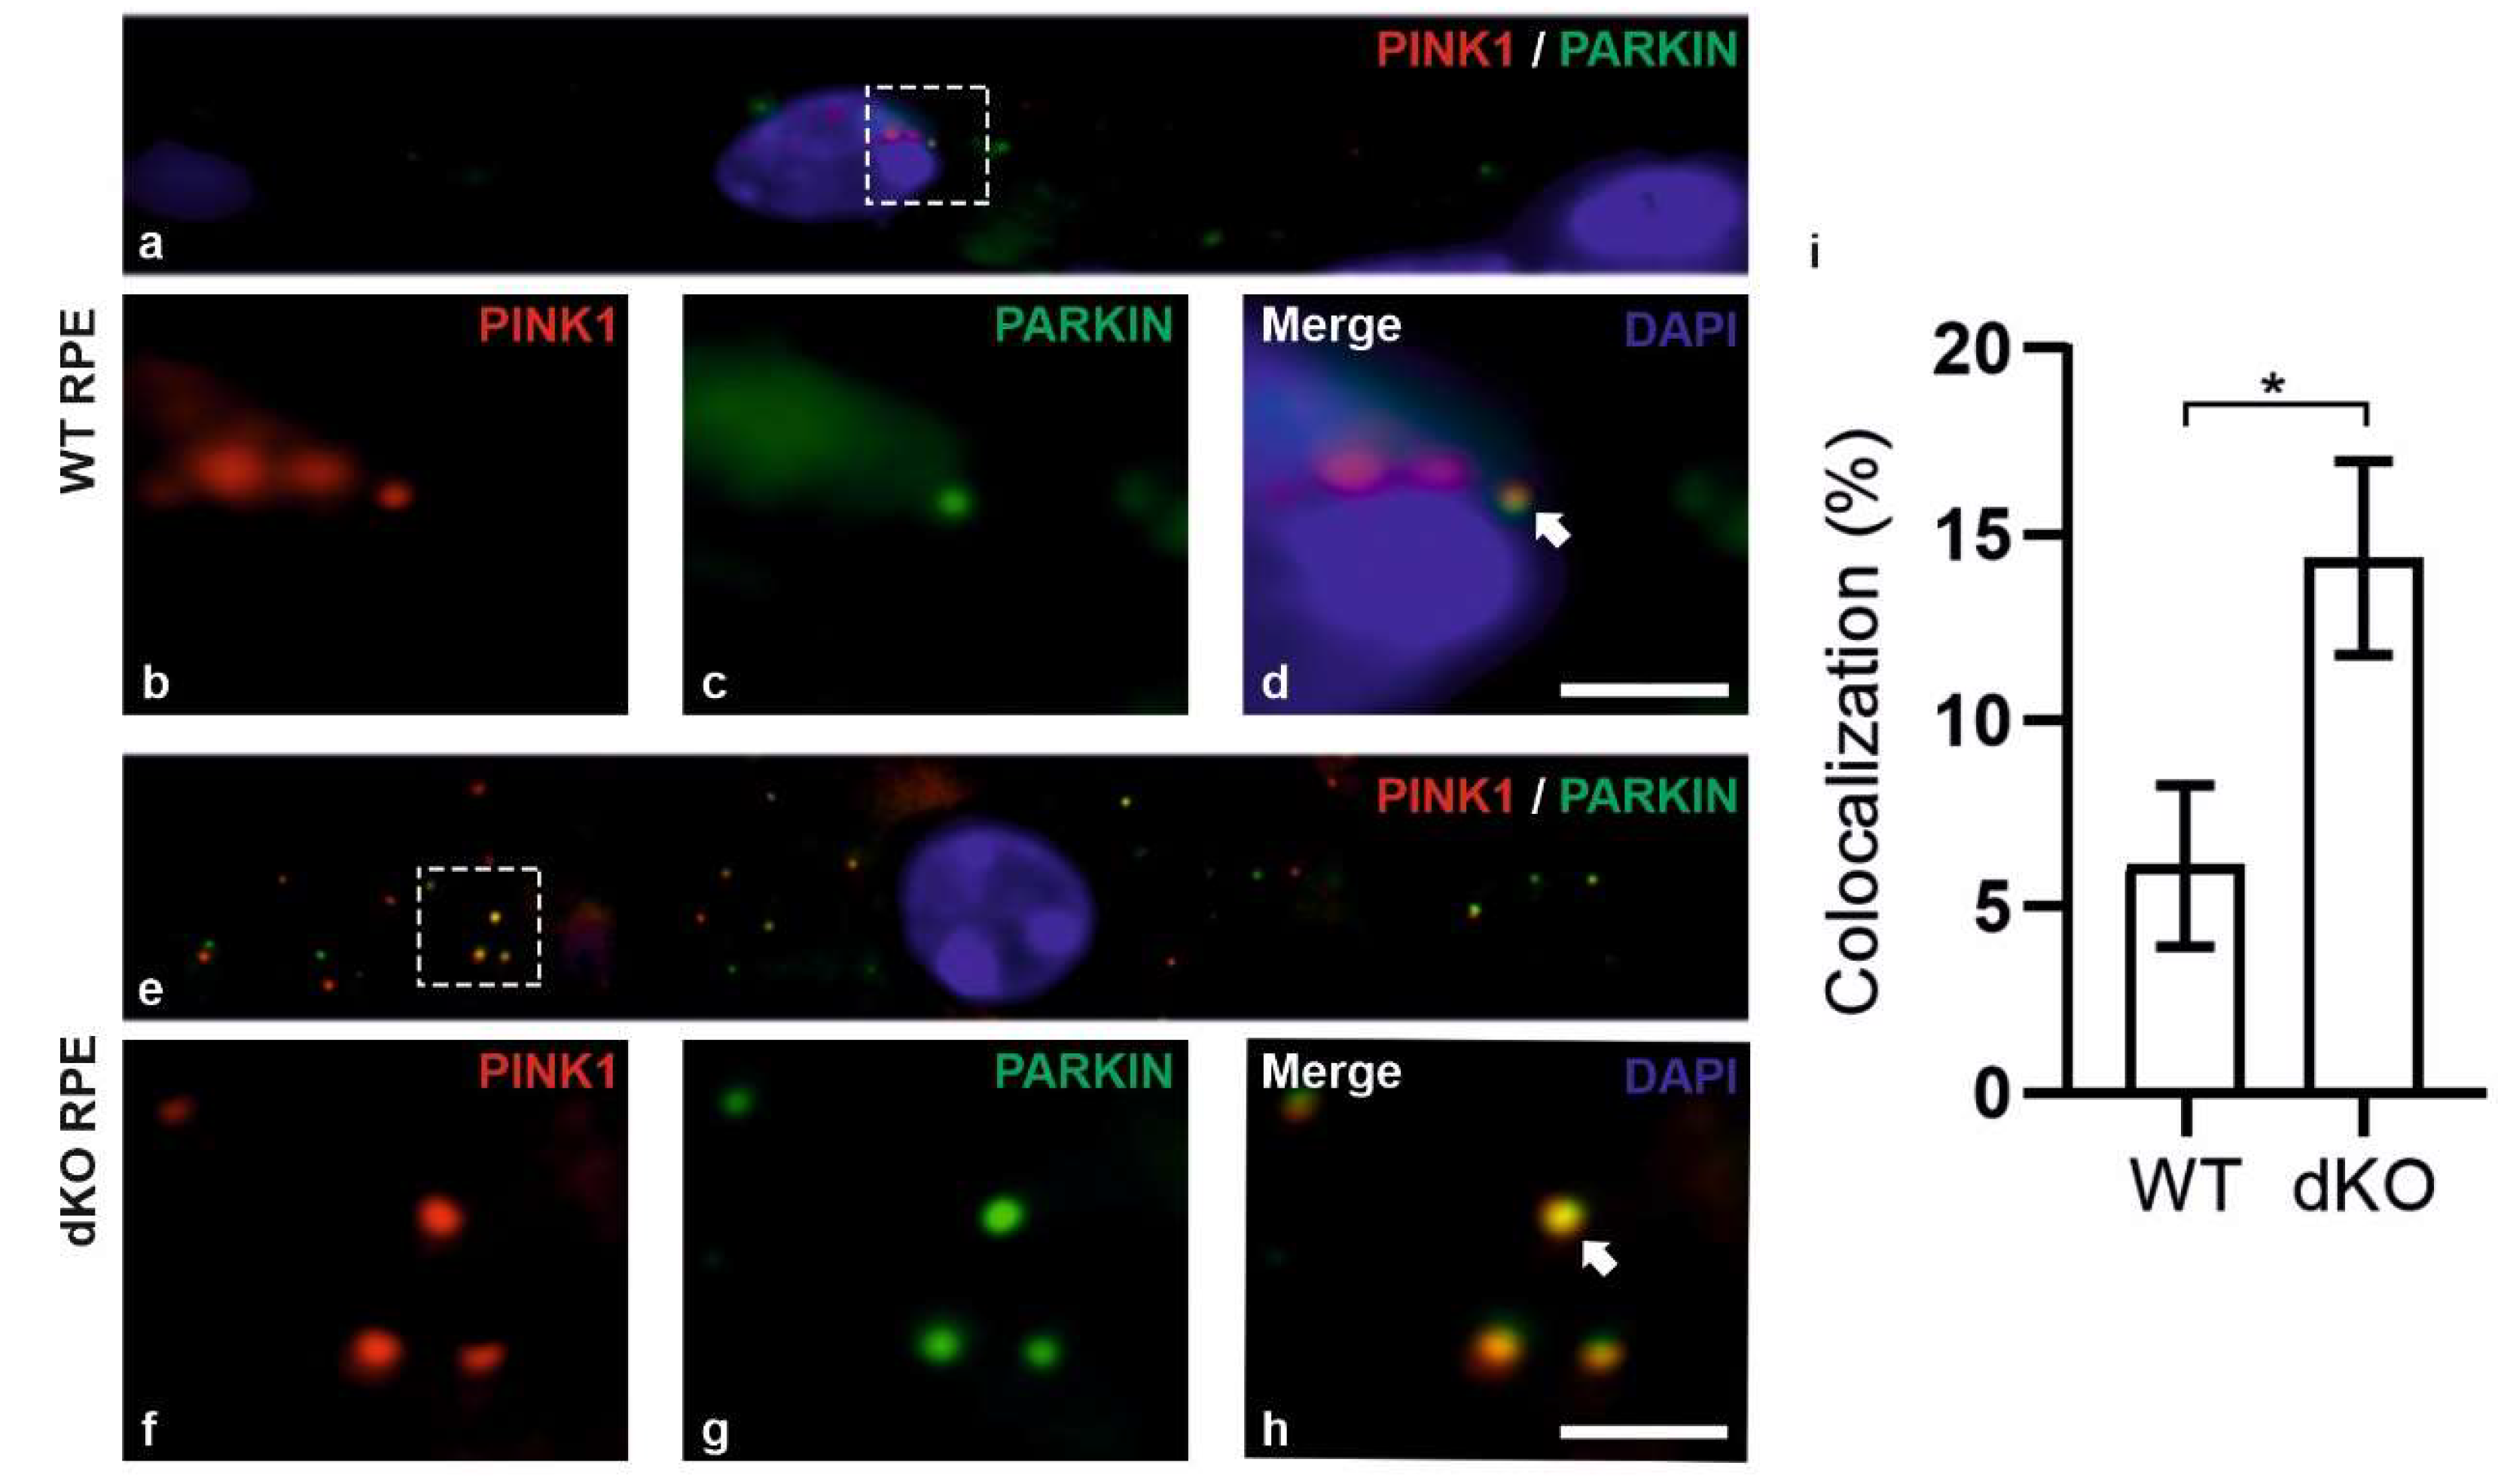
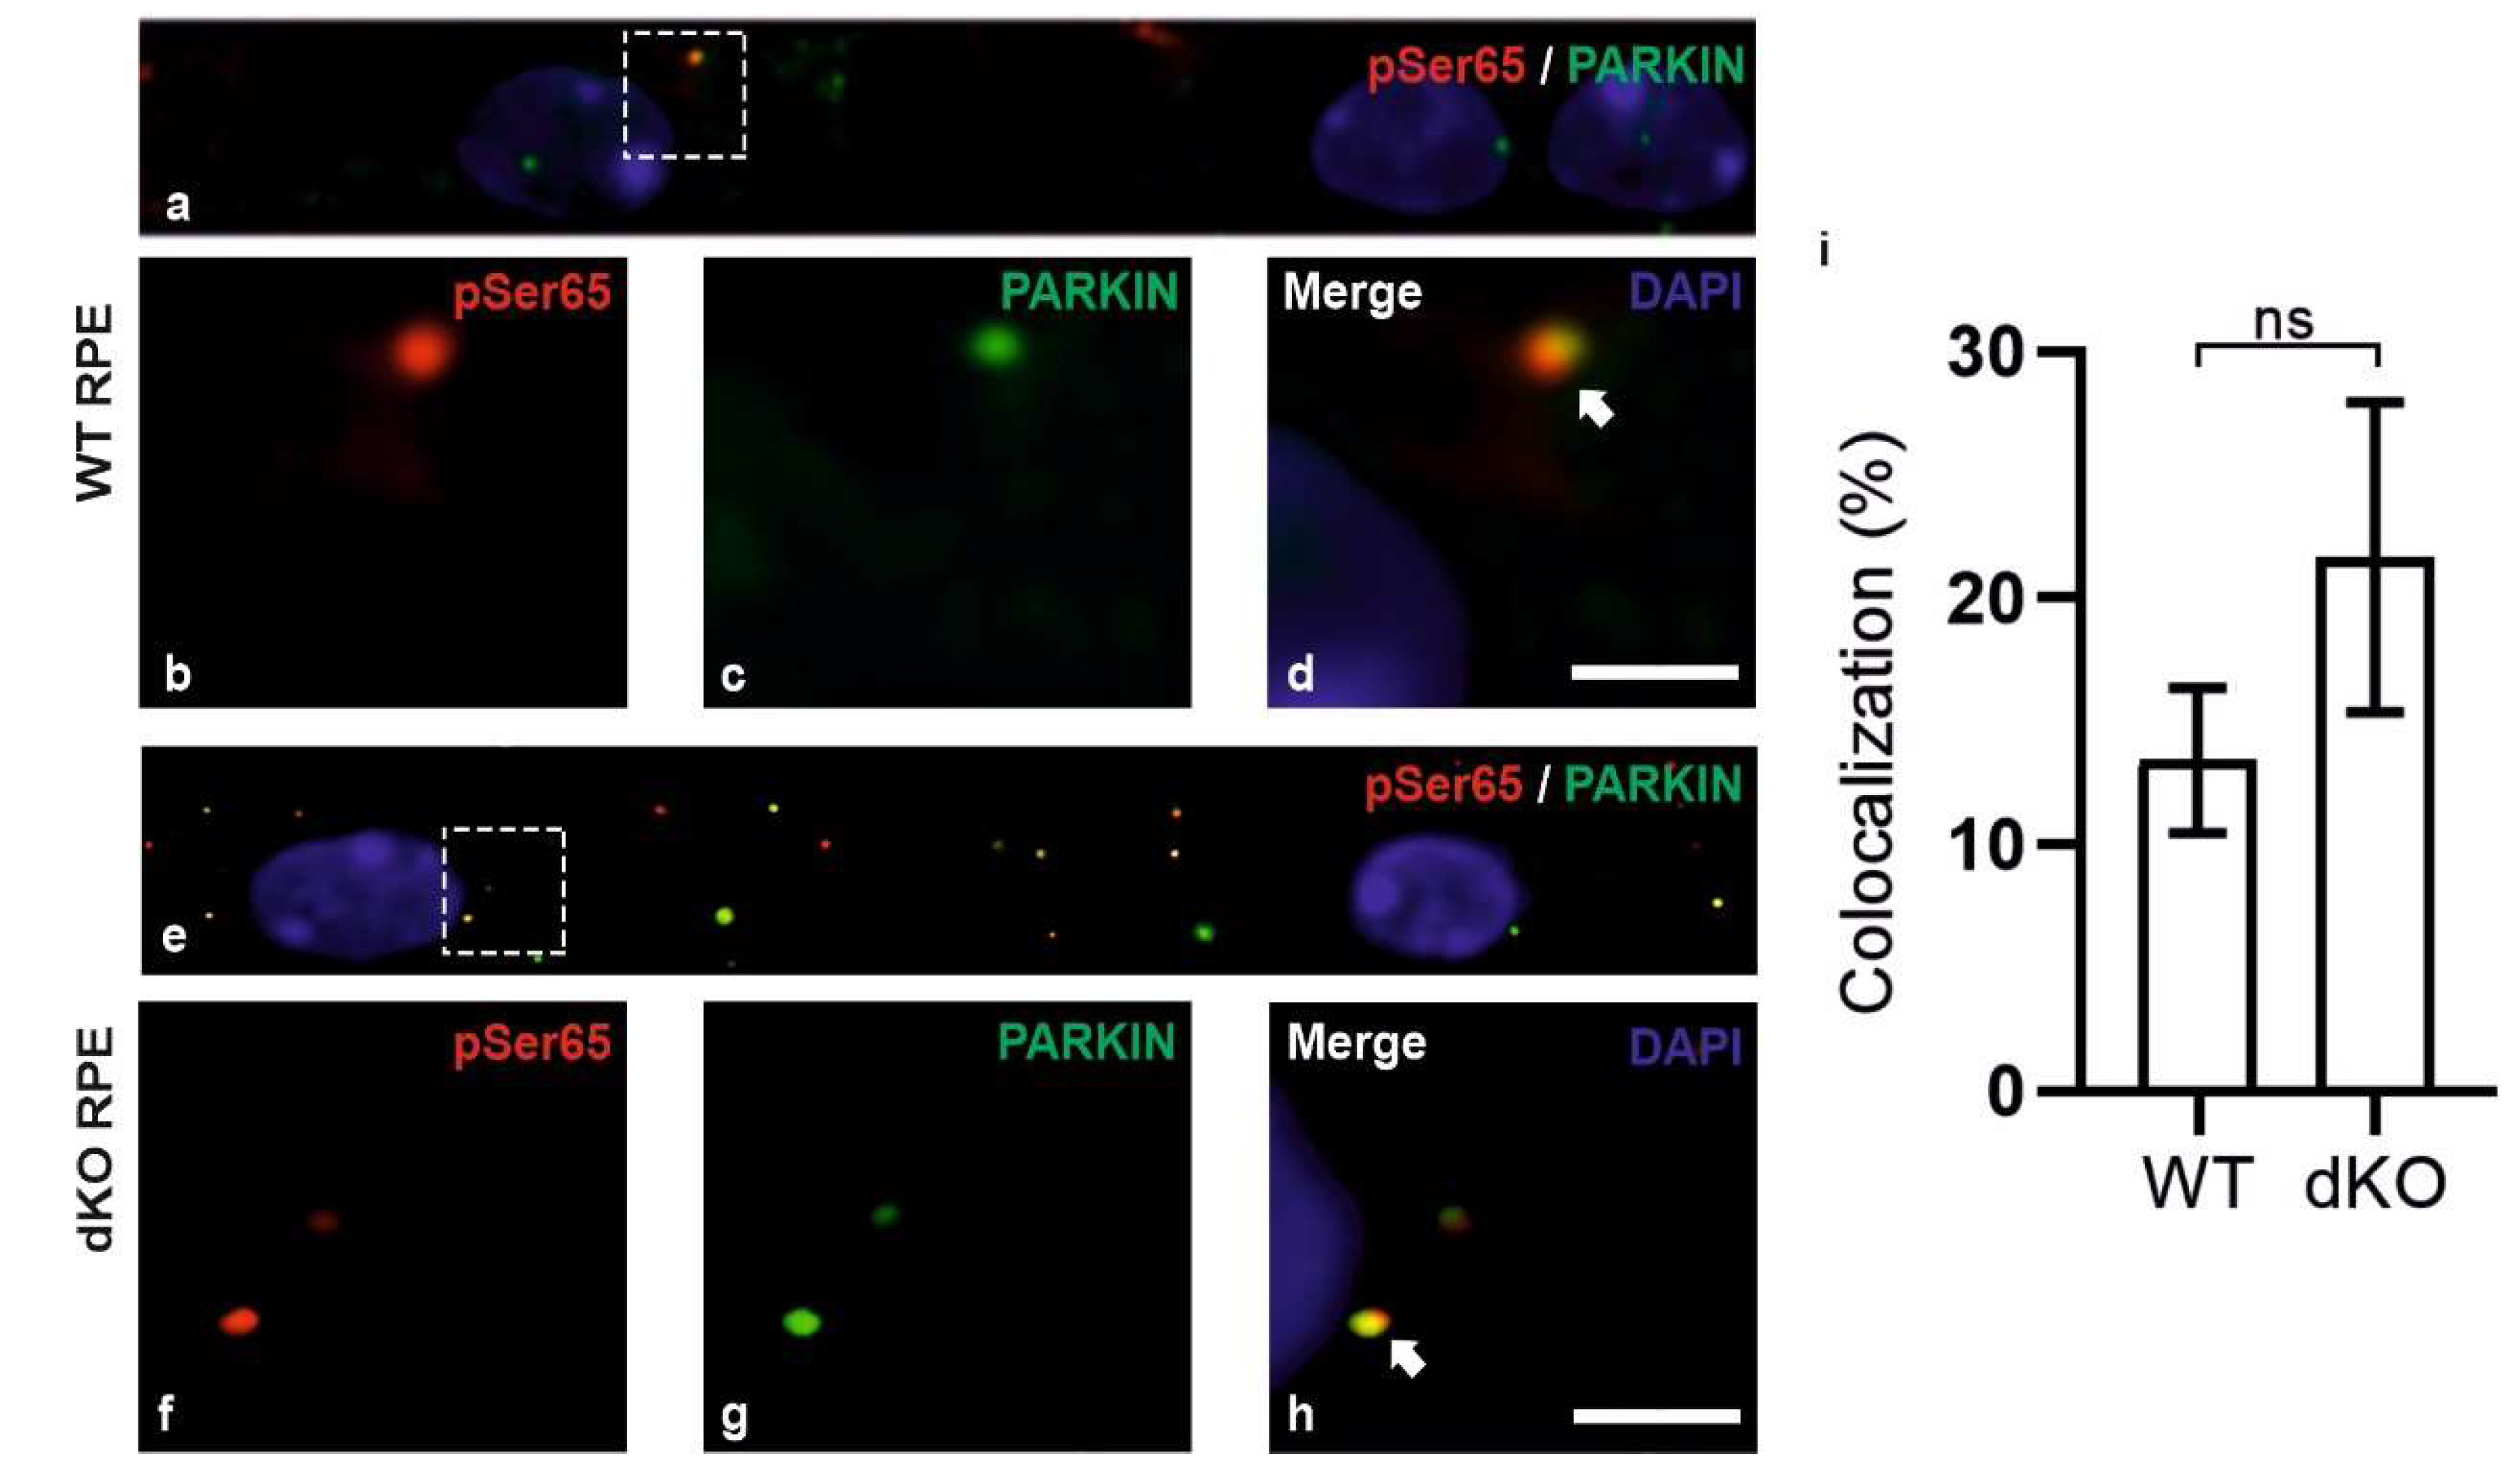
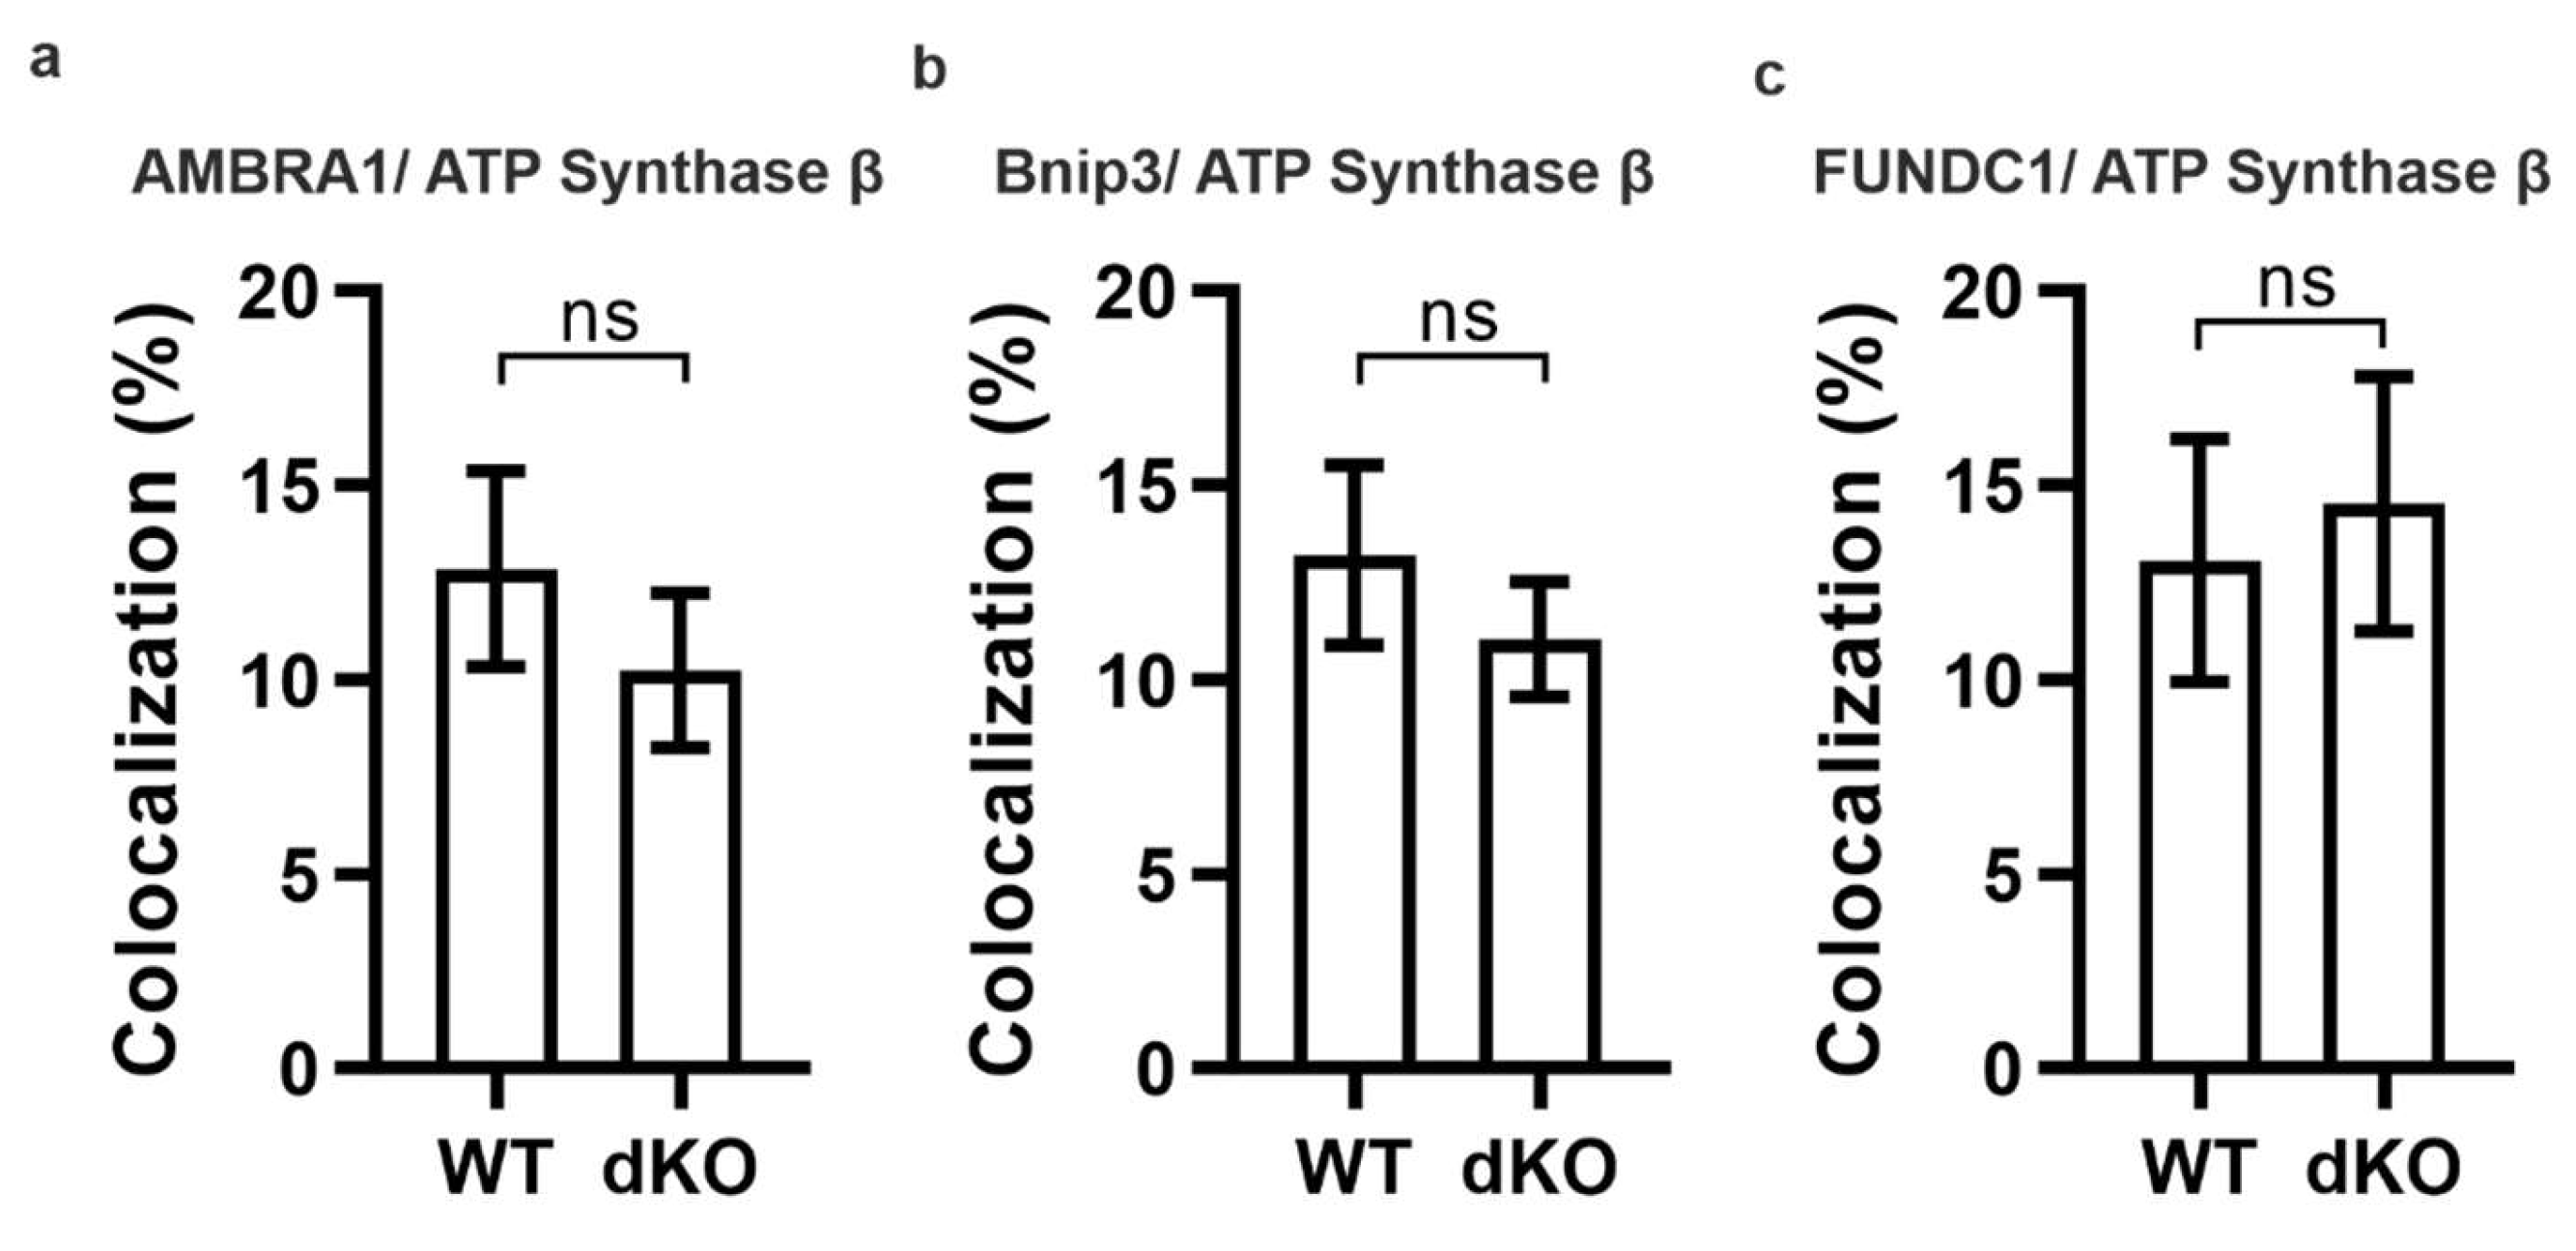
2.2. PINK1/PARKIN in Primary Mitochondrial Quality Control System
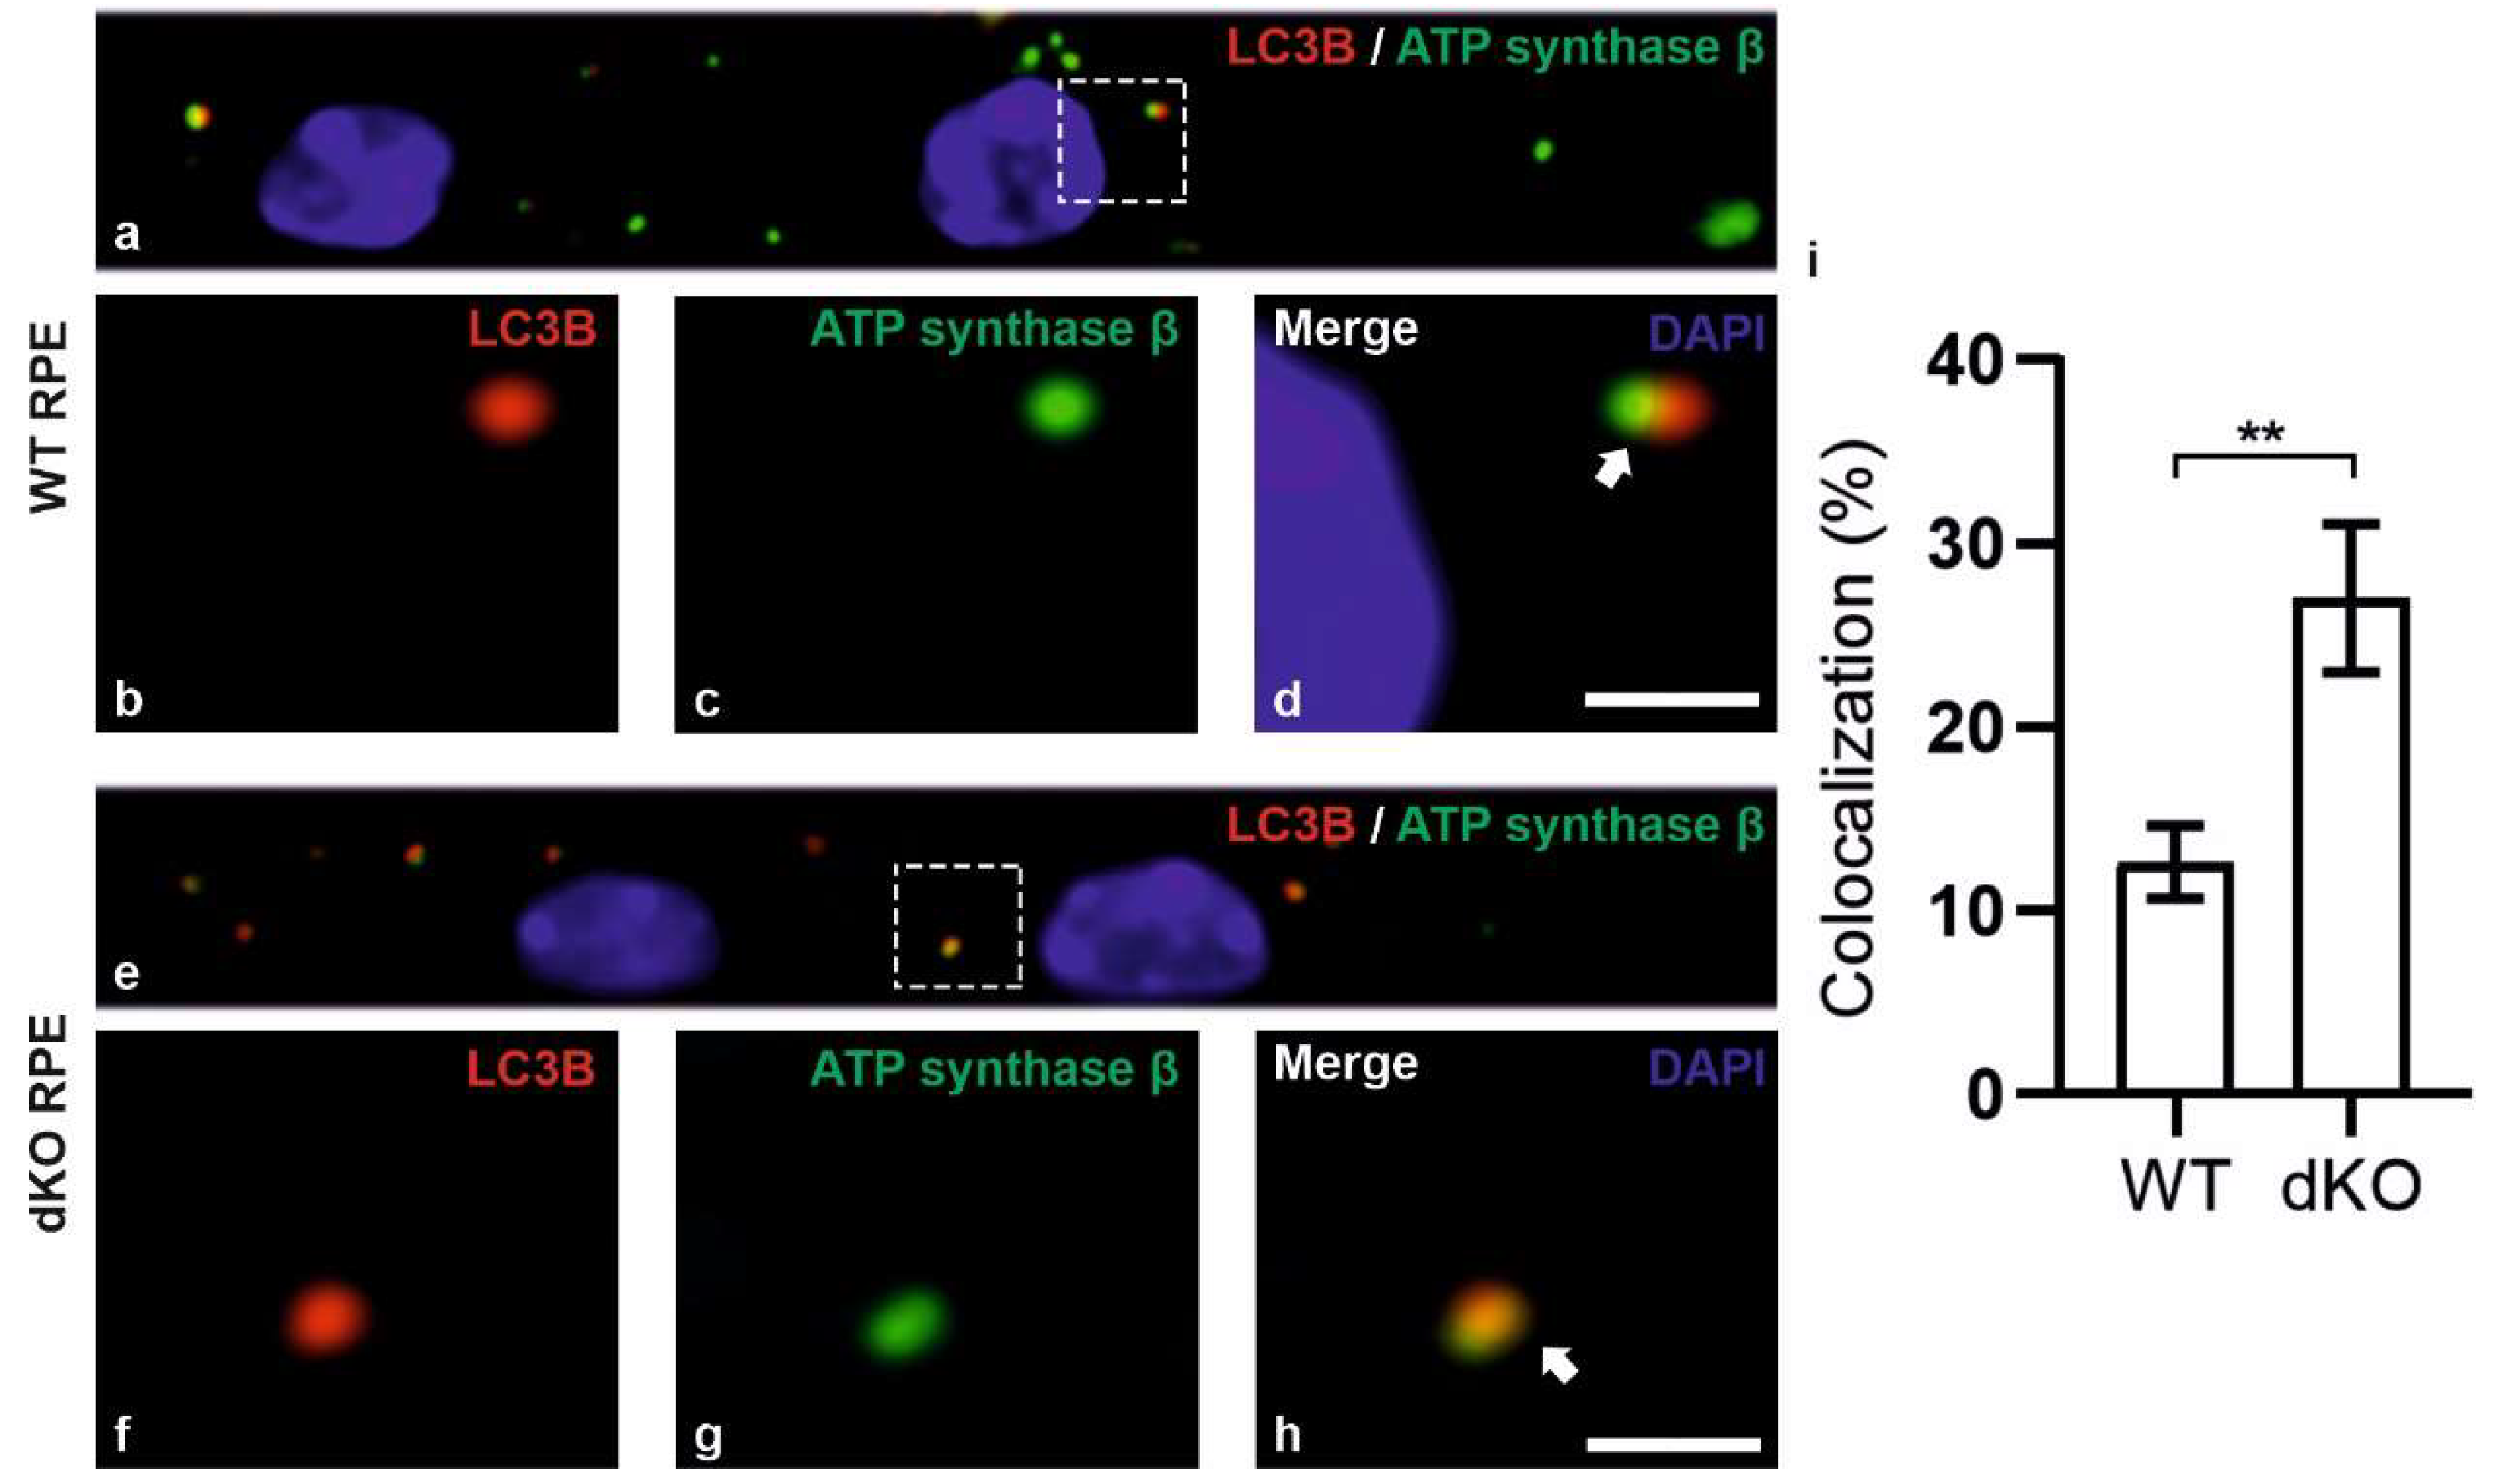
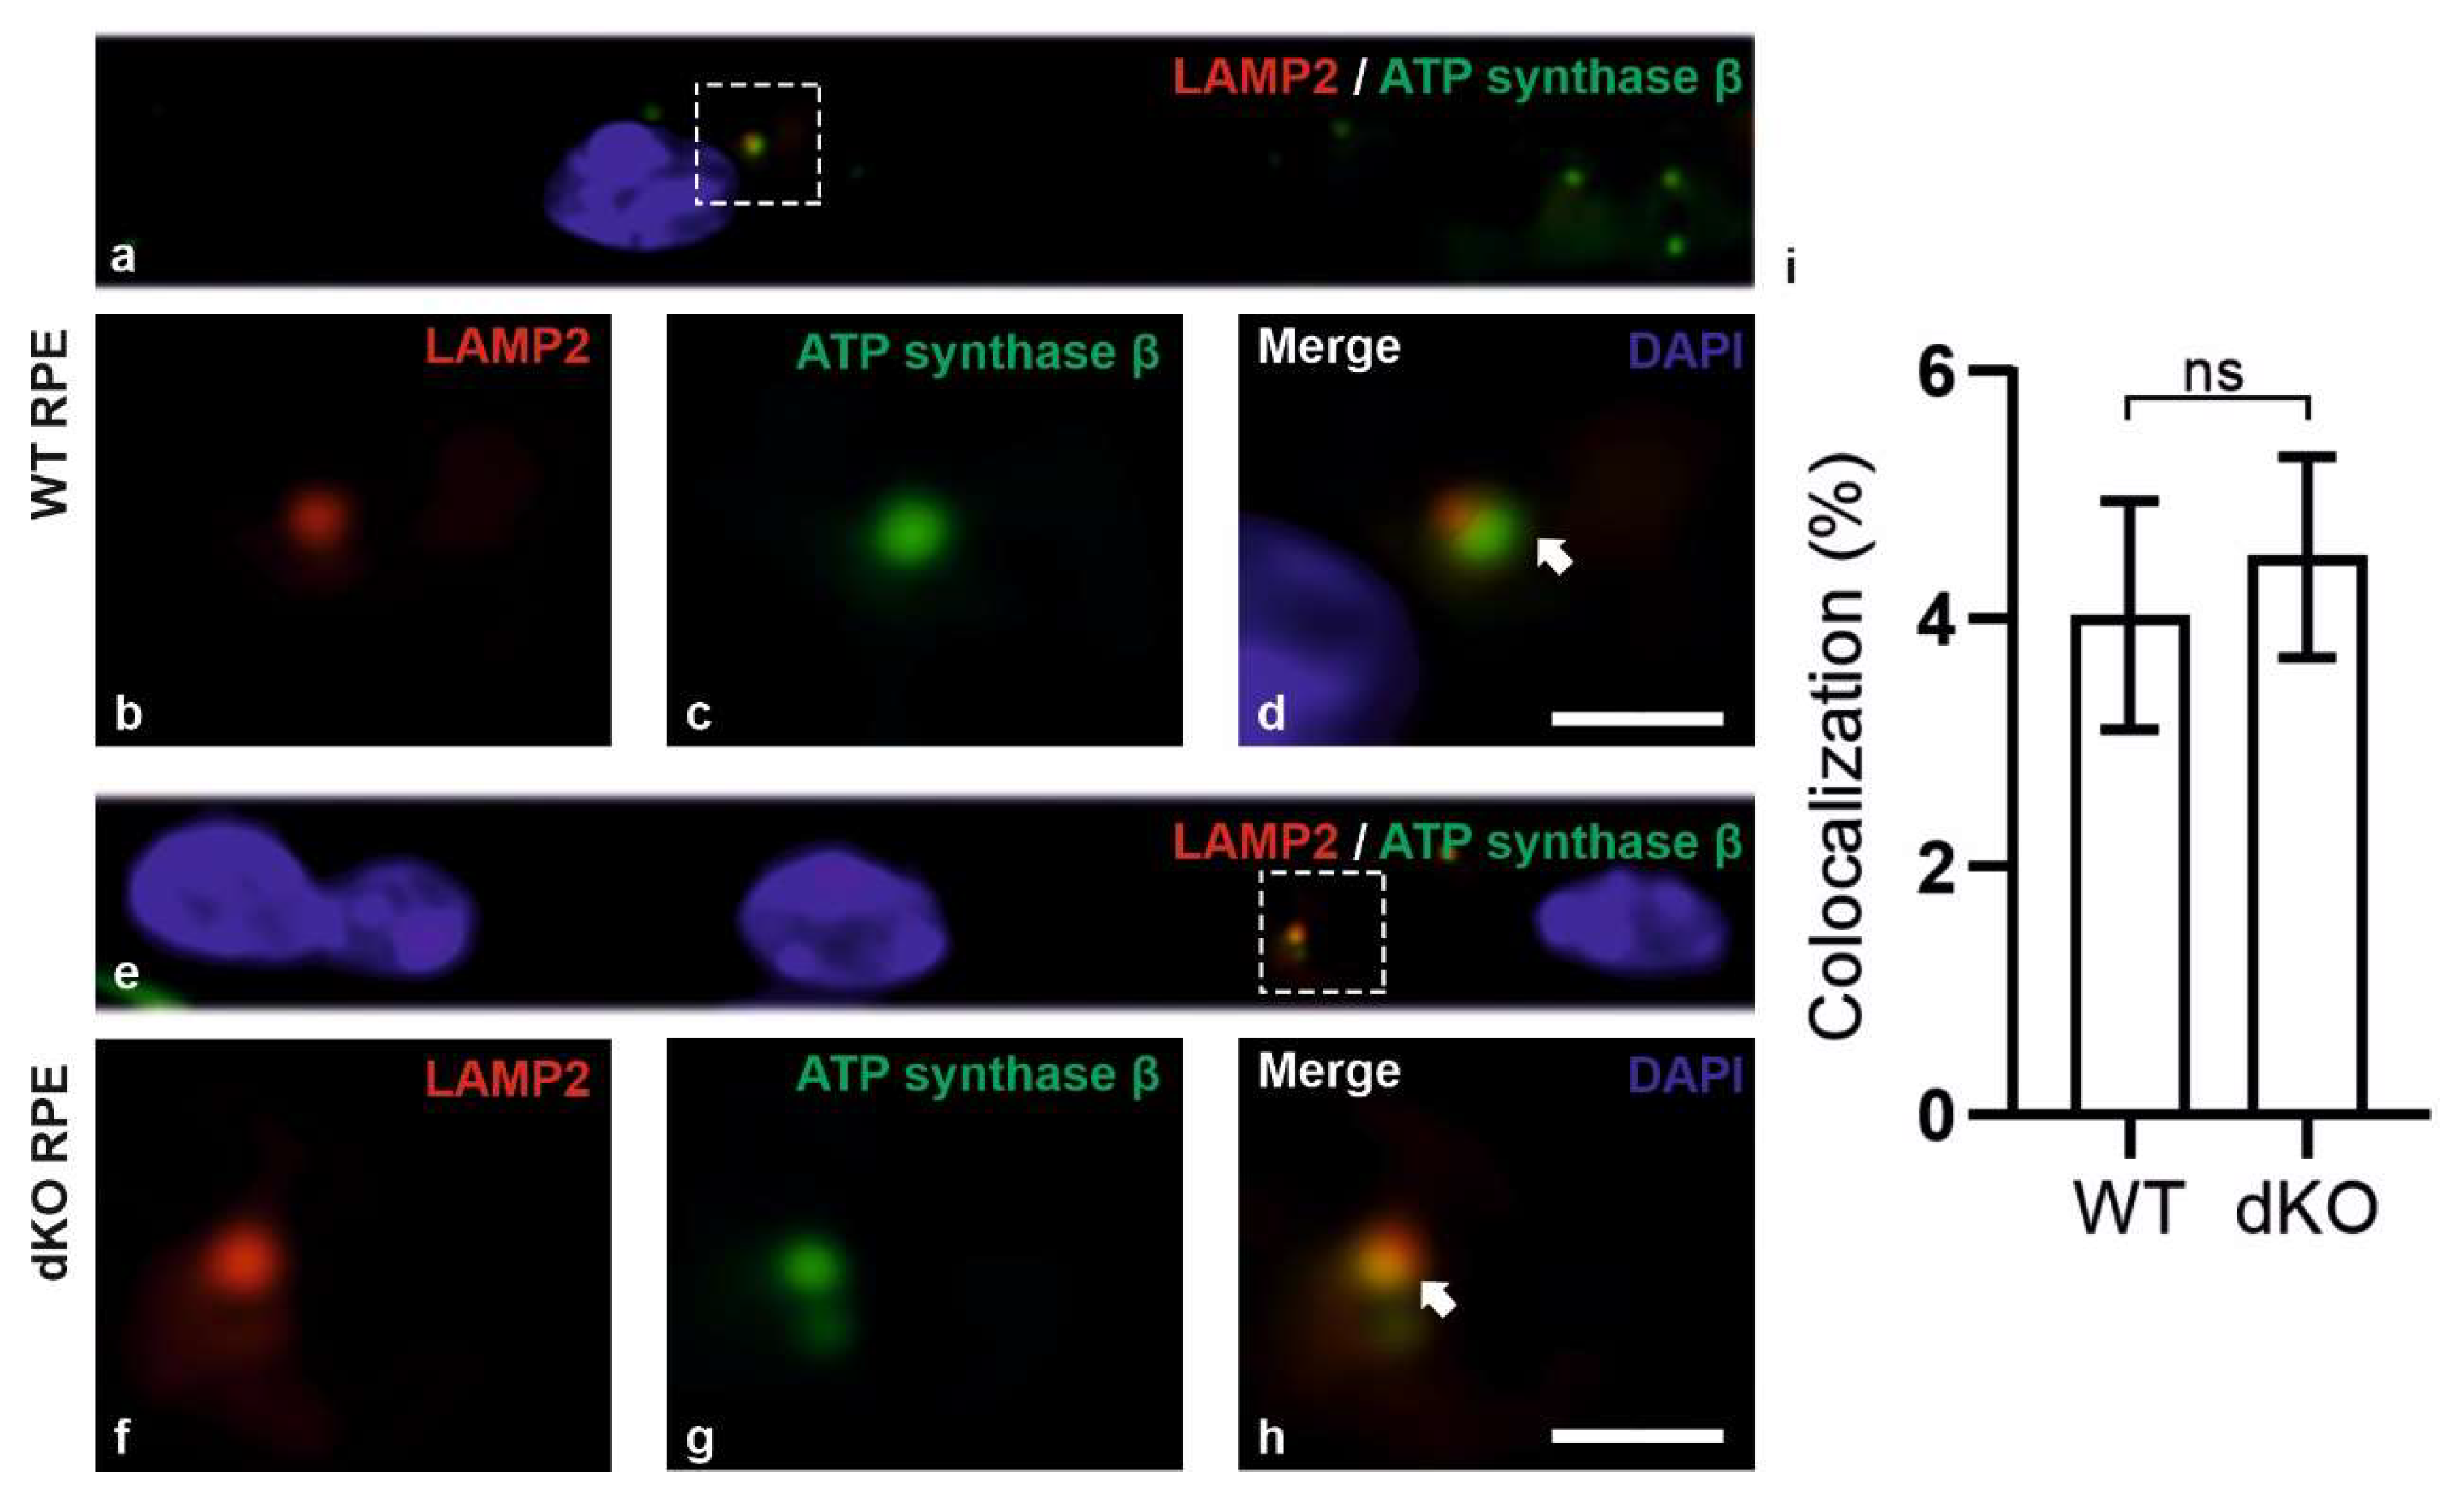
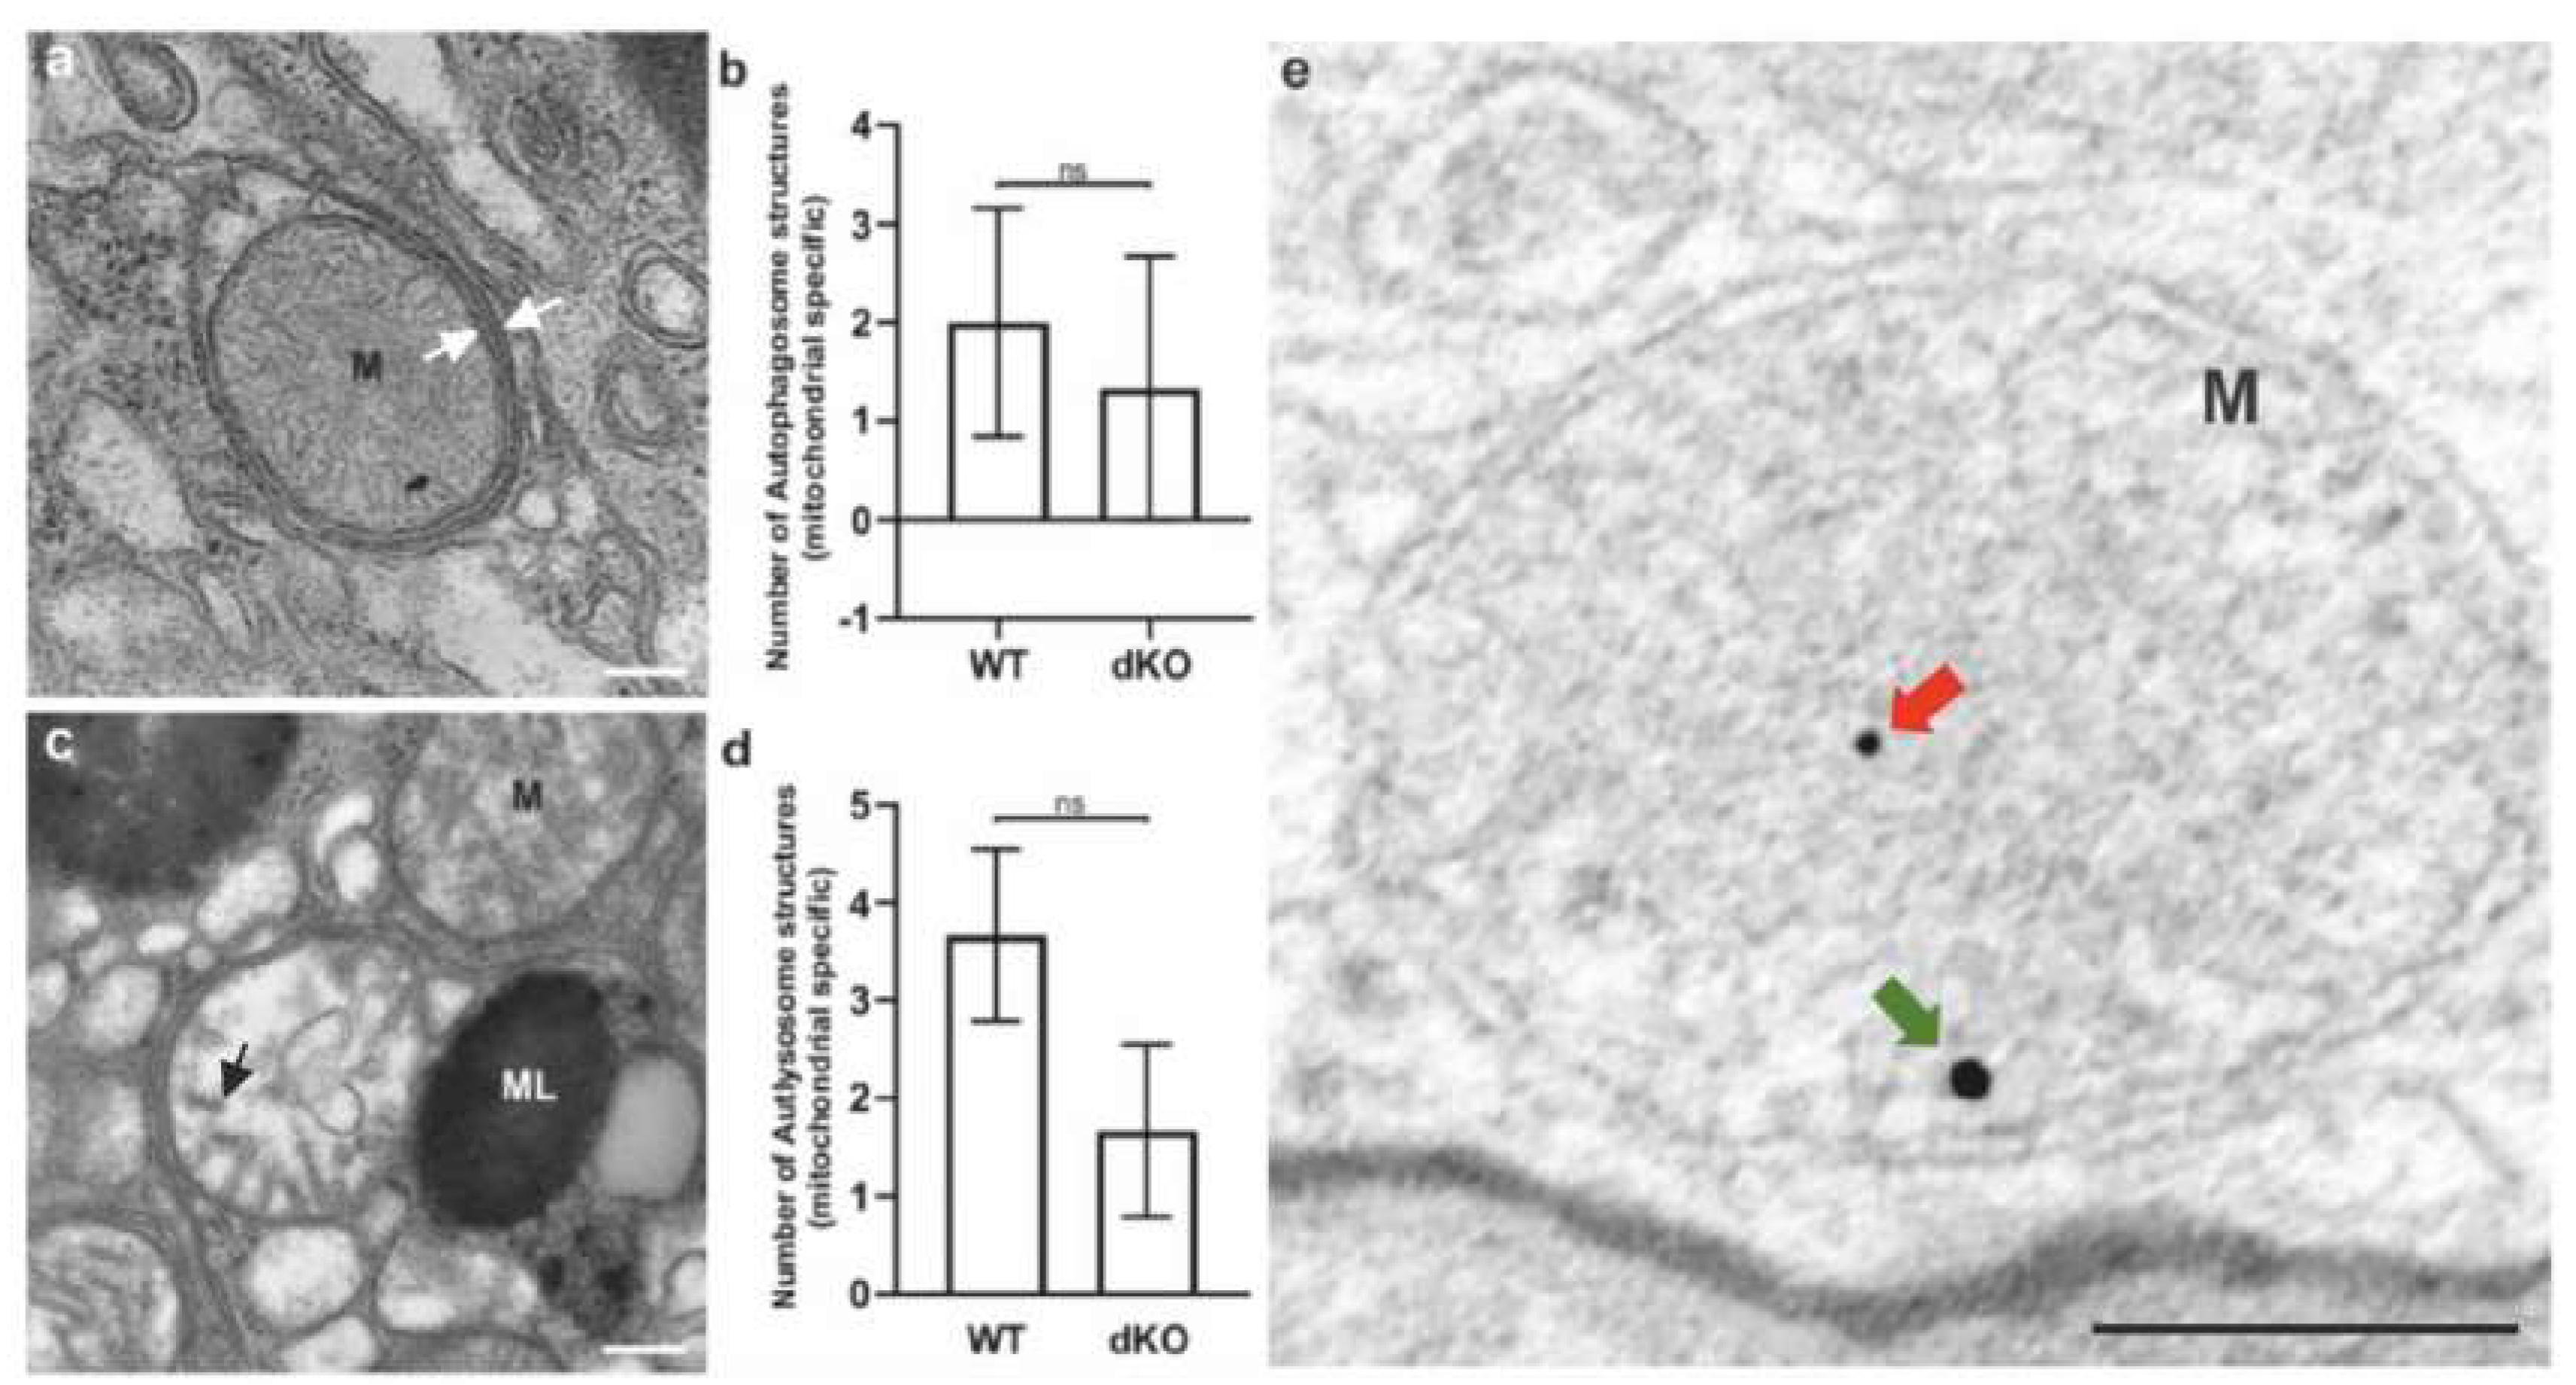
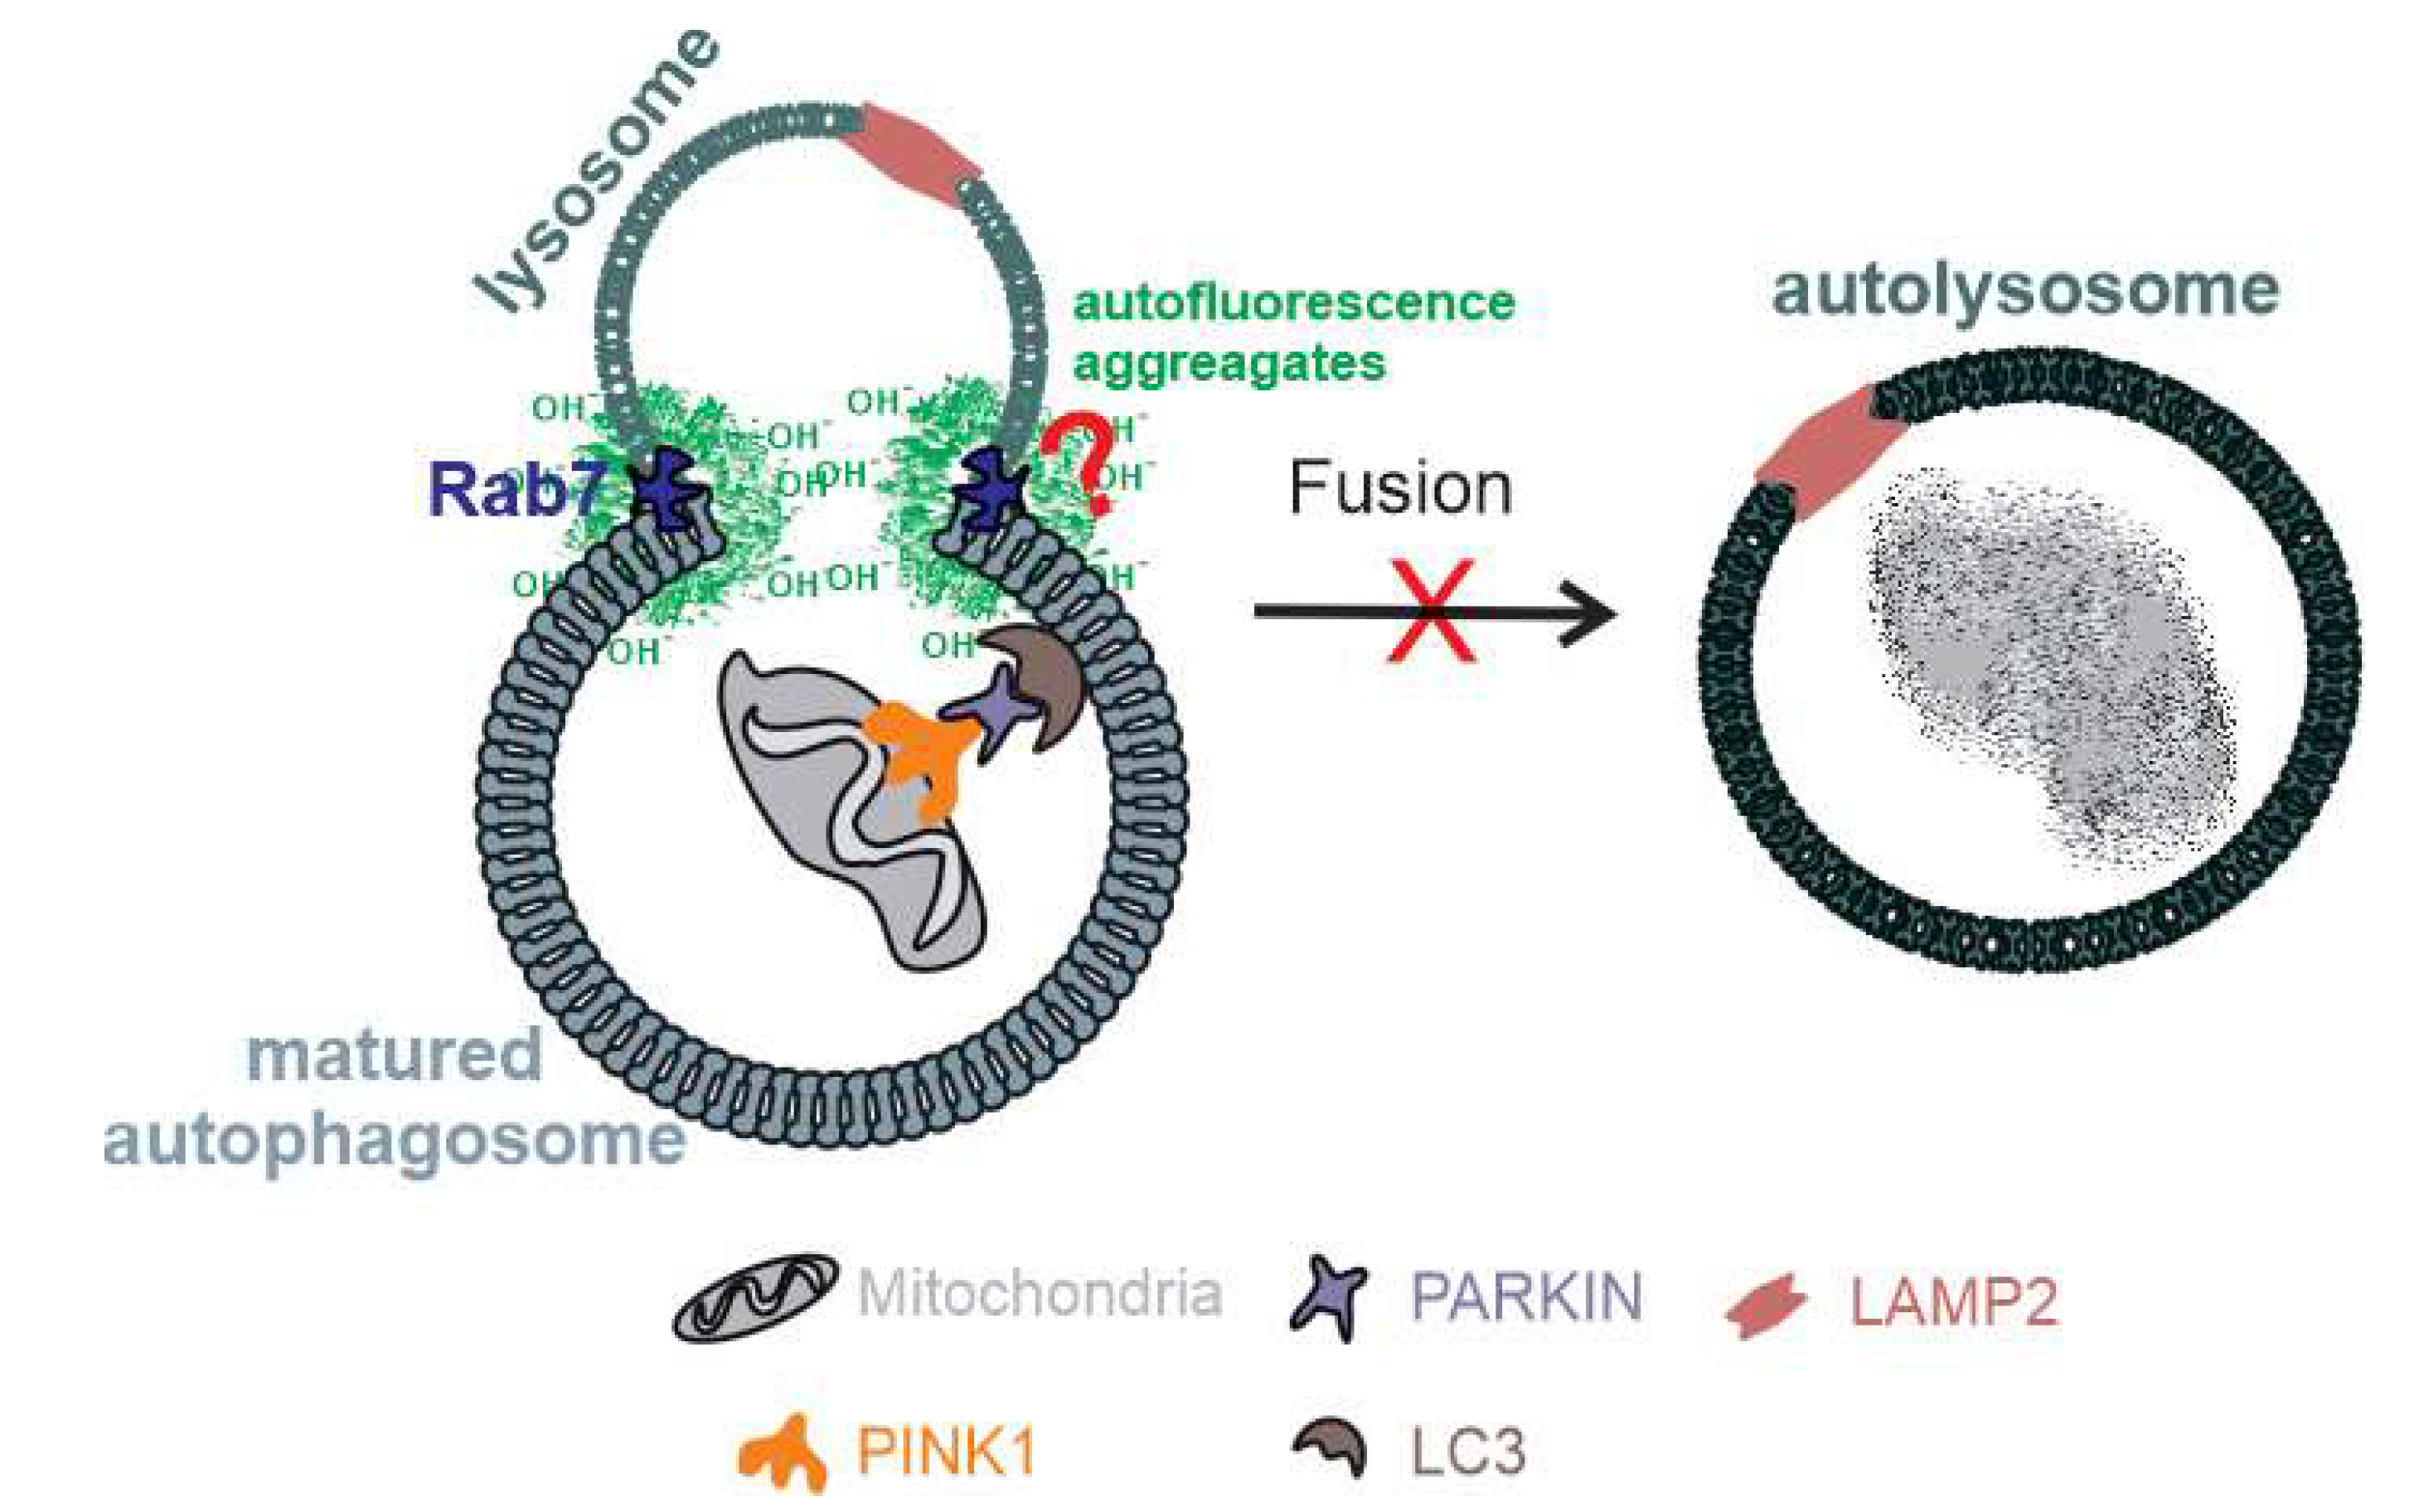
2.3. Relative Decrease in Autolysosomal Clearance and Impaired Mitophagy Process
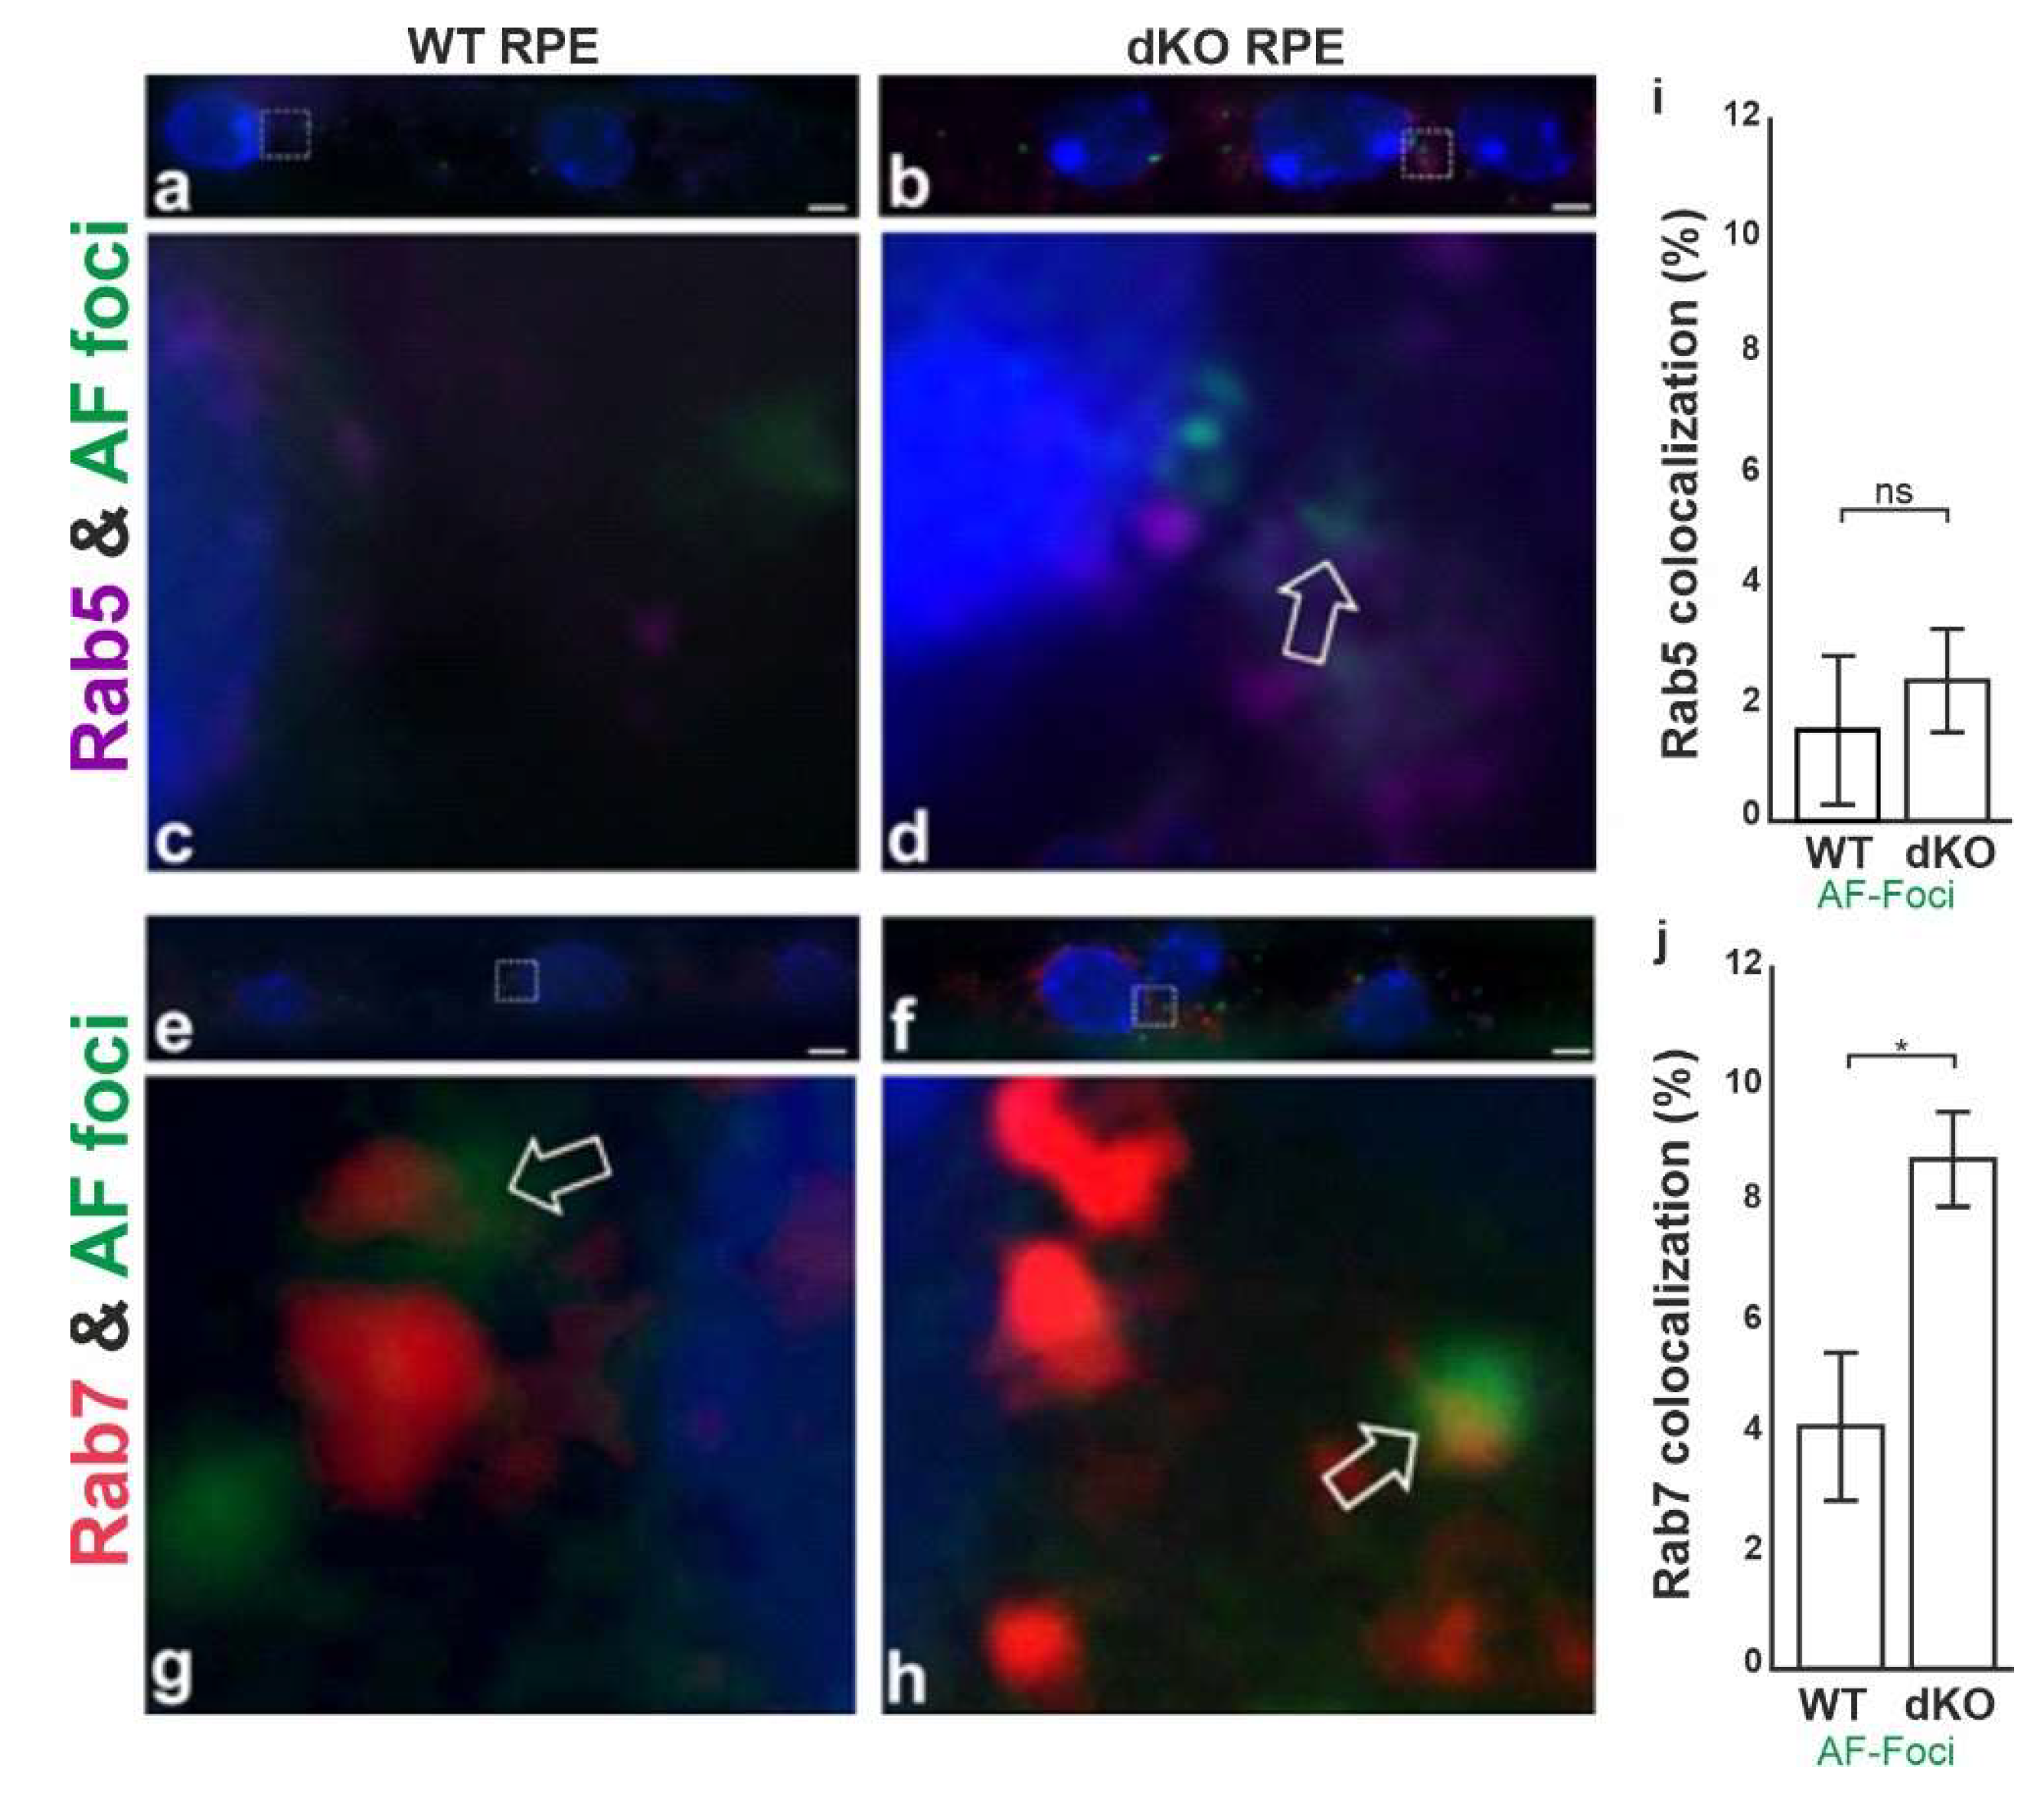
2.4. Aggregates Colocalize with Rab7
3. Discussion
4. Materials and Methods
4.1. Ethics and Animal Experiments
4.2. Genotyping and Tissue Preparation
4.3. Immunohistochemical Staining
4.4. Confocal Imaging
4.5. Colocalization Analysis
4.6. Transmission Electron Microscopy (TEM) Preparation and Mitochondria-Specific Autophagosome and Autolysosome Analysis
4.7. Postembedded Immunolabelling
4.8. Statistics
Supplementary Materials
Author Contributions
Funding
Acknowledgments
Conflicts of Interest
Abbreviations
| AMD | Age-related macular degeneration |
| RPE | Retinal pigment epithelial cells |
| dKO | Double knockout |
| WT | Wild type |
| NFE2L2 | Nuclear Factor, Erythroid 2 Like 2 |
| PGC1α | Peroxisome proliferator-activated receptor gamma coactivator 1-alpha |
| LC3B | Microtubule-associated proteins 1A/1B light chain 3B |
| PINK1 | PTEN-induced kinase 1 |
| PARKIN | E3 ubiquitin ligase |
| LAMP2 | Lysosome-associated membrane protein 2 |
| Rab(5/7) | RAS-related GTP-binding proteins (5/7) |
| PRCs | Photoreceptor cells |
| POS | Photoreceptor outer segments |
| p62/SQSTM1 | Sequestosome-1/ ubiquitin-binding protein p62 |
| OMM | Outer mitochondrial membrane |
| NBR1 | Neighbor of BRCA1 gene 1 protein |
| OPTN | Optineurin |
| AMBRA1 | Autophagy and beclin-1 regulator 1 |
| LIR | LC3-interacting region |
| Bnip3 | BCL2 interacting protein 3 |
| Nix/Bnip3L | BCL2-like 3 |
| FUNDC1 | FUN14 domain-containing 1 |
| Bcl2L13 | BCL2-like 13 |
| TOM20 | Mitochondrial import receptor subunit TOM20 |
| TEM | Transmission electron microscopy |
| TMN | Total mitochondrial number |
| pS65 | Phospho-ubiquitin serine 65 |
| ATP | Adenosine triphosphate |
| AF | Autofluorescence |
| ROS | Reactive oxygen species |
| RNS | Reactive nitrogen species |
| AMPK | 5′-adenosine monophosphate-activated protein kinase |
| NaIO3 | Sodium iodate |
| NAC | N-acetylcysteine |
Appendix A

References
- McCarty, C.A.; Mukesh, B.N.; Fu, C.L.; Mitchell, P.; Wang, J.J.; Taylor, H.R. Risk factors for age-related maculopathy: The Visual Impairment Project. Arch. Ophthalmol. 2001, 119, 1455–1462. [Google Scholar] [CrossRef]
- Ratnapriya, R.; Chew, E.Y. Age-related macular degeneration-clinical review and genetics update. Clin. Genet. 2013, 84, 160–166. [Google Scholar] [CrossRef]
- Klein, R.; Chou, C.F.; Klein, B.E.; Zhang, X.; Meuer, S.M.; Saaddine, J.B. Prevalence of age-related macular degeneration in the US population. Arch. Ophthalmol. 2011, 129, 75–80. [Google Scholar] [CrossRef]
- Jayakrishna, A.; Fowler, B.J. Mechanisms of age-related macular degeneration. Neuron 2012, 75, 26–39. [Google Scholar] [CrossRef]
- Brandl, C.; Stark, K.J.; Wintergerst, M.; Heinemann, M.; Heid, I.M.; Finger, R.P. Epidemiology of age-related macular degeneration. Ophthalmologe 2016, 113, 735–745. [Google Scholar] [CrossRef] [PubMed]
- Kaarniranta, K.; Salminen, A.; Haapasalo, A.; Soininen, H.; Hiltunen, M. Age-related macular degeneration (AMD): Alzheimer’s disease in the eye? J. Alzheimers Dis. 2011, 24, 615–631. [Google Scholar] [CrossRef] [PubMed]
- Terman, A.; Brunk, U.T. Lipofuscin: Mechanisms of formation and increase with age. APMIS 1998, 106, 265–276. [Google Scholar] [CrossRef] [PubMed]
- Crabb, J.W.; Miyagi, M.; Gu, X.; Shadrach, K.; West, K.A.; Sakaguchi, H.; Kamei, M.; Hasan, A.; Yan, L.; Rayborn, M.E.; et al. Drusen proteome analysis: An approach to the etiology of age-related macular degeneration. Proc. Natl. Acad. Sci. USA 2002, 99, 14682–14687. [Google Scholar] [CrossRef] [PubMed]
- Kaarniranta, K.; Hyttinen, J.; Ryhanen, T.; Viiri, J.; Paimela, T.; Toropainen, E.; Sorri, I.; Salminen, A. Mechanisms of protein aggregation in the retinal pigment epithelial cells. Front. Biosci. 2010, 2, 1374–13784. [Google Scholar] [CrossRef] [PubMed]
- Al Gwairi, O.; Thach, L.; Zheng, W.; Osman, N.; Little, P.J. Cellular and Molecular Pathology of Age-Related Macular Degeneration: Potential Role for Proteoglycans. J. Ophthalmol. 2016. [Google Scholar] [CrossRef]
- Reddy, P.H.; Reddy, T.P. Mitochondria as a therapeutic target for aging and neurodegenerative diseases. Curr. Alzheimer. Res. 2011, 8, 393–409. [Google Scholar] [CrossRef] [PubMed]
- Enns, G.M. Advances in Mitochondrial Medicine. J. Inborn Errors Metab. Screen. 2018, 6. [Google Scholar] [CrossRef]
- Reddy, P.H. Role of mitochondria in neurodegenerative diseases: Mitochondria as a therapeutic target in Alzheimer’s disease. CNS Spectr. 2009, 14, 8–13. [Google Scholar] [CrossRef] [PubMed]
- Karunadharma, P.P.; Nordgaard, C.L.; Olsen, T.W.; Ferrington, D.A. Mitochondrial DNA damage as a potential mechanism for Age-Related macular Degeneration. Invest. Ophthalmol. Vis. Sci. 2010, 51, 5470–5479. [Google Scholar] [CrossRef]
- Felszeghy, S.; Viiri, J.; Paterno, J.J.; Hyttinen, J.M.T.; Koskela, A.; Chen, M.; Leinonen, H.; Tanila, H.; Kivinen, N.; Koistinen, A.; et al. Loss of NRF-2 and PGC-1α genes leads to retinal pigment epithelium damage resembling dry age-related macular degeneration. Redox Biol. 2019, 20, 1–12. [Google Scholar] [CrossRef]
- Nguyen, T.; Nioi, P.; Pickett, C.B. The Nrf2-antioxidant response element signaling pathway and its activation by oxidative stress. J. Biol Chem. 2009, 284, 13291–13295. [Google Scholar] [CrossRef]
- Liang, H.; Ward, W.F. PGC-1alpha: A key regulator of energy metabolism. Adv. Physiol. Educ. 2006, 30, 145–151. [Google Scholar] [CrossRef]
- Zaffagnini, G.; Martens, S. Mechanisms of Selective Autophagy. J. Mol. Biol. 2016, 428, 1714–1724. [Google Scholar] [CrossRef]
- Svenning, S.; Johansen, T. Selective autophagy. Essays. Biochem. 2013, 55, 79–92. [Google Scholar] [CrossRef]
- Johansen, T.; Lamark, T. Selective Autophagy: ATG8 Family Proteins, LIR Motifs and Cargo Receptors. J. Mol. Biol. 2020, 432, 80–103. [Google Scholar] [CrossRef]
- Sharma, V.; Verma, S.; Seranova, E.; Sarkar, S.; Kumar, D. Selective Autophagy and Xenophagy in Infection and Disease. Front. Cell Dev. Biol. 2018, 6, 147. [Google Scholar] [CrossRef] [PubMed]
- Gatica, D.; Lahiri, V.; Klionsky, D.J. Cargo recognition and degradation by selective autophagy. Nat. Cell Biol. 2018, 20, 233–242. [Google Scholar] [CrossRef] [PubMed]
- Anding, A.L.; Baehrecke, E.H. Cleaning House: Selective Autophagy of Organelles. Dev. Cell 2017, 41, 10–22. [Google Scholar] [CrossRef] [PubMed]
- Jin, S.M.; Lazarou, M.; Wang, C.; Kane, L.A.; Narendra, D.P.; Youle, R.J. Mitochondrial membrane potential regulates PINK1 import and proteolytic destabilization by PARL. J. Cell Biol. 2010, 191, 933–942. [Google Scholar] [CrossRef]
- Matsuda, N.; Sato, S.; Shiba, K.; Okatsu, K.; Saisho, K.; Gautier, C.A.; Sou, Y.S.; Saiki, S.; Kawajiri, S.; Sato, F.; et al. PINK1 stabilized by mitochondrial depolarization recruits Parkin to damaged mitochondria and activates latent Parkin for mitophagy. J. Cell Biol. 2010, 189, 211–221. [Google Scholar] [CrossRef]
- Chen, Y.; Dorn, G. W 2nd. PINK1-phosphorylated mitofusin 2 is a Parkin receptor for culling damaged mitochondria. Science 2013, 340, 471–475. [Google Scholar] [CrossRef]
- Chan, N.C.; Salazar, A.M.; Pham, A.H.; Sweredoski, M.J.; Kolawa, N.J.; Graham, R.L.; Hess, S.; Chan, D.C. Broad activation of the ubiquitin-proteasome system by Parkin is critical for mitophagy. Hum. Mol. Genet. 2011, 20, 1726–1737. [Google Scholar] [CrossRef]
- Koyano, F.; Okatsu, K.; Kosako, H.; Tamura, Y.; Go, E.; Kimura, M.; Kimura, Y.; Tsuchiya, H.; Yoshihara, H.; Hirokawa, T.; et al. Ubiquitin is phosphorylated by PINK1 to activate parkin. Nature 2014, 510, 162–166. [Google Scholar] [CrossRef]
- Shiba-Fukushima, K.; Imai, Y.; Yoshida, S.; Ishihama, Y.; Kanao, T.; Sato, S.; Hattori, N. PINK1-mediated phosphorylation of the Parkin ubiquitin-like domain primes mitochondrial translocation of Parkin and regulates mitophagy. Sci. Rep. 2012, 2, 1002. [Google Scholar] [CrossRef]
- Kane, L.A.; Lazarou, M.; Fogel, A.I.; Li, Y.; Yamano, K.; Sarraf, S.A.; Banerjee, S.; Youle, R.J. PINK1 phosphorylates ubiquitin to activate Parkin E3 ubiquitin ligase activity. J. Cell Biol. 2014, 205, 143–153. [Google Scholar] [CrossRef]
- Sarraf, S.A.; Raman, M.; Guarani-Pereira, V.; Sowa, M.E.; Huttlin, E.L.; Gygi, S.P.; Harper, J.W. Landscape of the PARKIN-dependent ubiquitylome in response to mitochondrial depolarization. Nature 2013, 496, 372–376. [Google Scholar] [CrossRef] [PubMed]
- Szatmári, Z.; Sass, M. The autophagic roles of Rab small GTPases and their upstream regulators: A review. Autophagy 2014, 10, 1154–1166. [Google Scholar] [CrossRef] [PubMed]
- Vieira, O.V.; Bucci, C.; Harrison, R.E.; Trimble, W.S.; Lanzetti, L.; Gruenberg, J.; Schreiber, A.D.; Stahl, P.D.; Grinstein, S. Modulation of Rab5 and Rab7 recruitment to phagosomes by phosphatidylinositol 3-kinase. Mol. Cell Biol. 2003, 23, 2501–2514. [Google Scholar] [CrossRef] [PubMed]
- Kazlauskaite, A.; Martínez-Torres, R.J.; Wilkie, S.; Kumar, A.; Peltier, J.; Gonzalez, A.; Johnson, C.; Zhang, J.; Hope, A.G.; Peggie, M.; et al. Binding to serine 65-phosphorylated ubiquitin primes Parkin for optimal PINK1-dependent phosphorylation and activation. EMBO Rep. 2015, 16, 939–954. [Google Scholar] [CrossRef]
- McWilliams, T.G.; Barini, E.; Pohjolan-Pirhonen, R.; Brooks, S.P.; Singh, F.; Burel, S.; Balk, K.; Kumar, A.; Montava-Garriga, L.; Prescott, A.R.; et al. Phosphorylation of Parkin at serine 65 is essential for its activation in vivo. Open Biol. 2018, 8, 180108. [Google Scholar] [CrossRef]
- Durcan, T.M.; Fon, E.A. The three ‘P’s of mitophagy: PARKIN, PINK1, and post-translational modifications. Genes Dev. 2015, 29, 989–999. [Google Scholar] [CrossRef]
- Ferrington, D.A.; Sinha, D.; Kaarniranta, K. Defects in retinal pigment epithelial cell proteolysis and the pathology associated with age-related macular degeneration. Prog. Retin. Eye Res. 2016, 51, 69–89. [Google Scholar] [CrossRef]
- Feng, Y.; Press, B.; Wandinger-Ness, A. Rab 7: An important regulator of late endocytic membrane traffic. J. Cell Biol. 1995, 131, 1435–1452. [Google Scholar] [CrossRef]
- Roberts, R.L.; Barbieri, M.A.; Pryse, K.M.; Chua, M.; Morisaki, J.H.; Stahl, P.D. Endosome fusion in living cells overexpressing GFP-rab5. J. Cell Sci. 1999, 112, 3667–3675. [Google Scholar] [CrossRef]
- Korovila, I.; Hugo, M.; Castro, J.P.; Weber, D.; Höhn, A.; Grune, T.; Jung, T. Proteostasis, oxidative stress and aging. Redox Biol. 2017, 13, 550–567. [Google Scholar] [CrossRef]
- Lindner, A.B.; Demarez, A. Protein aggregation as a paradigm of aging. Biochim. Biophys. Acta. 2009, 10, 980–996. [Google Scholar] [CrossRef] [PubMed]
- Regmi, S.G.; Rolland, S.G.; Conradt, B. Age-dependent changes in mitochondrial morphology and volume are not predictors of lifespan. Aging 2014, 6, 118–130. [Google Scholar] [CrossRef] [PubMed]
- Press, M.; Jung, T.; König, J.; Grune, T.; Höhn, A. Protein aggregates and proteostasis in aging: Amylin and β-cell function. Mech. Ageing Dev. 2019, 177, 46–54. [Google Scholar] [CrossRef] [PubMed]
- Kim, G.H.; Kim, J.E.; Rhie, S.J.; Yoon, S. The Role of Oxidative Stress in Neurodegenerative Diseases. Exp. Neurobiol. 2015, 24, 325–340. [Google Scholar] [CrossRef]
- Uttara, B.; Singh, A.V.; Zamboni, P.; Mahajan, R.T. Oxidative stress and neurodegenerative diseases: A review of upstream and downstream antioxidant therapeutic options. Curr. Neuropharmacol. 2009, 7, 65–74. [Google Scholar] [CrossRef]
- Westermann, B. Mitochondrial fusion and fission in cell life and death. Nat. Rev. Mol. Cell Biol. 2010, 11, 872–884. [Google Scholar] [CrossRef]
- Youle, R.J.; van der Bliek, A.M. Mitochondrial fission, fusion, and stress. Science 2012, 337, 1062–1065. [Google Scholar] [CrossRef]
- Kondapalli, C.; Kazlauskaite, A.; Zhang, N.; Woodroof, H.I.; Campbell, D.G.; Gourlay, R.; Burchell, L.; Walden, H.; Macartney, T.J.; Deak, M.; et al. PINK1 is activated by mitochondrial membrane potential depolarization and stimulates Parkin E3 ligase activity by phosphorylating Serine 65. Open Biol. 2012, 2, 120080. [Google Scholar] [CrossRef]
- Wang, X.; Winter, D.; Ashrafi, G.; Schlehe, J.; Wong, Y.L.; Selkoe, D.; Rice, S.; Steen, J.; LaVoie, M.J.; Schwarz, T.L. PINK1 and Parkin target Miro for phosphorylation and degradation to arrest mitochondrial motility. Cell 2011, 147, 893–906. [Google Scholar] [CrossRef]
- Jin, S.M.; Youle, R.J. PINK1- and Parkin-mediated mitophagy at a glance. J. Cell Sci. 2012, 125, 795–799. [Google Scholar] [CrossRef]
- Truban, D.; Hou, X.; Caulfield, T.R.; Fiesel, F.C.; Springer, W. PINK1, Parkin, and Mitochondrial Quality Control: What can we Learn about Parkinson’s Disease Pathobiology? J. Park. Dis. 2017, 7, 13–29. [Google Scholar] [CrossRef] [PubMed]
- Moisoi, N.; Fedele, V.; Edwards, J.; Martins, L.M. Loss of PINK1 enhances neurodegeneration in a mouse model of Parkinson’s disease triggered by mitochondrial stress. Neuropharmacology 2014, 77, 350–357. [Google Scholar] [CrossRef] [PubMed]
- Greene, J.C.; Whitworth, A.J.; Kuo, I.; Andrews, L.A.; Feany, M.B.; Pallanck, L.J. Mitochondrial pathology and apoptotic muscle degeneration in Drosophila parkin mutants. Proc. Natl. Acad. Sci. USA 2003, 100, 4078–4083. [Google Scholar] [CrossRef] [PubMed]
- Narendra, D.; Tanaka, A.; Suen, D.F.; Youle, R.J. Parkin is recruited selectively to impaired mitochondria and promotes their autophagy. J. Cell Biol. 2008, 183, 795–803. [Google Scholar] [CrossRef]
- Lee, S.Y.; Oh, J.S.; Rho, J.H.; Jeong, N.Y.; Kwon, Y.H.; Jeong, W.J.; Ryu, W.Y.; Ahn, H.B.; Park, W.C.; Rho, S.H.; et al. Retinal pigment epithelial cells undergoing mitotic catastrophe are vulnerable to autophagy inhibition. Cell Death Dis. 2014, 5, e1303. [Google Scholar] [CrossRef]
- Shaid, S.; Brandts, C.H.; Serve, H.; Dikic, I. Ubiquitination and selective autophagy. Cell Death Differ. 2013, 20, 21–30. [Google Scholar] [CrossRef]
- Cherra, S.J., 3rd; Kulich, S.M.; Uechi, G.; Balasubramani, M.; Mountzouris, J.; Day, B.W.; Chu, C.T. Regulation of the autophagy protein LC3 by phosphorylation. J. Cell Biol. 2010, 190, 533–539. [Google Scholar] [CrossRef]
- Narendra, D.; Kane, L.A.; Hauser, D.N.; Fearnley, I.M.; Youle, R.J. p62/SQSTM1 is required for Parkin-induced mitochondrial clustering but not mitophagy; VDAC1 is dispensable for both. Autophagy 2010, 6, 1090–1106. [Google Scholar] [CrossRef]
- Krohne, T.U.; Stratmann, N.K.; Kopitz, J.; Holz, F.G. Effects of lipid peroxidation products on lipofuscinogenesis and autophagy in human retinal pigment epithelial cells. Exp. Eye Res. 2010, 90, 465–471. [Google Scholar] [CrossRef]
- Lin, Y.C.; Horng, L.Y.; Sung, H.C.; Wu, R.T. Sodium Iodate Disrupted the Mitochondrial-Lysosomal Axis in Cultured Retinal Pigment Epithelial Cells. J. Ocul. Pharmacol. Ther. 2018, 34, 500–511. [Google Scholar] [CrossRef]
- Blasiak, J.; Pawlowska, E.; Szczepanska, J.; Kaarniranta, K. Interplay between Autophagy and the Ubiquitin-Proteasome System and Its Role in the Pathogenesis of Age-Related Macular Degeneration. Int. J. Mol. Sci. 2019, 20, E210. [Google Scholar] [CrossRef] [PubMed]
- Eldred, G.E. Lipofuscin fluorophore inhibits lysosomal protein degradation and may cause early stages of macular degeneration. Gerontology 1995, 41, 15–28. [Google Scholar] [CrossRef] [PubMed]
- Höhn, A.; König, J.; Grune, T. Protein oxidation in aging and the removal of oxidized proteins. J Proteomics. 2013, 92, 132–159. [Google Scholar] [CrossRef] [PubMed]
- Eid, N.; Ito, Y.; Maemura, K.; Otsuki, Y. Elevated autophagic sequestration of mitochondria and lipid droplets in steatotic hepatocytes of chronic ethanol-treated rats: An immunohistochemical and electron microscopic study. J. Mol. Histol. 2013, 44, 311–326. [Google Scholar] [CrossRef] [PubMed]
- Eid, N.; Ito, Y.; Otsuki, Y. Triggering of Parkin Mitochondrial Translocation in Mitophagy: Implications for Liver Diseases. Front. Pharmacol. 2016, 7, 100. [Google Scholar] [CrossRef] [PubMed]
- Nagy, I.; Sik, A.; Polgár, E.; Petkó, M.; Antal, M. Combination of cobalt labelling with immunocytochemical reactions for electron microscopic investigations on frog spinal cord. Microsc. Res. Tech. 1994, 28, 60–66. [Google Scholar] [CrossRef]
- Geisler, S.; Holmström, K.M.; Skujat, D.; Fiesel, F.C.; Rothfuss, O.C.; Kahle, P.J.; Springer, W. PINK1/Parkin-mediated mitophagy is dependent on VDAC1 and p62/SQSTM1. Nat. Cell Biol. 2010, 12, 119–131. [Google Scholar] [CrossRef]
- Wong, Y.C.; Holzbaur, E.L. Optineurin is an autophagy receptor for damaged mitochondria in parkin-mediated mitophagy that is disrupted by an ALS-linked mutation. Proc. Natl. Acad. Sci. USA 2014, 111, E4439–E4448. [Google Scholar] [CrossRef]
- Van Humbeeck, C.; Cornelissen, T.; Hofkens, H.; Mandemakers, W.; Gevaert, K.; De Strooper, B.; Vandenberghe, W. Parkin interacts with Ambra1 to induce mitophagy. J. Neurosci. 2011, 31, 10249–10261. [Google Scholar] [CrossRef]
- Strappazzon, F.; Vietri-Rudan, M.; Campello, S.; Nazio, F.; Florenzano, F.; Fimia, G.M.; Piacentini, M.; Levine, B.; Cecconi, F. Mitochondrial BCL-2 inhibits AMBRA1-induced autophagy. EMBO J. 2011, 30, 1195–1208. [Google Scholar] [CrossRef]
- Hanna, R.A.; Quinsay, M.N.; Orogo, A.M.; Giang, K.; Rikka, S.; Gustafsson, Å.B. Microtubule-associated protein 1 light chain 3 (LC3) interacts with Bnip3 protein to selectively remove endoplasmic reticulum and mitochondria via autophagy. J. Biol. Chem. 2012, 287, 19094–19104. [Google Scholar] [CrossRef] [PubMed]
- Novak, I.; Kirkin, V.; McEwan, D.G.; Zhang, J.; Wild, P.; Rozenknop, A.; Rogov, V.; Löhr, F.; Popovic, D.; Occhipinti, A.; et al. Nix is a selective autophagy receptor for mitochondrial clearance. EMBO Rep. 2010, 11, 45–51. [Google Scholar] [CrossRef] [PubMed]
- Liu, L.; Feng, D.; Chen, G.; Chen, M.; Zheng, Q.; Song, P.; Ma, Q.; Zhu, C.; Wang, R.; Qi, W.; et al. Mitochondrial outer-membrane protein FUNDC1 mediates hypoxia-induced mitophagy innmammalian cells. Nat. Cell Biol. 2012, 14, 177–185. [Google Scholar] [CrossRef] [PubMed]
- Murakawa, T.; Yamaguchi, O.; Hashimoto, A.; Hikoso, S.; Takeda, T.; Oka, T.; Yasui, H.; Ueda, H.; Akazawa, Y.; Nakayama, H.; et al. Bcl-2-like protein 13 is a mammalian Atg32 homologue that mediates mitophagy and mitochondrial fragmentation. Nat. Commun. 2015, 6, 7527. [Google Scholar] [CrossRef] [PubMed]
- Cianfanelli, V.; Fuoco, C.; Lorente, M.; Salazar, M.; Quondamatteo, F.; Gherardini, P.F.; De Zio, D.; Nazio, F.; Antonioli, M.; D’Orazio, M.; et al. AMBRA1 links autophagy to cell proliferation and tumorigenesis by promoting c-Myc dephosphorylation and degradation. Nat. Cell Biol. 2015, 17, 20–30. [Google Scholar] [CrossRef]
- Kim, J.Y.; Kim, Y.J.; Lee, S.; Park, J.H. BNip3 is a mediator of TNF-induced necrotic cell death. Apoptosis 2011, 16, 114–126. [Google Scholar] [CrossRef]
- Li, Y.; Xue, Y.; Xu, X.; Wang, G.; Liu, Y.; Wu, H.; Li, W.; Wang, Y.; Chen, Z.; Zhang, W.; et al. A mitochondrial FUNDC1/HSC70 interaction organizes the proteostatic stress response at the risk of cell morbidity. EMBO J. 2019, 38, e98786. [Google Scholar] [CrossRef]
- Zhang, Y.; Xi, X.; Mei, Y.; Zhao, X.; Zhou, L.; Ma, M.; Liu, S.; Zha, X.; Yang, Y. High-glucose induces retinal pigment epithelium mitochondrial pathways of apoptosis and inhibits mitophagy by regulating ROS/PINK1/Parkin signal pathway. Biomed. Pharmacother. 2019, 111, 1315–1325. [Google Scholar] [CrossRef]


| Primary Antibodies Against | Isotope | Working Dilution | Supplier/Catalogue Number |
|---|---|---|---|
| ATP synthase β | Monoclonal | 1:100 | TF-A-21351 |
| AMBRA1 | Polyclonal | 1:100 | NBP2-32640 |
| Bnip3 | Polyclonal | 1:200 | NBP1-77683 |
| FUNDC1 | Polyclonal | 1:200 | NBP1-81063 |
| HSP75 (TRAP1) | Monoclonal | 1:100 | AB2721 |
| LAMP2 | Polyclonal | 1:500 | NB300-591 |
| LC3B | Monoclonal | 1:100 | CT-3868 |
| PARKIN | Monoclonal | 1:100 | NBP2-29838 |
| Phospho-ubiquitin-Ser65 | Polyclonal | 1:100 | ABS1513-I |
| PINK1 | Polyclonal | 1:250 | BC-100-494 |
| Rab5 | Monoclonal | 1:50 | SC-46692 |
| Rab7 | Monoclonal | 1:100 | AB-50533 |
| TOM20 | Monoclonal | 1:100 | SC-17764 |
© 2020 by the authors. Licensee MDPI, Basel, Switzerland. This article is an open access article distributed under the terms and conditions of the Creative Commons Attribution (CC BY) license (http://creativecommons.org/licenses/by/4.0/).
Share and Cite
Sridevi Gurubaran, I.; Viiri, J.; Koskela, A.; Hyttinen, J.M.T.; Paterno, J.J.; Kis, G.; Antal, M.; Urtti, A.; Kauppinen, A.; Felszeghy, S.; et al. Mitophagy in the Retinal Pigment Epithelium of Dry Age-Related Macular Degeneration Investigated in the NFE2L2/PGC-1α-/- Mouse Model. Int. J. Mol. Sci. 2020, 21, 1976. https://doi.org/10.3390/ijms21061976
Sridevi Gurubaran I, Viiri J, Koskela A, Hyttinen JMT, Paterno JJ, Kis G, Antal M, Urtti A, Kauppinen A, Felszeghy S, et al. Mitophagy in the Retinal Pigment Epithelium of Dry Age-Related Macular Degeneration Investigated in the NFE2L2/PGC-1α-/- Mouse Model. International Journal of Molecular Sciences. 2020; 21(6):1976. https://doi.org/10.3390/ijms21061976
Chicago/Turabian StyleSridevi Gurubaran, Iswariyaraja, Johanna Viiri, Ali Koskela, Juha M.T. Hyttinen, Jussi J. Paterno, Gréta Kis, Miklós Antal, Arto Urtti, Anu Kauppinen, Szabolcs Felszeghy, and et al. 2020. "Mitophagy in the Retinal Pigment Epithelium of Dry Age-Related Macular Degeneration Investigated in the NFE2L2/PGC-1α-/- Mouse Model" International Journal of Molecular Sciences 21, no. 6: 1976. https://doi.org/10.3390/ijms21061976
APA StyleSridevi Gurubaran, I., Viiri, J., Koskela, A., Hyttinen, J. M. T., Paterno, J. J., Kis, G., Antal, M., Urtti, A., Kauppinen, A., Felszeghy, S., & Kaarniranta, K. (2020). Mitophagy in the Retinal Pigment Epithelium of Dry Age-Related Macular Degeneration Investigated in the NFE2L2/PGC-1α-/- Mouse Model. International Journal of Molecular Sciences, 21(6), 1976. https://doi.org/10.3390/ijms21061976