Discovery of Small-Molecule Activators for Glucose-6-Phosphate Dehydrogenase (G6PD) Using Machine Learning Approaches


Abstract

1. Introduction
2. Results
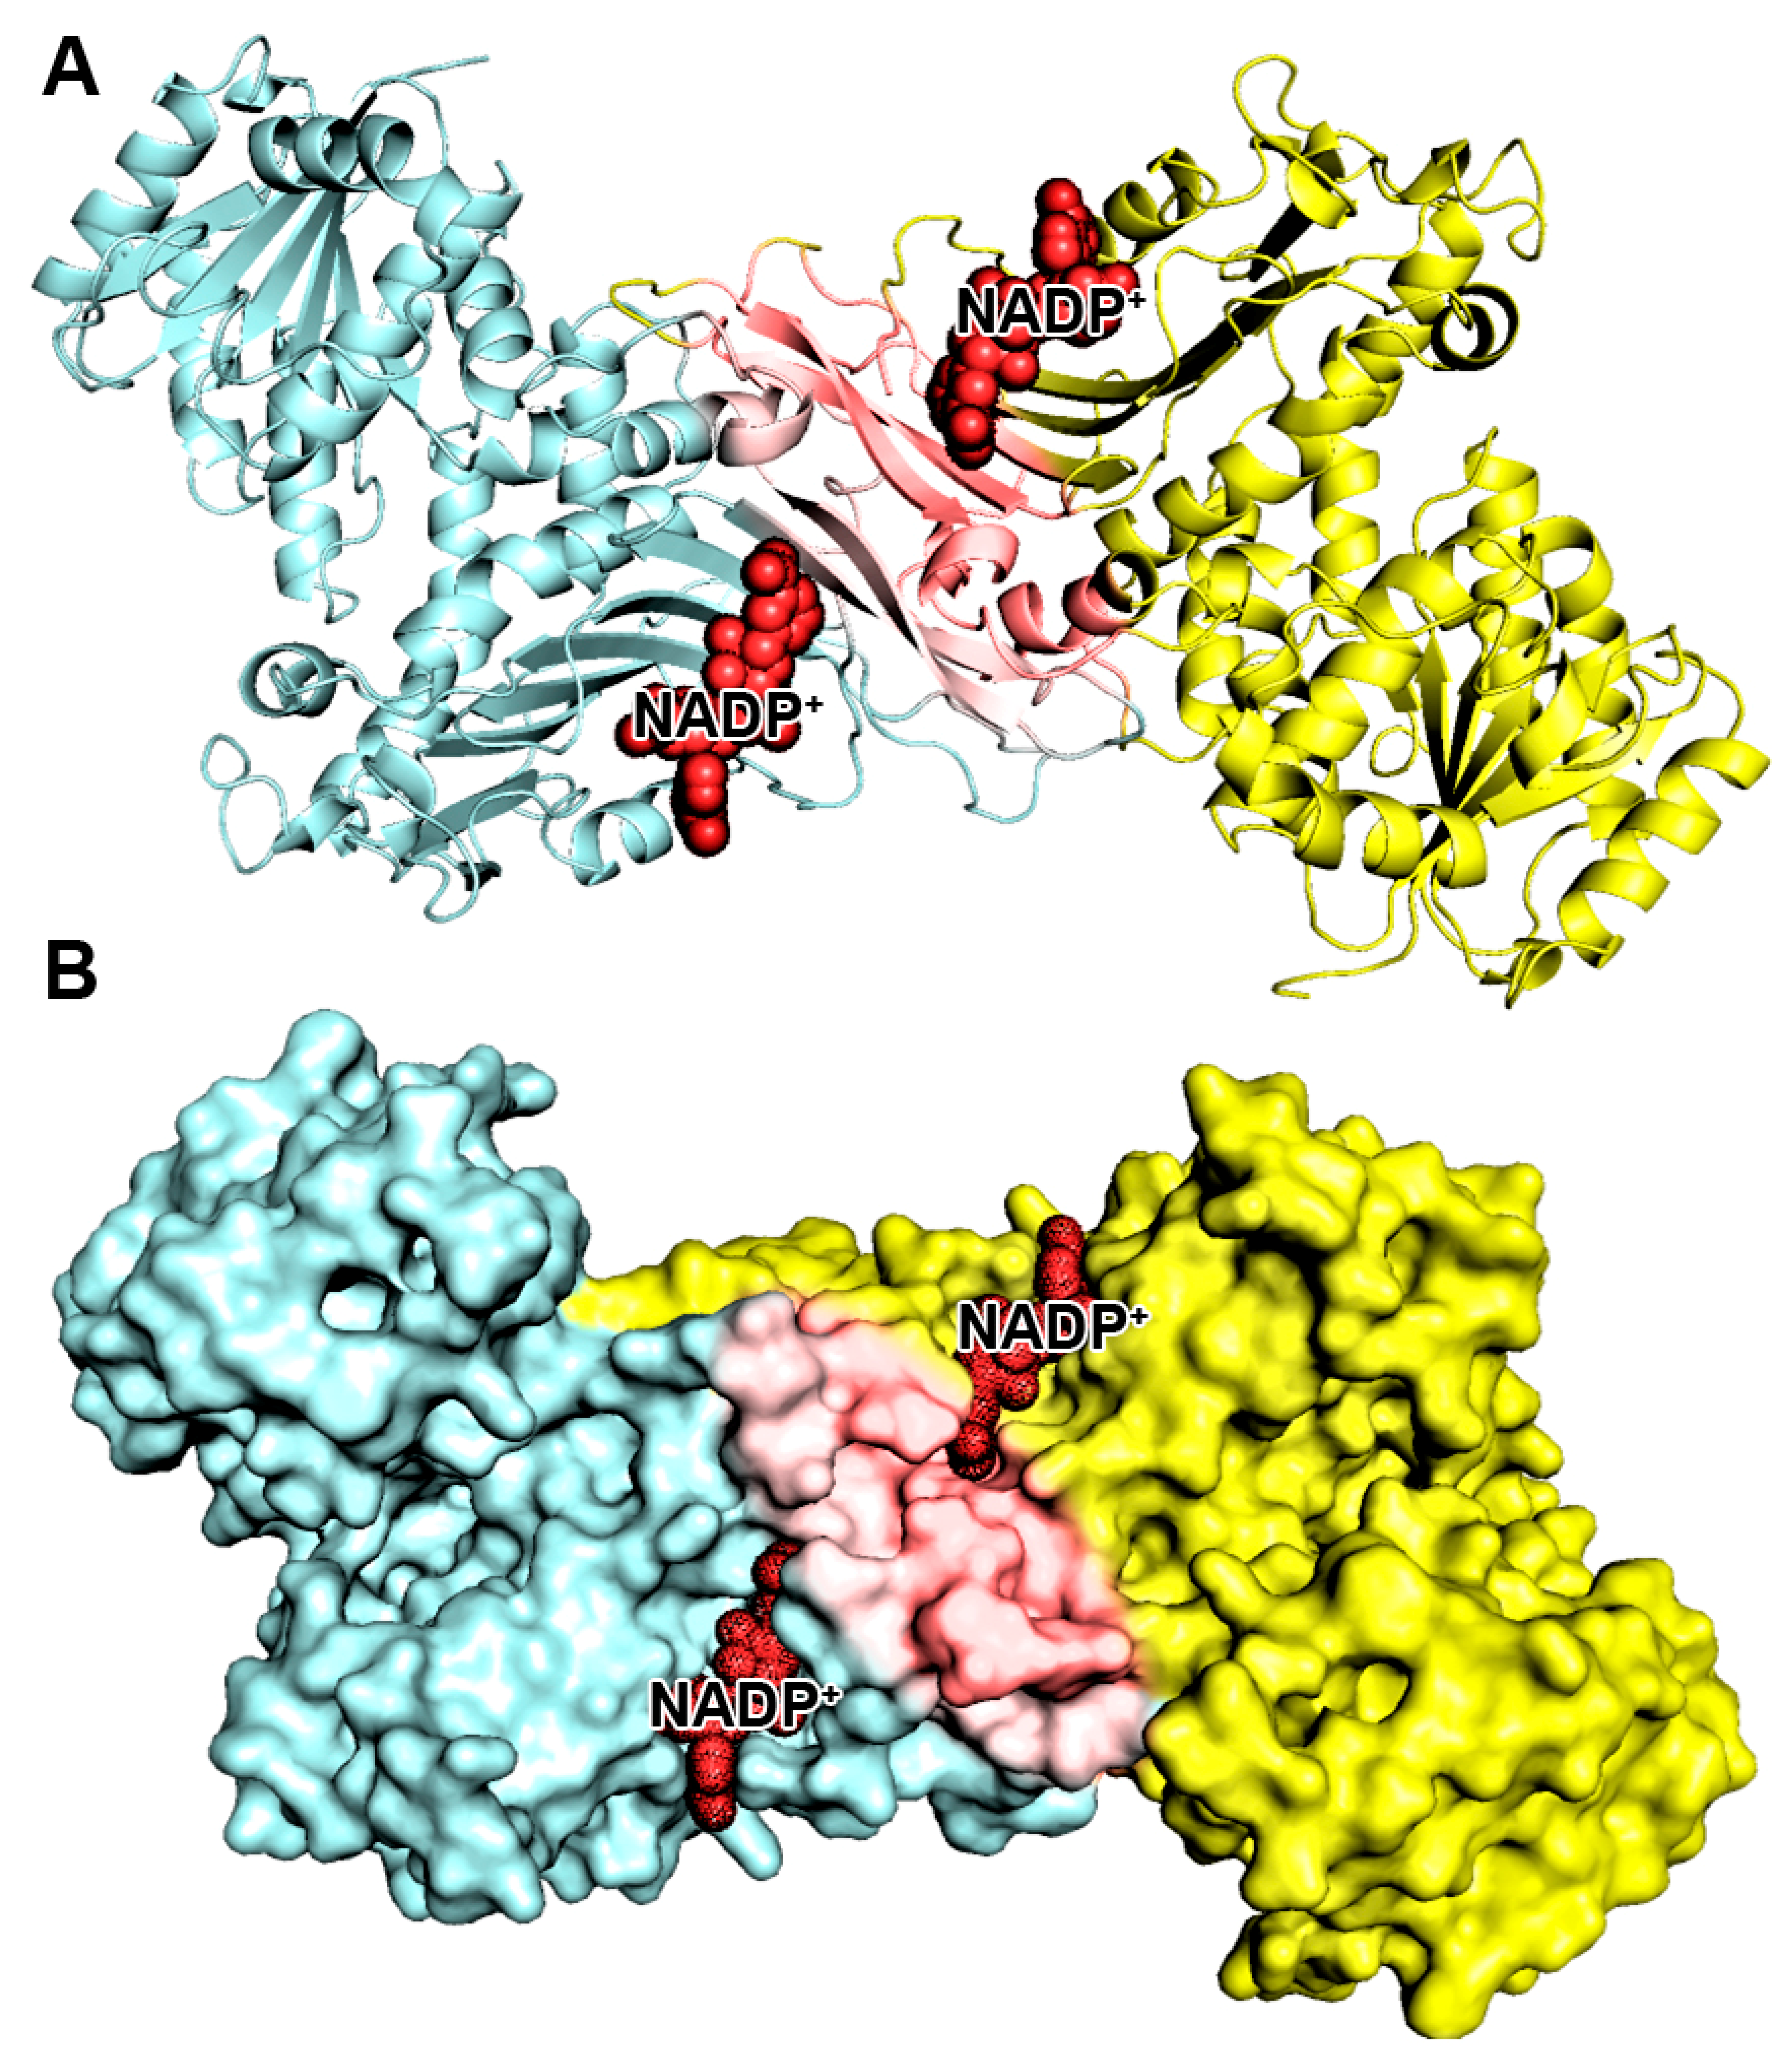
2.1. Target Protein Preparation
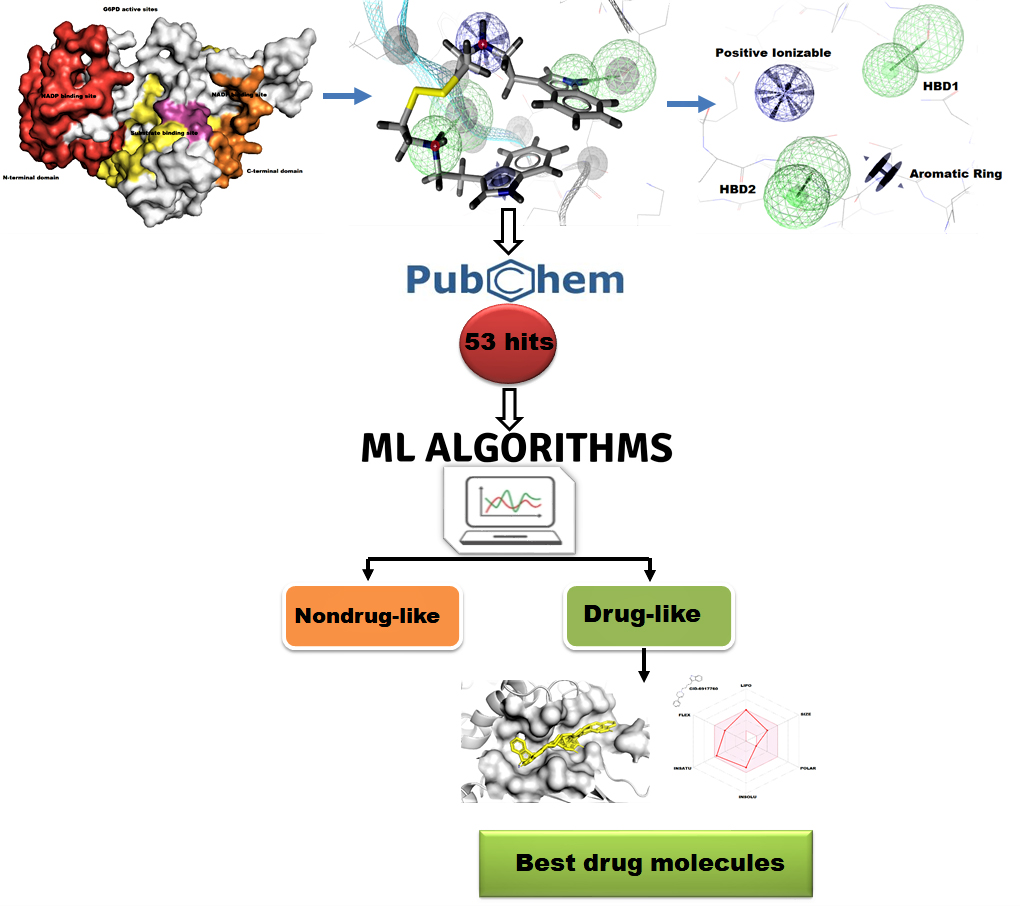
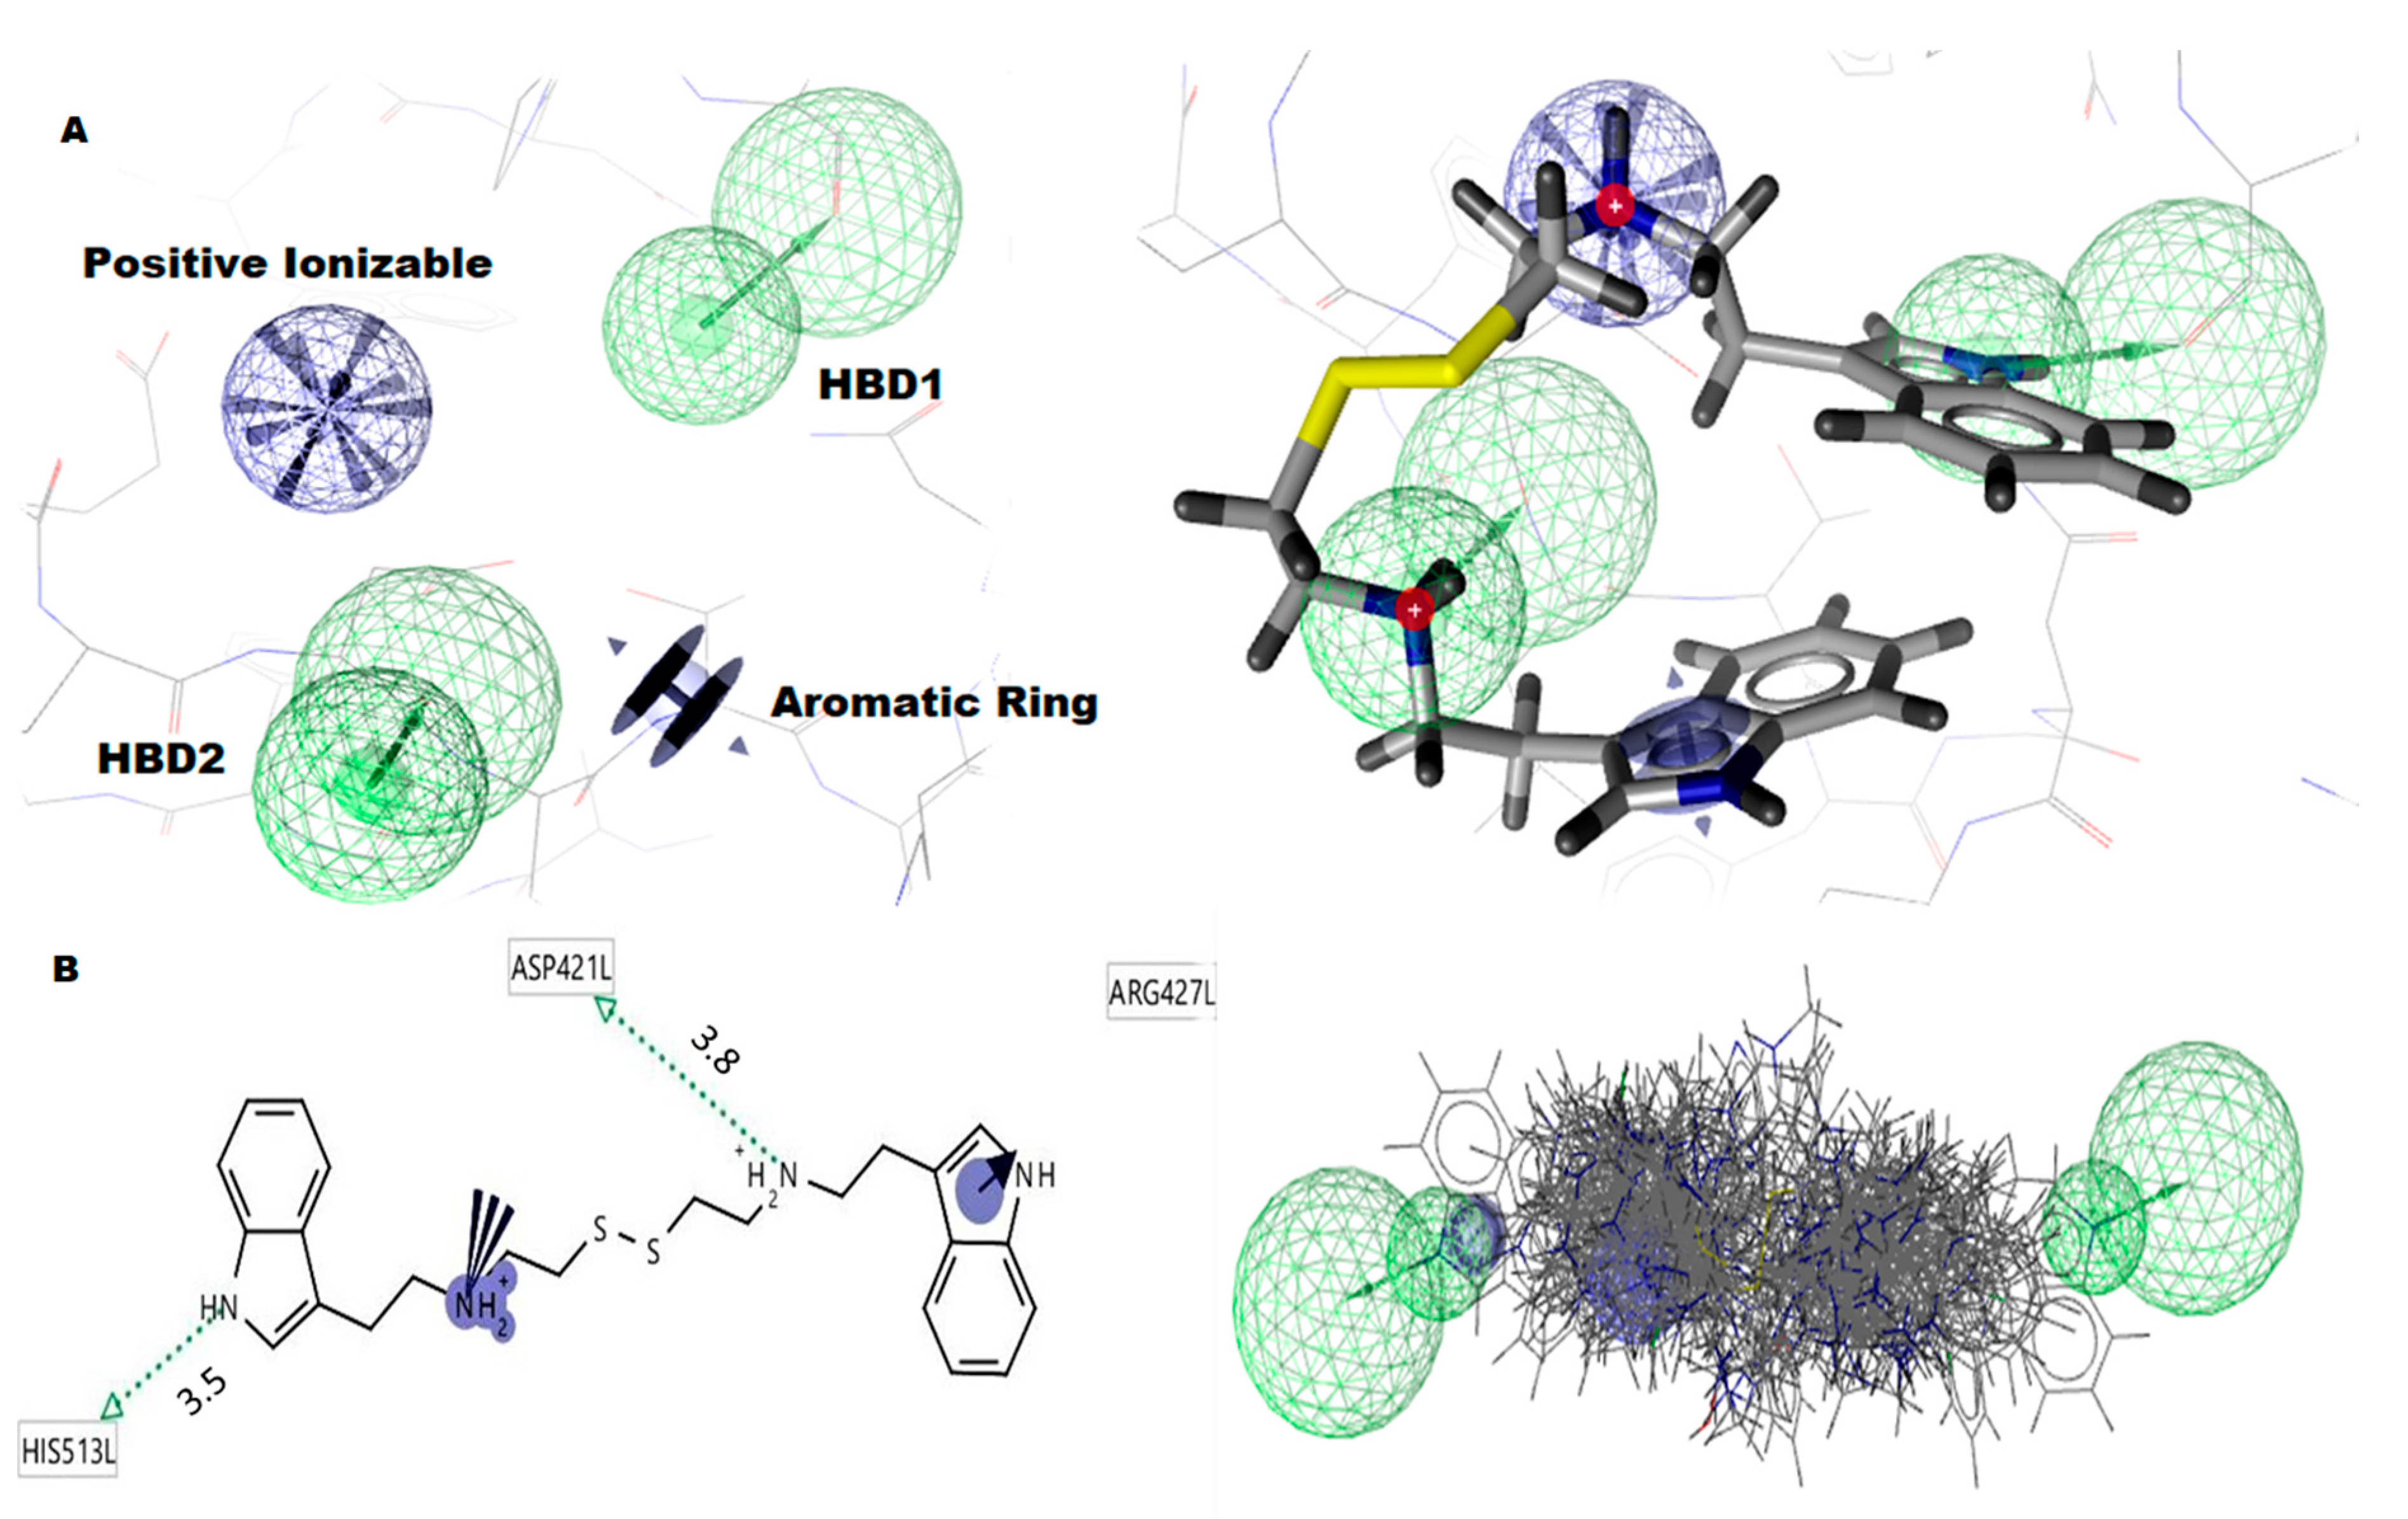
2.2. Pharmacophore Modeling
2.3. Pharmacophore Based Virtual Screening
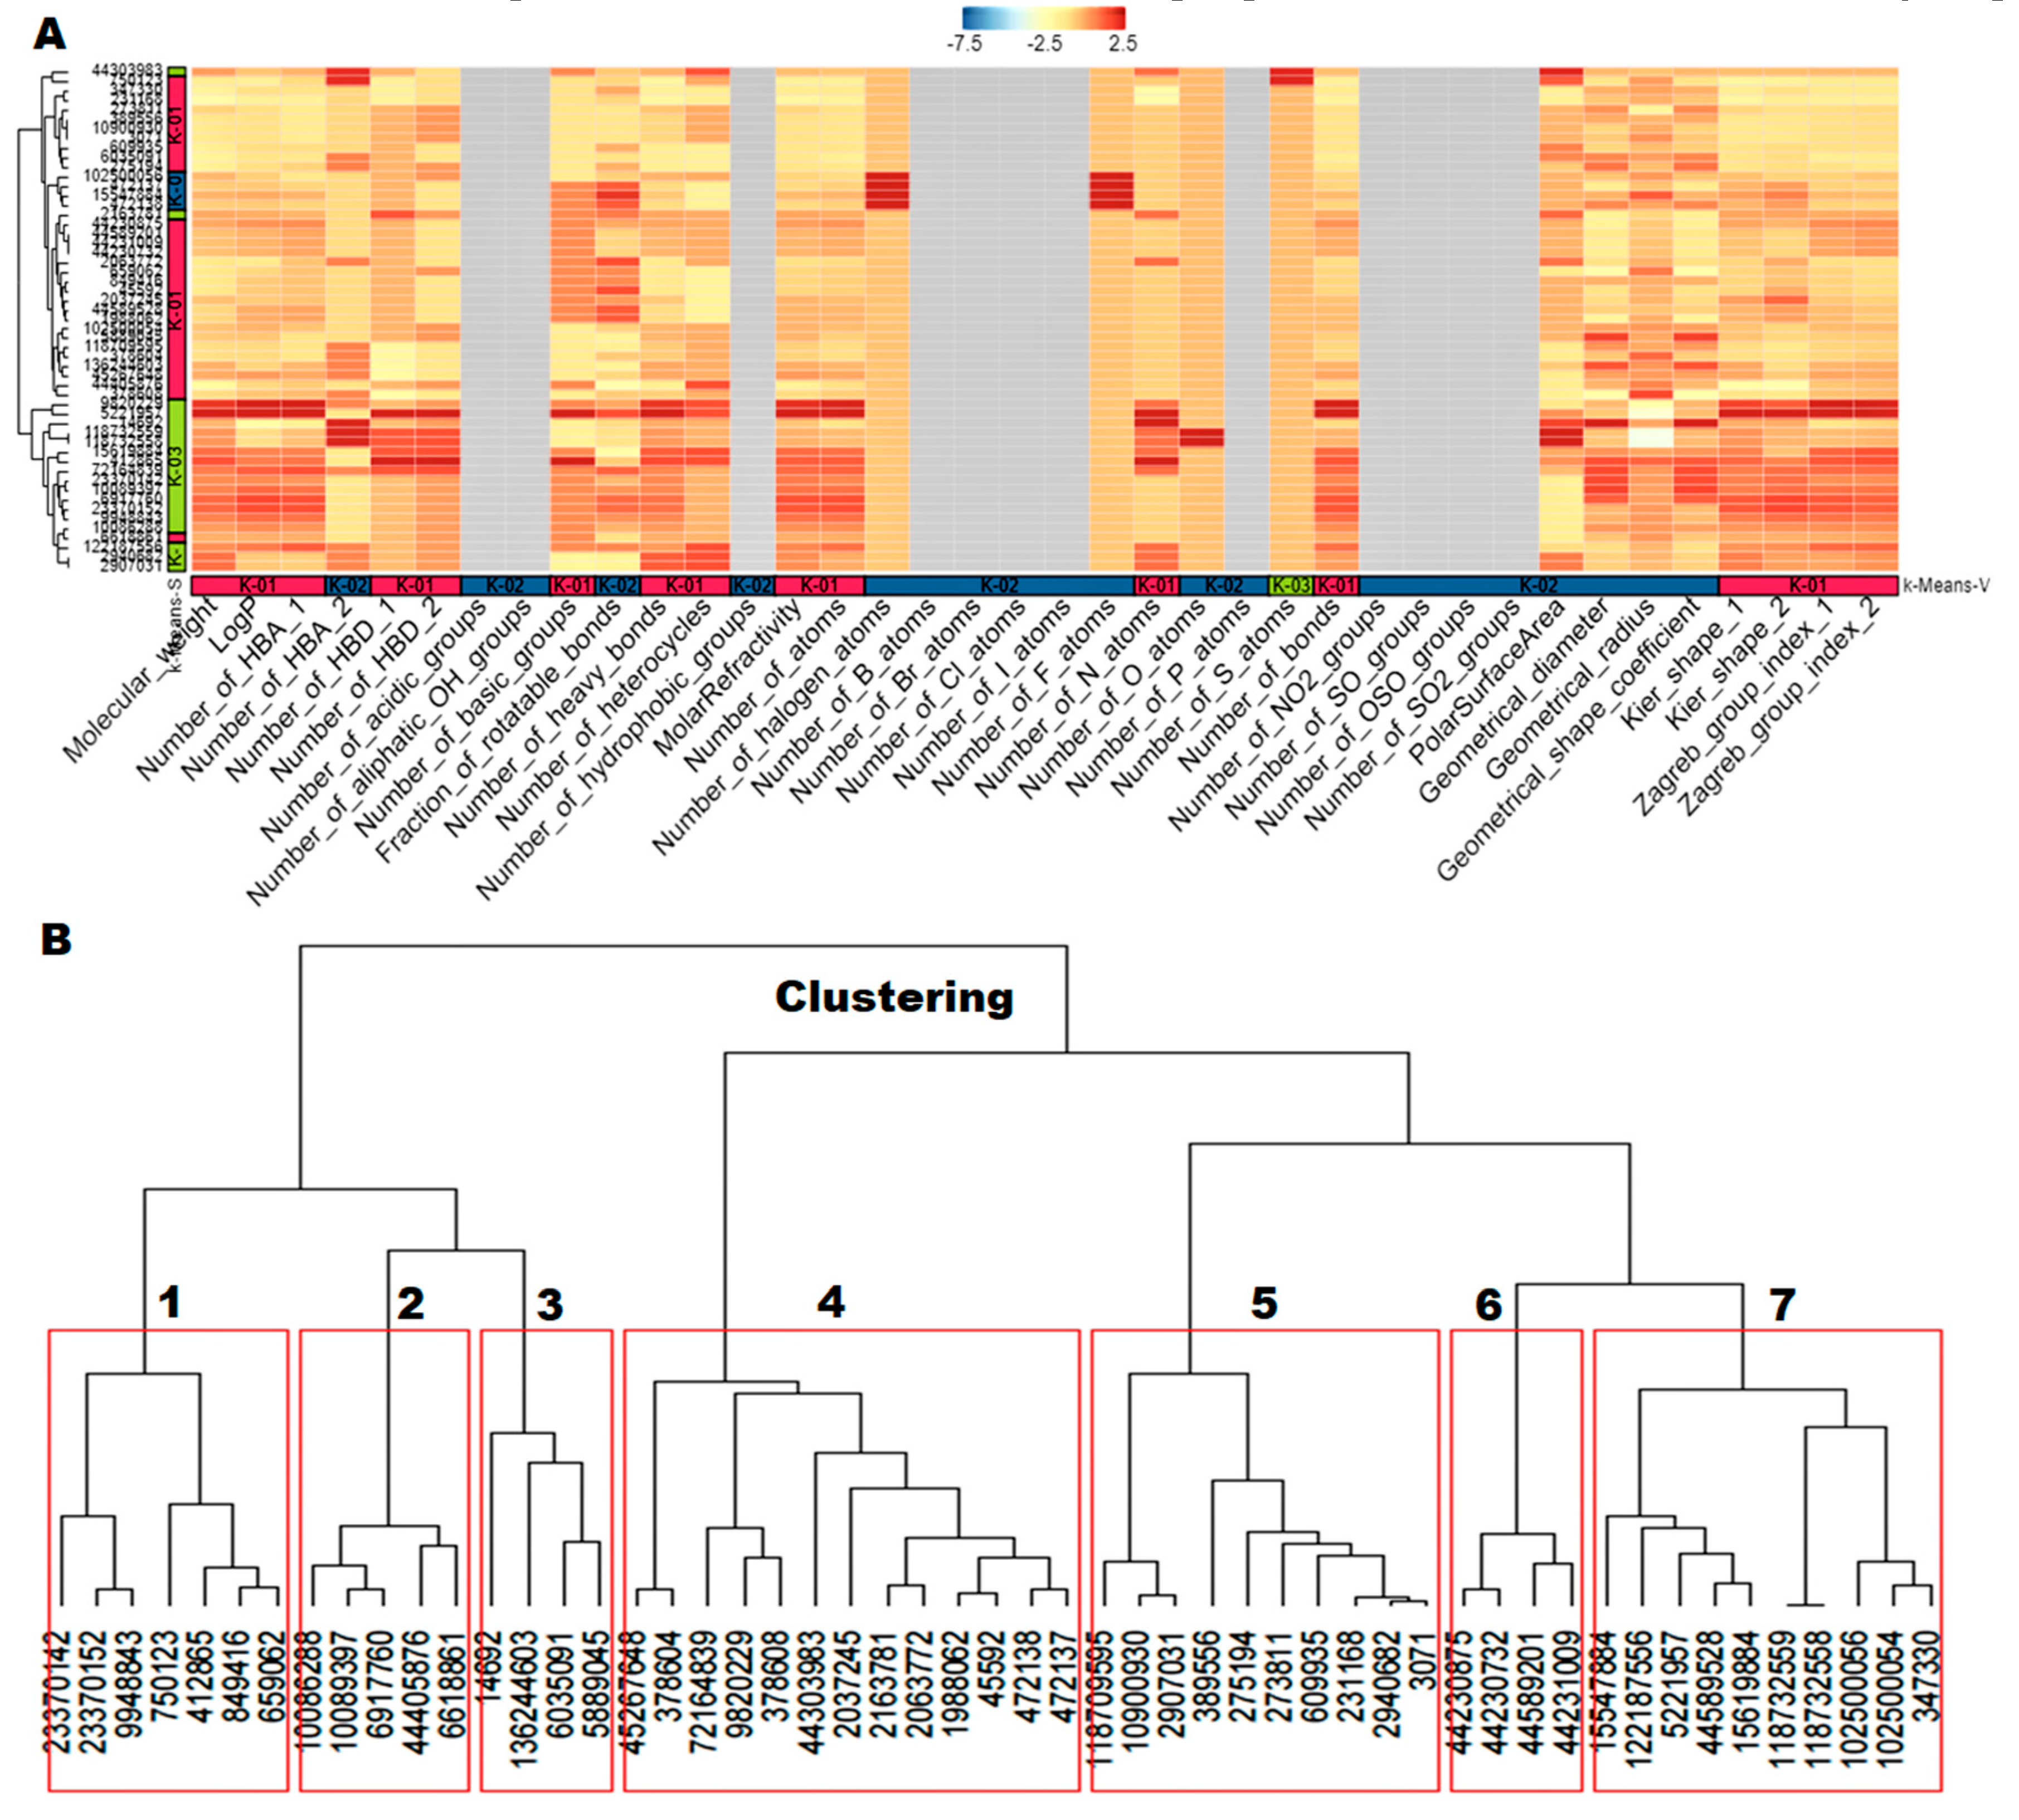
2.4. Molecular Descriptors’ Calculation and Clustering
2.5. Statistical Machine Learning Methods
2.6. Molecular Docking
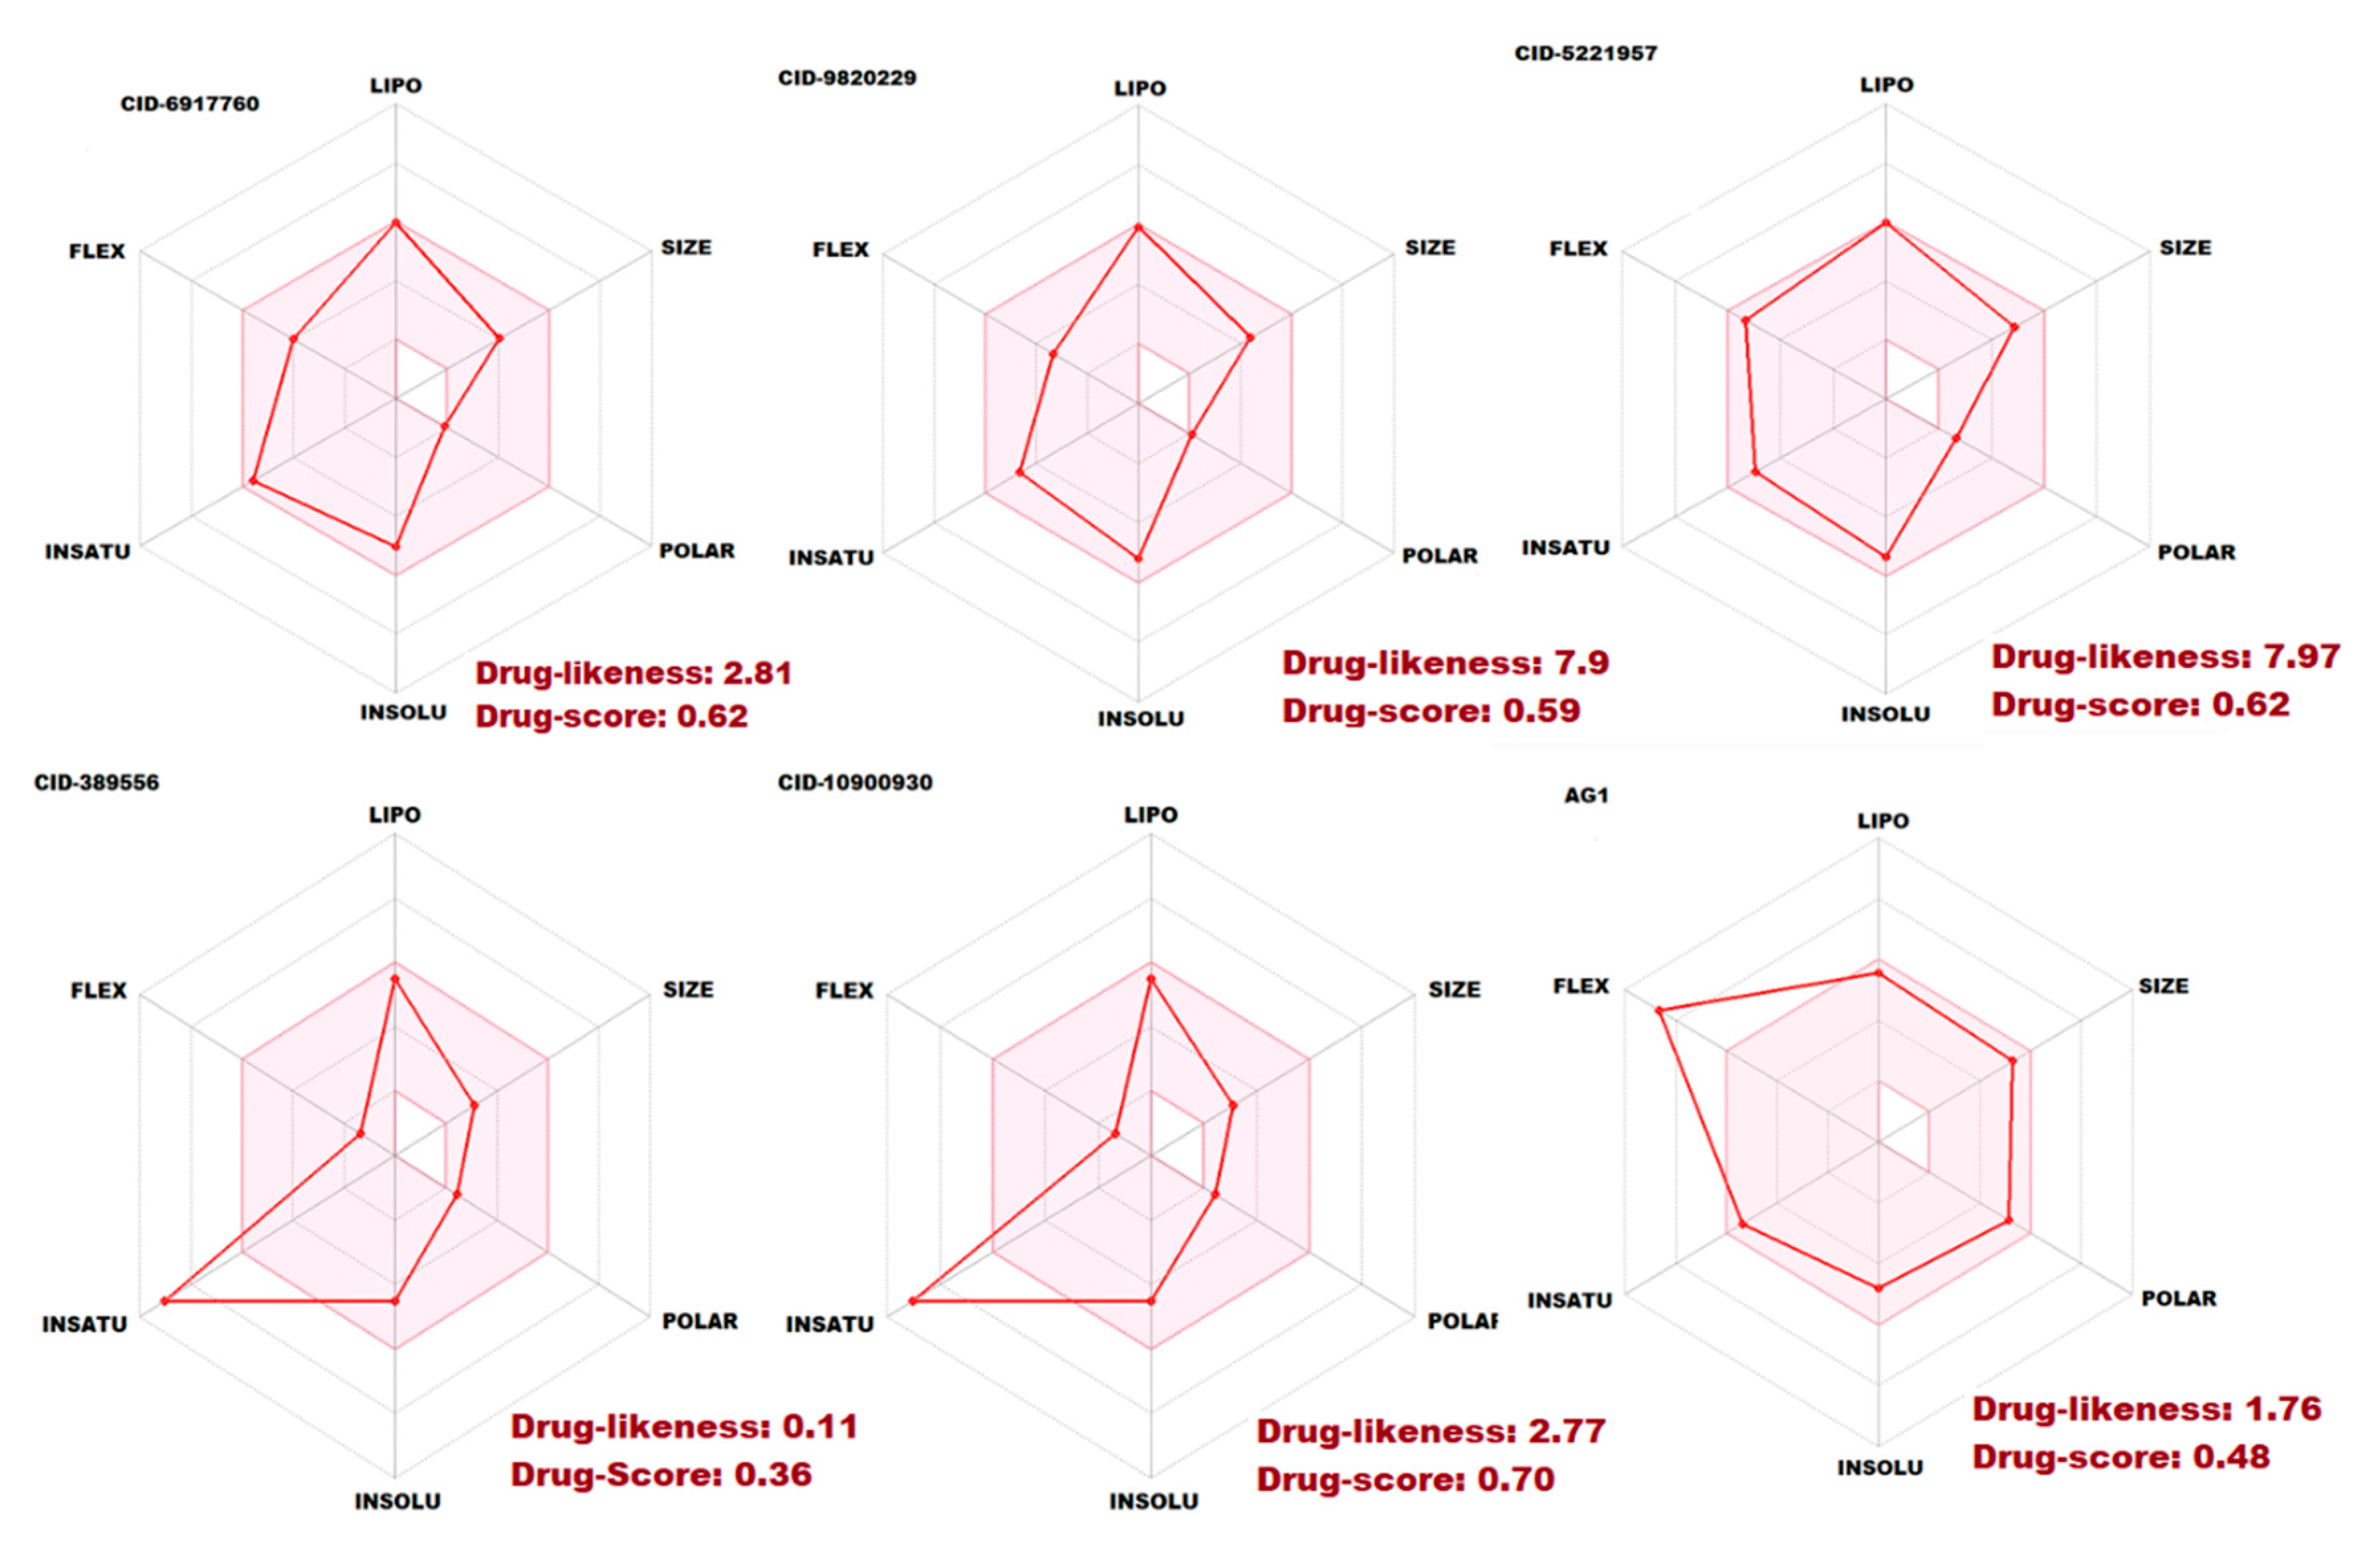
2.7. Pharmacokinetic and Toxicity Risks Assessment
3. Discussion
4. Materials and Methods
4.1. Preparation of Target Protein
4.2. Active Site Prediction
4.3. Generation of the Structure-Based Pharmacophore Model
4.4. Pharmacophore Based Virtual Screening
4.5. Molecular Descriptors Calculation and Clustering
4.6. Statistical Machine Learning Methods
4.7. Model Evaluation
4.8. Molecular Docking
4.9. Pharmacokinetics and Toxicity Risks Assessment
5. Conclusions and Future Directions
Data Availability
Supplementary Materials
Author Contributions
Funding
Acknowledgments
Conflicts of Interest
References
- Cappellini, M.D.; Fiorelli, G. Glucose-6-phosphate dehydrogenase deficiency. Lancet 2008, 371, 64–74. [Google Scholar] [CrossRef]
- Carvalho, C.G.; Castro, S.M.; Santin, A.P.; Zaleski, C.; Carvalho, F.G.; Giugliani, R. Glucose-6-phosphate-dehydrogenase deficiency and its correlation with other risk factors in jaundiced newborns in southern brazil. Asian Pac. J. Trop. Biomed. 2011, 1, 110–113. [Google Scholar] [CrossRef]
- Tsai, K.J.; Hung, I.J.; Chow, C.K.; Stern, A.; Chao, S.S.; Chiu, D.T. Impaired production of nitric oxide, superoxide, and hydrogen peroxide in glucose 6-phosphate-dehydrogenase-deficient granulocytes. FEBS Lett. 1998, 436, 411–414. [Google Scholar] [CrossRef]
- Naylor, C.E.; Rowland, P.; Basak, A.K.; Gover, S.; Mason, P.J.; Bautista, J.M.; Vulliamy, T.J.; Luzzatto, L.; Adams, M.J. Glucose 6-phosphate dehydrogenase mutations causing enzyme deficiency in a model of the tertiary structure of the human enzyme. Blood 1996, 87, 2974–2982. [Google Scholar] [CrossRef]
- Au, S.W.; Gover, S.; Lam, V.M.; Adams, M.J. Human glucose-6-phosphate dehydrogenase: The crystal structure reveals a structural nadp(+) molecule and provides insights into enzyme deficiency. Structure 2000, 8, 293–303. [Google Scholar] [CrossRef]
- Hwang, S.; Mruk, K.; Rahighi, S.; Raub, A.G.; Chen, C.H.; Dorn, L.E.; Horikoshi, N.; Wakatsuki, S.; Chen, J.K.; Mochly-Rosen, D. Correcting glucose-6-phosphate dehydrogenase deficiency with a small-molecule activator. Nat. Commun. 2018, 9, 4045. [Google Scholar] [CrossRef]
- Raub, A.G.; Hwang, S.; Horikoshi, N.; Cunningham, A.D.; Rahighi, S.; Wakatsuki, S.; Mochly-Rosen, D. Small-molecule activators of glucose-6-phosphate dehydrogenase (g6pd) bridging the dimer interface. Chem. Med. Chem. 2019, 14, 1321–1324. [Google Scholar] [CrossRef]
- Domingo, G.J.; Advani, N.; Satyagraha, A.W.; Sibley, C.H.; Rowley, E.; Kalnoky, M.; Cohen, J.; Parker, M.; Kelley, M. Addressing the gender-knowledge gap in glucose-6-phosphate dehydrogenase deficiency: Challenges and opportunities. Int. Health 2019, 11, 7–14. [Google Scholar] [CrossRef]
- Thiel, B.; Sharma, A.; Shaikh, S. Retinitis pigmentosa associated with glucose-6-phosphate dehydrogenase deficiency. Cureus 2017, 9, e1506. [Google Scholar] [CrossRef]
- Komeima, K.; Rogers, B.S.; Lu, L.; Campochiaro, P.A. Antioxidants reduce cone cell death in a model of retinitis pigmentosa. Proc. Natl. Acad. Sci. USA 2006, 103, 11300–11305. [Google Scholar] [CrossRef]
- Komeima, K.; Rogers, B.S.; Campochiaro, P.A. Antioxidants slow photoreceptor cell death in mouse models of retinitis pigmentosa. J. Cell. Physiol. 2007, 213, 809–815. [Google Scholar] [CrossRef] [PubMed]
- Cappai, G.; Songini, M.; Doria, A.; Cavallerano, J.D.; Lorenzi, M. Increased prevalence of proliferative retinopathy in patients with type 1 diabetes who are deficient in glucose-6-phosphate dehydrogenase. Diabetologia 2011, 54, 1539–1542. [Google Scholar] [CrossRef] [PubMed][Green Version]
- Huang, H.; Lennikov, A.; Saddala, M.S.; Gozal, D.; Grab, D.J.; Khalyfa, A.; Fan, L. Placental growth factor negatively regulates retinal endothelial cell barrier function through suppression of glucose-6-phosphate dehydrogenase and antioxidant defense systems. FASEB J. Off. Publ. Fed. Am. Soc. Exp. Biol. 2019, 33, 13695–13709. [Google Scholar] [CrossRef] [PubMed]
- Koes, D.R.; Camacho, C.J. Pharmer: Efficient and exact pharmacophore search. J. Chem. Inf. modeling 2011, 51, 1307–1314. [Google Scholar] [CrossRef]
- Baell, J.B.; Holloway, G.A. New substructure filters for removal of pan assay interference compounds (pains) from screening libraries and for their exclusion in bioassays. J. Med. Chem. 2010, 53, 2719–2740. [Google Scholar] [CrossRef] [PubMed]
- Tetko, I.V.; Gasteiger, J.; Todeschini, R.; Mauri, A.; Livingstone, D.; Ertl, P.; Palyulin, V.; Radchenko, E.; Zefirov, N.S.; Makarenko, A.S.; et al. Virtual computational chemistry laboratory - design and description. J. Comput. Aided Mol. Des. 2005, 19, 453–463. [Google Scholar] [CrossRef]
- Wegner, J.K.; Frohlich, H.; Zell, A. Feature selection for descriptor based classification models. 2. Human intestinal absorption (hia). J. Chem. Inf. Comput. Sci. 2004, 44, 931–939. [Google Scholar] [CrossRef]
- Korkmaz, S.; Zararsiz, G.; Goksuluk, D. Drug/nondrug classification using support vector machines with various feature selection strategies. Comput. Methods Programs Biomed. 2014, 117, 51–60. [Google Scholar] [CrossRef]
- Luzzatto, L.; Nannelli, C.; Notaro, R. Glucose-6-phosphate dehydrogenase deficiency. Hematol. Oncol. Clin. 2016, 30, 373–393. [Google Scholar] [CrossRef]
- Heymann, A.D.; Cohen, Y.; Chodick, G. Glucose-6-phosphate dehydrogenase deficiency and type 2 diabetes. Diabetes Care 2012, 35, e58. [Google Scholar] [CrossRef]
- Jeng, W.; Loniewska, M.M.; Wells, P.G. Brain glucose-6-phosphate dehydrogenase protects against endogenous oxidative DNA damage and neurodegeneration in aged mice. ACS Chem. Neurosci. 2013, 4, 1123–1132. [Google Scholar] [CrossRef] [PubMed]
- Hecker, P.A.; Lionetti, V.; Ribeiro, R.F., Jr.; Rastogi, S.; Brown, B.H.; O’Connell, K.A.; Cox, J.W.; Shekar, K.C.; Gamble, D.M.; Sabbah, H.N.; et al. Glucose 6-phosphate dehydrogenase deficiency increases redox stress and moderately accelerates the development of heart failure. Circ. Heart Fail. 2013, 6, 118–126. [Google Scholar] [CrossRef] [PubMed]
- Nair, V.; Hasan, S.U.; Romanchuk, K.; Al Awad, E.; Mansoor, A.; Yusuf, K. Bilateral cataracts associated with glucose-6-phosphate dehydrogenase deficiency. J. Perinatol. Off. J. Calif. Perinat. Assoc. 2013, 33, 574–575. [Google Scholar] [CrossRef] [PubMed][Green Version]
- Hakeem, G.L.A.; Naeem, E.A.A.; Swelam, S.H.; Fotoh, L.E.A.; El Mazary, A.A.M.; Fadil, A.M.A.; Hafez, A.H.A. Detection of occult acute kidney injury in glucose-6-phosphate dehydrogenase deficiency anemia. Mediterr. J. Hematol. Infect. Dis. 2016, 8. [Google Scholar]
- Van Wijk, R.; Huizinga, E.G.; Prins, I.; Kors, A.; Rijksen, G.; Bierings, M.; van Solinge, W.W. Distinct phenotypic expression of two de novo missense mutations affecting the dimer interface of glucose-6-phosphate dehydrogenase. Blood Cells Mol. Dis. 2004, 32, 112–117. [Google Scholar] [CrossRef] [PubMed]
- Patrinostro, X.; Carter, M.L.; Kramer, A.C.; Lund, T.C. A model of glucose-6-phosphate dehydrogenase deficiency in the zebrafish. Exp. Hematol. 2013, 41, 697–710.e692. [Google Scholar] [CrossRef][Green Version]
- Rochford, R.; Ohrt, C.; Baresel, P.C.; Campo, B.; Sampath, A.; Magill, A.J.; Tekwani, B.L.; Walker, L.A. Humanized mouse model of glucose 6-phosphate dehydrogenase deficiency for in vivo assessment of hemolytic toxicity. Proc. Natl. Acad. Sci. USA 2013, 110, 17486–17491. [Google Scholar] [CrossRef]
- Binkowski, T.A.; Naghibzadeh, S.; Liang, J. Castp: Computed atlas of surface topography of proteins. Nucleic Aacids Res. 2003, 31, 3352–3355. [Google Scholar] [CrossRef]
- Saddala, M.S.; Huang, H. Identification of novel inhibitors for tnfalpha, tnfr1 and tnfalpha-tnfr1 complex using pharmacophore-based approaches. J. Transl. Med. 2019, 17, 215. [Google Scholar] [CrossRef]
- Tian, W.; Liang, J. On quantification of geometry and topology of protein pockets and channels for assessing mutation effects. In Proceedings of the IEEE-EMBS International Conference on Biomedical and Health Informatics, Las Vegas, NV, USA, 4–7 March 2018; Volume 2018, pp. 263–266. [Google Scholar]
- Mukund, V.; Saddala, M.S.; Farran, B.; Mannavarapu, M.; Alam, A.; Nagaraju, G.P. Molecular docking studies of angiogenesis target protein hif-1alpha and genistein in breast cancer. Gene 2019, 701, 169–172. [Google Scholar] [CrossRef]
- Wolber, G.; Seidel, T.; Bendix, F.; Langer, T. Molecule-pharmacophore superpositioning and pattern matching in computational drug design. Drug Discov. Today 2008, 13, 23–29. [Google Scholar] [CrossRef] [PubMed]
- Saddala, M.S.; Adi, P.J. Discovery of small molecules through pharmacophore modeling, docking and molecular dynamics simulation against plasmodium vivax vivapain-3 (vp-3). Heliyon 2018, 4, e00612. [Google Scholar] [CrossRef] [PubMed]
- Garcia-Sosa, A.T.; Oja, M.; Hetenyi, C.; Maran, U. Druglogit: Logistic discrimination between drugs and nondrugs including disease-specificity by assigning probabilities based on molecular properties. J. Chem. Inf. Model. 2012, 52, 2165–2180. [Google Scholar] [CrossRef] [PubMed]
- Bodenhofer, U.; Kothmeier, A.; Hochreiter, S. Apcluster: An r package for affinity propagation clustering. Bioinformatics 2011, 27, 2463–2464. [Google Scholar] [CrossRef] [PubMed]
- Cao, Y.; Charisi, A.; Cheng, L.C.; Jiang, T.; Girke, T. Chemminer: A compound mining framework for r. Bioinformatics 2008, 24, 1733–1734. [Google Scholar] [CrossRef] [PubMed]
- Raymond, J.W.; Gardiner, E.J.; Willett, P. Heuristics for similarity searching of chemical graphs using a maximum common edge subgraph algorithm. J. Chem. Inf. Comput. Sci. 2002, 42, 305–316. [Google Scholar] [CrossRef] [PubMed]
- Holliday, J.D.; Salim, N.; Whittle, M.; Willett, P. Analysis and display of the size dependence of chemical similarity coefficients. J. Chem. Inf. Comput. Sci. 2003, 43, 819–828. [Google Scholar] [CrossRef]
- Plewczynski, D.; von Grotthuss, M.; Rychlewski, L.; Ginalski, K. Virtual high throughput screening using combined random forest and flexible docking. Comb. Chem. High Throughput Screen. 2009, 12, 484–489. [Google Scholar]
- Miller, D.W. Results of a new classification algorithm combining k nearest neighbors and recursive partitioning. J. Chem. Inf. Comput. Sci. 2001, 41, 168–175. [Google Scholar] [CrossRef]
- Todorov, V.; Filzmoser, P. An object-oriented framework for robust multivariate analysis. J. Stat. Softw. 2009, 32, 1–47. [Google Scholar] [CrossRef]
- Korkmaz, S.; Zararsiz, G.; Goksuluk, D. Mlvis: A web tool for machine learning-based virtual screening in early-phase of drug discovery and development. PLoS ONE 2015, 10, e0124600. [Google Scholar] [CrossRef] [PubMed]
- Breiman, L. Random forests. Mach. Learn. 2001, 45, 5–32. [Google Scholar] [CrossRef]
- Dong, L.J.; Li, X.B.; Peng, K. Prediction of rockburst classification using random forest. Trans. Nonferr. Metal. Soc. 2013, 23, 472–477. [Google Scholar] [CrossRef]
- Cherkassky, V.; Ma, Y.Q. Another look at statistical learning theory and regularization. Neural Netw. 2009, 22, 958–969. [Google Scholar] [CrossRef]
- Bermejo, S.; Cabestany, J. Adaptive soft k-nearest-neighbour classifiers. Pattern Recogn. 2000, 33, 1999–2005. [Google Scholar] [CrossRef]
- Pochet, N.; De Smet, F.; Suykens, J.A.K.; De Moor, B.L.R. Systematic benchmarking of microarray data classification: Assessing the role of non-linearity and dimensionality reduction. Bioinformatics 2004, 20, 3185–3195. [Google Scholar] [CrossRef]
- Saddala, M.S.; Kandimalla, R.; Adi, P.J.; Bhashyam, S.S.; Asupatri, U.R. Novel 1, 4-dihydropyridines for l-type calcium channel as antagonists for cadmium toxicity. Sci. Rep. 2017, 7. [Google Scholar] [CrossRef]
- Latha, M.S.; Saddala, M.S. Molecular docking based screening of a simulated hif-1 protein model for potential inhibitors. Bioinformation 2017, 13, 388–393. [Google Scholar] [CrossRef]
- Trott, O.; Olson, A.J. Software news and update autodock vina: Improving the speed and accuracy of docking with a new scoring function, efficient optimization, and multithreading. J. Comput. Chem. 2010, 31, 455–461. [Google Scholar]
- Saddala, M.S.; Rani, A.U. Homology modelling, structure-based pharmacophore modelling, high-throughput virtual screening and docking studies of l-type calcium channel for cadmium toxicity. Transl. Med. Res. 2017, 153–175. [Google Scholar] [CrossRef]
- Lipinski, C.A.; Lombardo, F.; Dominy, B.W.; Feeney, P.J. Experimental and computational approaches to estimate solubility and permeability in drug discovery and development settings (reprinted from advanced drug delivery reviews, vol 23, pg 3-25, 1997). Adv. Drug Deliv. Rev. 2001, 46, 3–26. [Google Scholar] [CrossRef]


| PubChem IDs | Smiles Notation | Binding Energies (ΔG) Kcal/mol | Functional Amino Acids |
|---|---|---|---|
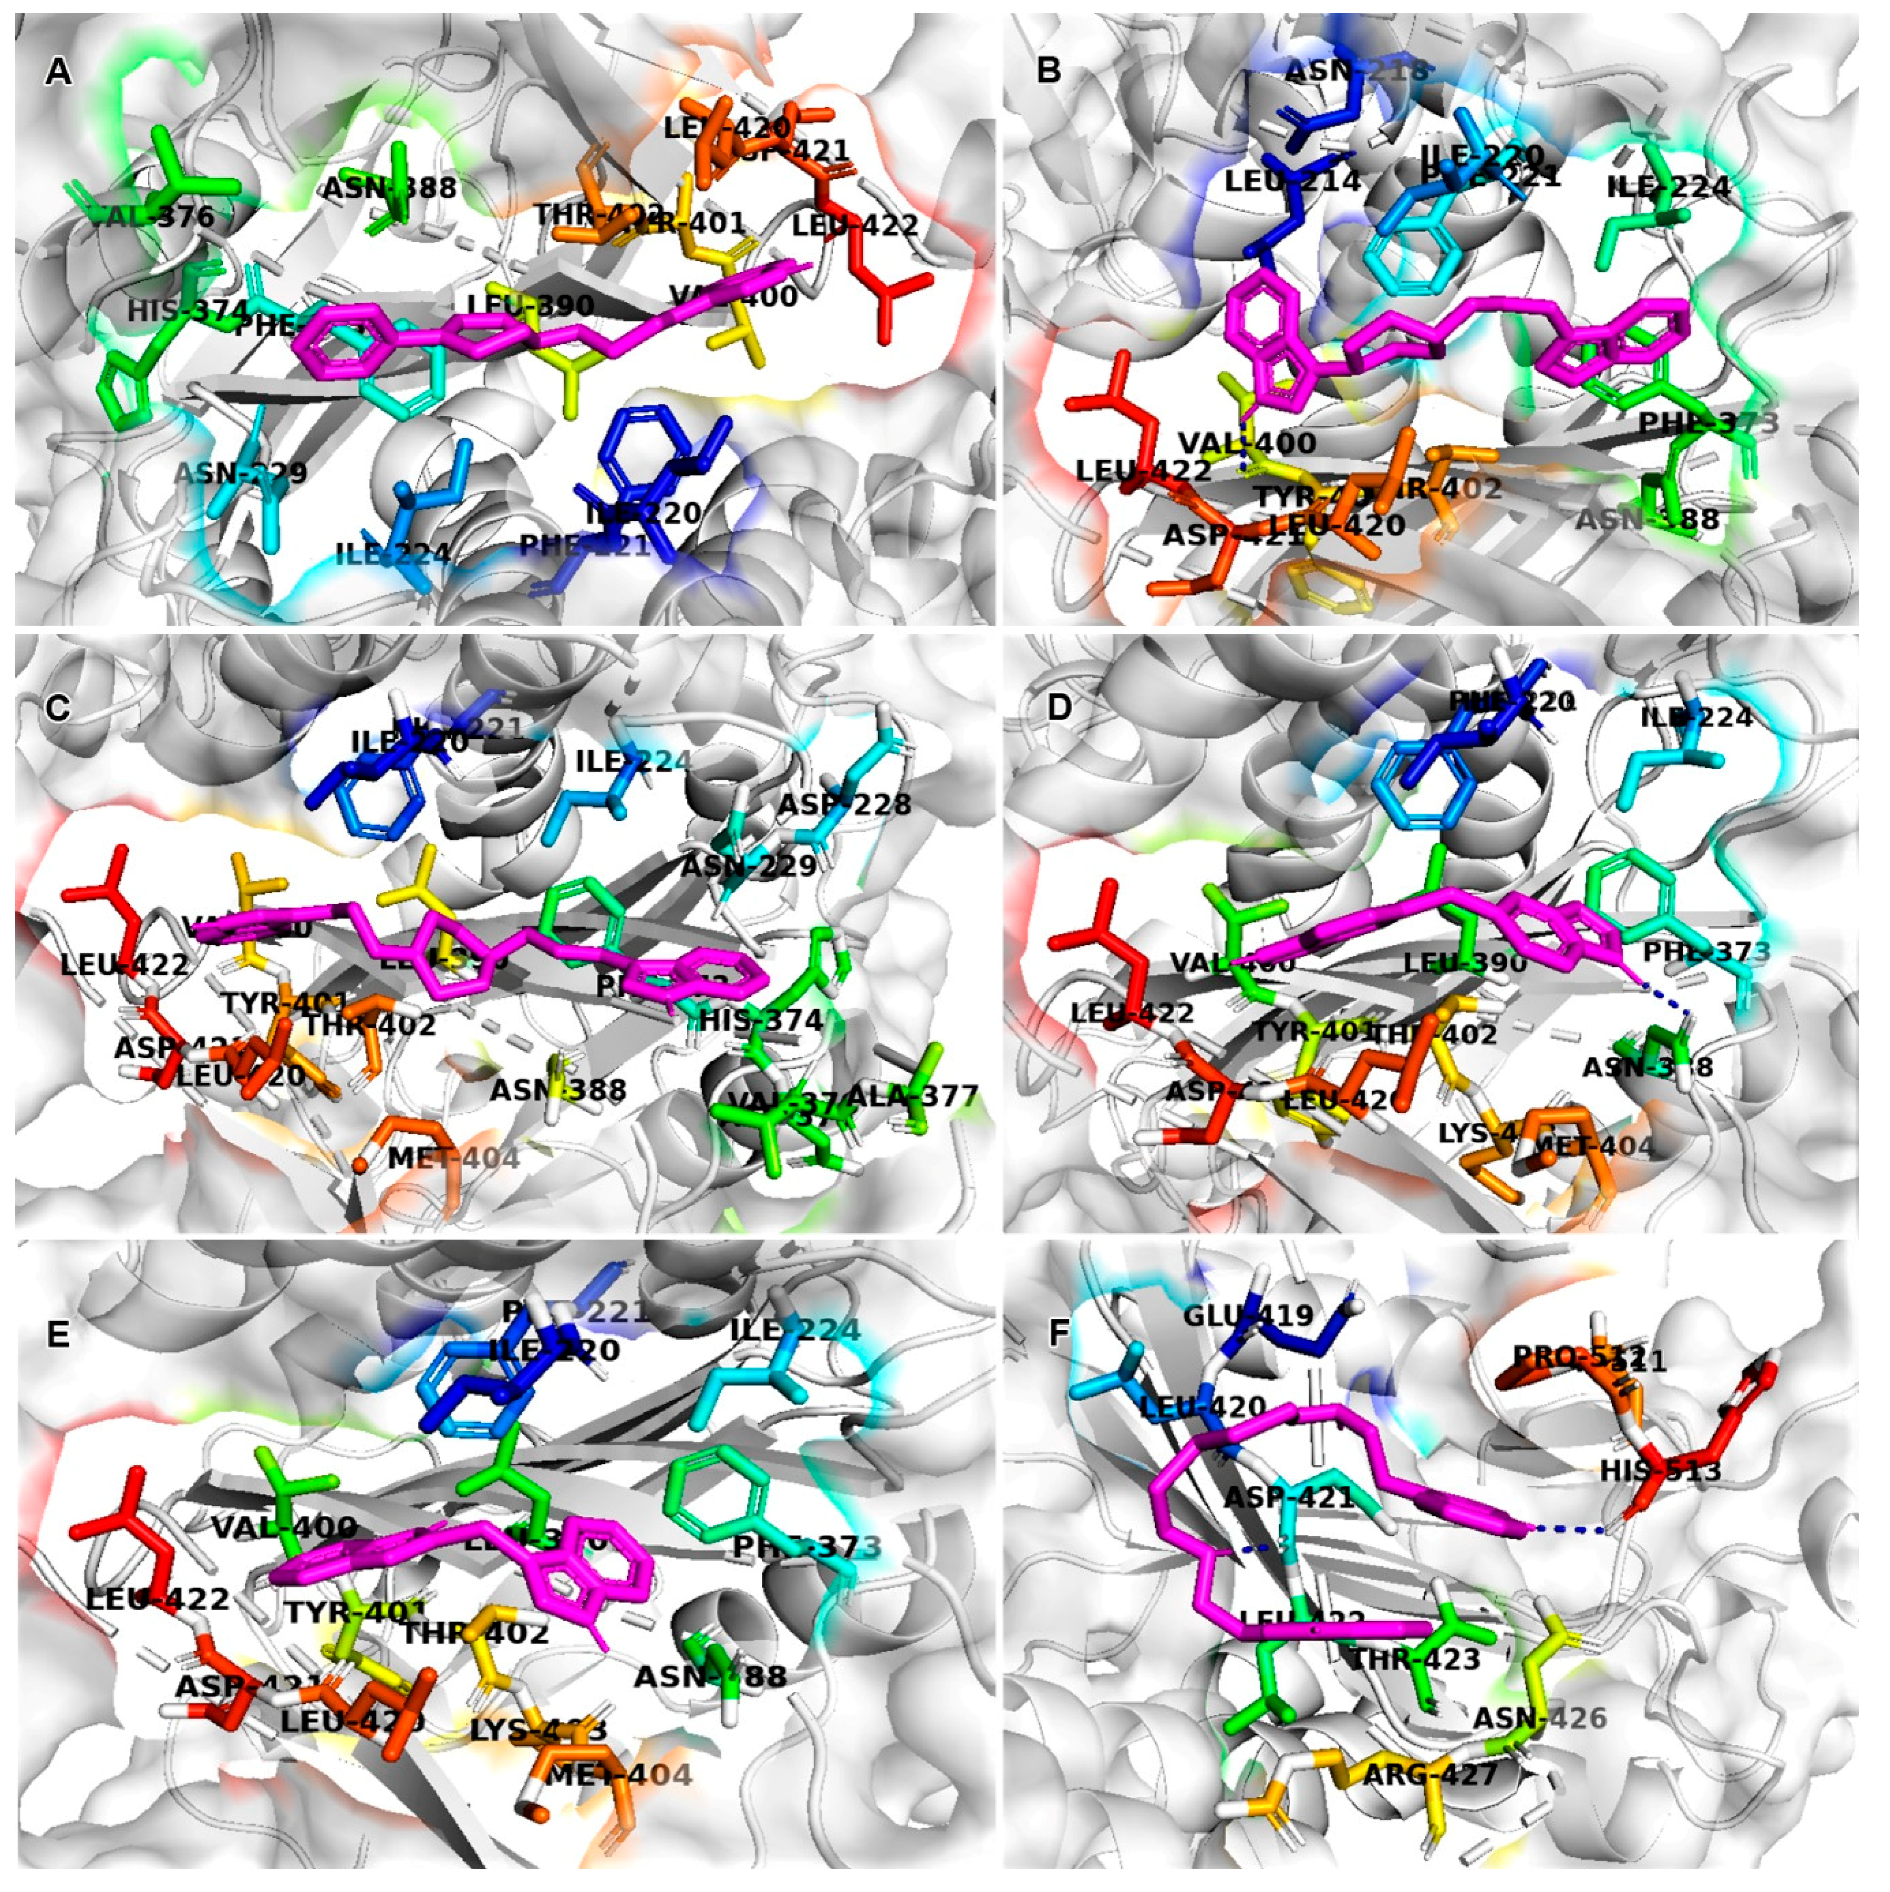
| CID6917760 | C1CN(CC=C1C2=CC=CC=C2)CCCCC3=CNC4=CC=CC=C43 | ne–8.9 | ILE220, PHE221, ASN229, ASN388, ILE224, PHE373, TYR401, VAL400, THR402, ASP421, LEU420, LEU422 |
| CID9820229 | C1CN(CCC1C2=CNC3=CC=CC=C32)CCCN4CCC5=CC=CC=C54 | ne–7.6 | LEU214, PHE221, LEU420, THR402, ILE220, PHE373, ASN388, ILU224, LEU422 |
| CID5221957 | C1CN(CCN1CCCC2=CNC3=CC=CC=C32)CCCC4=CNC5=CC=CC=C54 | ne–7.3 | ASP421, LEU422, TYR401, LEU420, VAL400, THR402, PHE373, ILE224, ASN388, HIS374, ASP375, ASN229, VAL376, PHE221, ILE220 |
| CID389556 | C1=CC2=C(C=CN2)C=C1CC3=CC4=C(C=C3)NC=C4 | ne–7.2 | LEU420, VAL400, ASP421, TYR401, THR402, LEU422, PHE373, ASN388, ILE224, PHE221, ILE220 |
| CID10900930 | C1=CC=C2C(=C1)C=C(N2)CC3=CNC4=CC=CC=C43 | ne–7.0 | PHE373, THR402, LEU422, TYR401, ASP521, LEU420, VAL400, PHE221, ILE220, ASN388 |
| CID6615809 (AG1) | C1=CC=C2C(=C1)C(=CN2)CCNCCSSCCNCCC3=CNC4=CC=CC=C43 | ne–6.1 | LEU420, THR423, ASN426, ASP421, ARG427, LEU422 |
| Descriptors | CID6917760 | CID9820229 | CID5221957 | CID389556 | CID10900930 | AG1 |
|---|---|---|---|---|---|---|
| Physicochemical Properties | ||||||
| Formula | C23H26N2 | C24H29N3 | C26H32N4 | C17H14N2 | C17H14N2 | C24H30N4S2 |
| Molecular weight | 330.47 g/mol | 359.51 g/mol | 400.56 g/mol | 246.31 g/mol | 246.31 g/mol | 438.65 g/mol |
| Num. heavy atoms | 25 | 27 | 30 | 19 | 19 | 30 |
| Num. arom. heavy atoms | 15 | 15 | 18 | 18 | 18 | 18 |
| Fraction Csp3 | 0.03 | 0.42 | 0.38 | 0.06 | 0.06 | 0.33 |
| Num. rotatable bonds | 6 | 5 | 8 | 2 | 2 | 13 |
| Num. H-bond acceptors | 1 | 1 | 2 | 0 | 0 | 2 |
| Num. H-bond donors | 1 | 1 | 2 | 2 | 2 | 4 |
| Molar Refractivity | 111.22 | 121.13 | 134.38 | 79.61 | 79.61 | 134.04 |
| TPSA | 19.03 Å2 | 22.27 Å2 | 38.06 Å2 | 31.58 Å2 | 31.58 Å2 | 106.24 Å2 |
| Lipophilicity | ||||||
| Log Po/w (iLOGP) | 3.60 | 3.66 | 3.66 | 2.07 | 2.21 | 3.99 |
| Log Po/w (XLOGP3) | 4.93 | 4.84 | 4.95 | 4.10 | 4.13 | 4.22 |
| Log Po/w (WLOGP) | 4.90 | 4.04 | 4.07 | 4.24 | 4.24 | 5.00 |
| Log Po/w (MLOGP) | 4.16 | 3.83 | 3.24 | 3.00 | 3.00 | 2.83 |
| Log Po/w (SILICOS-IT) | 5.70 | 4.92 | 5.90 | 5.01 | 5.01 | 6.29 |
| Consensus Log Po/w | 4.66 | 4.26 | 4.36 | 3.68 | 3.72 | 4.47 |
| Water Solubility | ||||||
| Log S (ESOL) | ne–5.04 | ne–5.20 | ne–5.36 | ne–4.52 | ne–4.54 | ne–4.80 |
| Solubility | 2.99 × 10⁻³ mg/mL; 9.06 × 10⁻⁶ mol/L | 2.27 × 10⁻³ mg/mL; 6.32 × 10⁻⁶ mol/L | 1.76 × 10⁻³ mg/mL; 4.39 × 10⁻⁶ mol/L | 7.45 × 10⁻³ mg/mL; 3.03 × 10⁻⁵ mol/L | 7.14 × 10⁻³ mg/mL; 2.90 × 10⁻⁵ mol/L | 6.88 × 10⁻³ mg/mL; 1.57 × 10⁻⁵ mol/L |
| Class | Moderately soluble | Moderately soluble | Moderately soluble | Moderately soluble | Moderately soluble | Moderately soluble |
| Log S (Ali) | ne–5.07 | ne–5.04 | ne–5.49 | ne–4.47 | ne–4.50 | ne–6.16 |
| Solubility | 2.83 × 10⁻³ mg/mL; 8.58 × 10⁻⁶ mol/L | 3.27 × 10⁻³ mg/mL; 9.09 × 10⁻⁶ mol/L | 1.30 × 10⁻³ mg/mL; 3.26 × 10⁻⁶ mol/L | 8.37 × 10⁻³ mg/mL; 3.40 × 10⁻⁵ mol/L | 7.79 × 10⁻³ mg/mL; 3.16 × 10⁻⁵ mol/L | 3.03 × 10⁻⁴ mg/mL; 6.90 × 10⁻⁷ mol/L |
| Class | Moderately soluble | Moderately soluble | Moderately soluble | Moderately soluble | Moderately soluble | Poorly soluble |
| Log S (SILICOS-IT) | ne–7.87 | ne–7.35 | ne–8.82 | ne–7.10 | ne–7.10 | ne–10.13 |
| Solubility | 4.49 × 10⁻⁶ mg/mL; 1.36 × 10⁻⁸ mol/L | 1.61 × 10⁻⁵ mg/mL; 4.48 × 10⁻⁸ mol/L | 6.09 × 10⁻⁷ mg/mL; 1.52 × 10⁻⁹ mol/L | 1.97 × 10⁻⁵ mg/mL; 8.00 × 10⁻⁸ mol/L | 1.97 × 10⁻⁵ mg/mL; 8.00 × 10⁻⁸ mol/L | 3.21 × 10⁻⁸ mg/mL; 7.33 × 10⁻¹¹ mol/L |
| Class | Poorly soluble | Poorly soluble | Poorly soluble | Poorly soluble | Poorly soluble | Insoluble |
| Pharmacokinetics | ||||||
| GI absorption | High | High | High | High | High | High |
| BBB permeant | Yes | Yes | Yes | Yes | Yes | No |
| P-gp substrate | Yes | Yes | Yes | Yes | Yes | Yes |
| CYP1A2 inhibitor | Yes | Yes | Yes | Yes | Yes | Yes |
| CYP2C19 inhibitor | Yes | No | No | Yes | Yes | Yes |
| CYP2C9 inhibitor | No | No | No | No | No | No |
| CYP2D6 inhibitor | Yes | Yes | Yes | Yes | Yes | Yes |
| CYP3A4 inhibitor | Yes | Yes | Yes | Yes | Yes | Yes |
| Log Kp (skin permeation) | ne–4.82 cm/s | ne–5.06 cm/s | ne–5.23 cm/s | ne–4.89 cm/s | ne–4.87 cm/s | ne–5.98 cm/s |
| Drug likeness | ||||||
| Lipinski | Yes; 1 violation: MLOGP > 4.15 | Yes; 0 violation | Yes; 0 violation | Yes; 0 violation | Yes; 0 violation | Yes; 0 violation |
| Ghose | Yes | Yes | No; 1 violation: MR > 130 | Yes | Yes | No; 1 violation: MR > 130 |
| Veber | Yes | Yes | Yes | Yes | Yes | No; 1 violation: Rotors > 10 |
| Egan | Yes | Yes | Yes | Yes | Yes | Yes |
| Muegge | Yes | Yes | Yes | Yes | Yes | Yes |
| Bioavailability Score | 0.05 | 0.05 | 0.55 | 0.55 | 0.55 | 0.55 |
| Medicinal Chemistry | ||||||
| PAINS | 0 alert | 0 alert | 0 alert | 0 alert | 0 alert | 0 alert |
| Brenk | 0 alert | 0 alert | 0 alert | 0 alert | 0 alert | 1 alert: disulphide |
| Lead likeness | No; 1 violation: XLOGP3 > 3.5 | No; 2 violations: MW > 350, XLOGP3 > 3.5 | No; 3 violations: MW > 350, Rotors > 7, XLOGP3 > 3.5 | No; 2 violations: MW < 250, XLOGP3 > 3.5 | No; 2 violations: MW < 250, XLOGP3 > 3.5 | No; 3 violations: MW > 350, Rotors > 7, XLOGP3 > 3.5 |
| Synthetic accessibility | 3.24 | 3.31 | 2.81 | 1.70 | 2.20 | 3.17 |
| Properties | CID6917760 | CID9820229 | CID5221957 | CID389556 | CID10900930 | AG1 |
|---|---|---|---|---|---|---|
| Mutagenic | No | No | No | Partial | No | No |
| Tumorigenic | No | No | No | Partial | No | No |
| Irritant | No | No | No | No | No | No |
| Reproductive effect | No | No | No | No | No | No |
| cLogP | 4.77 | 4.76 | 4.63 | 3.55 | 3.61 | 4.22 |
| Solubility | ne–3.99 | ne–4.41 | ne–3.84 | ne–4.38 | ne–4.40 | ne–5.18 |
| MW | 330 | 359 | 400 | 246 | 246 | 438 |
| TPSA | 19.03 Å2 | 22.27 Å2 | 38.06 Å2 | 31.58 Å2 | 31.58 Å2 | 106.2 Å2 |
| Drug likeness | 2.81 | 7.9 | 7.97 | 0.11 | 2.77 | 1.76 |
| Drug score | 0.62 | 0.59 | 0.62 | 0.36 | 0.70 | 0.48 |
© 2020 by the authors. Licensee MDPI, Basel, Switzerland. This article is an open access article distributed under the terms and conditions of the Creative Commons Attribution (CC BY) license (http://creativecommons.org/licenses/by/4.0/).
Share and Cite
Saddala, M.S.; Lennikov, A.; Huang, H. Discovery of Small-Molecule Activators for Glucose-6-Phosphate Dehydrogenase (G6PD) Using Machine Learning Approaches. Int. J. Mol. Sci. 2020, 21, 1523. https://doi.org/10.3390/ijms21041523
Saddala MS, Lennikov A, Huang H. Discovery of Small-Molecule Activators for Glucose-6-Phosphate Dehydrogenase (G6PD) Using Machine Learning Approaches. International Journal of Molecular Sciences. 2020; 21(4):1523. https://doi.org/10.3390/ijms21041523
Chicago/Turabian StyleSaddala, Madhu Sudhana, Anton Lennikov, and Hu Huang. 2020. "Discovery of Small-Molecule Activators for Glucose-6-Phosphate Dehydrogenase (G6PD) Using Machine Learning Approaches" International Journal of Molecular Sciences 21, no. 4: 1523. https://doi.org/10.3390/ijms21041523
APA StyleSaddala, M. S., Lennikov, A., & Huang, H. (2020). Discovery of Small-Molecule Activators for Glucose-6-Phosphate Dehydrogenase (G6PD) Using Machine Learning Approaches. International Journal of Molecular Sciences, 21(4), 1523. https://doi.org/10.3390/ijms21041523