In-silico Analysis of NF1 Missense Variants in ClinVar: Translating Variant Predictions into Variant Interpretation and Classification


Abstract
1. Introduction
2. Results
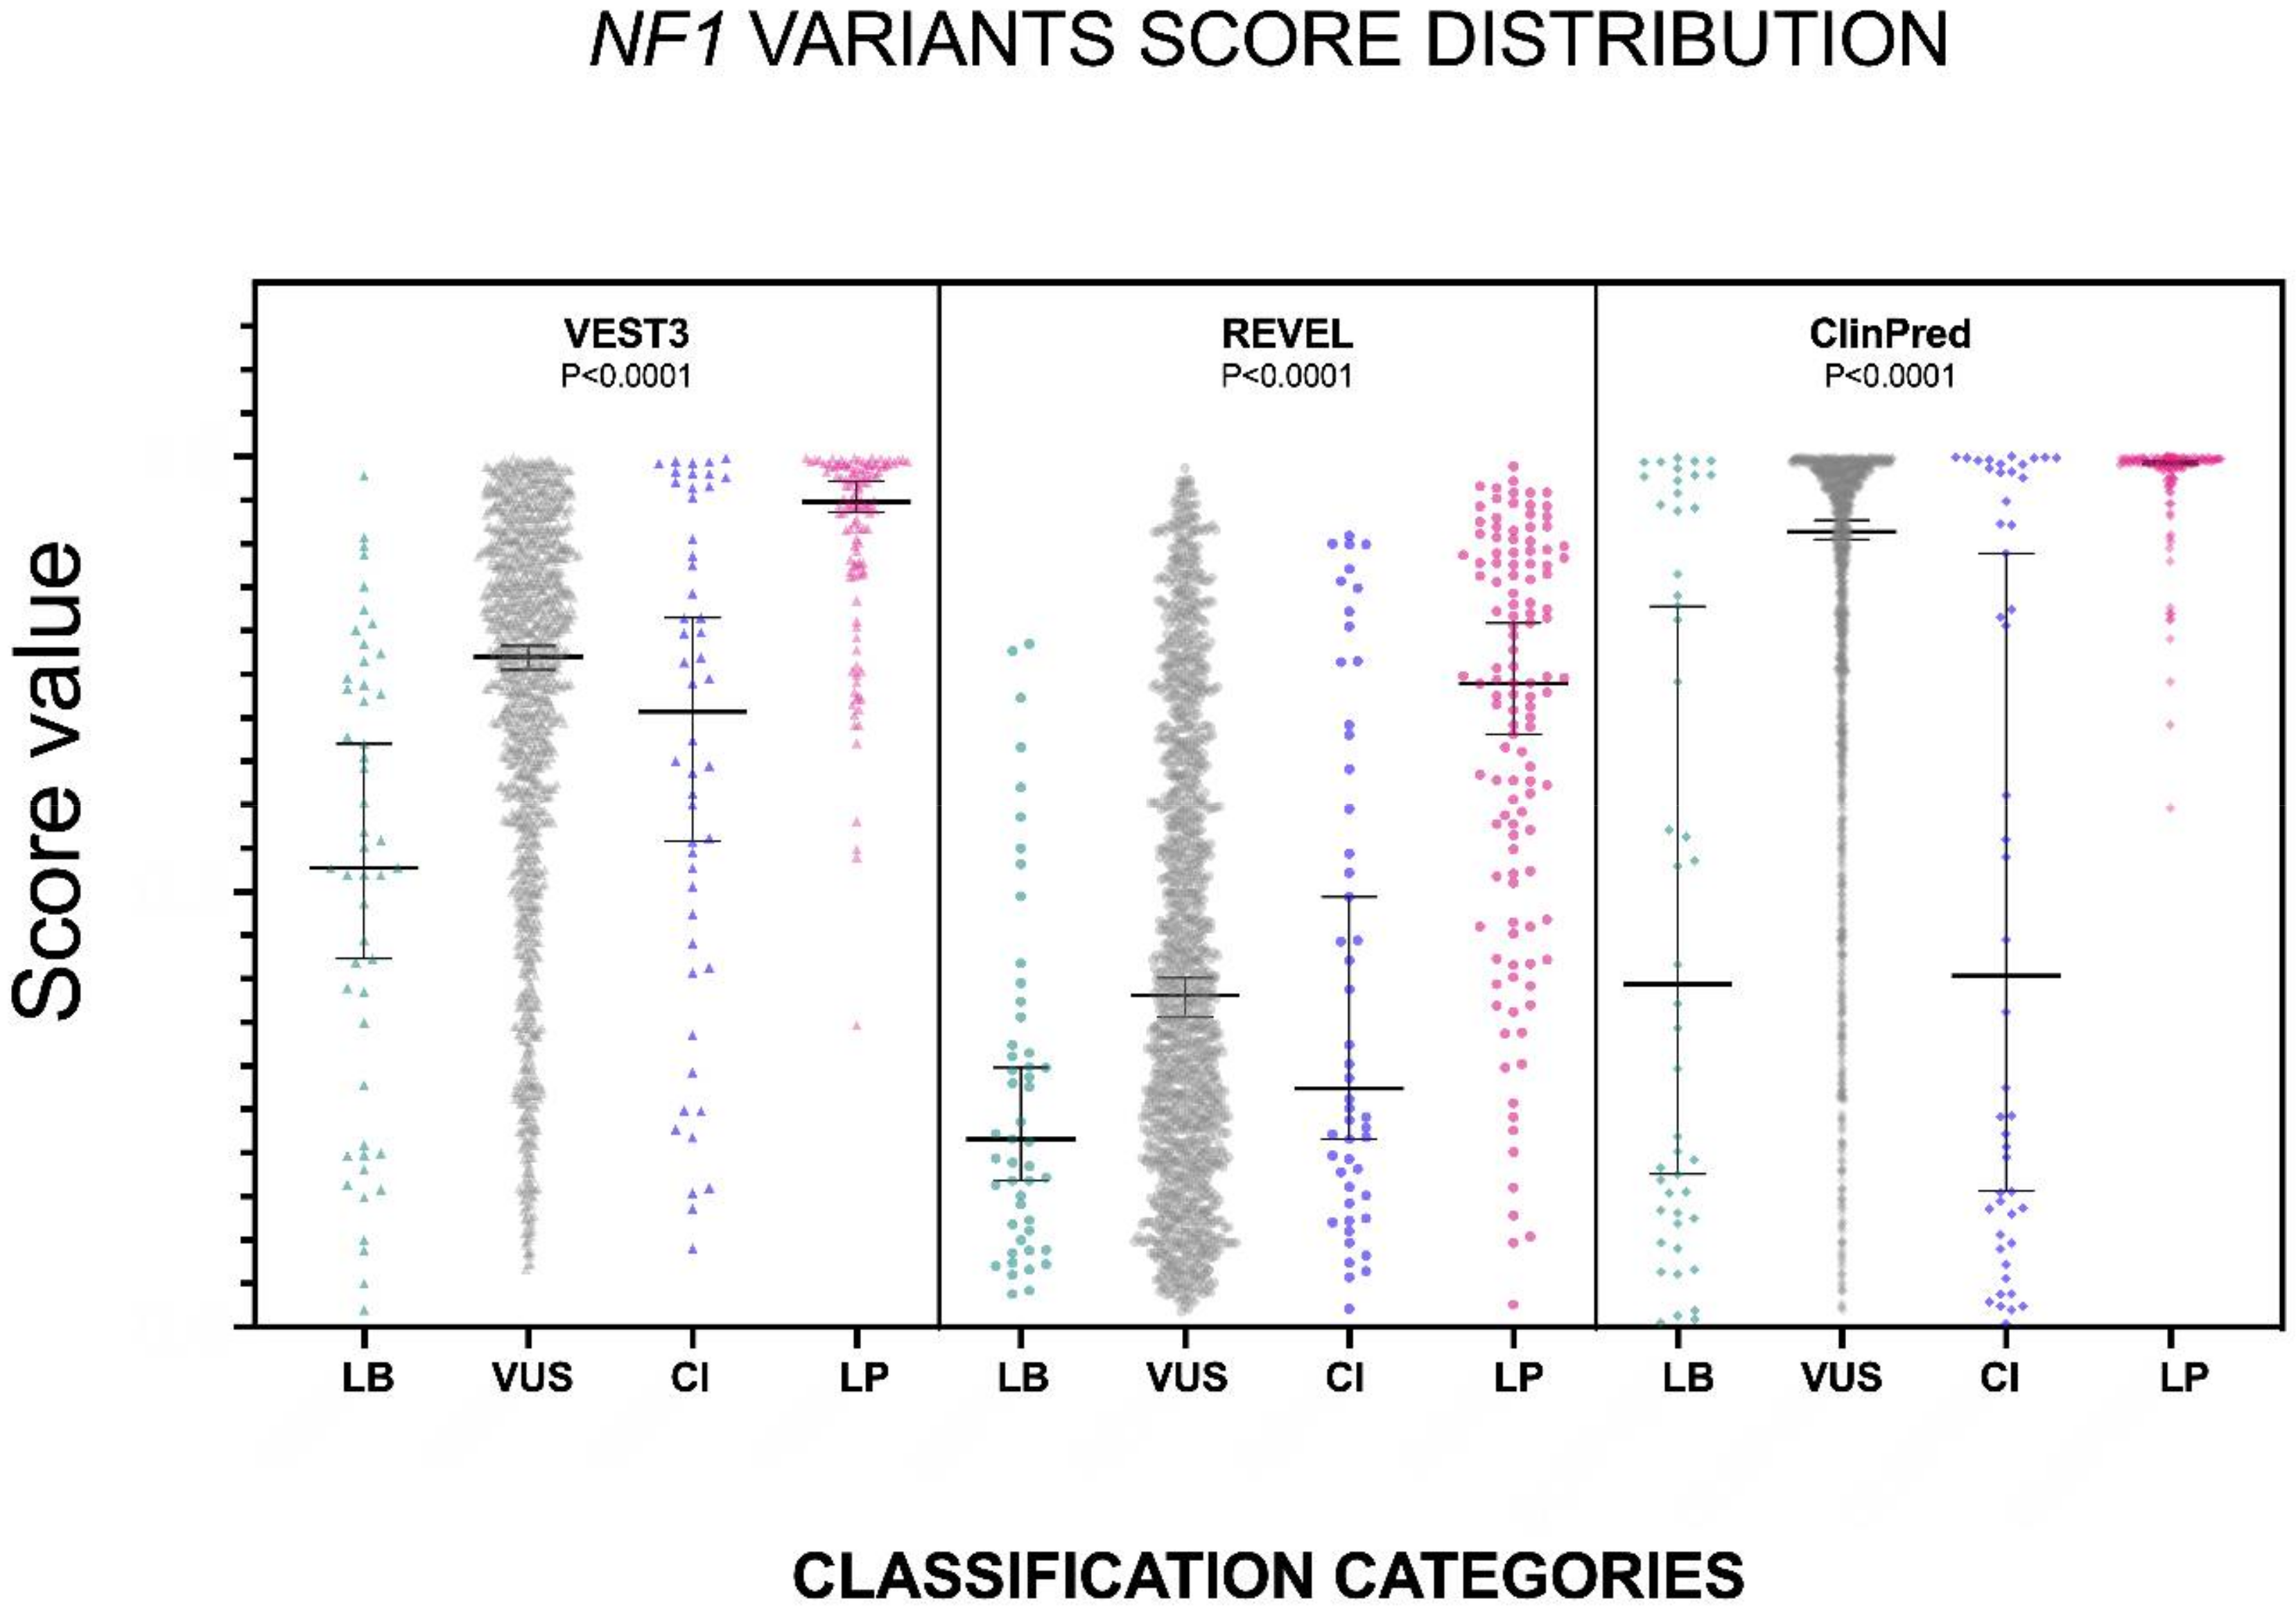
2.1. VEST3, REVEL and ClinPred Prediction Score Distribution for NF1 Missense Variants
2.2. Development of a Classifier for Classification Fine-Tuning
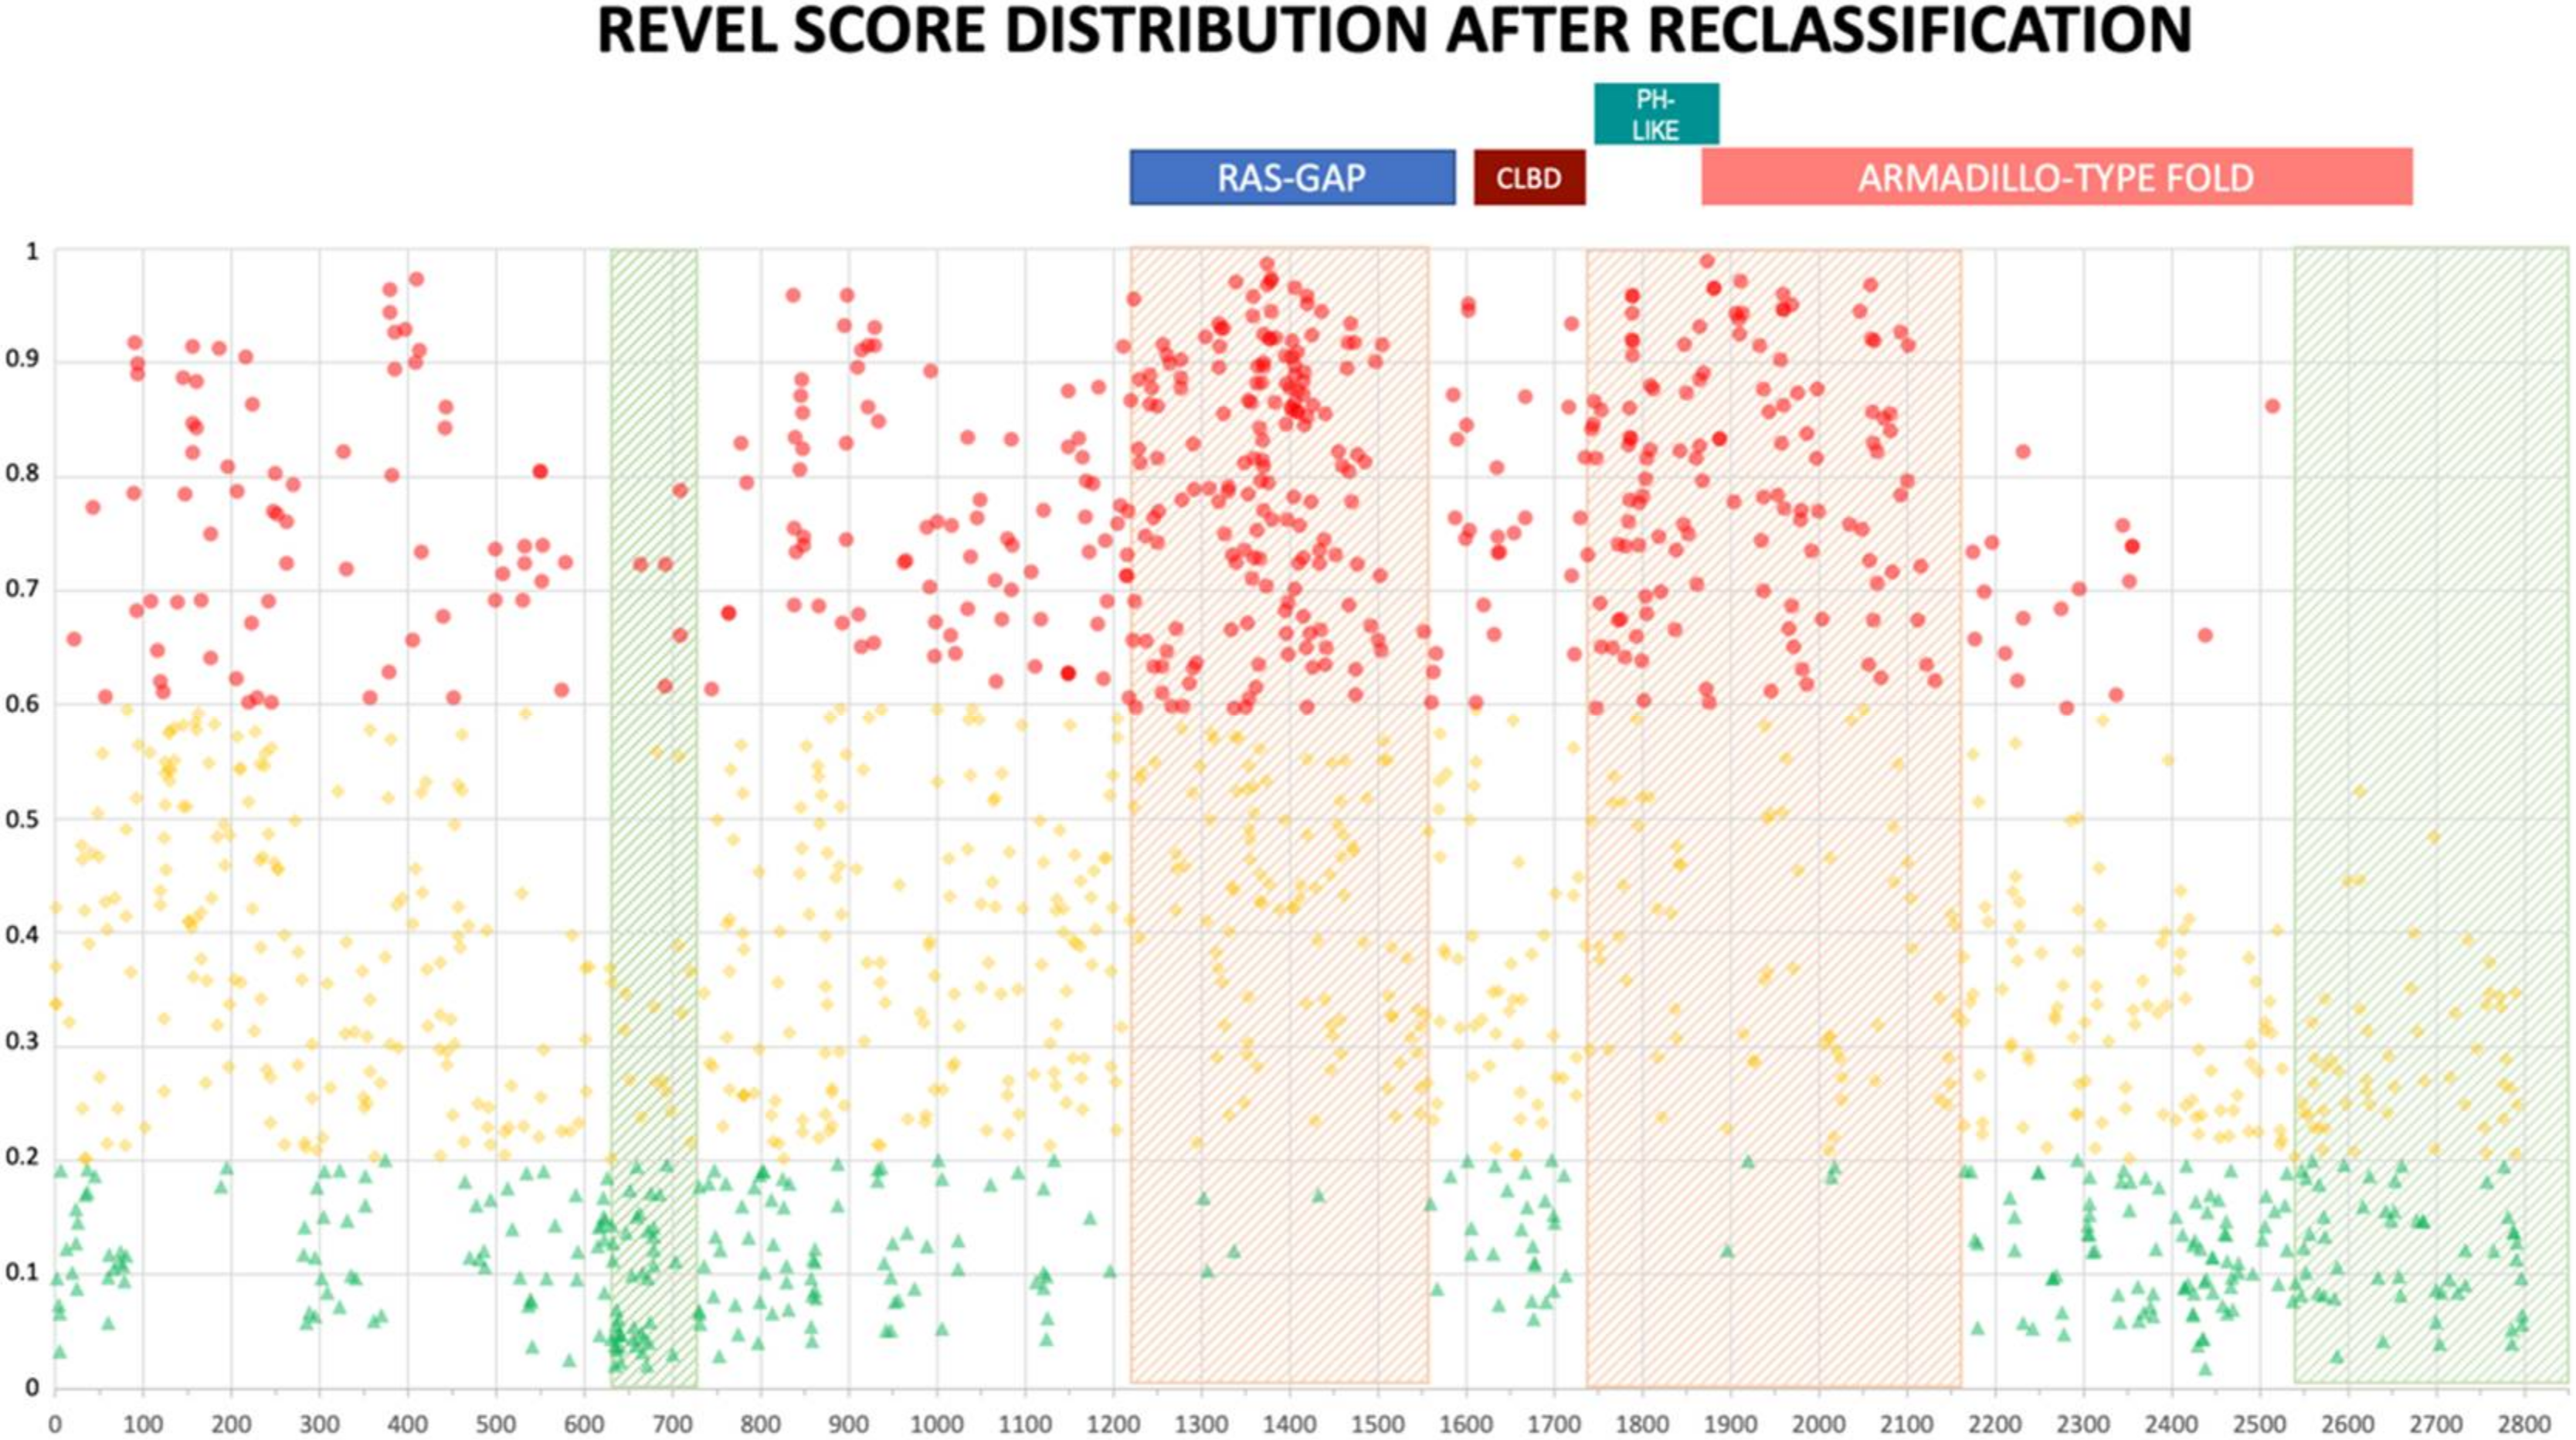
2.3. Reclassification Results after Training
3. Discussion
4. Materials and Methods
4.1. Dataset of Missense Variants
4.2. Statistical Analyses
4.3. Five Model Classification
5. Conclusions
Supplementary Materials
Author Contributions
Funding
Conflicts of Interest
Abbreviations
| NGS | Next Generation Sequencing |
| DCG | Disease-causing gene |
| ACMG | American College of Medical Genetics |
| AMP | Association for Molecular Pathology |
| VUS | Variant of uncertain significance |
| NF1 | Neurofibromatosis type 1 |
| GAP | GTPase activating protein |
| CI | Variant with Conflicting Interpretation |
| LOVD | Leiden Open Variation Database |
| HGMD | Human Gene Mutation Database |
References
- Weterman, M.A.J.; Kuo, M.; Kenter, S.B.; Gordillo, S.; Karjosukarso, D.W.; Takase, R.; Bronk, M.; Oprescu, S.; van Ruissen, F.; Witteveen, R.J.W.; et al. Hypermorphic and hypomorphic AARS alleles in patients with CMT2N expand clinical and molecular heterogeneities. Hum. Mol. Genet. 2018, 27, 4036–4050. [Google Scholar] [CrossRef]
- Jamilloux, Y.; Lefeuvre, L.; Magnotti, F.; Martin, A.; Benezech, S.; Allatif, O.; Penel-Page, M.; Hentgen, V.; Sève, P.; Gerfaud-Valentin, M.; et al. Familial Mediterranean fever mutations are hypermorphic mutations that specifically decrease the activation threshold of the Pyrin inflammasome. Rheumatology (Oxford) 2018, 57, 100–111. [Google Scholar] [CrossRef]
- Boycott, K.M.; Vanstone, M.R.; Bulman, D.E.; MacKenzie, A.E. Rare-disease genetics in the era of next-generation sequencing: Discovery to translation. Nat. Rev. Genet. 2013, 14, 681–691. [Google Scholar] [CrossRef]
- Lek, M.; Karczewski, K.J.; Minikel, E.V.; Samocha, K.E.; Banks, E.; Fennell, T.; O’Donnell-Luria, A.H.; Ware, J.S.; Hill, A.J.; Cummings, B.B.; et al. Exome Aggregation Consortium. Analysis of protein-coding genetic variation in 60,706 humans. Nature 2016, 18, 285–291. [Google Scholar] [CrossRef]
- Stella, A.; Lastella, P.; Loconte, D.C.; Bukvic, N.; Varvara, D.; Patruno, M.; Bagnulo, R.; Lovaglio, R.; Bartolomeo, N.; Serio, G.; et al. Accurate Classification of NF1 Gene Variants in 84 Italian Patients with Neurofibromatosis Type 1. Genes 2018, 9, 216. [Google Scholar] [CrossRef]
- Richards, S.; Aziz, N.; Bale, S.; Bick, D.; Das, S.; Gastier-Foster, J.; Grody, W.W.; Hegde, M.; Lyon, E.; Spector, E.; et al. Standards and guidelines for the interpretation of sequence variants: A joint consensus recommendation of the American College of Medical Genetics and Genomics and the Association for Molecular Pathology. Genet. Med. 2015, 17, 405–424. [Google Scholar] [CrossRef] [PubMed]
- Amendola, L.M.; Jarvik, G.P.; Leo, M.C.; McLaughlin, H.M.; Akkari, Y.; Amaral, M.D.; Berg, J.S.; Biswas, S.; Bowling, K.M.; Conlin, L.K.; et al. Performance of ACMG-AMP Variant-Interpretation Guidelines among Nine Laboratories in the Clinical Sequencing Exploratory Research Consortium. Am. J. Hum. Genet. 2016, 98, 1067–1076. [Google Scholar] [CrossRef] [PubMed]
- Li, M.M.; Datto, M.; Duncavage, E.J.; Kulkarni, S.; Lindeman, N.I.; Roy, S.; Tsimberidou, A.M.; Vnencak-Jones, C.L.; Wolff, D.J.; Younes, A.; et al. Standards and Guidelines for the Interpretation and Reporting of Sequence Variants in Cancer: A Joint Consensus Recommendation of the Association for Molecular Pathology, American Society of Clinical Oncology, and College of American Pathologists. J. Mol. Diagn. 2017, 19, 4–23. [Google Scholar] [CrossRef] [PubMed]
- Maxwell, K.N.; Hart, S.N.; Vijai, J.; Schrader, K.A.; Slavin, T.P.; Thomas, T.; Wubbenhorst, B.; Ravichandran, V.; Moore, R.M.; Hu, C.; et al. Evaluation of ACMG-Guideline-Based Variant Classification of Cancer Susceptibility and Non-Cancer-Associated Genes in Families Affected by Breast Cancer. Am. J. Hum. Genet. 2016, 98, 801–817. [Google Scholar] [CrossRef] [PubMed]
- Tavtigian, S.V.; Greenblatt, M.S.; Harrison, S.M.; Nussbaum, R.L.; Prabhu, S.A.; Boucher, K.M.; Biesecker, L.G.; ClinGen Sequence Variant Interpretation Working Group (ClinGen SVI). Modeling the ACMG/AMP variant classification guidelines as a Bayesian classification framework. Genet. Med. 2018, 20, 1054–1060. [Google Scholar] [CrossRef] [PubMed]
- Nykamp, K.; Anderson, M.; Powers, M.; Garcia, J.; Herrera, B.; Ho, Y.Y.; Kobayashi, Y.; Patil, N.; Thusberg, J.; Westbrook, M.; et al. Sherloc: A comprehensive refinement of the ACMG-AMP variant classification criteria. Genet. Med. 2017, 19, 1105–1117. [Google Scholar] [CrossRef] [PubMed]
- Pepin, M.G.; Murray, M.L.; Bailey, S.; Leistritz-Kessler, D.; Schwarze, U.; Byers, P.H. The challenge of comprehensive and consistent sequence variant interpretation between clinical laboratories. Genet. Med. 2016, 18, 20–24. [Google Scholar] [CrossRef] [PubMed]
- Manrai, A.K.; Funke, B.H.; Rehm, H.L.; Olesen, M.S.; Maron, B.A.; Szolovits, P.; Margulies, D.M.; Loscalzo, J.; Kohane, I.S. Genetic Misdiagnoses and the Potential for Health Disparities. N. Engl. J. Med. 2016, 375, 655–665. [Google Scholar] [CrossRef] [PubMed]
- Rivera-Muñoz, E.A.; Milko, L.V.; Harrison, S.M.; Azzariti, D.R.; Kurtz, C.L.; Lee, K.; Mester, J.L.; Weaver, M.A.; Currey, E.; Craigen, W.; et al. ClinGen Variant Curation Expert Panel experiences and standardized processes for disease and gene-level specification of the ACMG/AMP guidelines for sequence variant interpretation. Hum. Mutat. 2018, 39, 1614–1622. [Google Scholar] [CrossRef] [PubMed]
- Gelb, B.D.; Cavé, H.; Dillon, M.W.; Gripp, K.W.; Lee, J.A.; Mason-Suares, H.; Rauen, K.A.; Williams, B.; Zenker, M.; Vincent, L.M.; et al. ClinGen’s RASopathy Expert Panel consensus methods for variant interpretation. Genet. Med. 2018, 20, 1334–1345. [Google Scholar] [CrossRef] [PubMed]
- Van Gijn, M.E.; Ceccherini, I.; Shinar, Y.; Carbo, E.C.; Slofstra, M.; Arostegui, J.I.; Sarrabay, G.; Rowczenio, D.; Omoyımnı, E.; Balci-Peynircioglu, B.; et al. New workflow for classification of genetic variants’ pathogenicity applied to hereditary recurrent fevers by the International Study Group for Systemic Autoinflammatory Diseases (INSAID). J. Med. Genet. 2018, 55, 530–537. [Google Scholar] [CrossRef] [PubMed]
- Kumar, P.; Henikoff, S.; Ng, P.C. Predicting the effects of coding non-synonymous variants on protein function using the SIFT algorithm. Nat. Protoc. 2009, 4, 1073–1081. [Google Scholar] [CrossRef]
- Adzhubei, I.A.; Schmidt, S.; Peshkin, L.; Ramensky, V.E.; Gerasimova, A.; Bork, P.; Kondrashov, A.S.; Sunyaev, S.R. A method and server for predicting damaging missense mutations. Nat. Methods 2010, 7, 248–249. [Google Scholar] [CrossRef]
- Schwarz, J.M.; Rödelsperger, C.; Schuelke, M.; Seelow, D. MutationTaster evaluates disease-causing potential of sequence alterations. Nat. Methods 2010, 7, 575–576. [Google Scholar] [CrossRef]
- Sim, N.L.; Kumar, P.; Hu, J.; Henikoff, S.; Schneider, G.; Ng, P.C. SIFT web server: Predicting effects of amino acid substitutions on proteins. Nucleic Acids Res. 2012, W452–W457. [Google Scholar] [CrossRef]
- Kircher, M.; Witten, D.M.; Jain, P.; O’Roak, B.J.; Cooper, G.M.; Shendure, J. A general framework for estimating the relative pathogenicity of human genetic variants. Nat. Genet. 2014, 46, 310–315. [Google Scholar] [CrossRef] [PubMed]
- Gulko, B.; Hubisz, M.J.; Gronau, I.; Siepel, A. A method for calculating probabilities of fitness consequences for point mutations across the human genome. Nat. Genet. 2015, 47, 276–283. [Google Scholar] [CrossRef] [PubMed]
- Tang, H.; Thomas, P.D. PANTHER-PSEP: Predicting disease-causing genetic variants using position-specific evolutionary preservation. Bioinformatics 2016, 32, 2230–2232. [Google Scholar] [CrossRef] [PubMed]
- Atas, H.; Tuncbag, N.; Doğan, T. Phylogenetic and Other Conservation-Based Approaches to Predict Protein Functional Sites. Methods Mol. Biol. 2018, 1762, 51–69. [Google Scholar] [CrossRef] [PubMed]
- Jian, X.; Boerwinkle, E.; Liu, X. In silico tools for splicing defect prediction: A survey from the viewpoint of end users. Genet. Med. 2014, 16, 497–503. [Google Scholar] [CrossRef]
- Jian, X.; Boerwinkle, E.; Liu, X. In silico prediction of splice-altering single nucleotide variants in the human genome. Nucleic Acids Res. 2014, 42, 13534–13544. [Google Scholar] [CrossRef]
- Moles-Fernández, A.; Duran-Lozano, L.; Montalban, G.; Bonache, S.; López-Perolio, I.; Menéndez, M.; Santamariña, M.; Behar, R.; Blanco, A.; Carrasco, E.; et al. Computational Tools for Splicing Defect Prediction in Breast/Ovarian Cancer Genes: How Efficient Are They at Predicting RNA Alterations? Front. Genet. 2018, 9, 366. [Google Scholar] [CrossRef]
- Wang, R.; Wang, Y.; Hu, Z. Using secondary structure to predict the effects of genetic variants on alternative splicing. Hum. Mutat. 2019, 40, 1270–1279. [Google Scholar] [CrossRef]
- Carter, H.; Douville, C.; Stenson, P.D.; Cooper, D.N.; Karchin, R. Identifying Mendelian disease genes with the variant effect scoring tool. BMC Genom. 2013, 14 (Suppl. 3), S3. [Google Scholar] [CrossRef]
- Ioannidis, N.M.; Rothstein, J.H.; Pejaver, V.; Middha, S.; McDonnell, S.K.; Baheti, S.; Musolf, A.; Li, Q.; Holzinger, E.; Karyadi, D.; et al. REVEL: An ensemble method for predicting the pathogenicity of rare missense variants. Am. J. Hum. Genet. 2016, 99, 877–885. [Google Scholar] [CrossRef]
- Alirezaie, N.; Kernohan, K.D.; Hartley, T.; Majewski, J.; Hocking, T.D. ClinPred: Prediction Tool to Identify Disease-Relevant Nonsynonymous Single-Nucleotide Variants. Am. J. Hum. Genet. 2018, 103, 474–483. [Google Scholar] [CrossRef] [PubMed]
- Ghosh, R.; Oak, N.; Plon, S.E. Evaluation of in silico algorithms for use with ACMG/AMP clinical variant interpretation guidelines. Genome Biol. 2017, 18, 225. [Google Scholar] [CrossRef] [PubMed]
- Li, J.; Zhao, T.; Zhang, Y.; Zhang, K.; Shi, L.; Chen, Y.; Wang, X.; Sun, Z. Performance evaluation of pathogenicity-computation methods for missense variants. Nucleic Acids Res. 2018, 46, 7793–7804. [Google Scholar] [CrossRef] [PubMed]
- Neurofibromatosis Conference Statement. Arch. Neurol. 1988, 45, 575–578. Available online: https://jamanetwork.com/journals/jamaneurology/article-abstract/587659 (accessed on 31 May 2019).
- Cawthon, R.M.; Weiss, R.; Xu, G.F.; Viskochil, D.; Culver, M.; Stevens, J.; Robertson, M.; Dunn, D.; Gesteland, R.; O’Connell, P.; et al. A major segment of the neurofibromatosis type 1 gene: cDNA sequence, genomic structure, and point mutations. Cell 1990, 62, 193–201. [Google Scholar] [CrossRef]
- Wallace, M.R.; Marchuk, D.A.; Andersen, L.B.; Letcher, R.; Odeh, H.M.; Saulino, A.M.; Fountain, J.W.; Brereton, A.; Nicholson, J.; Mitchell, A.L.; et al. Type 1 neurofibromatosis gene: Identification of a large transcript disrupted in three NF1 patients. Science 1990, 249, 181–186. [Google Scholar] [CrossRef] [PubMed]
- Meric-Bernstam, F.; Frampton, G.M.; Ferrer-Lozano, J.; Yelensky, R.; Pérez-Fidalgo, J.A.; Wang, Y.; Palmer, G.A.; Ross, J.S.; Miller, V.A.; Su, X.; et al. Concordance of genomic alterations between primary and recurrent breast cancer. Mol. Cancer Ther. 2014, 13, 1382–1389. [Google Scholar] [CrossRef]
- Cancer Genome Atlas Research Network. Integrated genomic analyses of ovarian carcinoma. Nature 2011, 474, 609–615. [Google Scholar] [CrossRef]
- Ding, L.; Getz, G.; Wheeler, D.A.; Mardis, E.R.; McLellan, M.D.; Cibulskis, K.; Sougnez, C.; Greulich, H.; Muzny, D.M.; Morgan, M.B.; et al. Somatic mutations affect key pathways in lung adenocarcinoma. Nature 2008, 455, 1069–1075. [Google Scholar] [CrossRef]
- Cancer Genome Atlas Research Network. Comprehensive genomic characterization defines human glioblastoma genes and core pathways. Nature 2008, 455, 1061–1068. [Google Scholar] [CrossRef]
- Boudry-Labis, E.; Roche-Lestienne, C.; Nibourel, O.; Boissel, N.; Terre, C.; Perot, C.; Eclache, V.; Gachard, N.; Tigaud, I.; Plessis, G.; et al. Neurofibromatosis-1 gene deletions and mutations in de novo adult acute myeloid leukemia. Am. J. Hematol. 2013, 88, 306–311. [Google Scholar] [CrossRef]
- Zehir, A.; Benayed, R.; Shah, R.H.; Syed, A.; Middha, S.; Kim, H.R.; Srinivasan, P.; Gao, J.; Chakravarty, D.; Devlin, S.M.; et al. Mutational landscape of metastatic cancer revealed from prospective clinical sequencing of 10,000 patients. Nat. Med. 2017, 23, 703–713. [Google Scholar] [CrossRef] [PubMed]
- Uusitalo, E.; Rantanen, M.; Kallionpää, R.A.; Pöyhönen, M.; Leppävirta, J.; Ylä-Outinen, H.; Riccardi, V.M.; Pukkala, E.; Pitkäniemi, J.; Peltonen, S.; et al. Distinctive Cancer Associations in Patients with Neurofibromatosis Type 1. J. Clin. Oncol. 2016, 34, 1978–1986. [Google Scholar] [CrossRef] [PubMed]
- DeBella, K.; Szudek, J.; Friedman, J.M. Use of the national institutes of health criteria for diagnosis of neurofibromatosis 1 in children. Pediatrics 2000, 105, 608–614. [Google Scholar] [CrossRef] [PubMed]
- Ben-Shachar, S.; Dubov, T.; Toledano-Alhadef, H.; Mashiah, J.; Sprecher, E.; Constantini, S.; Leshno, M.; Messiaen, L.M. Predicting neurofibromatosis type 1 risk among children with isolated café-au-lait macules. J. Am. Acad. Dermatol. 2017, 76, 1077–1083. [Google Scholar] [CrossRef]
- Tagliafico, E.; Bernardis, I.; Grasso, M.; D’Apice, M.R.; Lapucci, C.; Botta, A.; Giachino, D.F.; Marinelli, M.; Primignani, P.; Russo, S.; et al. Molecular Genetics Working Group of the Italian Society of Human Genetics, SIGU. Workload measurement for molecular genetics laboratory: A survey study. PLoS ONE 2018, 13, e0206855. [Google Scholar] [CrossRef]
- Jagadeesh, K.A.; Wenger, A.M.; Berger, M.J.; Guturu, H.; Stenson, P.D.; Cooper, D.N.; Bernstein, J.A.; Bejerano, G. M-CAP eliminates a majority of variants of uncertain significance in clinical exomes at high sensitivity. Nat. Genet. 2016, 48, 1581–1586. [Google Scholar] [CrossRef]
- Boyd, K.P.; Korf, B.R.; Theos, A. Neurofibromatosis type 1. J. Am. Acad. Dermatol. 2009, 61, 1–16. [Google Scholar] [CrossRef]
- Pinna, V.; Lanari, V.; Daniele, P.; Consoli, F.; Agolini, E.; Margiotti, K.; Bottillo, I.; Torrente, I.; Bruselles, A.; Fusilli, C.; et al. p.Arg1809Cys substitution in neurofibromin is associated with a distinctive NF1 phenotype without neurofibromas. Eur. J. Hum. Genet. 2015, 23, 1068–1071. [Google Scholar] [CrossRef]
- Trevisson, E.; Morbidoni, V.; Forzan, M.; Daolio, C.; Fumini, V.; Parrozzani, R.; Cassina, M.; Midena, E.; Salviati, L.; Clementi, M. The Arg1038Gly missense variant in the NF1 gene causes a mild phenotype without neurofibromas. Mol. Genet. Genom. Med. 2019, 7, e616. [Google Scholar] [CrossRef]
- Koczkowska, M.; Callens, T.; Gomes, A.; Sharp, A.; Chen, Y.; Hicks, A.D.; Aylsworth, A.S.; Azizi, A.A.; Basel, D.G.; Bellus, G.; et al. Expanding the clinical phenotype of individuals with a 3-bp in-frame deletion of the NF1 gene (c.2970_2972del): An update of genotype-phenotype correlation. Genet. Med. 2019, 21, 867–876. [Google Scholar] [CrossRef]
- Muiño-Mosquera, L.; Steijns, F.; Audenaert, T.; Meerschaut, I.; De Paepe, A.; Steyaert, W.; Symoens, S.; Coucke, P.; Callewaert, B.; Renard, M.; et al. Tailoring the American College of Medical Genetics and Genomics and the Association for Molecular Pathology Guidelines for the Interpretation of Sequenced Variants in the FBN1 Gene for Marfan Syndrome: Proposal for a Disease- and Gene-Specific Guideline. Circ. Genom. Precis. Med. 2018, 11, e002039. [Google Scholar] [CrossRef] [PubMed]
- Accetturo, M.; D’Uggento, A.M.; Portincasa, P.; Stella, A. Improvement of MEFV gene variants classification to aid treatment decision making in familial Mediterranean fever. Rheumatology (Oxford) 2019. [Google Scholar] [CrossRef] [PubMed]
- Isakov, O.; Wallis, D.; Evans, D.G.; Ben-Shachar, S. Exhaustive non-synonymous variants functionality prediction enables high resolution characterization of the neurofibromin architecture. EBioMedicine 2018, 36, 508–516. [Google Scholar] [CrossRef] [PubMed]
- Rojnueangnit, K.; Xie, J.; Gomes, A.; Sharp, A.; Callens, T.; Chen, Y.; Liu, Y.; Cochran, M.; Abbott, M.A.; Atkin, J.; et al. High Incidence of Noonan Syndrome Features Including Short Stature and Pulmonic Stenosis in Patients carrying NF1 Missense Mutations Affecting p.Arg1809: Genotype-Phenotype Correlation. Hum. Mutat. 2015, 36, 1052–1063. [Google Scholar] [CrossRef] [PubMed]
- Balla, B.; Árvai, K.; Horváth, P.; Tobiás, B.; Takács, I.; Nagy, Z.; Dank, M.; Fekete, G.; Kósa, J.P.; Lakatos, P. Fast and robust next-generation sequencing technique using ion torrent personal genome machine for the screening of neurofibromatosis type 1 (NF1) gene. J. Mol. Neurosci. 2014, 53, 204–210. [Google Scholar] [CrossRef]
- Grimm, D.G.; Azencott, C.; Aicheler, F.; Gieraths, U.; MacArthur, D.G.; Samocha, K.E.; Cooper, D.N.; Stenson, P.D.; Daly, M.J.; Smoller, J.W.; et al. The Evaluation of Tools Used to Predict the Impact of Missense Variants Is Hindered by Two Types of Circularity. Hum. Mutat. 2015, 36, 513–523. [Google Scholar] [CrossRef]
- ClinVar. Available online: https://www.ncbi.nlm.nih.gov/clinvar/ (accessed on 31 May 2019).
- LOVD-NF1. Available online: https://databases.lovd.nl/shared/genes/NF1 (accessed on 31 May 2019).
- VEST3. Available online: https://www.cravat.us/CRAVAT/ (accessed on 31 May 2019).
- REVEL. Available online: https://sites.google.com/site/revelgenomics/downloads (accessed on 31 May 2019).
- ClinPred. Available online: http://hubs.hpc.mcgill.ca/~alirezai/ClinPred (accessed on 31 May 2019).


| VEST3 | REVEL | ClinPred | ||||||||||
|---|---|---|---|---|---|---|---|---|---|---|---|---|
| LB | VUS | CI | LP | LB | VUS | CI | LP | LB | VUS | CI | LP | |
| Number of Values | 49 | 1363 | 50 | 122 | 49 | 1360 | 50 | 122 | 48 | 1364 | 50 | 122 |
| Minimum | 0.02 | 0.067 | 0.09 | 0.347 | 0.038 | 0.018 | 0.021 | 0.026 | 0.005 | 0.019 | 0.004 | 0.596 |
| 25% Percentile | 0.2435 | 0.584 | 0.434 | 0.8728 | 0.1145 | 0.2103 | 0.1585 | 0.5203 | 0.1318 | 0.6915 | 0.124 | 0.9828 |
| Median | 0.528 | 0.77 | 0.707 | 0.948 | 0.216 | 0.381 | 0.274 | 0.7395 | 0.394 | 0.914 | 0.4035 | 0.993 |
| 75% Percentile | 0.742 | 0.885 | 0.9558 | 0.989 | 0.365 | 0.645 | 0.683 | 0.8848 | 0.944 | 0.9810 | 0.9823 | 0.998 |
| Maximum | 0.978 | 1.000 | 0.998 | 0.9990 | 0.785 | 0.987 | 0.909 | 0.9890 | 0.998 | 1.000 | 1.000 | 1.000 |
| 95% CI of Median | ||||||||||||
| Actual Confidence Level | 95.56% | 95.00% | 96.72% | 96.31% | 95.56% | 95.00% | 96.72% | 96.31% | 97.07% | 95.00% | 96.72% | 96.31% |
| Lower Confidence Limit | 0.423 | 0.755 | 0.558 | 0.936 | 0.168 | 0.356 | 0.216 | 0.681 | 0.176 | 0.905 | 0.156 | 0.991 |
| Upper Confidence Limit | 0.67 | 0.783 | 0.815 | 0.972 | 0.298 | 0.401 | 0.494 | 0.809 | 0.828 | 0.927 | 0.889 | 0.995 |
| Coefficient of Variation | 51.5% | 32.39% | 43.51% | 12.93% | 73.59% | 60.89% | 72.6% | 34.83% | 78.04% | 31.97% | 80.05% | 6.651% |
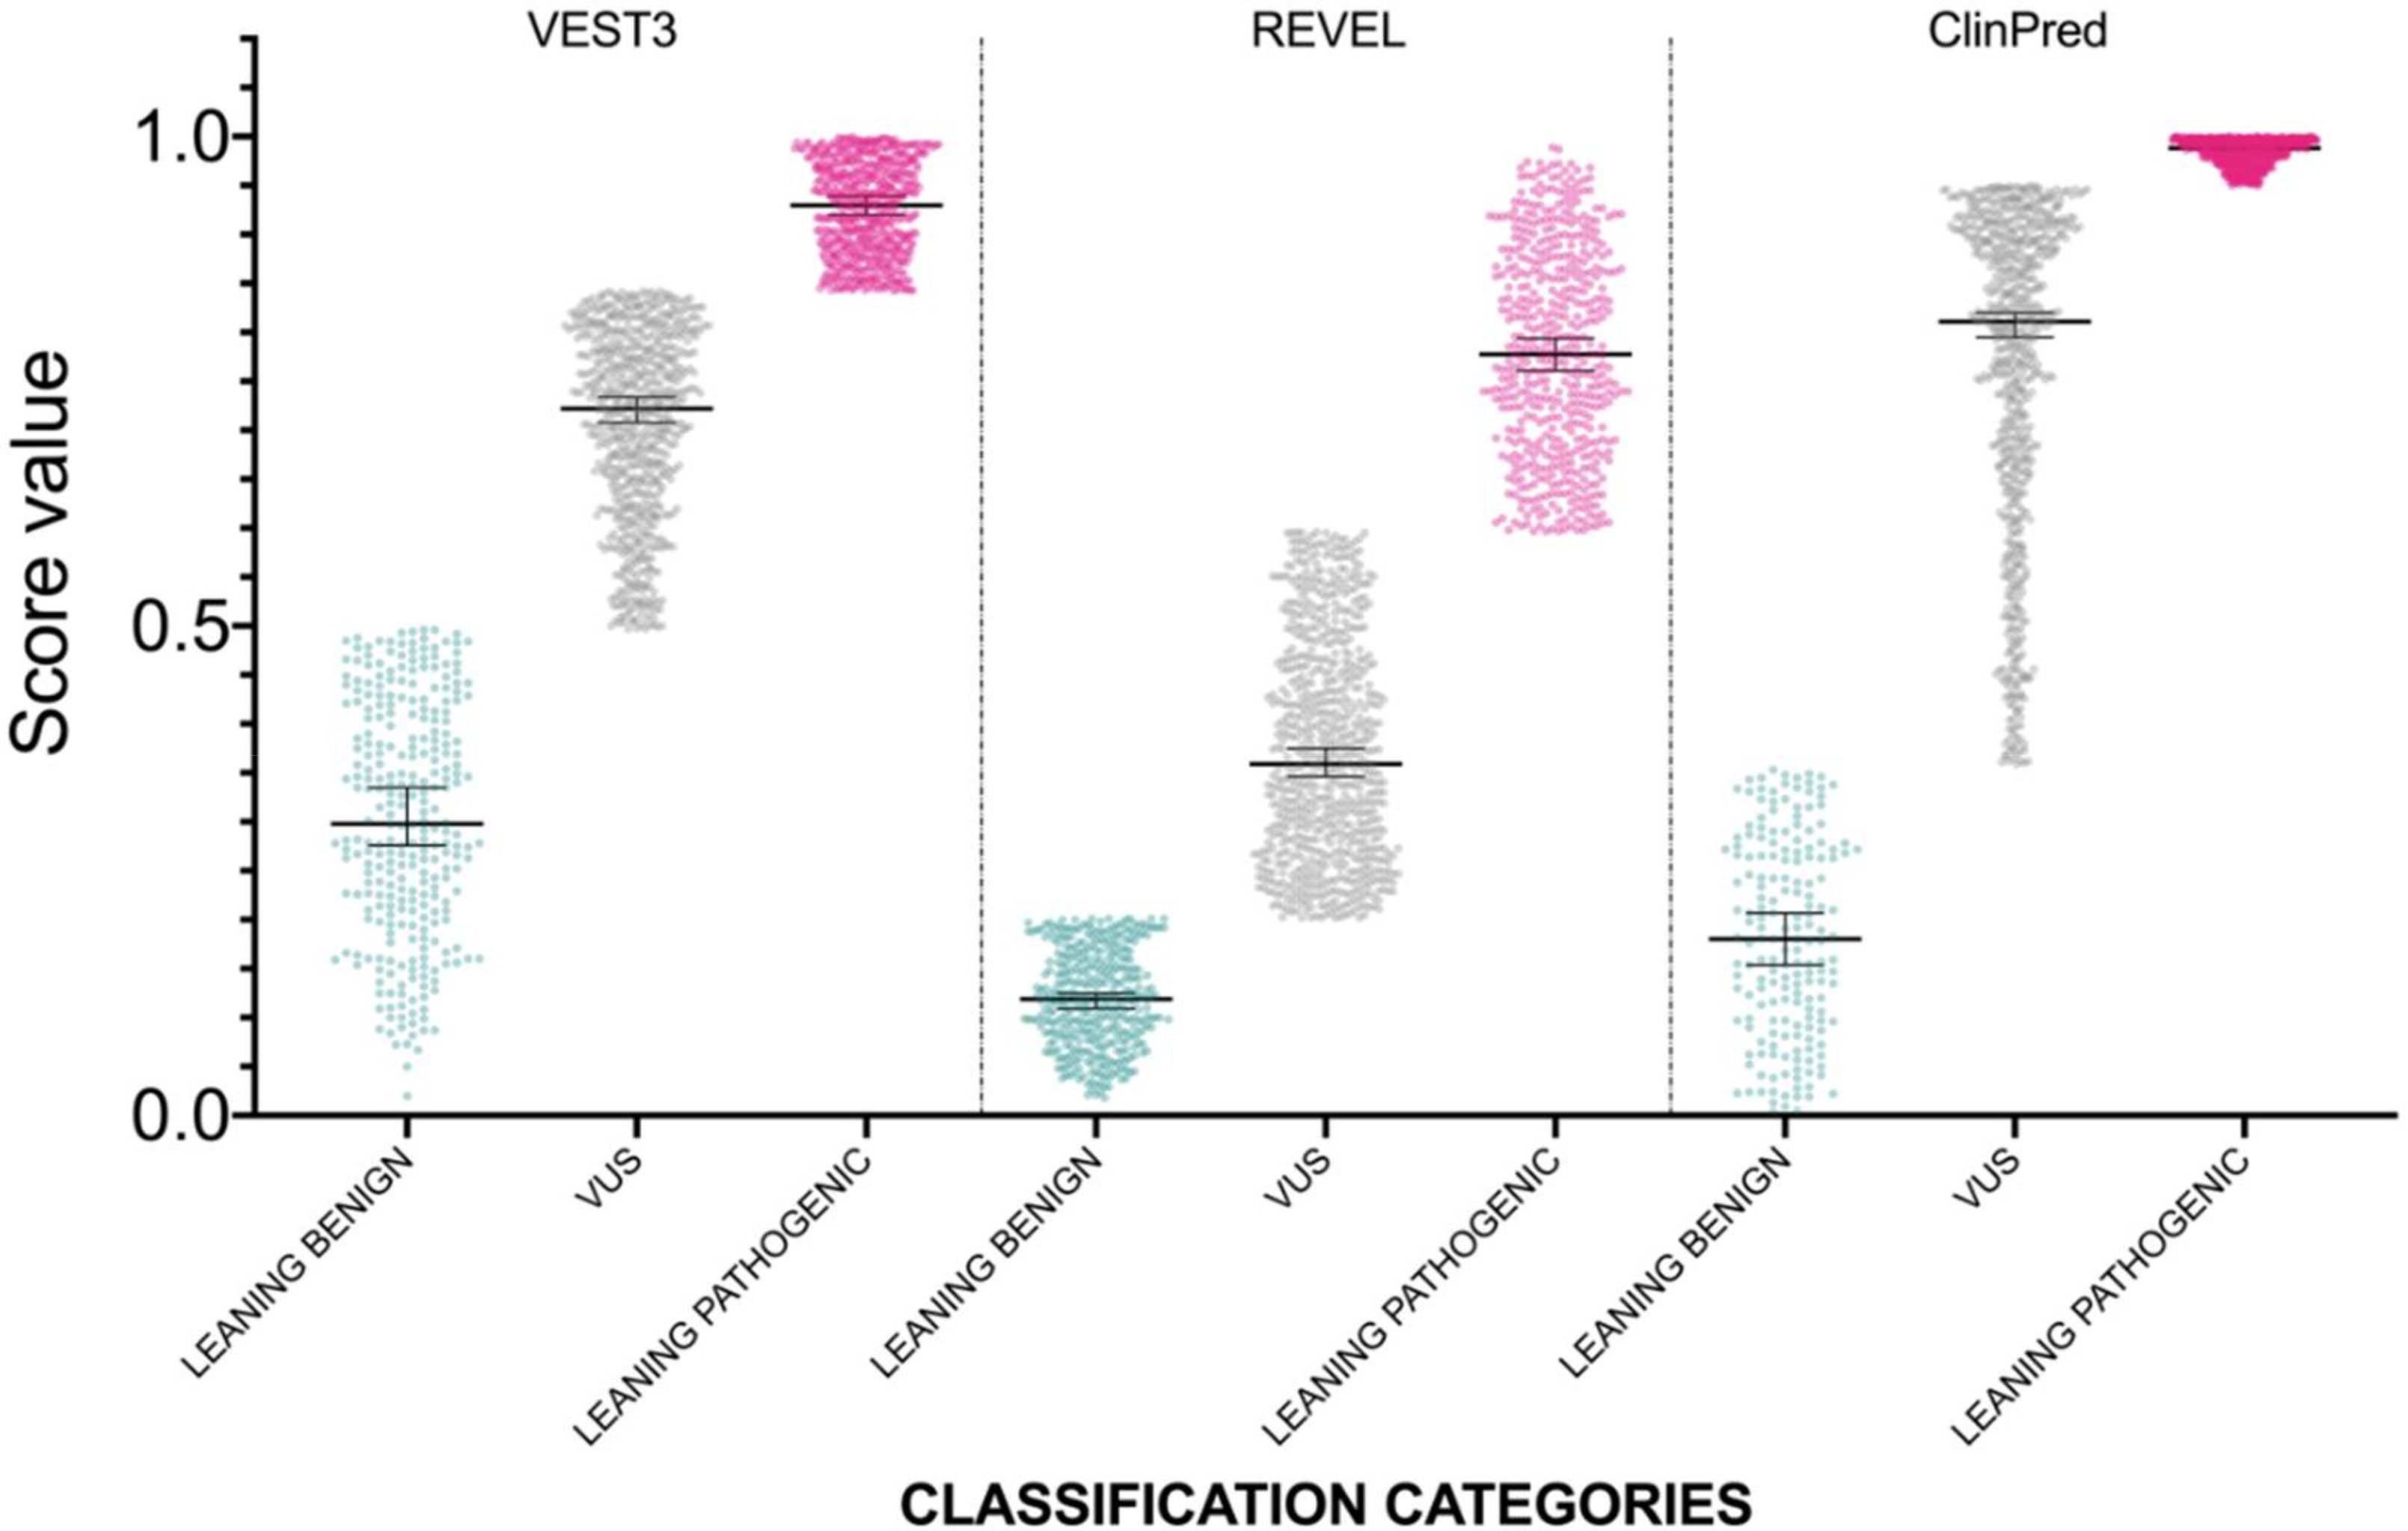
| Medians Difference | Adjusted p Value | ||
|---|---|---|---|
| VEST3 | LEANING BENIGN vs. VUS | −0.242 | <0.0001 |
| LEANING BENIGN vs. CI | −0.179 | 0.0022 | |
| LEANING BENIGN vs. LEANING PATHOGENIC | −0.42 | <0.0001 | |
| VUS vs. CI | 0.063 | 0.578 | |
| VUS vs. LEANING PATHOGENIC | −0.178 | <0.0001 | |
| CI vs. LEANING PATHOGENIC | −0.241 | <0.0001 | |
| REVEL | LEANING BENIGN vs. VUS | −0.165 | <0.0001 |
| LEANING BENIGN vs. CI | −0.058 | 0.0284 | |
| LEANING BENIGN vs. LEANING PATHOGENIC | −0.5235 | <0.0001 | |
| VUS vs. CI | 0.107 | 0.3313 | |
| VUS vs. LEANING PATHOGENIC | −0.3585 | <0.0001 | |
| CI vs. LEANING PATHOGENIC | −0.4655 | <0.0001 | |
| ClinPred | LEANING BENIGN vs. VUS | −0.52 | <0.0001 |
| LEANING BENIGN vs. CI | −0.0095 | 0.3826 | |
| LEANING BENIGN vs. LEANING PATHOGENIC | −0.599 | 0.0004 | |
| VUS vs. CI | 0.5105 | <0.0001 | |
| VUS vs. LEANING PATHOGENIC | −0.079 | <0.0001 | |
| CI vs. LEANING PATHOGENIC | −0.59 | <0.0001 |
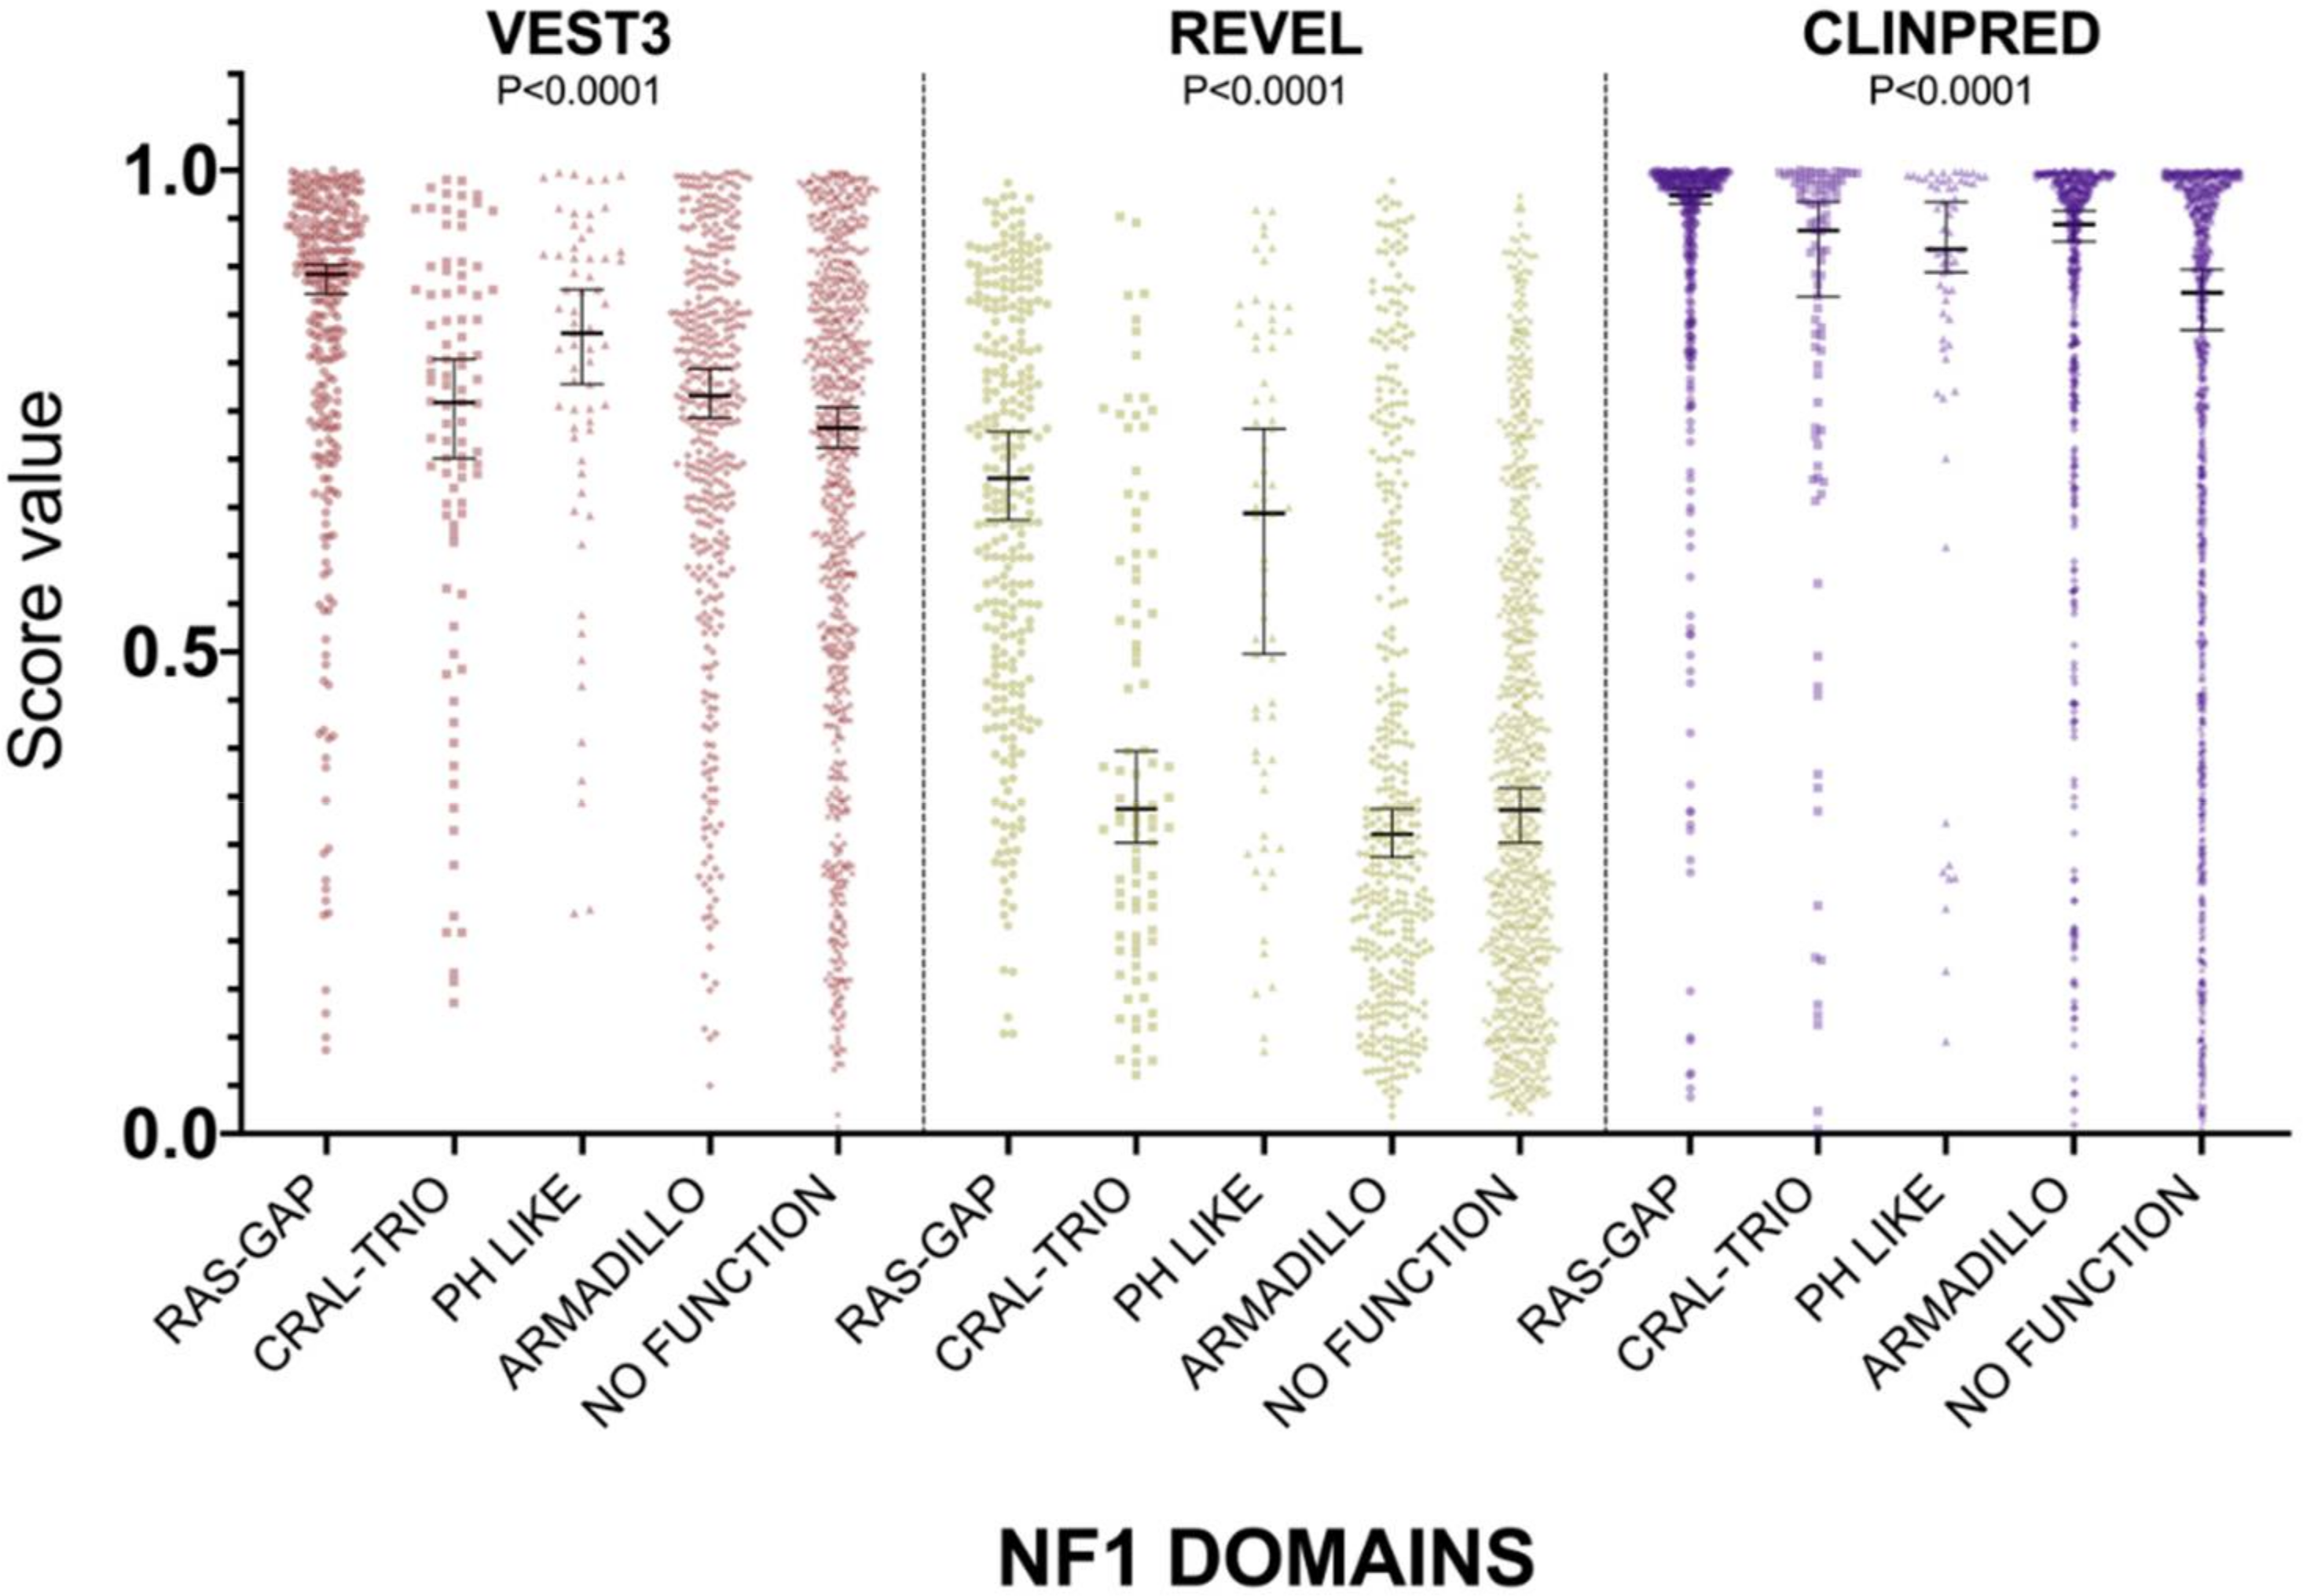
| VEST3 Scores Score Comparison INTER DOMAINS | Median Difference | Adjusted p Value |
|---|---|---|
| RAS-GAP vs. CRAL-TRIO | 0.133 | <0.0001 |
| RAS-GAP vs. PH LIKE | 0.061 | 0.1102 |
| RAS-GAP vs. ARMADILLO | 0.126 | <0.0001 |
| RAS-GAP vs. NO FUNCTION | 0.1595 | <0.0001 |
| CRAL-TRIO vs. PH LIKE | −0.072 | 0.0498 |
| CRAL-TRIO vs. ARMADILLO | −0.007 | 0.7220 |
| CRAL-TRIO vs. NO FUNCTION | 0.0265 | 0.3105 |
| PH LIKE vs. ARMADILLO | 0.065 | 0.0405 |
| PH LIKE vs. NO FUNCTION | 0.0985 | 0.0009 |
| ARMADILLO vs. NO FUNCTION | 0.0335 | 0.0174 |
| REVEL Scores Score Comparison INTER DOMAINS | Median Difference | p Value |
| RAS-GAP vs. CRAL-TRIO | 0.3435 | <0.0001 |
| RAS-GAP vs. PH LIKE | 0.0365 | 0.1087 |
| RAS-GAP vs. ARMADILLO | 0.3695 | <0.0001 |
| RAS-GAP vs. NO FUNCTION | 0.3445 | <0.0001 |
| CRAL-TRIO vs. PH LIKE | −0.307 | 0.0001 |
| CRAL-TRIO vs. ARMADILLO | 0.026 | 0.5751 |
| CRAL-TRIO vs. NO FUNCTION | 0.001 | 0.3637 |
| PH LIKE vs. ARMADILLO | 0.333 | <0.0001 |
| PH LIKE vs. NO FUNCTION | 0.308 | <0.0001 |
| ARMADILLO vs. NO FUNCTION | −0.025 | 0.4453 |
| ClinPred Scores Score Comparison INTER DOMAINS | Median Difference | p Value |
| RAS-GAP vs. CRAL-TRIO | 0.0365 | 0.013 |
| RAS-GAP vs. PH LIKE | 0.056 | 0.066 |
| RAS-GAP vs. ARMADILLO | 0.03 | 0.0002 |
| RAS-GAP vs. NO FUNCTION | 0.101 | <0.0001 |
| CRAL-TRIO vs. PH LIKE | 0.0195 | 0.8558 |
| CRAL-TRIO vs. ARMADILLO | −0.0065 | 0.8558 |
| CRAL-TRIO vs. NO FUNCTION | 0.0645 | 0.0283 |
| PH LIKE vs. ARMADILLO | −0.026 | 0.8558 |
| PH LIKE vs. NO FUNCTION | 0.045 | 0.0253 |
| ARMADILLO vs. NO FUNCTION | 0.071 | <0.0001 |
| METAPREDICTOR | Variant Classification at ClinVar | # of Variants Reclassified as Leaning Benign | # of Variants Reclassified as VOUS | # of Variants Reclassified as Leaning Pathogenic |
|---|---|---|---|---|
| VEST3 | B, LB, B/LB | 20 | 24 | 5 |
| VUS | 251 | 641 | 471 | |
| CI | 14 | 19 | 17 | |
| LP, LP/P, P | 1 | 23 | 98 | |
| TOTAL | 286 | 707 | 591 | |
| REVEL | B, LB, B/LB | 23 | 21 | 5 |
| VUS | 322 | 644 | 394 | |
| CI | 17 | 19 | 14 | |
| LP, LP/P, P | 6 | 33 | 83 | |
| TOTAL | 368 | 717 | 496 | |
| CLINPRED | B, LB, B/LB | 23 | 14 | 11 |
| VUS | 136 | 659 | 569 | |
| CI | 24 | 12 | 14 | |
| LP, LP/P, P | 0 | 18 | 104 | |
| TOTAL | 183 | 703 | 698 |
© 2020 by the authors. Licensee MDPI, Basel, Switzerland. This article is an open access article distributed under the terms and conditions of the Creative Commons Attribution (CC BY) license (http://creativecommons.org/licenses/by/4.0/).
Share and Cite
Accetturo, M.; Bartolomeo, N.; Stella, A. In-silico Analysis of NF1 Missense Variants in ClinVar: Translating Variant Predictions into Variant Interpretation and Classification. Int. J. Mol. Sci. 2020, 21, 721. https://doi.org/10.3390/ijms21030721
Accetturo M, Bartolomeo N, Stella A. In-silico Analysis of NF1 Missense Variants in ClinVar: Translating Variant Predictions into Variant Interpretation and Classification. International Journal of Molecular Sciences. 2020; 21(3):721. https://doi.org/10.3390/ijms21030721
Chicago/Turabian StyleAccetturo, Matteo, Nicola Bartolomeo, and Alessandro Stella. 2020. "In-silico Analysis of NF1 Missense Variants in ClinVar: Translating Variant Predictions into Variant Interpretation and Classification" International Journal of Molecular Sciences 21, no. 3: 721. https://doi.org/10.3390/ijms21030721
APA StyleAccetturo, M., Bartolomeo, N., & Stella, A. (2020). In-silico Analysis of NF1 Missense Variants in ClinVar: Translating Variant Predictions into Variant Interpretation and Classification. International Journal of Molecular Sciences, 21(3), 721. https://doi.org/10.3390/ijms21030721