Targeting the 16S rRNA Gene for Bacterial Identification in Complex Mixed Samples: Comparative Evaluation of Second (Illumina) and Third (Oxford Nanopore Technologies) Generation Sequencing Technologies

 , ,
, ,  and
and
Abstract
1. Introduction
2. Results
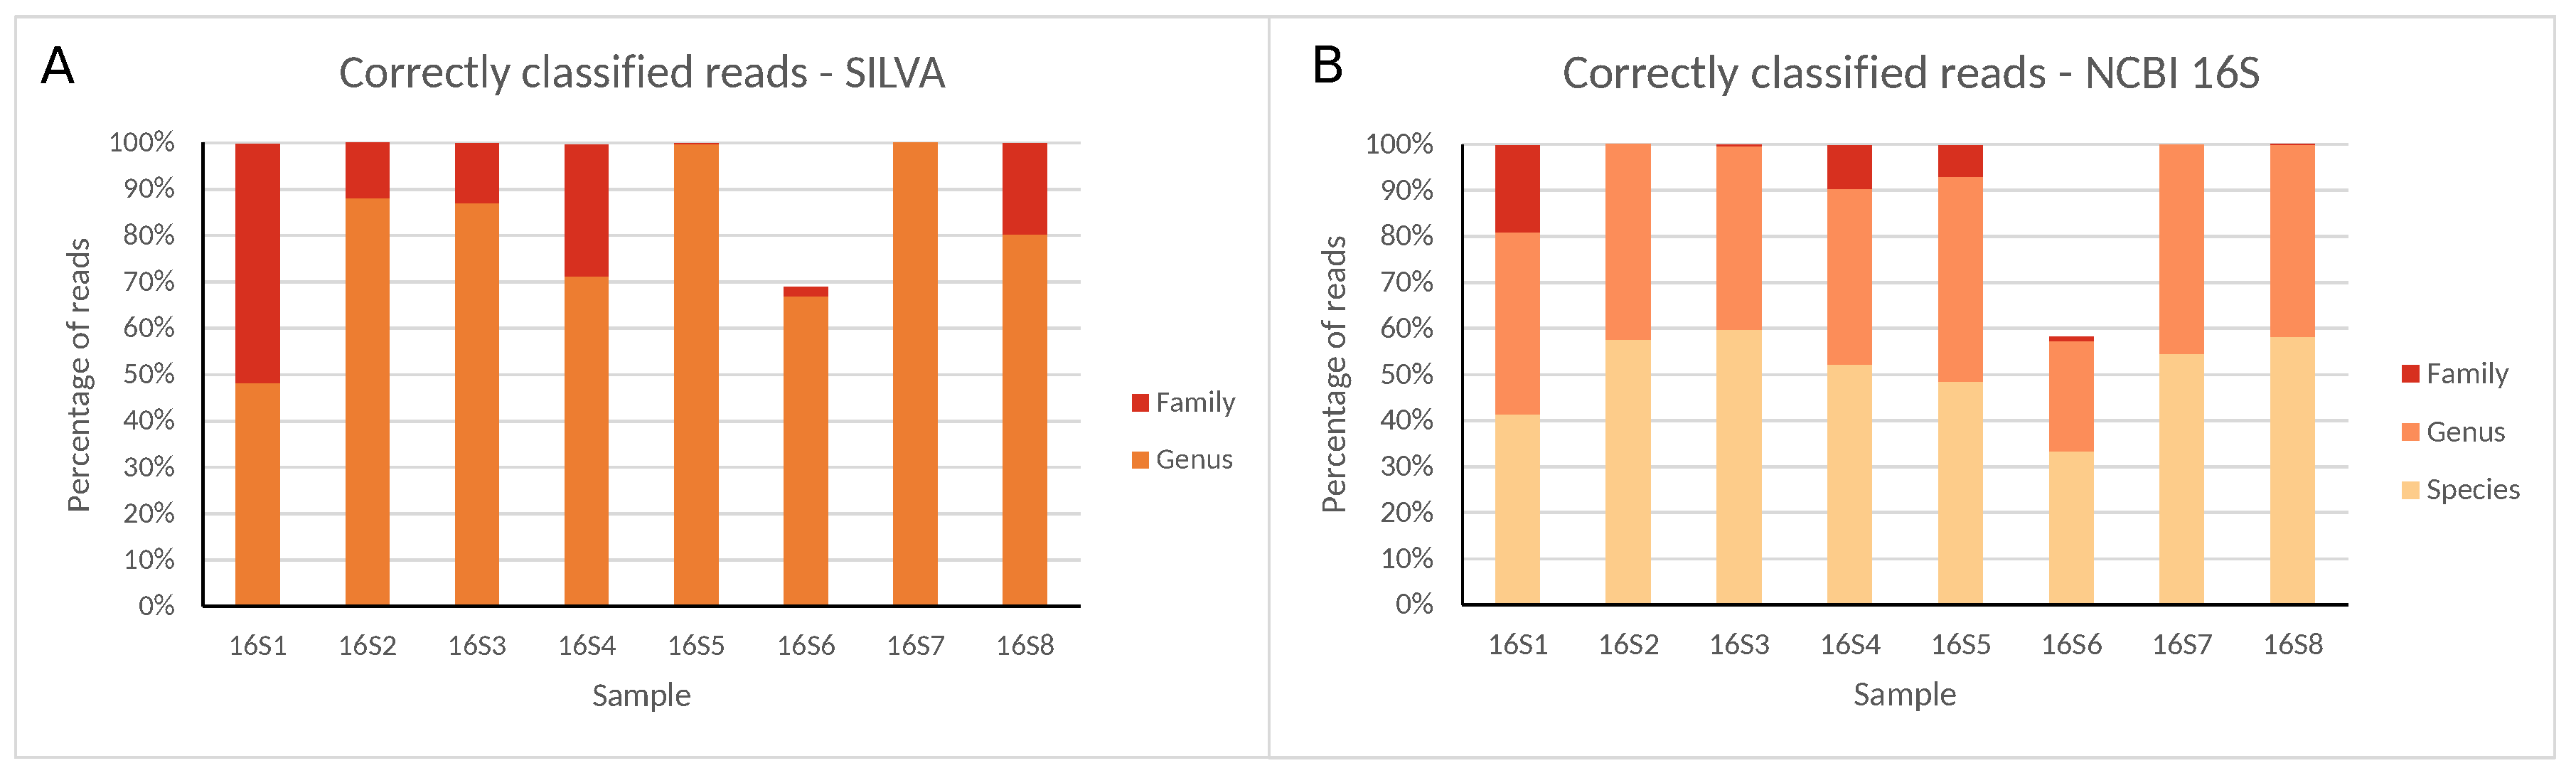
2.1. Classification of a Well-Characterized Reference Sample Through Sequencing Different 16S rRNA Gene Regions with the Illumina (MiSeq) Technology
2.2. Classification of a Well-Characterized Reference Sample through Sequencing the Entire 16S rRNA Gene with the ONT (MinION) Technology
3. Discussion
3.1. Employing Short-Read Second-Generation (Illumina) Sequencing to Characterize Different 16S rRNA Gene Regions
3.2. Employing Long-Read Third-Generation (ONT) Sequencing to Characterize the Entire 16S rRNA Gene
4. Conclusions
5. Materials and Methods
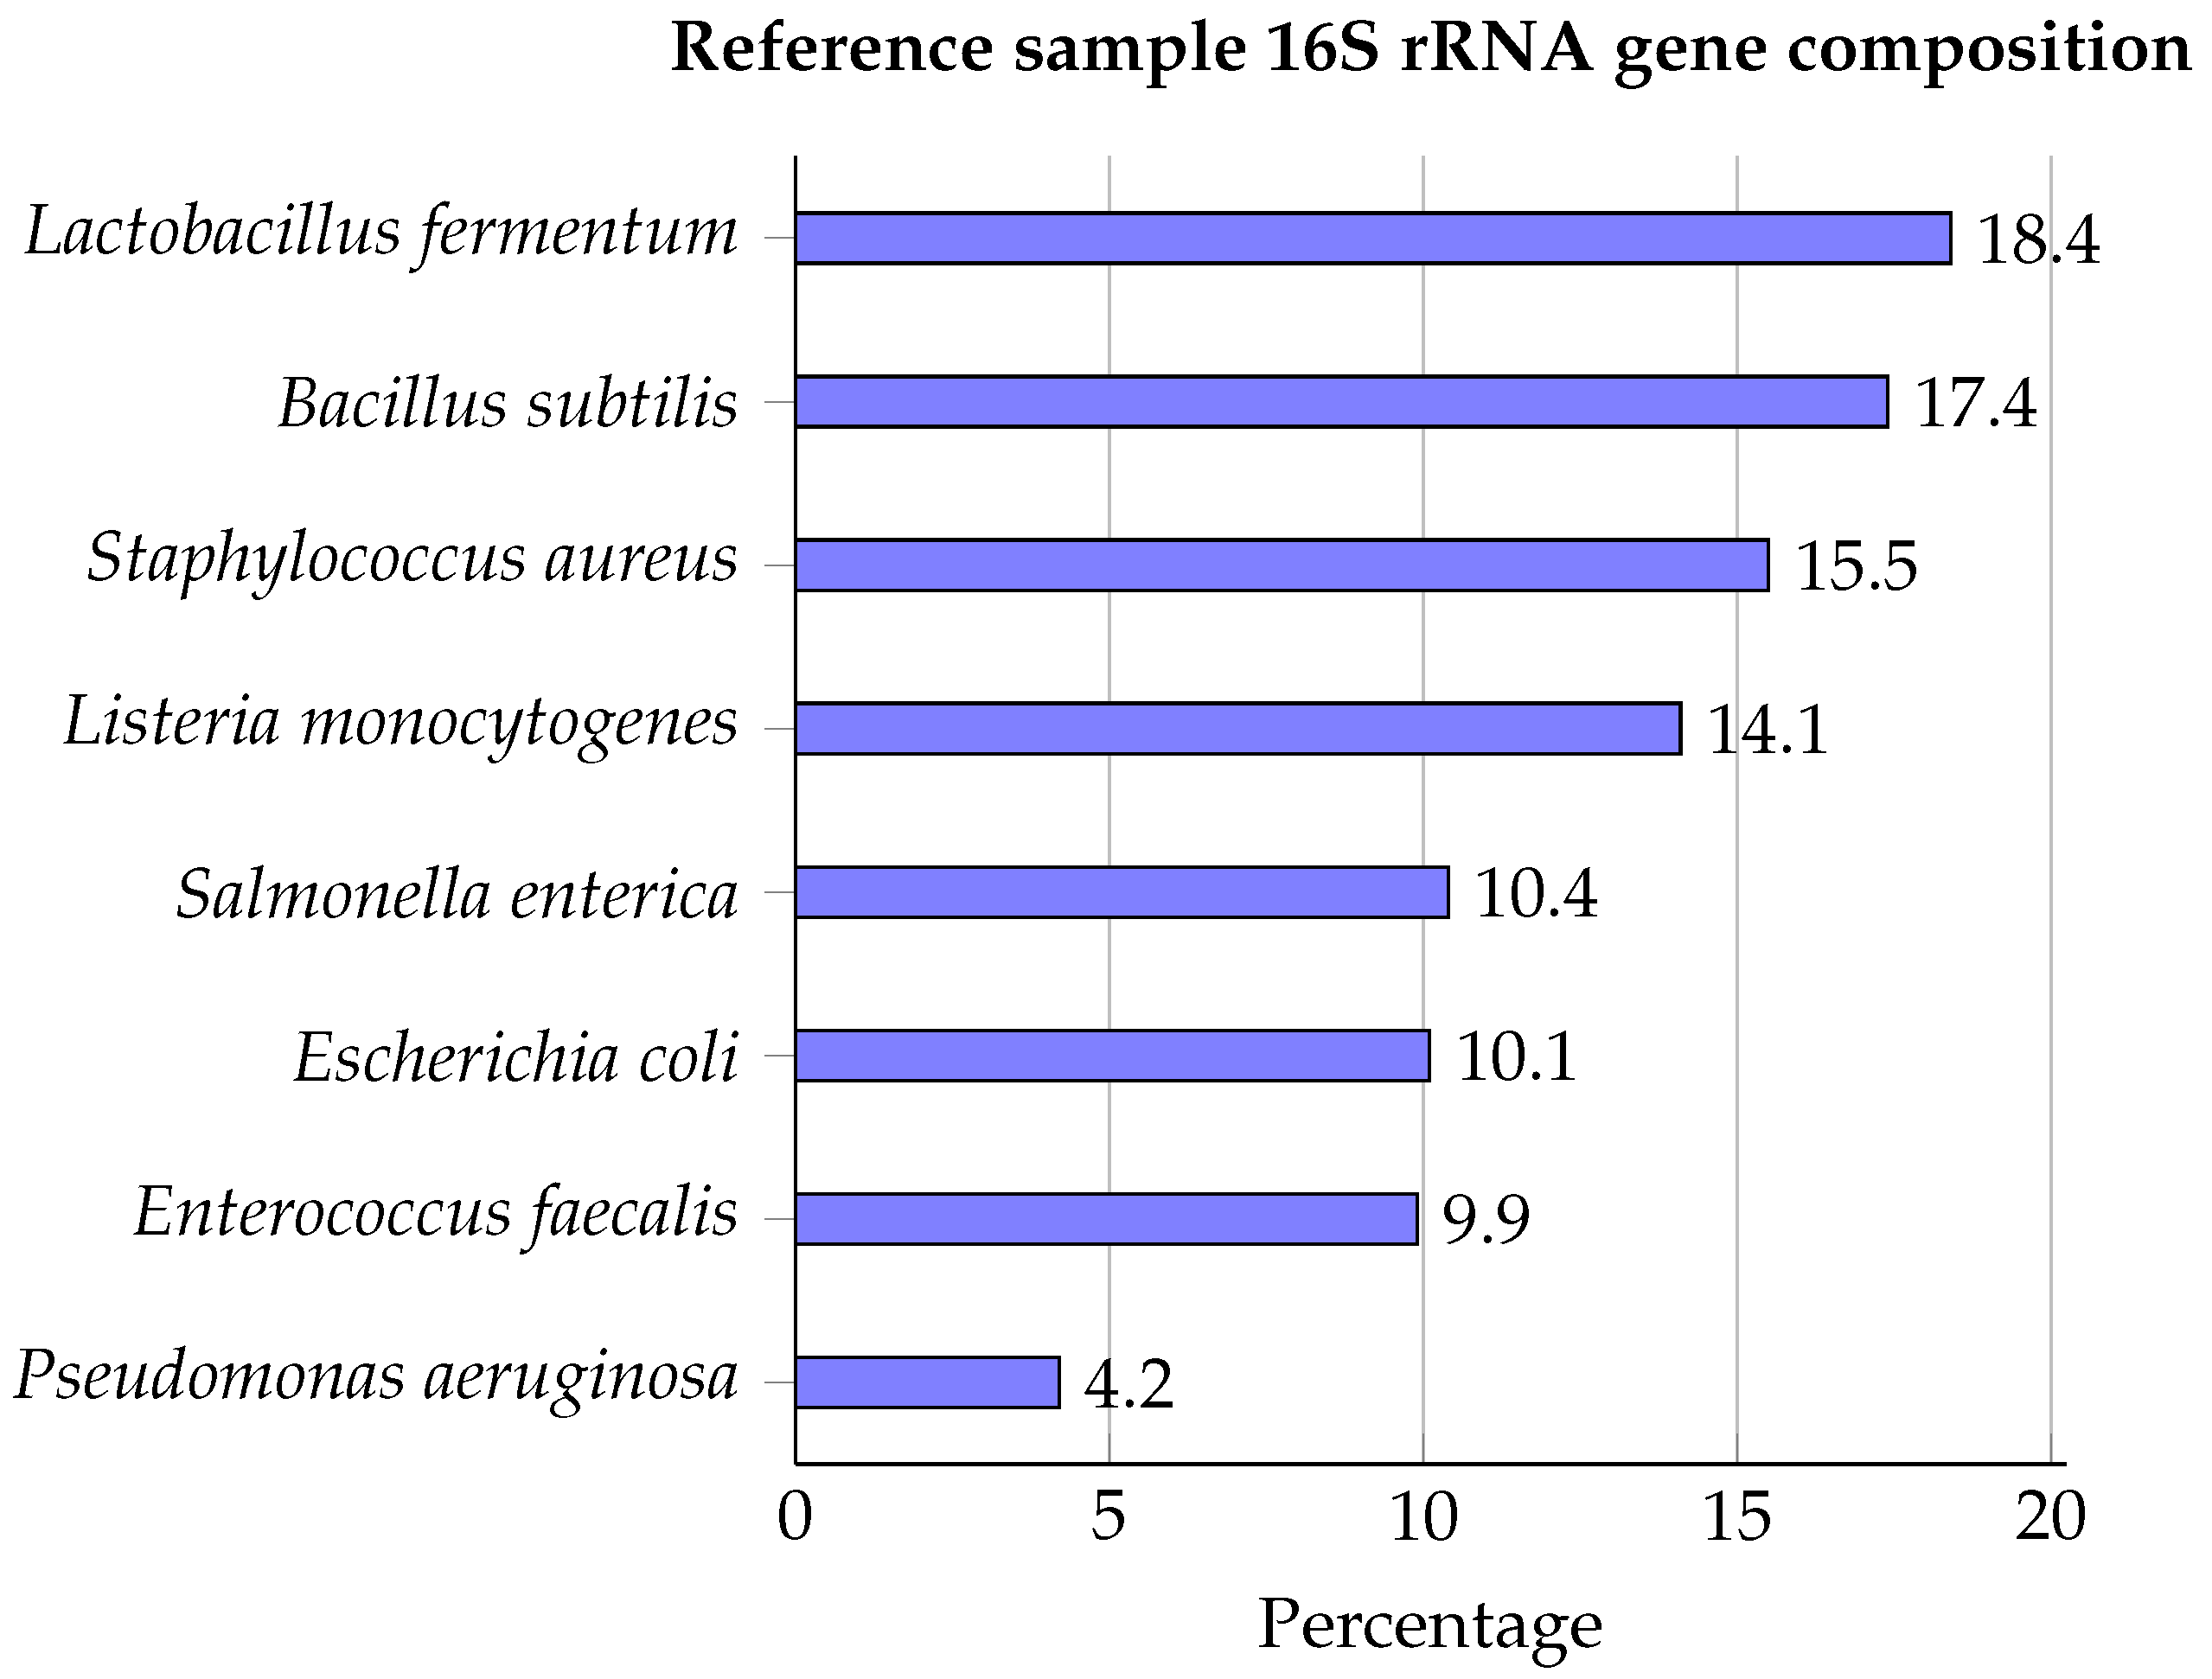
5.1. Reference Material
5.2. Generation and Analysis of Sequencing Data for Different 16S rRNA Gene Regions with the Illumina (MiSeq) Technology
5.2.1. Amplification and Sequencing
5.2.2. Bioinformatics Workflow
5.3. Generation and Analysis of Sequencing Data for the Complete 16S rRNA Gene with the ONT (MinION) Technology
5.3.1. Amplification and Sequencing
5.3.2. Bioinformatics Workflow
5.4. Data Availability and Supplementary Material
Supplementary Materials
Author Contributions
Acknowledgments
Conflicts of Interest
Abbreviations
| HTS | high-throughput sequencing |
| NGS | next-generation sequencing |
| NTC | non-template control |
| ONT | Oxford Nanopore Technologies |
| SOP | standard operating procedure |
References
- Petti, C.A.; Polage, C.R.; Schreckenberger, P. The role of 16S rRNA gene sequencing in identification of microorganisms misidentified by conventional methods. J. Clin. Microbiol. 2005, 43, 6123–6125. [Google Scholar] [CrossRef] [PubMed]
- Tringe, S.G.; Hugenholtz, P. A renaissance for the pioneering 16S rRNA gene. Curr. Opin. Microbiol. 2008, 11, 442–446. [Google Scholar] [CrossRef] [PubMed]
- Woo, P.C.; Lau, S.K.; Teng, J.L.; Tse, H.; Yuen, K.Y. Then and now: Use of 16S rDNA gene sequencing for bacterial identification and discovery of novel bacteria in clinical microbiology laboratories. Clin. Microbiol. Infect. 2008, 14, 908–934. [Google Scholar] [CrossRef] [PubMed]
- Woese, C.R. Bacterial evolution. Microbiol. Rev. 1987, 51, 221–271. [Google Scholar] [CrossRef]
- Andersson, A.F.; Lindberg, M.; Jakobsson, H.; Bäckhed, F.; Nyrén, P.; Engstrand, L. Comparative Analysis of Human Gut Microbiota by Barcoded Pyrosequencing. PLoS ONE 2008, 3, e2836. [Google Scholar] [CrossRef]
- Hermans, S.M.; Buckley, H.L.; Case, B.S.; Curran-Cournane, F.; Taylor, M.; Lear, G. Bacteria as emerging indicators of soil condition. Appl. Environ. Microbiol. 2016, 83, AEM.02826-16. [Google Scholar] [CrossRef]
- Kirchman, D.L.; Cottrell, M.T.; Lovejoy, C. The structure of bacterial communities in the western Arctic Ocean as revealed by pyrosequencing of 16S rRNA genes. Environ. Microbiol. 2010, 12, 1132–1143. [Google Scholar] [CrossRef]
- Srinivasan, R.; Karaoz, U.; Volegova, M.; MacKichan, J.; Kato-Maeda, M.; Miller, S.; Nadarajan, R.; Brodie, E.L.; Lynch, S.V. Use of 16S rRNA gene for identification of a broad range of clinically relevant bacterial pathogens. PLoS ONE 2015, 10, e0117617. [Google Scholar] [CrossRef]
- Mignard, S.; Flandrois, J.P. 16S rRNA sequencing in routine bacterial identification: A 30-month experiment. J. Microbiol. Methods 2006, 67, 574–581. [Google Scholar] [CrossRef]
- Janda, J.M.; Abbott, S.L. 16S rRNA gene sequencing for bacterial identification in the diagnostic laboratory: Pluses, perils, and pitfalls. J. Clin. Microbiol. 2007, 45, 2761–2764. [Google Scholar] [CrossRef]
- Tremblay, J.; Singh, K.; Fern, A.; Kirton, E.S.; He, S.; Woyke, T.; Lee, J.; Chen, F.; Dangl, J.L.; Tringe, S.G. Primer and platform effects on 16S rRNA tag sequencing. Front. Microbiol. 2015, 6, 1–15. [Google Scholar] [CrossRef] [PubMed]
- Yang, B.; Wang, Y.; Qian, P.Y. Sensitivity and correlation of hypervariable regions in 16S rRNA genes in phylogenetic analysis. BMC Bioinform. 2016, 17, 1–8. [Google Scholar] [CrossRef] [PubMed]
- Bercovier, H.; Kafri, O.; Sela, S. Mycobacteria possess a surprisingly small number of ribosomal RNA genes in relation to the size of their genome. Biochem. Biophys. Res. Commun. 1986, 136, 1136–1141. [Google Scholar] [CrossRef]
- Ellwood, M.; Nomura, M. Deletion of a ribosomal ribonucleic acid operon in Escherichia coli. J. Bacteriol. 1980, 143, 1077–1080. [Google Scholar] [PubMed]
- Rainey, F.A.; Ward-Rainey, N.L.; Janssen, P.H.; Hippe, H.; Stackebrandt, E. Clostridium paradoxum DSM 7308(T) contains multiple 16S rRNA genes with heterogeneous intervening sequences. Microbiology 1996, 142, 2087–2095. [Google Scholar] [CrossRef] [PubMed]
- Schloss, P.D. Re: Updating the 97% identity threshold for 16S ribosomal RNA OTUs. Bioinformatics 2017. [Google Scholar] [CrossRef]
- Cao, Y.; Fanning, S.; Proos, S.; Jordan, K.; Srikumar, S. A Review on the Applications of Next Generation Sequencing Technologies as Applied to Food-Related Microbiome Studies. Front. Microbiol. 2017, 8, 1829. [Google Scholar] [CrossRef]
- Baker, G.C.; Smith, J.J.; Cowan, D.A. Review and re-analysis of domain-specific 16S primers. J. Microbiol. Methods 2003, 55, 541–555. [Google Scholar] [CrossRef]
- Claesson, M.J.; Wang, Q.; O’Sullivan, O.; Greene-Diniz, R.; Cole, J.R.; Ross, R.P.; O’Toole, P.W. Comparison of two next-generation sequencing technologies for resolving highly complex microbiota composition using tandem variable 16S rRNA gene regions. Nucleic Acids Res. 2010, 38. [Google Scholar] [CrossRef]
- Ley, R.E.; Backhed, F.; Turnbaugh, P.; Lozupone, C.A.; Knight, R.D.; Gordon, J.I. Obesity alters gut microbial ecology. Proc. Natl. Acad. Sci. USA 2005, 102, 11070–11075. [Google Scholar] [CrossRef]
- Drancourt, M.; Bollet, C.; Carlioz, A.; Martelin, R.; Gayral, J.P.; Raoult, D. 16S ribosomal DNA sequence analysis of a large collection of environmental and clinical unidentifiable bacterial isolates. J. Clin. Microbiol. 2000, 38, 3623–3630. [Google Scholar] [CrossRef] [PubMed]
- Reuter, J.A.; Spacek, D.V.; Snyder, M.P. High-Throughput Sequencing Technologies. Mol. Cell 2015, 58, 586–597. [Google Scholar] [CrossRef] [PubMed]
- Decuypere, S.; Meehan, C.J.; Van Puyvelde, S.; De Block, T.; Maltha, J.; Palpouguini, L.; Tahita, M.; Tinto, H.; Jacobs, J.; Deborggraeve, S. Diagnosis of Bacterial Bloodstream Infections: A 16S Metagenomics Approach. PLoS Negl. Trop. Dis. 2016, 10, 1–12. [Google Scholar] [CrossRef] [PubMed]
- Moon, J.; Kim, N.; Lee, H.S.; Shin, H.R.; Lee, S.T.; Jung, K.H.; Park, K.I.; Lee, S.K.; Chu, K. Campylobacter fetus meningitis confirmed by a 16S rRNA gene analysis using the MinION nanopore sequencer, South Korea, 2016. Emerg. Microbes Infect. 2017, 6, e94. [Google Scholar] [CrossRef] [PubMed]
- Salipante, S.J.; Sengupta, D.J.; Rosenthal, C.; Costa, G.; Spangler, J.; Sims, E.H.; Jacobs, M.A.; Miller, S.I.; Hoogestraat, D.R.; Cookson, B.T.; et al. Rapid 16S rRNA Next-Generation Sequencing of Polymicrobial Clinical Samples for Diagnosis of Complex Bacterial Infections. PLoS ONE 2013, 8, e65226. [Google Scholar] [CrossRef] [PubMed]
- Life Technologies. 16S rRNA Sequencing. In An Integrated Research Solution for Bacterial Identification Using 16S rRNA Sequencing on the Ion PGM System With Ion Reporter Software; Application Note; Thermo Fisher Scientific Inc.: Waltham, MA, USA, 2014. [Google Scholar]
- Jain, M.; Koren, S.; Miga, K.H.; Quick, J.; Rand, A.C.; Sasani, T.A.; Tyson, J.R.; Beggs, A.D.; Dilthey, A.T.; Fiddes, I.T.; et al. Nanopore sequencing and assembly of a human genome with ultra-long reads. Nat. Biotechnol. 2018, 36, 338–345. [Google Scholar] [CrossRef]
- Payne, A.; Holmes, N.; Rakyan, V.; Loose, M. BulkVis: A graphical viewer for Oxford nanopore bulk FAST5 files. Bioinformatics 2019, 35, 2193–2198. [Google Scholar] [CrossRef]
- van Dijk, E.L.; Jaszczyszyn, Y.; Naquin, D.; Thermes, C. The Third Revolution in Sequencing Technology. Trends Genet. 2018, 34, 666–681. [Google Scholar] [CrossRef]
- Kilianski, A.; Haas, J.L.; Corriveau, E.J.; Liem, A.T.; Willis, K.L.; Kadavy, D.R.; Rosenzweig, C.N.; Minot, S.S. Bacterial and viral identification and differentiation by amplicon sequencing on the MinION nanopore sequencer. GigaScience 2015, 4. [Google Scholar] [CrossRef]
- Quick, J.; Loman, N.J.; Duraffour, S.; Simpson, J.T.; Severi, E.; Cowley, L.; Bore, J.A.; Koundouno, R.; Dudas, G.; Mikhail, A.; et al. Real-time, portable genome sequencing for Ebola surveillance. Nature 2016, 530, 228–232. [Google Scholar] [CrossRef]
- Jain, M.; Tyson, J.R.; Loose, M.; Ip, C.L.; Eccles, D.A.; O’Grady, J.; Malla, S.; Leggett, R.M.; Wallerman, O.; Jansen, H.J.; et al. MinION Analysis and Reference Consortium: Phase 2 data release and analysis of R9.0 chemistry. F1000Research 2017, 6, 760. [Google Scholar] [CrossRef] [PubMed]
- Wright, C. Overview of Raw Signal Production, Processing, Basecalling. In Proceedings of the Utrecht Nanopore Meeting, Utrecht, The Netherlands, 17 October 2017. [Google Scholar]
- Nicholls, S.M.; Quick, J.C.; Tang, S.; Loman, N.J. Ultra-deep, long-read nanopore sequencing of mock microbial community standards. GigaScience 2019, 8, 1–9. [Google Scholar] [CrossRef] [PubMed]
- Loman, N.J.; Misra, R.V.; Dallman, T.J.; Constantinidou, C.; Gharbia, S.E.; Wain, J.; Pallen, M.J. Performance comparison of benchtop high-throughput sequencing platforms. Nat. Biotechnol. 2012, 30, 434–439. [Google Scholar] [CrossRef] [PubMed]
- Reller, L.B.; Weinstein, M.P.; Petti, C.A. Detection and Identification of Microorganisms by Gene Amplification and Sequencing. Clin. Infect. Dis. 2007, 44, 1108–1114. [Google Scholar] [CrossRef] [PubMed]
- Schloss, P.D.; Westcott, S.L.; Ryabin, T.; Hall, J.R.; Hartmann, M.; Hollister, E.B.; Lesniewski, R.A.; Oakley, B.B.; Parks, D.H.; Robinson, C.J.; et al. Introducing mothur: Open-source, platform-independent, community-supported software for describing and comparing microbial communities. Appl. Environ. Microbiol. 2009, 75, 7537–7541. [Google Scholar] [CrossRef] [PubMed]
- Unno, T. Bioinformatic suggestions on MiSeq-based microbial community analysis. J. Microbiol. Biotechnol. 2015, 25, 765–770. [Google Scholar] [CrossRef]
- Branton, D.; Deamer, D. Nanopore Sequencing: An Introduction; World Scientific: Singapore, 2019; p. 216. [Google Scholar] [CrossRef]
- Koren, S.; Walenz, B.P.; Berlin, K.; Miller, J.R.; Bergman, N.H.; Phillippy, A.M. Canu: Scalable and accurate long-read assembly via adaptive k -mer weighting and repeat separation. Genome Res. 2017, 27, 722–736. [Google Scholar] [CrossRef]
- Loman, N.J.; Quick, J.; Simpson, J.T. A complete bacterial genome assembled de novo using only nanopore sequencing data. Nat. Methods 2015, 12, 733–735. [Google Scholar] [CrossRef]
- Sović, I.; Šikić, M.; Wilm, A.; Fenlon, S.N.; Chen, S.; Nagarajan, N. Fast and sensitive mapping of nanopore sequencing reads with GraphMap. Nat. Commun. 2016, 7. [Google Scholar] [CrossRef]
- Quast, C.; Pruesse, E.; Yilmaz, P.; Gerken, J.; Schweer, T.; Yarza, P.; Peplies, J.; Glöckner, F.O. The SILVA ribosomal RNA gene database project: Improved data processing and web-based tools. Nucleic Acids Res. 2013, 41, 590–596. [Google Scholar] [CrossRef]
- Yilmaz, P.; Parfrey, L.W.; Yarza, P.; Gerken, J.; Pruesse, E.; Quast, C.; Schweer, T.; Peplies, J.; Ludwig, W.; Glöckner, F.O. The SILVA and “All-species Living Tree Project (LTP)” taxonomic frameworks. Nucleic Acids Res. 2014, 42, D643–D648. [Google Scholar] [CrossRef] [PubMed]
- Zymo Research Corp. Instruction Manual ZymoBIOMICS Microbial Community DNA Standard. 2018. Available online: https://files.zymoresearch.com/protocols/_d6305_d6306_zymobiomics_microbial_community_dna_standard.pdf (accessed on 31 January 2018).
- Novogene. Amplicon Sequencing. Available online: https://en.novogene.com/next-generation-sequencing-services/microbial-genome/amplicon-sequencing/ (accessed on 14 November 2019).
- Lu, Y.Z.; Ding, Z.W.; Ding, J.; Fu, L.; Zeng, R.J. Design and evaluation of universal 16S rRNA gene primers for high-throughput sequencing to simultaneously detect DAMO microbes and anammox bacteria. Water Res. 2015, 87, 385–394. [Google Scholar] [CrossRef] [PubMed]
- Benítez-Páez, A.; Sanz, Y. Multi-locus and long amplicon sequencing approach to study microbial diversity at species level using the MinIONTMportable nanopore sequencer. GigaScience 2017, 6, 1–12. [Google Scholar] [CrossRef] [PubMed]
- D’Amore, R.; Ijaz, U.Z.; Schirmer, M.; Kenny, J.G.; Gregory, R.; Darby, A.C.; Shakya, M.; Podar, M.; Quince, C.; Hall, N. A comprehensive benchmarking study of protocols and sequencing platforms for 16S rRNA community profiling. BMC Genom. 2016, 17. [Google Scholar] [CrossRef]
- Ku, H.J.; Lee, J.H. Development of a novel long-range 16s rRNA universal primer set for metagenomic analysis of gastrointestinal microbiota in newborn infants. J. Microbiol. Biotechnol. 2014, 24, 812–822. [Google Scholar] [CrossRef]
- HMP Consortium. Bacterial V1-3 16S rRNA Amplicon Sequencing. 2010. Available online: http://www.midasfieldguide.org/download/protocols/16s_amp_v13/161111_ebstd_bacteria_v1-3_16s_rrna_amplicon_sequencing_v12.pdf (accessed on 14 November 2018).
- Van Der Hel, O.L.; Van Der Luijt, R.B.; Bas Bueno De Mesquita, H.; Van Noord, P.A.; Slothouber, B.; Roest, M.; Van Der Schouw, Y.T.; Grobbee, D.E.; Pearson, P.L.; Peeters, P.H. Quality and quantity of DNA isolated from frozen urine in population-based research. Anal. Biochem. 2002, 304, 206–211. [Google Scholar] [CrossRef]
- Greisen, K.; Loeffelholz, M.; Purohit, A.; Leong, D. PCR primers and probes for the 16S rRNA gene of most species of pathogenic bacteria, including bacteria found in cerebrospinal fluid. J. Clin. Microbiol. 1994, 32, 335–351. [Google Scholar]
- Oxford Nanopore. Barcode of Life: Simple Laboratory and Analysis Workflows for 16s and CO1 Analysis. 2016. Available online: https://nanoporetech.com/resource-centre/barcode-life-simple-laboratory-and-analysis-workflows-16s-and-co1-analysis (accessed on 12 November 2018).
- Chiu, C.Y.; Naccache, S.N.; Tauro, L.B.; Somasekar, S.; Bandeira, A.C.; Sardi, S.I.; Campos, G.S. Coinfections of Zika and Chikungunya Viruses in Bahia, Brazil, Identified by Metagenomic Next-Generation Sequencing. J. Clin. Microbiol. 2016, 54, 2348–2353. [Google Scholar] [CrossRef]
- Stramer, S.L.; Somasekar, S.; Linnen, J.M.; Federman, S.; Dodd, R.; Stryke, D.; Naccache, S.N.; Muyembe-Tamfum, J.J.; Yu, G.; Mulembakani, P.; et al. Rapid metagenomic identification of viral pathogens in clinical samples by real-time nanopore sequencing analysis. Genome Med. 2015, 7, 1–13. [Google Scholar] [CrossRef]
- Callahan, B.J.; Wong, J.; Heiner, C.; Oh, S.; Theriot, C.M.; Gulati, A.S.; McGill, S.K.; Dougherty, M.K. High-throughput amplicon sequencing of the full-length 16S rRNA gene with single-nucleotide resolution. Nucleic Acids Res. 2019, 47, e103. [Google Scholar] [CrossRef]
- García-Rodríguez, A.; Atxaerandio, R.; López-García, A.; Pérez, A.; González-Recio, O.; Hernández, I.; Pineda-Quiroga, C. Comparison of Mothur and QIIME for the Analysis of Rumen Microbiota Composition Based on 16S rRNA Amplicon Sequences. Front. Microbiol. 2018, 9, 1–11. [Google Scholar] [CrossRef]
- Lluch, J.; Servant, F.; Païssé, S.; Valle, C.; Valière, S.; Kuchly, C.; Vilchez, G.; Donnadieu, C.; Courtney, M.; Burcelin, R.; et al. The characterization of novel tissue microbiota using an optimized 16S metagenomic sequencing pipeline. PLoS ONE 2015, 10, e0142334. [Google Scholar] [CrossRef] [PubMed]
- Mohd Shaufi, M.A.; Sieo, C.C.; Chong, C.W.; Gan, H.M.; Ho, Y.W. Deciphering chicken gut microbial dynamics based on high-throughput 16S rRNA metagenomics analyses. Gut Pathog. 2015, 7, 1–12. [Google Scholar] [CrossRef] [PubMed]
- Balvočiūtė, M.; Huson, D.H. SILVA, RDP, Greengenes, NCBI and OTT—How do these taxonomies compare? BMC Genom. 2017, 18, 114. [Google Scholar] [CrossRef]
- Větrovský, T.; Baldrian, P. The Variability of the 16S rRNA Gene in Bacterial Genomes and Its Consequences for Bacterial Community Analyses. PLoS ONE 2013, 8, e57923. [Google Scholar] [CrossRef]
- Kircher, M.; Sawyer, S.; Meyer, M. Double indexing overcomes inaccuracies in multiplex sequencing on the Illumina platform. Nucleic Acids Res. 2012, 40, e3. [Google Scholar] [CrossRef]
- Wright, E.S.; Vetsigian, K.H. Quality filtering of Illumina index reads mitigates sample cross-talk. BMC Genom. 2016, 17, 876. [Google Scholar] [CrossRef]
- Laurence, M.; Hatzis, C.; Brash, D.E. Common contaminants in next-generation sequencing that hinder discovery of low-abundance microbes. PLoS ONE 2014, 9, e97876. [Google Scholar] [CrossRef]
- Salter, S.J.; Cox, M.J.; Turek, E.M.; Calus, S.T.; Cookson, W.O.; Moffatt, M.F.; Turner, P.; Parkhill, J.; Loman, N.J.; Walker, A.W. Reagent and laboratory contamination can critically impact sequence-based microbiome analyses. BMC Biol. 2014, 12, 87. [Google Scholar] [CrossRef]
- Weyrich, L.; Farrer, A.G.; Eisenhofer, R.; Arriola, L.A.; Young, J.; Selway, C.A.; Handsley-Davis, M.; Adler, C.; Breen, J.; Cooper, A. Laboratory contamination over time during low-biomass sample analysis. bioRxiv 2018. [Google Scholar] [CrossRef]
- Anzai, Y.; Kim, H.; Park, J.Y.; Wakabayashi, H.; Oyaizu, H.; The, P. Phylogenetic affiliation of the pseudomonads based on 16S rRNA sequence become a dumping ground for incompletely characterized polarly flagellated, of 128 valid and invalid Pseudomonas species, which included almost valid species of the genus Pseudomona. Int. J. Syst. Evol. Microbiol. 2000, 50, 1563–1589. [Google Scholar] [CrossRef] [PubMed]
- Özen, A.I.; Ussery, D.W. Defining the Pseudomonas Genus: Where Do We Draw the Line with Azotobacter? Microb. Ecol. 2012, 63, 239–248. [Google Scholar] [CrossRef] [PubMed]
- Alnajar, S.; Gupta, R.S. Phylogenomics and comparative genomic studies delineate six main clades within the family Enterobacteriaceae and support the reclassification of several polyphyletic members of the family. Infect. Genet. Evol. 2017, 54, 108–127. [Google Scholar] [CrossRef] [PubMed]
- Sallen, B.; Rajoharison, A.; Desvarenne, S.; Quinn, F.; Mabilat, C. Comparative analysis of 16S and 23S rRNA sequences of Listeria species. Int. J. Syst. Bacteriol. 1996, 46, 669–674. [Google Scholar] [CrossRef]
- Jenkins, C.; Ling, C.L.; Ciesielczuk, H.L.; Lockwood, J.; Hopkins, S.; McHugh, T.D.; Gillespie, S.H.; Kibbler, C.C. Detection and identification of bacteria in clinical samples by 16S rRNA gene sequencing: Comparison of two different approaches in clinical practice. J. Med. Microbiol. 2012, 61, 483–488. [Google Scholar] [CrossRef]
- Wang, Q.; Garrity, G.M.; Tiedje, J.M.; Cole, J.R. Naïve Bayesian classifier for rapid assignment of rRNA sequences into the new bacterial taxonomy. Appl. Environ. Microbiol. 2007, 73, 5261–5267. [Google Scholar] [CrossRef]
- Böhme, K.; Fernández-No, I.C.; Pazos, M.; Gallardo, J.M.; Barros-Velázquez, J.; Cañas, B.; Calo-Mata, P. Identification and classification of seafood-borne pathogenic and spoilage bacteria: 16S rRNA sequencing versus MALDI-TOF MS fingerprinting. Electrophoresis 2013, 34, 877–887. [Google Scholar] [CrossRef]
- Giongo, A.; Davis-Richardson, A.G.; Crabb, D.B.; Triplett, E.W. TaxCollector: Modifying Current 16S rRNA Databases for the Rapid Classification at Six Taxonomic Levels. Diversity 2010, 2, 1015–1025. [Google Scholar] [CrossRef]
- Roesch, L.F.; Lorca, G.L.; Casella, G.; Giongo, A.; Naranjo, A.; Pionzio, A.M.; Li, N.; Mai, V.; Wasserfall, C.H.; Schatz, D.; et al. Culture-independent identification of gut bacteria correlated with the onset of diabetes in a rat model. ISME J. 2009, 3, 536–548. [Google Scholar] [CrossRef]
- Bokulich, N.A.; Subramanian, S.; Faith, J.J.; Gevers, D.; Gordon, J.I.; Knight, R.; Mills, D.A.; Caporaso, J.G. Quality-filtering vastly improves diversity estimates from Illumina amplicon sequencing. Nat. Methods 2013, 10, 57–59. [Google Scholar] [CrossRef]
- Weirather, J.L.; de Cesare, M.; Wang, Y.; Piazza, P.; Sebastiano, V.; Wang, X.J.; Buck, D.; Au, K.F. Comprehensive comparison of Pacific Biosciences and Oxford Nanopore Technologies and their applications to transcriptome analysis. F1000Research 2017, 6, 100. [Google Scholar] [CrossRef] [PubMed]
- Tyler, A.D.; Mataseje, L.; Urfano, C.J.; Schmidt, L.; Antonation, K.S.; Mulvey, M.R.; Corbett, C.R. Evaluation of Oxford Nanopore’s MinION Sequencing Device for Microbial Whole Genome Sequencing Applications. Sci. Rep. 2018, 8, 1–12. [Google Scholar] [CrossRef] [PubMed]
- Sinclair, L.; Osman, O.A.; Bertilsson, S.; Eiler, A. Microbial community composition and diversity via 16S rRNA gene amplicons: Evaluating the illumina platform. PLoS ONE 2015, 10, e0116955. [Google Scholar] [CrossRef] [PubMed]
- Benítez-Páez, A.; Portune, K.J.; Sanz, Y. Species-level resolution of 16S rRNA gene amplicons sequenced through the MinION™ portable nanopore sequencer. GigaScience 2016, 5, 4. [Google Scholar] [CrossRef]
- Cusco, A.; Vines, J.; D’Andreano, S.; Riva, F.; Casellas, J.; Sanchez, A.; Francino, O. Using MinION to characterize dog skin microbiota through full-length 16S rRNA gene sequencing approach. bioRxiv 2017. [Google Scholar] [CrossRef]
- Bolger, A.M.; Lohse, M.; Usadel, B. Trimmomatic: A flexible trimmer for Illumina sequence data. Bioinformatics 2014, 30, 2114–2120. [Google Scholar] [CrossRef]


| Sample Name | Amplified Region | Primer Pair | Fragment Length | Reference |
|---|---|---|---|---|
| 16S1 | V4 | 515F/806R1 | 292 | [46] |
| 16S2 | V3–V4 | 341F1/806R2 | 466 | [46] |
| 16S3 | V3–V4 | 341F2/805R | 400–500 | [47] |
| 16S4 | V4–V5 | 515F/907R | 393 | [46,48] |
| 16S5 | V4–V6 | 515F/1061R | 546 | [49] |
| 16S6 | V6 | 926F/1061R | 135 | [49,50] |
| 16S7 | V1–V3 | 8F/516R | 488 (614) | [51] |
| 16S8 | V3–V4 | 341B4F/806R2 | 400–500 | [47] |
| 16S9 | V8 | 1243F/1459R | 217 | [52] |
| 16S10 | V8–V9 | 1522F/1189R1 | 370 | [53] |
| 16S11 | V8–V9 | 1522F/1189R2 | 370 | [53] |
| Sample | Number of Raw Contigs | SILVA | NCBI | |||||||||||||||
|---|---|---|---|---|---|---|---|---|---|---|---|---|---|---|---|---|---|---|
| Classified Contigs | Family | Genus | Classified Contigs | Family | Genus | Species | ||||||||||||
| CC | MC | UC * | CC | MC | UC * | CC | MC | UC * | CC | MC | UC * | CC | MC | UC * | ||||
| 16S1 | 442,223 | 387,306 | 99.71% | 0.03% | 0.27% | 48.18% | 0.03% | 51.79% | 384,501 | 99.84% | 0.03% | 0.13% | 80.92% | 0.03% | 19.05% | 41.41% | 8.09% | 50.50% |
| 16S2 | 370,429 | 307,971 | 99.97% | 0.02% | 0.02% | 88.16% | 0.02% | 11.81% | 308,254 | 99.98% | 0.02% | 0.00% | 99.91% | 0.02% | 0.07% | 57.57% | 23.29% | 19.14% |
| 16S3 | 480,933 | 351,488 | 99.82% | 0.03% | 0.16% | 87.05% | 0.08% | 12.87% | 352,246 | 99.90% | 0.03% | 0.07% | 99.52% | 0.03% | 0.45% | 59.70% | 22.89% | 17.41% |
| 16S4 | 336,363 | 193,320 | 99.61% | 0.06% | 0.33% | 71.24% | 0.09% | 28.67% | 206,531 | 99.70% | 0.05% | 0.24% | 90.40% | 0.05% | 9.55% | 52.19% | 13.34% | 34.48% |
| 16S5 | 377,697 | 114,743 | 99.77% | 0.00% | 0.23% | 99.74% | 0.00% | 0.26% | 114,777 | 99.88% | 0.00% | 0.12% | 93.01% | 0.00% | 6.99% | 48.56% | 14.02% | 37.42% |
| 16S6 | 550,931 | 506,640 | 68.91% | 0.20% | 30.89% | 66.94% | 0.01% | 33.05% | 522,128 | 58.16% | 0.01% | 41.83% | 57.34% | 0.01% | 42.66% | 33.32% | 0.01% | 66.68% |
| 16S7 | 455,347 | 268,527 | 99.98% | 0.02% | 0.00% | 99.98% | 0.02% | 0.00% | 242,467 | 99.98% | 0.02% | 0.00% | 99.98% | 0.02% | 0.00% | 54.54% | 27.47% | 17.99% |
| 16S8 | 557,407 | 440,145 | 99.94% | 0.01% | 0.05% | 80.17% | 0.04% | 19.79% | 440,811 | 99.98% | 0.01% | 0.01% | 99.93% | 0.01% | 0.05% | 58.32% | 23.11% | 18.57% |
| 16S9 | 259 | 103 | 49.51% | 50.49% | 0.00% | 29.13% | 0.00% | 70.87% | 50 | 100.00% | 0.00% | 0.00% | 64.00% | 0.00% | 36.00% | 16.00% | 24.00% | 60.00% |
| 16S10 | 158 | 0 | - | - | - | - | - | - | 0 | - | - | - | - | - | - | - | - | - |
| 16S11 | 210 | 16 | 0.00% | 0.00% | 100.00% | 0.00% | 0.00% | 100.00% | 9 | 0.00% | 0.00% | 100.00% | 0.00% | 0.00% | 100.00% | 0.00% | 0.00% | 100.00% |
| Total | 16S1 | 16S2 | 16S3 | 16S4 | 16S5 | 16S6 | 16S7 | 16S8 | |
|---|---|---|---|---|---|---|---|---|---|
| Family | |||||||||
| Pseudomonadaceae † | 8 | 1 | 1 | 1 | 1 | 1 | 1 | 1 | 1 |
| Enterobacteriaceae | 8 | 1 | 1 | 1 | 1 | 1 | 1 | 1 | 1 |
| Lactobacillaceae | 8 | 1 | 1 | 1 | 1 | 1 | 1 | 1 | 1 |
| Enterococcaceae | 7 | 1 | 1 | 1 | 1 | 1 | 0 | 1 | 1 |
| Staphylococcaceae † | 8 | 1 | 1 | 1 | 1 | 1 | 1 | 1 | 1 |
| Listeriaceae | 8 | 1 | 1 | 1 | 1 | 1 | 1 | 1 | 1 |
| Bacillaceae | 8 | 1 | 1 | 1 | 1 | 1 | 1 | 1 | 1 |
| Neisseriaceae * | 7 | 1 | 1 | 1 | 1 | 0 | 1 | 1 | 1 |
| Carnobacteriaceae | 1 | 0 | 0 | 0 | 0 | 0 | 1 | 0 | 0 |
| Genus | |||||||||
| Pseudomonadas † | 4 | 0 | 1 | 1 | 0 | 1 | 0 | 1 | 0 |
| Escherichia-Shigella | 7 | 1 | 1 | 1 | 1 | 1 | 0 | 1 | 1 |
| Salmonella | 2 | 0 | 0 | 0 | 0 | 1 | 0 | 1 | 0 |
| Lactobacillus | 8 | 1 | 1 | 1 | 1 | 1 | 1 | 1 | 1 |
| Enterococcus | 5 | 0 | 1 | 1 | 0 | 1 | 0 | 1 | 1 |
| Staphylococcus † | 8 | 1 | 1 | 1 | 1 | 1 | 1 | 1 | 1 |
| Listeria | 8 | 1 | 1 | 1 | 1 | 1 | 1 | 1 | 1 |
| Bacillus | 7 | 0 | 1 | 1 | 1 | 1 | 1 | 1 | 1 |
| Trabulsiella | 3 | 0 | 1 | 1 | 0 | 0 | 0 | 0 | 1 |
| Melissococcus | 1 | 0 | 0 | 0 | 1 | 0 | 0 | 0 | 0 |
| Azomonas | 4 | 1 | 0 | 1 | 1 | 0 | 0 | 0 | 1 |
| Neisseria * | 7 | 1 | 1 | 1 | 1 | 0 | 1 | 1 | 1 |
| Falsibacillus | 1 | 0 | 0 | 1 | 0 | 0 | 0 | 0 | 0 |
| Total | 16S1 | 16S2 | 16S3 | 16S4 | 16S5 | 16S6 | 16S7 | 16S8 | |
|---|---|---|---|---|---|---|---|---|---|
| Family | |||||||||
| Pseudomonadaceae † | 8 | 1 | 1 | 1 | 1 | 1 | 1 | 1 | 1 |
| Enterobacteriaceae | 8 | 1 | 1 | 1 | 1 | 1 | 1 | 1 | 1 |
| Lactobacillaceae | 8 | 1 | 1 | 1 | 1 | 1 | 1 | 1 | 1 |
| Enterococcaceae | 8 | 1 | 1 | 1 | 1 | 1 | 1 | 1 | 1 |
| Staphylococcaceae † | 8 | 1 | 1 | 1 | 1 | 1 | 1 | 1 | 1 |
| Listeriaceae | 8 | 1 | 1 | 1 | 1 | 1 | 1 | 1 | 1 |
| Bacillaceae | 8 | 1 | 1 | 1 | 1 | 1 | 1 | 1 | 1 |
| Neisseriaceae * | 7 | 1 | 1 | 1 | 1 | 0 | 1 | 1 | 1 |
| Genus | |||||||||
| Pseudomonadas † | 8 | 1 | 1 | 1 | 1 | 1 | 1 | 1 | 1 |
| Escherichia-Shigella | 8 | 1 | 1 | 1 | 1 | 1 | 1 | 1 | 1 |
| Salmonella | 6 | 0 | 1 | 1 | 1 | 1 | 0 | 1 | 1 |
| Lactobacillus | 8 | 1 | 1 | 1 | 1 | 1 | 1 | 1 | 1 |
| Enterococcus | 8 | 1 | 1 | 1 | 1 | 1 | 1 | 1 | 1 |
| Staphylococcus † | 8 | 1 | 1 | 1 | 1 | 1 | 1 | 1 | 1 |
| Listeria | 8 | 1 | 1 | 1 | 1 | 1 | 1 | 1 | 1 |
| Bacillus | 8 | 1 | 1 | 1 | 1 | 1 | 1 | 1 | 1 |
| Neisseria * | 7 | 1 | 1 | 1 | 1 | 0 | 1 | 1 | 1 |
| Species | |||||||||
| Pseudomonadas aeruginosa | 7 | 1 | 1 | 1 | 1 | 1 | 0 | 1 | 1 |
| Escherichia coli | 1 | 0 | 0 | 0 | 0 | 0 | 1 | 0 | 0 |
| Salmonella enterica | 6 | 0 | 1 | 1 | 1 | 1 | 0 | 1 | 1 |
| Lactobacillus fermentum | 8 | 1 | 1 | 1 | 1 | 1 | 1 | 1 | 1 |
| Enterococcus faecalis | 4 | 0 | 1 | 1 | 0 | 0 | 0 | 1 | 1 |
| Staphylococcus aureus | 8 | 1 | 1 | 1 | 1 | 1 | 1 | 1 | 1 |
| Listeria monocytogenes | 0 | 0 | 0 | 0 | 0 | 0 | 0 | 0 | 0 |
| Bacillus subtilis | 0 | 0 | 0 | 0 | 0 | 0 | 0 | 0 | 0 |
| Neisseria polysaccharea * | 4 | 0 | 1 | 1 | 1 | 0 | 0 | 0 | 1 |
| Neisseria weaveri * | 1 | 0 | 0 | 0 | 0 | 0 | 1 | 0 | 0 |
| Enterococcus hirae | 1 | 1 | 0 | 0 | 0 | 0 | 0 | 0 | 0 |
| Enterococcus saccharolyticus | 1 | 0 | 0 | 0 | 0 | 1 | 0 | 0 | 0 |
| Listeria welshimeri | 5 | 0 | 1 | 1 | 1 | 1 | 0 | 0 | 1 |
| Escherichia fergusonii | 6 | 0 | 1 | 1 | 1 | 1 | 0 | 1 | 1 |
| Bacillus halotolerans | 1 | 0 | 0 | 0 | 0 | 0 | 0 | 1 | 0 |
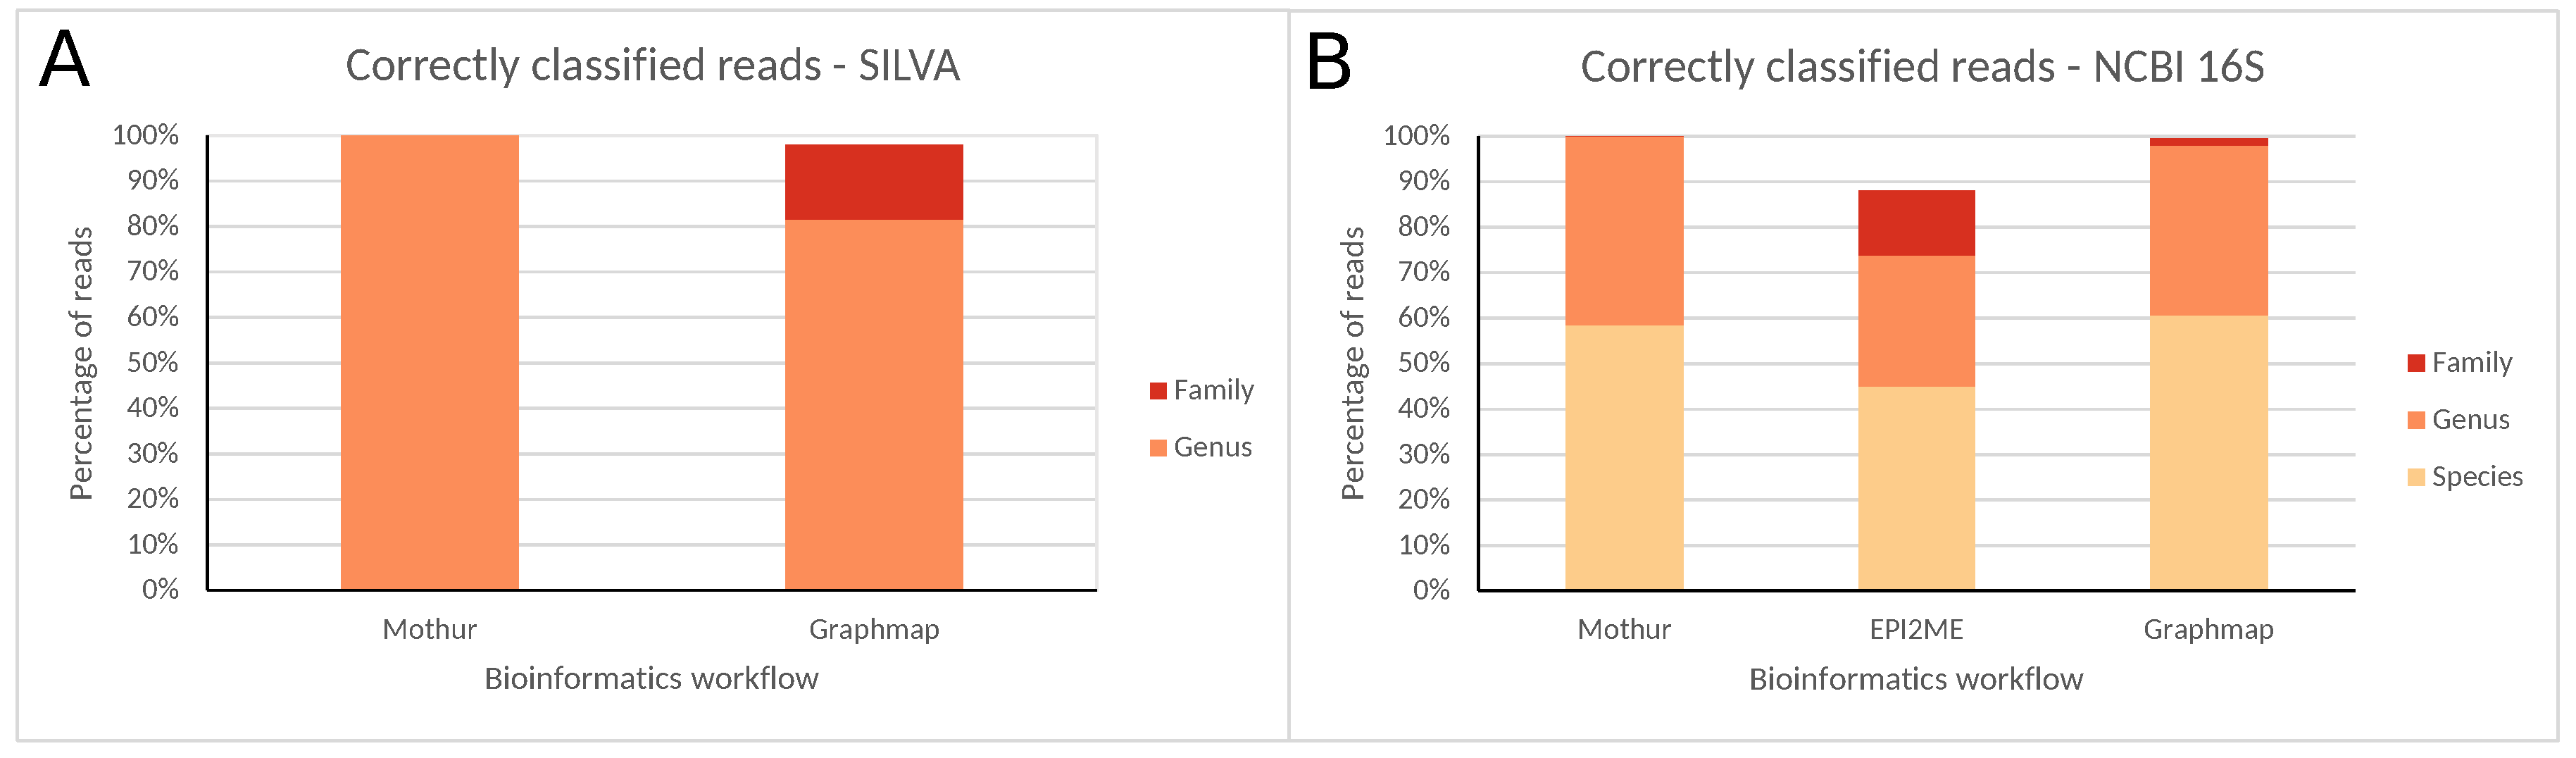
| Workflow | SILVA | NCBI 16S | |||||||||||||
|---|---|---|---|---|---|---|---|---|---|---|---|---|---|---|---|
| Family | Genus | Family | Genus | Species | |||||||||||
| CC | MC | UC * | CC | MC | UC * | CC | MC | UC * | CC | MC | UC * | CC | MC | UC * | |
| Mothur | 4799 | 0 | 0 | 4799 | 0 | 0 | 4429 | 0 | 0 | 4428 | 1 | 0 | 2593 | 1836 | 0 |
| EPI2ME | - | - | - | - | - | - | 8673 | 30 | 1135 | 7265 | 68 | 2505 | 4436 | 2897 | 2505 |
| GraphMap | 6949 | 145 | 0 | 5783 | 1311 | 0 | 7777 | 35 | 0 | 7649 | 163 | 0 | 4739 | 3073 | 0 |
© 2019 by the authors. Licensee MDPI, Basel, Switzerland. This article is an open access article distributed under the terms and conditions of the Creative Commons Attribution (CC BY) license (http://creativecommons.org/licenses/by/4.0/).
Share and Cite
Winand, R.; Bogaerts, B.; Hoffman, S.; Lefevre, L.; Delvoye, M.; Van Braekel, J.; Fu, Q.; Roosens, N.H.; De Keersmaecker, S.C.; Vanneste, K. Targeting the 16S rRNA Gene for Bacterial Identification in Complex Mixed Samples: Comparative Evaluation of Second (Illumina) and Third (Oxford Nanopore Technologies) Generation Sequencing Technologies. Int. J. Mol. Sci. 2020, 21, 298. https://doi.org/10.3390/ijms21010298
Winand R, Bogaerts B, Hoffman S, Lefevre L, Delvoye M, Van Braekel J, Fu Q, Roosens NH, De Keersmaecker SC, Vanneste K. Targeting the 16S rRNA Gene for Bacterial Identification in Complex Mixed Samples: Comparative Evaluation of Second (Illumina) and Third (Oxford Nanopore Technologies) Generation Sequencing Technologies. International Journal of Molecular Sciences. 2020; 21(1):298. https://doi.org/10.3390/ijms21010298
Chicago/Turabian StyleWinand, Raf, Bert Bogaerts, Stefan Hoffman, Loïc Lefevre, Maud Delvoye, Julien Van Braekel, Qiang Fu, Nancy HC Roosens, Sigrid CJ De Keersmaecker, and Kevin Vanneste. 2020. "Targeting the 16S rRNA Gene for Bacterial Identification in Complex Mixed Samples: Comparative Evaluation of Second (Illumina) and Third (Oxford Nanopore Technologies) Generation Sequencing Technologies" International Journal of Molecular Sciences 21, no. 1: 298. https://doi.org/10.3390/ijms21010298
APA StyleWinand, R., Bogaerts, B., Hoffman, S., Lefevre, L., Delvoye, M., Van Braekel, J., Fu, Q., Roosens, N. H., De Keersmaecker, S. C., & Vanneste, K. (2020). Targeting the 16S rRNA Gene for Bacterial Identification in Complex Mixed Samples: Comparative Evaluation of Second (Illumina) and Third (Oxford Nanopore Technologies) Generation Sequencing Technologies. International Journal of Molecular Sciences, 21(1), 298. https://doi.org/10.3390/ijms21010298