Bioinformatic Reconstruction and Analysis of Gene Networks Related to Glucose Variability in Diabetes and Its Complications


Abstract
1. Introduction
2. Results and Discussion
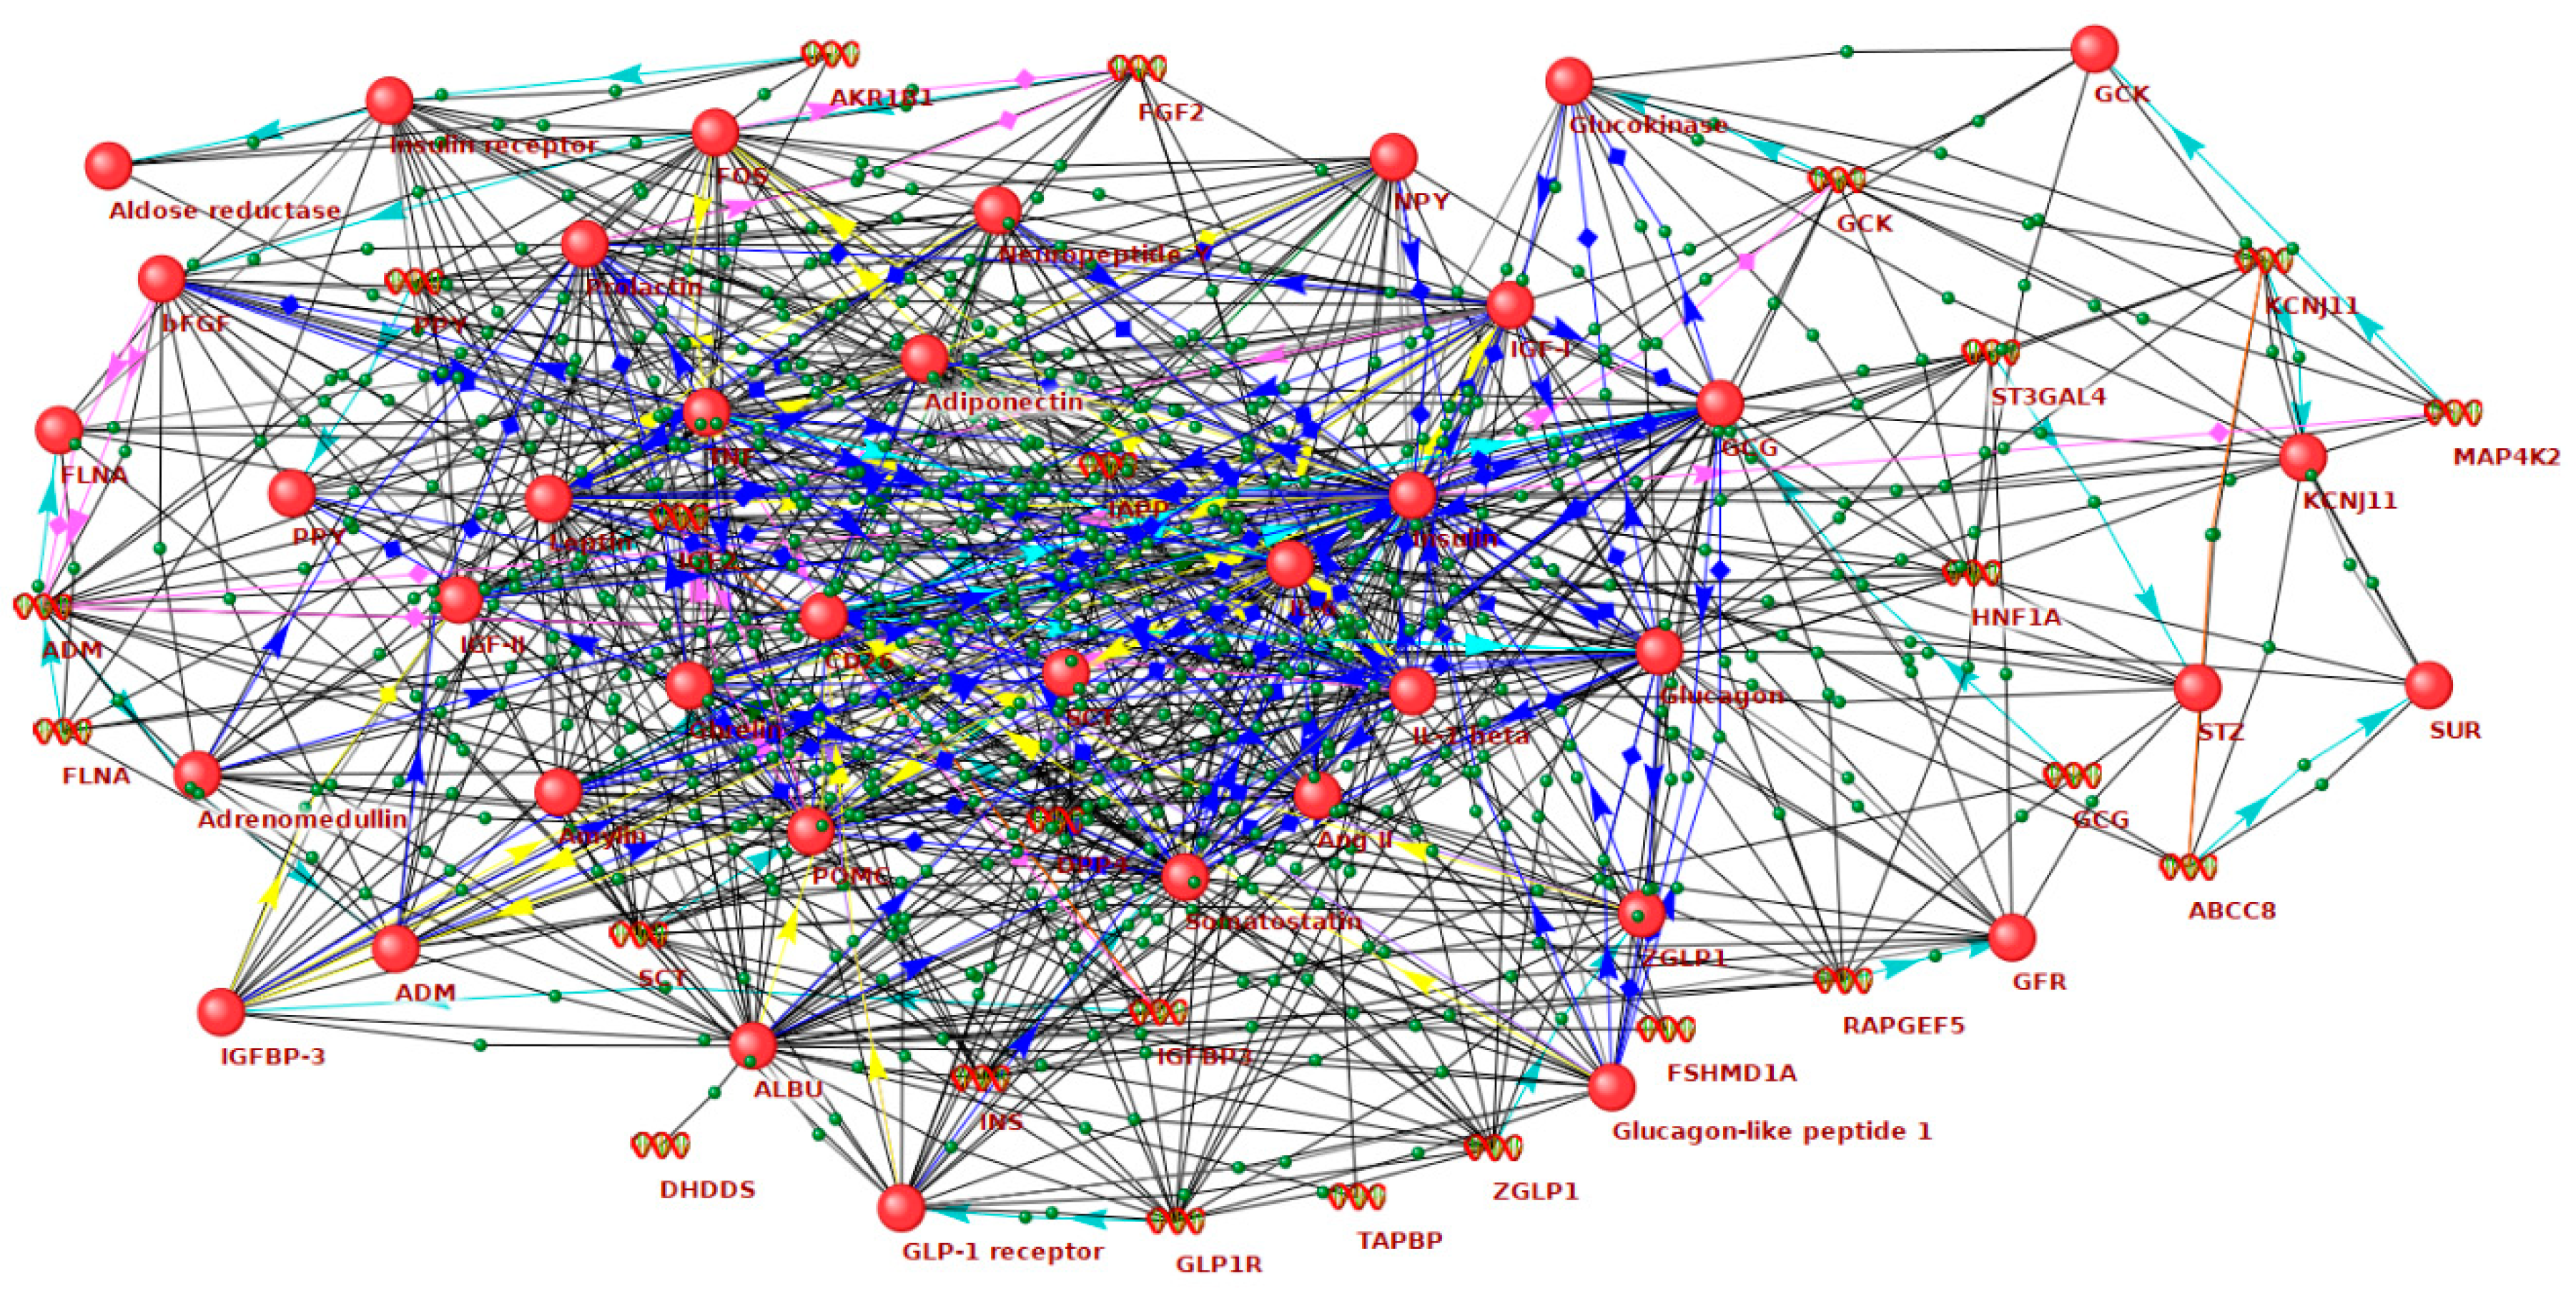
2.1. Reconstruction and Analysis of the Networks Associated with Hyperglycemia and Hypoglycemia
2.2. The Role of GV-Related Genes in the Networks of Diabetes Complications
2.3. Identification of New Candidate Genes in the GV Network
2.4. Study Limitations and Future Remarks
3. Materials and Methods
4. Conclusions
Supplementary Materials
Author Contributions
Funding
Acknowledgments
Conflicts of Interest
Abbreviations
| FDR | False discovery rate |
| EGF | Epidermal growth factor |
| ERK | Extracellular signal-regulated kinase |
| GO | Gene ontology |
| GSK3B | Glycogen synthase kinase 3 beta |
| GV | Glucose variability |
| HIF | Hypoxia-inducible factor |
| Hsp90α | Heat shock protein 90α |
| ID | Identification number |
| MAPK | Mitogen-activated protein kinase |
| PTEN | Phosphatase and tensin homolog |
| miRNAs | microRNAs |
| STAT3 | Signal transducer and activator of transcription 3 |
| THSP1 | Thrombospondin 1 |
References
- Wilmot, E.G.; Choudhary, P.; Leelarathna, L.; Baxter, M. Glycaemic variability: The under-recognized therapeutic target in type 1 diabetes care. Diabetes Obes. Metab. 2019, 21, 2599–2608. [Google Scholar] [CrossRef] [PubMed]
- Ceriello, A.; Monnier, L.; Owens, D. Glycaemic variability in diabetes: Clinical and therapeutic implications. Lancet Diabetes Endocrinol. 2019, 7, 221–230. [Google Scholar] [CrossRef]
- Longato, E.; Acciaroli, G.; Facchinetti, A.; Maran, A.; Sparacino, G. Simple Linear Support Vector Machine Classifier Can Distinguish Impaired Glucose Tolerance Versus Type 2 Diabetes Using a Reduced Set of CGM-Based Glycemic Variability Indices. J. Diabetes Sci. Technol. 2020, 14, 297–302. [Google Scholar] [CrossRef] [PubMed]
- Wadén, J.; Forsblom, C.; Thorn, L.M.; Gordin, D.; Saraheimo, M.; Groop, P.H. Finnish Diabetic Nephropathy Study Group. A1C variability predicts incident cardiovascular events, microalbuminuria, and overt diabetic nephropathy in patients with type 1 diabetes. Diabetes 2009, 58, 2649–2655. [Google Scholar] [CrossRef] [PubMed]
- Hirakawa, Y.; Arima, H.; Zoungas, S.; Ninomiya, T.; Cooper, M.; Hamet, P.; Mancia, G.; Poulter, N.; Harrap, S.; Woodward, M.; et al. Impact of visit-to-visit glycemic variability on the risks of macrovascular and microvascular events and all-cause mortality in type 2 diabetes: The ADVANCE trial. Diabetes Care 2014, 37, 2359–2365. [Google Scholar] [CrossRef] [PubMed]
- Wang, C.; Song, J.; Ma, Z.; Yang, W.; Li, C.; Zhang, X.; Hou, X.; Sun, Y.; Lin, P.; Liang, K.; et al. Fluctuation between fasting and 2-H postload glucose state is associated with chronic kidney disease in previously diagnosed type 2 diabetes patients with HbA1c ≥7%. PLoS ONE 2014, 9, e102941. [Google Scholar] [CrossRef] [PubMed]
- Hsieh, Y.T.; Hsieh, M.C. Fasting plasma glucose variability is an independent risk factor for diabetic retinopathy and diabetic macular oedema in type 2 diabetes: An 8-year prospective cohort study. Clin. Exp. Ophthalmol. 2020, 48, 470–476. [Google Scholar] [CrossRef]
- Li, S.; Tang, X.; Luo, Y.; Wu, B.; Huang, Z.; Li, Z.; Peng, L.; Ling, Y.; Zhu, J.; Zhong, J.; et al. Impact of long-term glucose variability on coronary atherosclerosis progression in patients with type 2 diabetes: A 2.3 year follow-up study. Cardiovasc. Diabetol. 2020, 19, 146. [Google Scholar] [CrossRef]
- Yang, C.D.; Shen, Y.; Ding, F.H.; Yang, Z.K.; Hu, J.; Shen, W.F.; Zhang, R.Y.; Lu, L.; Wang, X.Q. Visit-to-visit fasting plasma glucose variability is associated with left ventricular adverse remodeling in diabetic patients with STEMI. Cardiovasc. Diabetol. 2020, 19, 131. [Google Scholar] [CrossRef]
- Cardoso, C.R.L.; Leite, N.C.; Moram, C.B.M.; Salles, G.F. Long-term visit-to-visit glycemic variability as predictor of micro- and macrovascular complications in patients with type 2 diabetes: The Rio de Janeiro Type 2 Diabetes Cohort Study. Cardiovasc. Diabetol. 2018, 17, 33. [Google Scholar] [CrossRef]
- Muggeo, M.; Zoppini, G.; Bonora, E.; Brun, E.; Bonadonna, R.C.; Moghetti, P.; Verlato, G. Fasting plasma glucose variability predicts 10-year survival of type 2 diabetic patients: The Verona Diabetes Study. Diabetes Care 2000, 23, 45–50. [Google Scholar] [CrossRef] [PubMed]
- Zinman, B.; Marso, S.P.; Poulter, N.R.; Emerson, S.S.; Pieber, T.R.; Pratley, R.E.; Lange, M.; Brown-Frandsen, K.; Moses, A.; Ocampo Francisco, A.M.; et al. DEVOTE Study Group. Day-to-day fasting glycaemic variability in DEVOTE: Associations with severe hypoglycaemia and cardiovascular outcomes (DEVOTE 2). Diabetologia 2018, 61, 48–57. [Google Scholar] [CrossRef] [PubMed]
- Klimontov, V.V.; Myakina, N.E. Glucose variability indices predict the episodes of nocturnal hypoglycemia in elderly type 2 diabetic patients treated with insulin. Diabetes Metab. Syndr. 2017, 11, 119–124. [Google Scholar] [CrossRef] [PubMed]
- Gómez, A.M.; Henao, D.C.; Imitola Madero, A.; Taboada, L.B.; Cruz, V.; Robledo Gómez, M.A.; Rondón, M.; Muñoz-Velandia, O.; García-Jaramillo, M.; León Vargas, F.M. Defining High Glycemic Variability in Type 1 Diabetes: Comparison of Multiple Indexes to Identify Patients at Risk of Hypoglycemia. Diabetes Technol. Ther. 2019, 21, 430–439. [Google Scholar] [CrossRef]
- Ceriello, A.; Esposito, K.; Piconi, L.; Ihnat, M.A.; Thorpe, J.E.; Testa, R.; Boemi, M.; Giugliano, D. Oscillating glucose is more deleterious to endothelial function and oxidative stress than mean glucose in normal and type 2 diabetic patients. Diabetes 2008, 57, 1349–1354. [Google Scholar] [CrossRef]
- Liu, T.S.; Pei, Y.H.; Peng, Y.P.; Chen, J.; Jiang, S.S.; Gong, J.B. Oscillating high glucose enhances oxidative stress and apoptosis in human coronary artery endothelial cells. J. Endocrinol. Investig. 2014, 37, 645–651. [Google Scholar] [CrossRef]
- Momozono, A.; Kodera, Y.; Sasaki, S.; Nakagawa, Y.; Konno, R.; Shichiri, M. Oxidised Met147 of human serum albumin is a biomarker of oxidative stress, reflecting glycaemic fluctuations and hypoglycaemia in diabetes. Sci. Rep. 2020, 10, 268. [Google Scholar] [CrossRef]
- Ceriello, A.; Novials, A.; Ortega, E.; Canivell, S.; La Sala, L.; Pujadas, G.; Esposito, K.; Giugliano, D.; Genovese, S. Glucagon-like peptide 1 reduces endothelial dysfunction, inflammation, and oxidative stress induced by both hyperglycemia and hypoglycemia in type 1 diabetes. Diabetes Care 2013, 36, 2346–2350. [Google Scholar] [CrossRef]
- Klimontov, V.V.; Tyan, N.V.; Fazullina, O.N.; Myakina, N.E.; Orlov, N.B.; Konenkov, V.I. Acute-phase serum proteins and adipocytokines in women with type 2 diabetes mellitus: Relationships with body composition and blood glucose fluctuations. Ter. Arkh. 2016, 88, 35–41. [Google Scholar] [CrossRef]
- Jin, G.; Wang, Q.; Pei, X.; Li, X.; Hu, X.; Xu, E.; Li, M. mRNAs expression profiles of high glucose-induced memory in human umbilical vein endothelial cells. Diabetes Metab. Syndr. Obes. 2019, 12, 1249–1261. [Google Scholar] [CrossRef]
- Brunskill, E.W.; Potter, S.S. Changes in the gene expression programs of renal mesangial cells during diabetic nephropathy. BMC Nephrol. 2012, 13, 70. [Google Scholar] [CrossRef] [PubMed]
- Hall, E.; Nitert, M.D.; Volkov, P.; Malmgren, S.; Mulder, H.; Bacos, K.; Ling, C. The effects of high glucose exposure on global gene expression and DNA methylation in human pancreatic islets. Mol. Cell. Endocrinol. 2018, 472, 57–67. [Google Scholar] [CrossRef] [PubMed]
- El-Osta, A.; Brasacchio, D.; Yao, D.; Pocai, A.; Jones, P.L.; Roeder, R.G.; Cooper, M.E.; Brownlee, M. Transient high glucose causes persistent epigenetic changes and altered gene expression during subsequent normoglycemia. J. Exp. Med. 2008, 205, 2409–2417. [Google Scholar] [CrossRef] [PubMed]
- Yunlei, D.; Qiuling, F.; Xu, W.; Qianwen, Z.; Xu, C.; Li, X.; Lining, W. Transient High-Glucose Stimulation Induces Persistent Inflammatory Factor Secretion from Rat Glomerular Mesangial Cells via an Epigenetic Mechanism. Cell. Physiol. Biochem. 2018, 49, 1747–1754. [Google Scholar] [CrossRef]
- Heng, B.C.; Aubel, D.; Fussenegger, M. Prosthetic gene networks as an alternative to standard pharmacotherapies for metabolic disorders. Curr. Opin. Biotechnol. 2015, 35, 37–45. [Google Scholar] [CrossRef]
- Conte, F.; Fiscon, G.; Licursi, V.; Bizzarri, D.; D’Antò, T.; Farina, L.; Paci, P. A paradigm shift in medicine: A comprehensive review of network-based approaches. Biochim. Biophys. Acta Gene Regul. Mech. 2020, 1863, 194416. [Google Scholar] [CrossRef]
- Fernández-Tajes, J.; Gaulton, K.J.; van de Bunt, M.; Torres, J.; Thurner, M.; Mahajan, A.; Gloyn, A.L.; Lage, K.; McCarthy, M.I. Developing a network view of type 2 diabetes risk pathways through integration of genetic, genomic and functional data. Genome Med. 2019, 11, 19. [Google Scholar] [CrossRef]
- Geng, X.D.; Wang, W.W.; Feng, Z.; Liu, R.; Cheng, X.L.; Shen, W.J.; Dong, Z.Y.; Cai, G.Y.; Chen, X.M.; Hong, Q.; et al. Identification of key genes and pathways in diabetic nephropathy by bioinformatics analysis. J. Diabetes Investig. 2019, 10, 972–984. [Google Scholar] [CrossRef]
- Lu, Y.; Li, Y.; Li, G.; Lu, H. Identification of potential markers for type 2 diabetes mellitus via bioinformatics analysis. Mol. Med. Rep. 2020, 22, 1868–1882. [Google Scholar] [CrossRef]
- Sun, H.; Cheng, Y.; Yan, Z.; Liu, X.; Zhang, J. Mining the proliferative diabetic retinopathy-associated genes and pathways by integrated bioinformatic analysis. Int. Ophthalmol. 2020, 40, 269–279. [Google Scholar] [CrossRef]
- Dias, R.; Torkamani, A. Artificial intelligence in clinical and genomic diagnostics. Genome Med. 2019, 11, 70. [Google Scholar] [CrossRef] [PubMed]
- Rebholz-Schuhmann, D.; Oellrich, A.; Hoehndorf, R. Text-mining solutions for biomedical research: Enabling integrative biology. Nat. Rev. Genet. 2012, 13, 829–839. [Google Scholar] [CrossRef] [PubMed]
- Ivanisenko, V.A.; Saik, O.V.; Ivanisenko, N.V.; Tiys, E.S.; Ivanisenko, T.V.; Demenkov, P.S.; Kolchanov, N.A. ANDSystem: An Associative Network Discovery System for automated literature mining in the field of biology. BMC Syst. Biol. 2015, 9, S2. [Google Scholar] [CrossRef] [PubMed]
- Ivanisenko, V.A.; Demenkov, P.S.; Ivanisenko, T.V.; Mishchenko, E.L.; Saik, O.V. A new version of the ANDSystem tool for automatic extraction of knowledge from scientific publications with expanded functionality for reconstruction of associative gene networks by considering tissue-specific gene expression. BMC Bioinform. 2019, 20, 34. [Google Scholar] [CrossRef]
- Kim, T.W.; Jeong, J.H.; Hong, S.C. The impact of sleep and circadian disturbance on hormones and metabolism. Int. J. Endocrinol. 2015, 2015, 591729. [Google Scholar] [CrossRef]
- Howes, O.D.; Smith, S.; Gaughran, F.P.; Amiel, S.A.; Murray, R.M.; Pilowsky, L.S. The relationship between prolactin levels and glucose homeostasis in antipsychotic treated schizophrenic patients. J. Clin. Psychopharmacol. 2006, 26, 629–631. [Google Scholar] [CrossRef]
- Wang, T.; Lu, J.; Xu, Y.; Li, M.; Sun, J.; Zhang, J.; Xu, B.; Xu, M.; Chen, Y.; Bi, Y.; et al. Circulating prolactin associates with diabetes and impaired glucose regulation: A population-based study. Diabetes Care 2013, 36, 1974–1980. [Google Scholar] [CrossRef]
- Lissoni, P.; Rovelli, F.; Brivio, F.; Brivio, O.; Fumagalli, L. Circadian secretions of IL-2, IL-12, IL-6 and IL-10 in relation to the light/dark rhythm of the pineal hormone melatonin in healthy humans. Nat. Immun. 1998, 16, 1–5. [Google Scholar] [CrossRef]
- Carey, A.L.; Febbraio, M.A. Interleukin-6 and insulin sensitivity: Friend or foe? Diabetologia 2004, 47, 1135–1142. [Google Scholar] [CrossRef]
- Piconi, L.; Quagliaro, L.; Assaloni, R.; Da Ros, R.; Maier, A.; Zuodar, G.; Ceriello, A. Constant and intermittent high glucose enhances endothelial cell apoptosis through mitochondrial superoxide overproduction. Diabetes Metab. Res. Rev. 2006, 22, 198–203. [Google Scholar] [CrossRef]
- Buscemi, S.; Verga, S.; Cottone, S.; Azzolina, V.; Buscemi, B.; Gioia, D.; Cerasola, G. Glycaemic variability and inflammation in subjects with metabolic syndrome. Acta Diabetol. 2009, 46, 55–61. [Google Scholar] [CrossRef] [PubMed]
- Ceriello, A.; Novials, A.; Ortega, E.; Canivell, S.; La Sala, L.; Pujadas, G.; Bucciarelli, L.; Rondinelli, M.; Genovese, S. Vitamin C further improves the protective effect of glucagon-like peptide-1 on acute hypoglycemia-induced oxidative stress, inflammation, and endothelial dysfunction in type 1 diabetes. Diabetes Care 2013, 36, 4104–4108. [Google Scholar] [CrossRef] [PubMed]
- Aarthy, R.; Aston-Mourney, K.; Mikocka-Walus, A.; Radha, V.; Amutha, A.; Anjana, R.M.; Unnikrishnan, R.; Mohan, V. Clinical features, complications and treatment of rarer forms of maturity-onset diabetes of the young (MODY)—A review. J. Diabetes Complicat. 2020, 107640. [Google Scholar] [CrossRef] [PubMed]
- Christensen, A.S.; Hædersdal, S.; Støy, J.; Storgaard, H.; Kampmann, U.; Forman, J.L.; Seghieri, M.; Holst, J.J.; Hansen, T.; Knop, F.K.; et al. Efficacy and Safety of Glimepiride With or Without Linagliptin Treatment in Patients With HNF1A Diabetes (Maturity-Onset Diabetes of the Young Type 3): A Randomized, Double-Blinded, Placebo-Controlled, Crossover Trial (GLIMLINA). Diabetes Care 2020, 43, 2025–2033. [Google Scholar] [CrossRef]
- Ovsyannikova, A.K.; Rymar, O.D.; Shakhtshneider, E.V.; Klimontov, V.V.; Koroleva, E.A.; Myakina, N.E.; Voevoda, M.I. ABCC8-Related Maturity-Onset Diabetes of the Young (MODY12): Clinical Features and Treatment Perspective. Diabetes Ther. 2016, 7, 591–600. [Google Scholar] [CrossRef]
- Takeuchi, T.; Ishigaki, Y.; Hirota, Y.; Hasegawa, Y.; Yorifuji, T.; Kadowaki, H.; Akamizu, T.; Ogawa, W.; Katagiri, H. Clinical characteristics of insulin resistance syndromes: A nationwide survey in Japan. J. Diabetes Investig. 2020, 11, 603–616. [Google Scholar] [CrossRef]
- Sethi, A.; Foulds, N.; Ehtisham, S.; Ahmed, S.H.; Houghton, J.; Colclough, K.; Didi, M.; Flanagan, S.E.; Senniappan, S. Heterozygous Insulin Receptor (INSR) Mutation associated with Neonatal Hyperinsulinemic Hypoglycaemia and Familial Diabetes Mellitus: Case Series. J. Clin. Res. Pediatr. Endocrinol. 2020. [Google Scholar] [CrossRef]
- Billings, L.K.; Florez, J.C. The genetics of type 2 diabetes: What have we learned from GWAS? Ann. N. Y. Acad. Sci. 2010, 1212, 59–77. [Google Scholar] [CrossRef]
- Bastian, F.B.; Roux, J.; Niknejad, A.; Comte, A.; Costa, S.S.F.; De Farias, T.M.; Moretti, S.; Parmentier, G.; De Laval, V.R.; Rosikiewicz, M.; et al. The Bgee suite: Integrated curated expression atlas and comparative transcriptomics in animals. BioRxiv 2020. [Google Scholar] [CrossRef]
- Sherman, B.T.; Lempicki, R.A. Systematic and integrative analysis of large gene lists using DAVID bioinformatics resources. Nat. Protoc. 2009, 4, 44. [Google Scholar] [CrossRef]
- Salmon, A.B. Oxidative stress in the etiology of age-associated decline in glucose metabolism. Longev. Healthspan 2012, 1, 7. [Google Scholar] [CrossRef] [PubMed]
- Ceriello, A. Oxidative stress and glycemic regulation. Metabolism 2000, 49, 27–29. [Google Scholar] [CrossRef]
- Younus, H.; Anwar, S. Prevention of non-enzymatic glycosylation (glycation): Implication in the treatment of diabetic complication. Int. J. Health Sci. 2016, 10, 261. [Google Scholar] [CrossRef]
- Singh, V.P.; Bali, A.; Singh, N.; Jaggi, A.S. Advanced glycation end products and diabetic complications. Korean, J. Physiol. Pharmacol. 2014, 18, 1–14. [Google Scholar] [CrossRef] [PubMed]
- Corre, I.; Paris, F.; Huot, J. The p38 pathway, a major pleiotropic cascade that transduces stress and metastatic signals in endothelial cells. Oncotarget 2017, 8, 55684. [Google Scholar] [CrossRef] [PubMed]
- Meza, C.A.; La Favor, J.D.; Kim, D.H.; Hickner, R.C. Endothelial Dysfunction: Is There a Hyperglycemia-Induced Imbalance of NOX and NOS? Int. J. Mol. Sci. 2019, 20, 3775. [Google Scholar] [CrossRef]
- Pirri, D.; Fragiadaki, M.; Evans, P.C. Diabetic atherosclerosis: Is there a role for the hypoxia-inducible factors? BioSci. Rep. 2020, 40. [Google Scholar] [CrossRef]
- Packer, M. Mechanisms Leading to Differential Hypoxia-Inducible Factor Signaling in the Diabetic Kidney: Modulation by SGLT2 Inhibitors and Hypoxia Mimetics. Am. J. Kidney Dis. 2020. [Google Scholar] [CrossRef]
- Li, H.Y.; Yuan, Y.; Fu, Y.H.; Wang, Y.; Gao, X.Y. Hypoxia-inducible factor-1α: A promising therapeutic target for vasculopathy in diabetic retinopathy. Pharmacol. Res. 2020, 159, 104924. [Google Scholar] [CrossRef]
- Ichiki, T.; Sunagawa, K. Novel roles of hypoxia response system in glucose metabolism and obesity. Trends Cardiovasc. Med. 2014, 24, 197–201. [Google Scholar] [CrossRef]
- Duennwald, T.; Gatterer, H.; Groop, P.H.; Burtscher, M.; Bernardi, L. Effects of a single bout of interval hypoxia on cardiorespiratory control and blood glucose in patients with type 2 diabetes. Diabetes Care 2013, 36, 2183–2189. [Google Scholar] [CrossRef] [PubMed]
- Kaur, R.; Kaur, M.; Singh, J. Endothelial dysfunction and platelet hyperactivity in type 2 diabetes mellitus: Molecular insights and therapeutic strategies. Cardiovasc. Diabetol. 2018, 17, 121. [Google Scholar] [CrossRef] [PubMed]
- Pouysségur, J.; Lenormand, P. ERK1 and ERK2 map kinases: Specific roles or functional redundancy? Front. Cell Dev. Biol. 2016, 4, 53. [Google Scholar] [CrossRef]
- Briaud, I.; Lingohr, M.K.; Dickson, L.M.; Wrede, C.E.; Rhodes, C.J. Differential activation mechanisms of Erk-1/2 and p70(S6K) by glucose in pancreatic beta-cells. Diabetes 2003, 52, 974–983. [Google Scholar] [CrossRef] [PubMed]
- Ozaki, K.I.; Awazu, M.; Tamiya, M.; Iwasaki, Y.; Harada, A.; Kugisaki, S.; Tanimura, S.; Kohno, M. Targeting the ERK signaling pathway as a potential treatment for insulin resistance and type 2 diabetes. Am. J. Physiol. Endocrinol. Metab. 2016, 310, E643–E651. [Google Scholar] [CrossRef]
- Xu, Z.; Sun, J.; Tong, Q.; Lin, Q.; Qian, L.; Park, Y.; Zheng, Y. The Role of ERK1/2 in the Development of Diabetic Cardiomyopathy. Int. J. Mol. Sci. 2016, 17, 2001. [Google Scholar] [CrossRef]
- Li, X.; Wang, L.; Ma, H. Betaine alleviates high glucose induced mesangial cell proliferation by inhibiting cell proliferation and extracellular matrix deposition via the AKT/ERK1/2/p38 MAPK pathway. Mol. Med. Rep. 2019, 20, 1754–1760. [Google Scholar] [CrossRef]
- Chen, J.; Aronow, B.J.; Jegga, A.G. Disease candidate gene identification and prioritization using protein interaction networks. BMC Bioinform. 2009, 10, 73. [Google Scholar] [CrossRef]
- Zhao, C.; Isenberg, J.S.; Popel, A.S. Human expression patterns: Qualitative and quantitative analysis of thrombospondin-1 under physiological and pathological conditions. J. Cell Mol. Med. 2018, 22, 2086–2097. [Google Scholar] [CrossRef]
- Choi, K.Y.; Kim, D.B.; Kim, M.J.; Kwon, B.J.; Chang, S.Y.; Jang, S.W.; Cho, E.J.; Rho, T.H.; Kim, J.H. Higher plasma thrombospondin-1 levels in patients with coronary artery disease and diabetes mellitus. Korean Circ. J. 2012, 42, 100–106. [Google Scholar] [CrossRef]
- James, L.R.; Le, C.; Doherty, H.; Kim, H.S.; Maeda, N. Connective tissue growth factor (CTGF) expression modulates response to high glucose. PLoS ONE. 2013, 8, e70441. [Google Scholar] [CrossRef] [PubMed]
- Zhang, K.; Li, M.; Yin, L.; Fu, G.; Liu, Z. Role of thrombospondin 1 and thrombospondin 2 in cardiovascular diseases (Review). Int. J. Mol. Med. 2020, 45, 1275–1293. [Google Scholar] [CrossRef] [PubMed]
- Xu, L.; Zhang, Y.; Chen, J.; Xu, Y. Thrombospondin-1: A Key Protein That Induces Fibrosis in Diabetic Complications. J. Diabetes Res. 2020, 2020, 8043135. [Google Scholar] [CrossRef] [PubMed]
- Osz, K.; Ross, M.; Petrik, J. The thrombospondin-1 receptor CD36 is an important mediator of ovarian angiogenesis and folliculogenesis. Reprod. Biol. Endocrinol. 2014, 12, 21. [Google Scholar] [CrossRef]
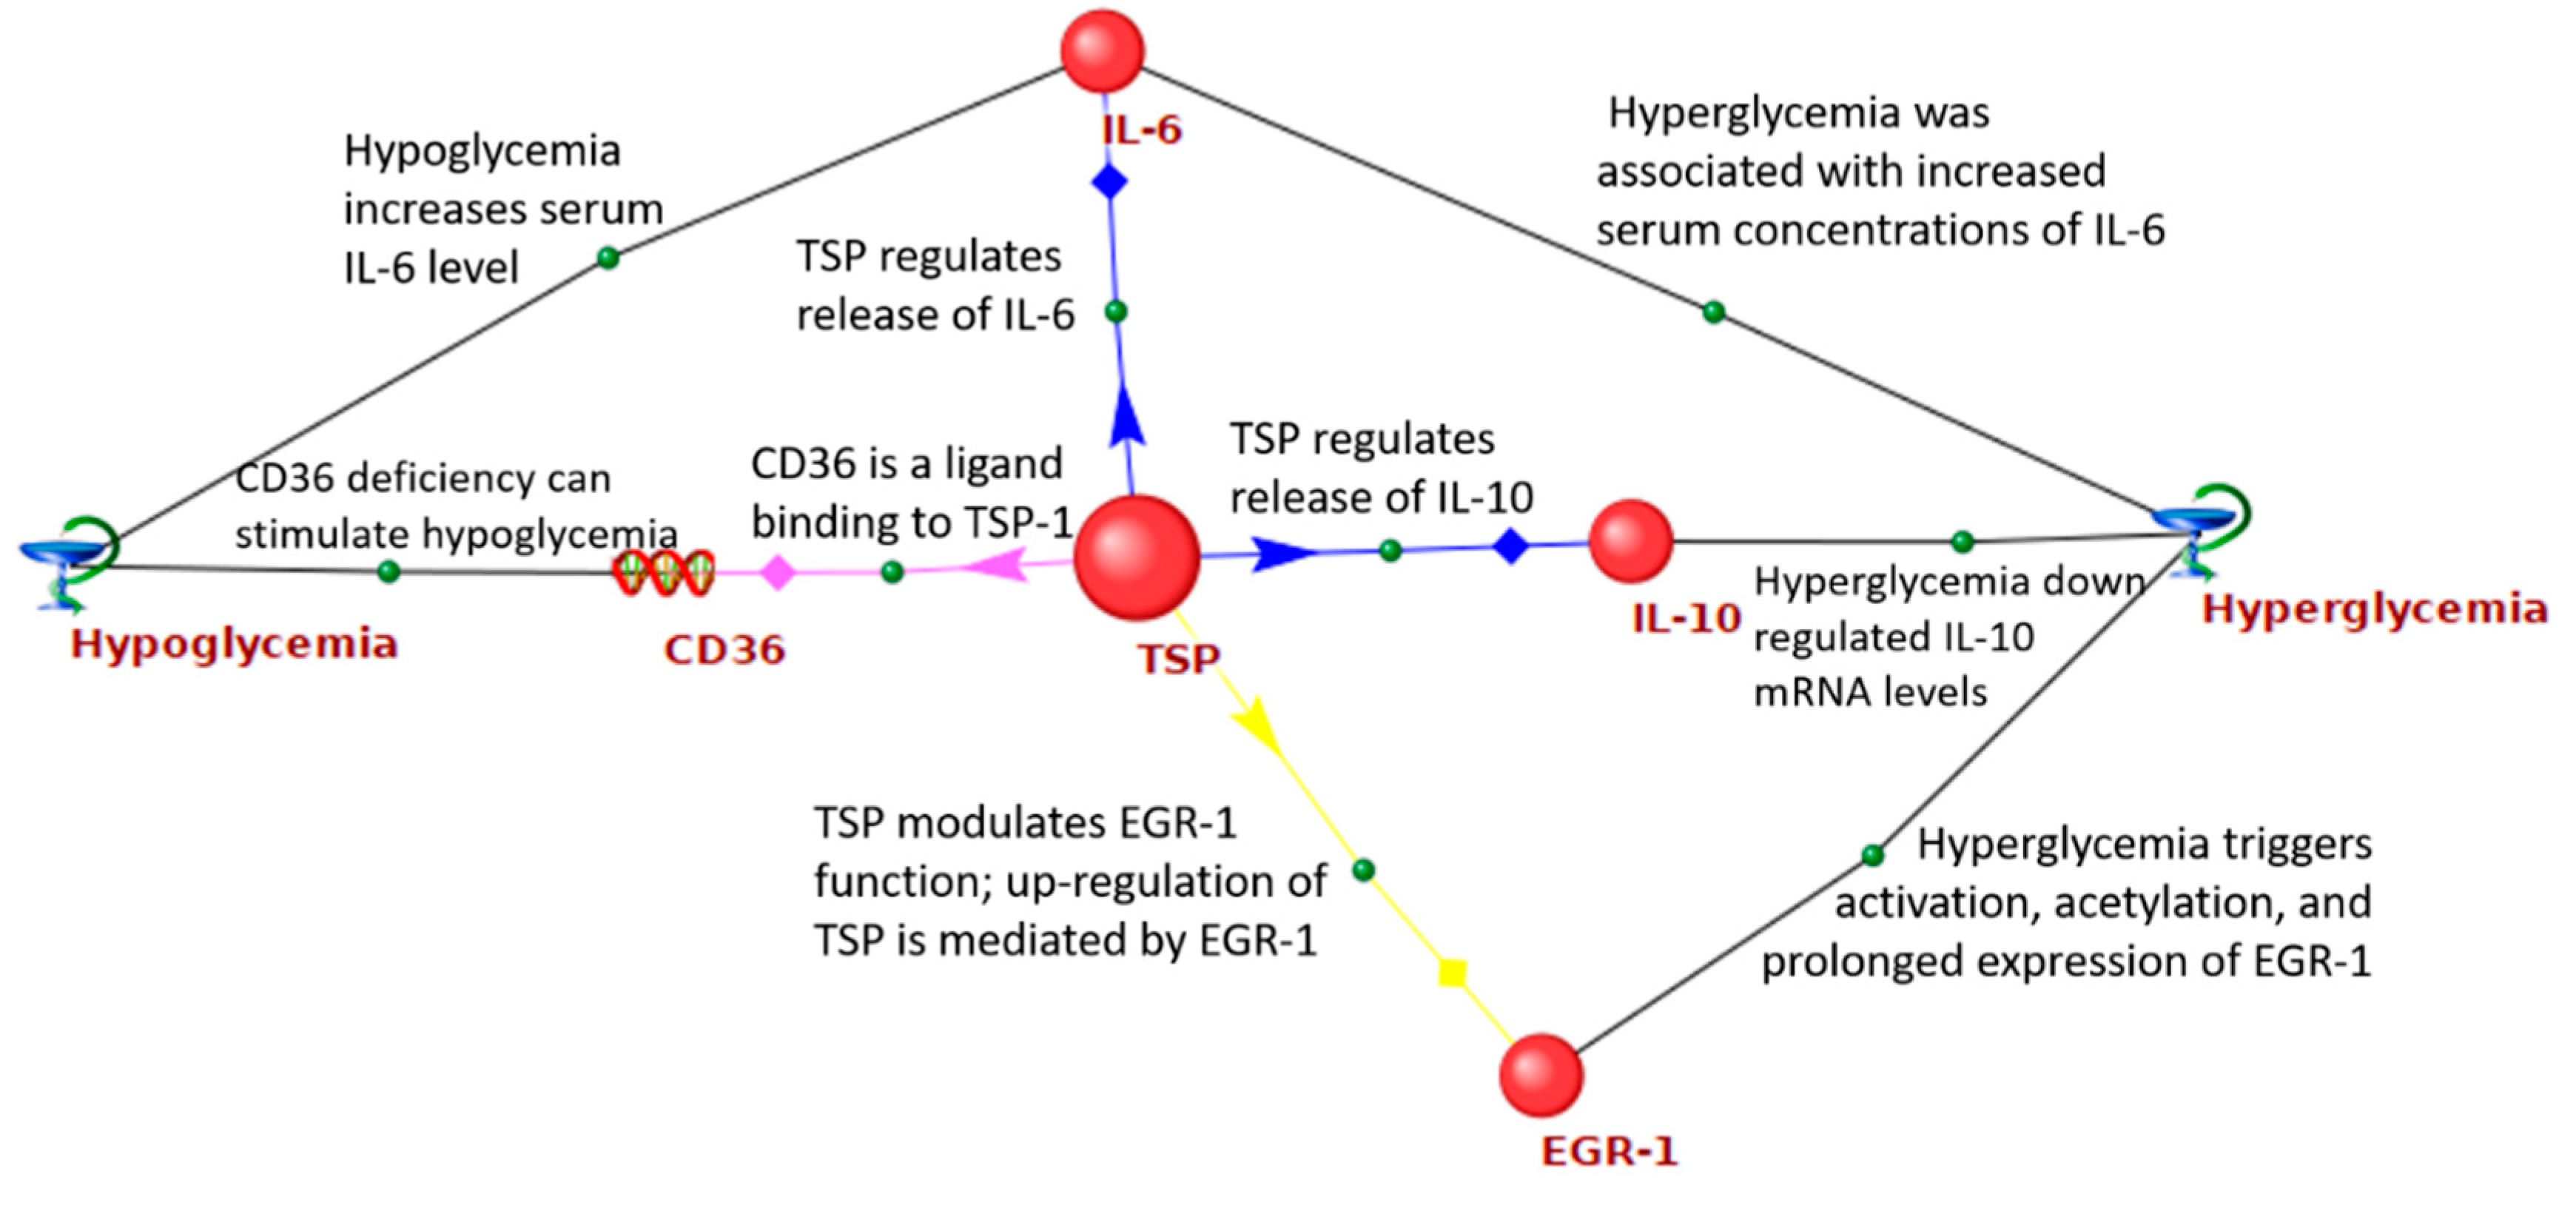
- Yamauchi, Y.; Kuroki, M.; Imakiire, T.; Abe, H.; Uchida, H.; Beppu, R.; Yamashita, Y.; Kuroki, M.; Shirakusa, T. Thrombospondin-1 differentially regulates release of IL-6 and IL-10 by human monocytic cell line U937. Biochem. Biophys. Res. Commun. 2002, 290, 1551–1557. [Google Scholar] [CrossRef] [PubMed]
- Wasmuth, H.E.; Kunz, D.; Graf, J.; Stanzel, S.; Purucker, E.A.; Koch, A.; Gartung, C.; Heintz, B.; Gressner, A.M.; Matern, S.; et al. Hyperglycemia at admission to the intensive care unit is associated with elevated serum concentrations of interleukin-6 and reduced ex vivo secretion of tumor necrosis factor-α. Crit. Care Med. 2004, 32, 1109–1114. [Google Scholar] [CrossRef] [PubMed]
- Dotson, S.; Freeman, R.; Failing, H.J.; Adler, G.K. Hypoglycemia increases serum interleukin-6 levels in healthy men and women. Diabetes Care 2008, 31, 1222–1223. [Google Scholar] [CrossRef]
- Jayaguru, P.; Joaquin, M.; Mohr, S. Interleukin-10, a Potent Counter Regulator of the Hyperglycemia-Induced Pro-Inflammatory Interleukin-1 Signaling in Müller Cells. Investig. Ophthal. Vis. Sci. 2013, 54, 3691. [Google Scholar]
- Amodeo, V.; Bazan, V.; Fanale, D.; Insalaco, L.; Caruso, S.; Cicero, G.; Bronte, G.; Rolfo, C.; Santini, D.; Russo, A. Effects of anti-miR-182 on TSP-1 expression in human colon cancer cells: There is a sense in antisense? Exp. Opin. Ther. Targets 2013, 17, 1249–1261. [Google Scholar] [CrossRef]
- Yamashiro, Y.; Thang, B.Q.; Shin, S.J.; Lino, C.A.; Nakamura, T.; Kim, J.; Sugiyama, K.; Tokunaga, C.; Sakamoto, H.; Osaka, M.; et al. Role of thrombospondin-1 in mechanotransduction and development of thoracic aortic aneurysm in mouse and humans. Circ. Res. 2018, 123, 660–672. [Google Scholar] [CrossRef]
- Vedantham, S.; Thiagarajan, D.; Ananthakrishnan, R.; Wang, L.; Rosario, R.; Zou, Y.S.; Goldberg, I.; Yan, S.F.; Schmidt, A.M.; Ramasamy, R. Aldose reductase drives hyperacetylation of Egr-1 in hyperglycemia and consequent upregulation of proinflammatory and prothrombotic signals. Diabetes 2014, 63, 761–774. [Google Scholar] [CrossRef] [PubMed]
- Ban, C.R.; Twigg, S.M. Fibrosis in diabetes complications: Pathogenic mechanisms and circulating and urinary markers. Vasc. Health Risk Manag. 2008, 4, 575–596. [Google Scholar] [CrossRef] [PubMed]
- Miller, C.G.; Budoff, G.; Prenner, J.L.; Schwarzbauer, J.E. Minireview: Fibronectin in retinal disease. Exp. Biol. Med. 2017, 242, 1–7. [Google Scholar] [CrossRef] [PubMed]
- Tada, H.; Isogai, S. The fibronectin production is increased by thrombospondin via activation of TGF-beta in cultured human mesangial cells. Nephron 1998, 79, 38–43. [Google Scholar] [CrossRef] [PubMed]
- Qin, D.; Jiang, Y.R.; Meng, Z. Gremlin in the Vitreous of Patients with Proliferative Diabetic Retinopathy and the Downregulation of Gremlin in Retinal Pigment Epithelial Cells. J. Diabetes Res. 2020, 2020, 9238742. [Google Scholar] [CrossRef]
- Zuehlke, A.D.; Beebe, K.; Neckers, L.; Prince, T. Regulation and function of the human HSP90AA1 gene. Gene 2015, 570, 8–16. [Google Scholar] [CrossRef] [PubMed]
- Fu, F.; Wei, X.; Liu, J.; Mi, N. Bioinformatic analysis of specific genes in diabetic nephropathy. Ren. Fail. 2015, 37, 1219–1224. [Google Scholar] [CrossRef]
- Qi, M.; Zhou, Q.; Zeng, W.; Wu, L.; Zhao, S.; Chen, W.; Luo, C.; Shen, M.; Zhang, J.; Tang, C.E. Growth factors in the pathogenesis of diabetic foot ulcers. Front. BioSci. 2018, 23, 310–317. [Google Scholar] [CrossRef]
- Stern, C.; Schreier, B.; Nolze, A.; Rabe, S.; Mildenberger, S.; Gekle, M. Knockout of vascular smooth muscle EGF receptor in a mouse model prevents obesity-induced vascular dysfunction and renal damage in vivo. Diabetologia 2020, 63, 2218–2234. [Google Scholar] [CrossRef]
- Kyohara, M.; Shirakawa, J.; Okuyama, T.; Togashi, Y.; Inoue, R.; Li, J.; Miyashita, D.; Terauchi, Y. Soluble EGFR, a hepatokine, and adipsin, an adipokine, are biomarkers correlated with distinct aspects of insulin resistance in type 2 diabetes subjects. Diabetol. Metab. Syndr. 2020, 12, 83. [Google Scholar] [CrossRef]
- Liu, X.; Feng, M.; Dai, C.; Bao, X.; Deng, K.; Yao, Y.; Wang, R. Expression of EGFR in Pituitary Corticotroph Adenomas and Its Relationship with Tumor Behavior. Front. Endocr. 2019, 10. [Google Scholar] [CrossRef]
- Chen, H.; Simar, D.; Morris, M.J. Maternal obesity impairs brain glucose metabolism and neural response to hyperglycemia in male rat offspring. J. Neurochem. 2014, 129, 297–303. [Google Scholar] [CrossRef] [PubMed]
- Takaoka, M.; Harada, H.; Andl, C.D.; Oyama, K.; Naomoto, Y.; Dempsey, K.L.; Klein-Szanto, A.J.; El-Deiry, W.S.; Grimberg, A.; Nakagawa, H. Epidermal growth factor receptor regulates aberrant expression of insulin-like growth factor-binding protein 3. Cancer Res. 2004, 64, 7711–7723. [Google Scholar] [CrossRef] [PubMed]
- Hanafusa, T.; Shinji, T.; Shiraha, H.; Nouso, K.; Iwasaki, Y.; Yumoto, E.; Ono, T.; Koide, N. Functional promoter upstream p53 regulatory sequence of IGFBP3 that is silenced by tumor specific methylation. BMC Cancer 2005, 5, 9. [Google Scholar] [CrossRef] [PubMed]
- Zhang, L.; Zhan, Q.; Zhan, S.; Kashanchi, F.; Fornace, A.J., Jr.; Seth, P.; Helman, L.J. p53 regulates human insulin-like growth factor II gene expression through active P4 promoter in rhabdomyosarcoma cells. DNA Cell Biol. 1998, 17, 125–131. [Google Scholar] [CrossRef]
- Kupreeva, M.; Diane, A.; Lehner, R.; Watts, R.; Ghosh, M.; Proctor, S.; Vine, D. Effect of metformin and flutamide on insulin, lipogenic and androgen-estrogen signaling, and cardiometabolic risk in a PCOS-prone metabolic syndrome rodent model. Am. J. Physiol. Endocrinol. Metab. 2019, 316, E16–E33. [Google Scholar] [CrossRef]
- Lawan, A.; Bennett, A.M. Mitogen-Activated Protein Kinase Regulation in Hepatic Metabolism. Trends Endocrinol. Metab. 2017, 28, 868–878. [Google Scholar] [CrossRef]
- Kujiraoka, T.; Satoh, Y.; Ayaori, M.; Shiraishi, Y.; Arai-Nakaya, Y.; Hakuno, D.; Yada, H.; Kuwada, N.; Endo, S.; Isoda, K.; et al. Hepatic extracellular signal-regulated kinase 2 suppresses endoplasmic reticulum stress and protects from oxidative stress and endothelial dysfunction. J. Am. Heart Assoc. 2013, 2, e000361. [Google Scholar] [CrossRef]
- Weng, Q.; Zhao, M.; Zheng, J.; Yang, L.; Xu, Z.; Zhang, Z.; Wang, J.; Wang, J.; Yang, B.; Richard Lu, Q.; et al. STAT3 dictates β-cell apoptosis by modulating PTEN in streptozocin-induced hyperglycemia. Cell Death Differ. 2020, 27, 130–145. [Google Scholar] [CrossRef]
- Inoue, H.; Ogawa, W.; Ozaki, M.; Haga, S.; Matsumoto, M.; Furukawa, K.; Hashimoto, N.; Kido, Y.; Mori, T.; Sakaue, H.; et al. Role of STAT-3 in regulation of hepatic gluconeogenic genes and carbohydrate metabolism in vivo. Nat. Med. 2004, 10, 168–174. [Google Scholar] [CrossRef]
- Mashili, F.; Chibalin, A.V.; Krook, A.; Zierath, J.R. Constitutive STAT3 phosphorylation contributes to skeletal muscle insulin resistance in type 2 diabetes. Diabetes 2013, 62, 457–465. [Google Scholar] [CrossRef]
- Jiang, L.; Cui, H.; Ding, J. Smad3 signalling affects high glucose-induced podocyte injury via regulation of the cytoskeletal protein transgelin. Nephrology 2020, 25, 659–666. [Google Scholar] [CrossRef] [PubMed]
- Zheng, C.; Huang, L.; Luo, W.; Yu, W.; Hu, X.; Guan, X.; Cai, Y.; Zou, C.; Yin, H.; Xu, Z.; et al. Inhibition of STAT3 in tubular epithelial cells prevents kidney fibrosis and nephropathy in STZ-induced diabetic mice. Cell Death Dis. 2019, 10, 848. [Google Scholar] [CrossRef]
- Wang, Y.; Zhai, W.L.; Yang, Y.W. Association between NDRG2/IL-6/STAT3 signaling pathway and diabetic retinopathy in rats. Eur. Rev. Med. Pharmacol. Sci. 2020, 24, 3476–3484. [Google Scholar] [CrossRef] [PubMed]
- Geng, S.; Zhu, W.; Wang, S.; Xie, C.; Li, X.; Wu, J.; Li, Y.; Chen, Y.; Wang, X.; Meng, Y.; et al. P53 modulates hepatic insulin sensitivity through NF-κB and p38/ERK MAPK pathways. Biochem. Biophys. Res. Commun. 2018, 495, 2139–2144. [Google Scholar] [CrossRef] [PubMed]
- Kung, C.P.; Murphy, M.E. The role of the p53 tumor suppressor in metabolism and diabetes. J. Endocrinol. 2016, 231, R61–R75. [Google Scholar] [CrossRef]
- Sliwinska, A.; Kasznicki, J.; Kosmalski, M.; Mikolajczyk, M.; Rogalska, A.; Przybylowska, K.; Majsterek, I.; Drzewoski, J. Tumour protein 53 is linked with type 2 diabetes mellitus. Indian J. Med. Res. 2017, 146, 237–243. [Google Scholar] [CrossRef]
- MacAulay, K.; Woodgett, J.R. Targeting glycogen synthase kinase-3 (GSK-3) in the treatment of Type 2 diabetes. Expert Opin. Ther. Targets. 2008, 12, 1265–1274. [Google Scholar] [CrossRef]
- Pitasi, C.L.; Liu, J.; Gausserès, B.; Pommier, G.; Delangre, E.; Armanet, M.; Cattan, P.; Mégarbane, B.; Hanak, A.S.; Maouche, K.; et al. Implication of glycogen synthase kinase 3 in diabetes-associated islet inflammation. J. Endocrinol. 2020, 244, 133–148. [Google Scholar] [CrossRef]
- Lappas, M. GSK3β is increased in adipose tissue and skeletal muscle from women with gestational diabetes where it regulates the inflammatory response. PLoS ONE. 2014, 9, e115854. [Google Scholar] [CrossRef]
- Ying, C.; Liu, T.; Ling, H.; Cheng, M.; Zhou, X.; Wang, S.; Mao, Y.; Chen, L.; Zhang, R.; Li, W. Glucose variability aggravates cardiac fibrosis by altering AKT signalling path. Diab. Vasc. Dis. Res. 2017, 14, 327–335. [Google Scholar] [CrossRef] [PubMed]
- Chen, C.Y.; Chen, J.; He, L.; Stiles, B.L. PTEN: Tumor Suppressor and Metabolic Regulator. Front. Endocrinol. 2018, 9, 338. [Google Scholar] [CrossRef] [PubMed]
- Pal, A.; Barber, T.M.; Van de Bunt, M.; Rudge, S.A.; Zhang, Q.; Lachlan, K.L.; Cooper, N.S.; Linden, H.; Levy, J.C.; Wakelam, M.J.; et al. PTEN mutations as a cause of constitutive insulin sensitivity and obesity. N. Engl. J. Med. 2012, 367, 1002–1011. [Google Scholar] [CrossRef] [PubMed]
- Gao, J.R.; Qin, X.J.; Fang, Z.H.; Li-Shan Han, L.P.; Hui-Jiang Guo, M.F.; Jiang, N.N. To Explore the Pathogenesis of Vascular Lesion of Type 2 Diabetes Mellitus Based on the PI3K/Akt Signaling Pathway. J. Diabetes Res. 2019, 2019, 4650906. [Google Scholar] [CrossRef] [PubMed]
- Khokhar, M.; Roy, D.; Modi, A.; Agarwal, R.; Yadav, D.; Purohit, P.; Sharma, P. Perspectives on the role of PTEN in diabetic nephropathy: An update. Crit. Rev. Clin. Lab. Sci. 2020, 1–14. [Google Scholar] [CrossRef]
- Saito, S.; Thuc, L.C.; Teshima, Y.; Nakada, C.; Nishio, S.; Kondo, H.; Fukui, A.; Abe, I.; Ebata, Y.; Saikawa, T.; et al. Glucose fluctuations aggravate cardiac susceptibility to ischemia/reperfusion injury by modulating microRNAs expression. Circ. J. 2016, 80, 186–195. [Google Scholar] [CrossRef] [PubMed]
- Huang, H.Y.; Lin, Y.C.D.; Li, J.; Huang, K.Y.; Shrestha, S.; Hong, H.C.; Tang, Y.; Chen, Y.G.; Jin, C.N.; Yu, Y.; et al. miRTarBase 2020: Updates to the experimentally validated microRNA–target interaction database. Nucleic Acids Res. 2020, 48, D148–D154. [Google Scholar] [CrossRef] [PubMed]
- Demenkov, P.S.; Ivanisenko, T.V.; Kolchanov, N.A.; Ivanisenko, V.A. ANDVisio: A new tool for graphic visualization and analysis of literature mined associative gene networks in the ANDSystem. Silico Biol. 2012, 11, 149–161. [Google Scholar] [CrossRef] [PubMed]
- Bragina, E.Y.; Tiys, E.S.; Freidin, M.B.; Koneva, L.A.; Demenkov, P.S.; Ivanisenko, V.A.; Kolchanov, N.A.; Puzyrev, V.P. Insights into pathophysiology of dystropy through the analysis of gene networks: An example of bronchial asthma and tuberculosis. Immunogenetics 2014, 66, 457–465. [Google Scholar] [CrossRef] [PubMed]
- Glotov, A.S.; Tiys, E.S.; Vashukova, E.S.; Pakin, V.S.; Demenkov, P.S.; Saik, O.V.; Ivanisenko, T.V.; Arzhanova, O.N.; Mozgovaya, E.V.; Zainulina, M.S.; et al. Molecular association of pathogenetic contributors to pre-eclampsia (pre-eclampsia associome). BMC Syst. Biol. 2015, 9, 1–12. [Google Scholar] [CrossRef] [PubMed]
- Saik, O.V.; Konovalova, N.A.; Demenkov, P.S.; Ivanisenko, T.V.; Petrovskiy, E.D.; Ivanisenko, N.V.; Ivanoshchuk, D.E.; Ponomareva, M.N.; Konovalova, O.S.; Lavrik, I.N.; et al. Molecular associations of Primary Open-Angle Glaucoma with potential comorbid diseases (POAG-associome). Biotecnol. Apl. 2016, 33, 3201–3206. [Google Scholar]
- Saik, O.V.; Demenkov, P.S.; Ivanisenko, T.V.; Bragina, E.Y.; Freidin, M.B.; Goncharova, I.A.; Dosenko, V.E.; Zolotareva, O.I.; Hofestaedt, R.; Lavrik, I.N.; et al. Novel candidate genes important for asthma and hypertension comorbidity revealed from associative gene networks. BMC Med. Genom. 2018, 11, 61–76. [Google Scholar] [CrossRef] [PubMed]
- Saik, O.V.; Nimaev, V.V.; Usmonov, D.B.; Demenkov, P.S.; Ivanisenko, T.V.; Lavrik, I.N.; Ivanisenko, V.A. Prioritization of genes involved in endothelial cell apoptosis by their implication in lymphedema using an analysis of associative gene networks with ANDSystem. BMC Med. Genom. 2019, 12, 47. [Google Scholar] [CrossRef] [PubMed]
- Virtanen, P.; Gommers, R.; Oliphant, T.E.; Haberland, M.; Reddy, T.; Cournapeau, D.; Burovski, E.; Peterson, P.; Weckesser, W.; Bright, J.; et al. SciPy 1.0: Fundamental algorithms for scientific computing in Python. Nat. Methods 2020, 17, 261–272. [Google Scholar] [CrossRef]
- Radua, J.; Mataix-Cols, D. Meta-analytic methods for neuroimaging data explained. Biol. Mood Anxiety Disord. 2012, 2, 6. [Google Scholar] [CrossRef]


| Gene Symbol | Gene Product | Number of Connections |
|---|---|---|
| INS | insulin | 59 |
| IL6 | interleukin 6 | 44 |
| ALB | albumin | 37 |
| GCG | glucagon | 33 |
| LEP | leptin | 30 |
| IGF1 | insulin-like growth factor 1 | 29 |
| SST | somatostatin | 29 |
| IL1B | interleukin 1 beta | 28 |
| ADIPOQ | adiponectin, C1Q, and collagen domain containing | 28 |
| PRL | prolactin | 27 |
| Gene Ontology Biological Processes | Gene Ontology ID | p-Values with FDR Correction |
|---|---|---|
| Regulation of insulin secretion | GO:0050796 | 1.38 × 10⁻⁹ |
| Glucose homeostasis | GO:0042593 | 2.06 × 10⁻⁶ |
| Positive regulation of MAPK cascade | GO:0043410 | 2.31 × 10⁻⁵ |
| Positive regulation of protein kinase B signaling | GO:0051897 | 2.88 × 10⁻⁵ |
| Positive regulation of glycogen biosynthetic process | GO:0045725 | 3.24 × 10⁻⁵ |
| Positive regulation of mitotic nuclear division | GO:0045840 | 3.49 × 10⁻⁴ |
| Glucose metabolic process | GO:0006006 | 3.92 × 10⁻⁴ |
| Positive regulation of nitric oxide biosynthetic process | GO:0045429 | 3 × 10⁻⁴ |
| Negative regulation of gluconeogenesis | GO:0045721 | 4 × 10⁻⁴ |
| Positive regulation of cell proliferation | GO:0008284 | 2.8 × 10⁻³ |
| Cellular protein metabolic process | GO:0044267 | 4.5 × 10⁻³ |
| Positive regulation of smooth muscle cell proliferation | GO:0048661 | 6.2 × 10⁻³ |
| Positive regulation of JAK-STAT cascade | GO:0046427 | 6.6 × 10⁻³ |
| Cell-cell signaling | GO:0007267 | 1.08 × 10⁻² |
| Positive regulation of peptidyl-tyrosine phosphorylation | GO:0050731 | 1.9 × 10⁻² |
| Positive regulation of glucose import | GO:0046326 | 1.94 × 10⁻² |
| Parameter | Gene Network | |||
|---|---|---|---|---|
| Cardiovascular Disease | Diabetic Nephropathy | Diabetic Retinopathy | Diabetic Neuropathy | |
| Number of participants | 300 | 499 | 319 | 95 |
| Number of interactions | 4137 | 8252 | 4381 | 439 |
| Number of genes associated with GV in the gene network | 15 | 16 | 18 | 11 |
| Statistical significance of the overrepresentation of genes associated with GV among all participants of the gene network | 2.5 × 10⁻¹⁴ | 2.9 × 10⁻¹² | 5.1 × 10⁻¹⁸ | 9.2 × 10⁻¹⁵ |
| Average betweenness centrality coefficient for all participant of the network | 361.54 | 595.32 | 362.02 | 98.5 |
| Average betweenness centrality coefficient for the genes associated with GV | 2764.76 | 4108.82 | 1958.24 | 397.94 |
| Significance of difference between the coefficient of betweenness centrality of genes associated with GV and all genes in the network | 3.9 × 10⁻⁸ | 2.7 × 10⁻⁷ | 1.3 × 10⁻⁶ | 1.8 × 10⁻⁴ |
| Gene Ontology Biological Processes | Gene Ontology ID | p-Value of Overrepresentation in Cardiovascular Disease Network | p-Value of Overrepresentation in Diabetic Nephropathy Network | p-Value of Overrepresentation in Diabetic Retinopathy Network |
|---|---|---|---|---|
| Inflammatory response | GO:0006954 | 1.25 × 10⁻⁹ | 6.39 × 10⁻¹⁶ | 1.99 × 10⁻⁷ |
| Regulation of blood pressure | GO:0008217 | 3.29 × 10⁻¹⁰ | 1.88 × 10⁻⁵ | 3.06 × 10⁻⁶ |
| Positive regulation of angiogenesis | GO:0045766 | 7.09 × 10⁻⁵ | 5.60 × 10⁻⁶ | 2.25 × 10⁻¹¹ |
| Positive regulation of nitric oxide biosynthetic process | GO:0045429 | 1.13 × 10⁻⁷ | 1.23 × 10⁻⁴ | 2.18 × 10⁻⁶ |
| Response to lipopolysaccharide | GO:0032496 | 2.15 × 10⁻⁴ | 7.50 × 10⁻⁷ | 8.35 × 10⁻⁷ |
| Aging | GO:0007568 | 2.29 × 10⁻⁴ | 5.88 × 10⁻¹² | 6.94 × 10⁻⁸ |
| Positive regulation of ERK1 and ERK2 cascade | GO:0070374 | 4.15 × 10⁻⁴ | 2.24 × 10⁻¹⁰ | 1.86 × 10⁻⁶ |
| Angiogenesis | GO:0001525 | 6.24 × 10⁻⁴ | 9.51 × 10⁻⁶ | 3.74 × 10⁻⁶ |
| Response to drug | GO:0042493 | 2.7 × 10⁻³ | 5.30 × 10⁻¹² | 4.23 × 10⁻¹⁰ |
| Cell-cell signaling | GO:0007267 | 2.5 × 10⁻³ | 3.85 × 10⁻⁴ | 1.99 × 10⁻⁵ |
| Positive regulation of cell proliferation | GO:0008284 | 3 × 10⁻³ | 7.56 × 10⁻¹⁰ | 6.29 × 10⁻⁶ |
| Platelet degranulation | GO:0002576 | 4 × 10⁻³ | 3.42 × 10⁻¹¹ | 1.29 × 10⁻⁵ |
| Positive regulation of gene expression | GO:0010628 | 3.4 × 10⁻³ | 5.89 × 10⁻⁴ | 2.95 × 10⁻⁵ |
| Positive regulation of phosphatidylinositol 3-kinase signaling | GO:0014068 | 1.9 × 10⁻³ | 2.67 × 10⁻⁴ | 1.94 × 10⁻² |
| Leukocyte migration | GO:0050900 | 1.41 × 10⁻² | 1.11 × 10⁻⁴ | 8.6 × 10⁻³ |
| Rank | Gene Symbol | Gene Product | Gene product Characteristics According to NCBI Gene Database |
|---|---|---|---|
| 1 | THBS1 | Thrombospondin 1 | Glycoprotein, a component of extracellular matrix, which mediates intercellular interactions and plays a role in platelet aggregation, angiogenesis, and oncogenesis. |
| 2 | FN1 | Fibronectin 1 | Glycoprotein, a component of extracellular matrix, is involved in the cell adhesion, wound healing, blood coagulation, and tumor metastasis. |
| 3 | HSP90AA1 | Heat shock protein 90 alpha family class A member 1 | Chaperone promoting proper folding of target proteins during cell stress. |
| 4 | EGFR | Epidermal growth factor receptor | Receptor for members of the epidermal growth factor family. It is located on the cell surface and promotes cell proliferation. |
| 5 | MAPK1 | Mitogen-activated protein kinase 1 | MAP kinase that acts as a trigger for a variety of biochemical signals, being involved in cell proliferation, differentiation, and development. |
| 6 | STAT3 | Signal transducer and activator of transcription 3 | Signal transducer and activator of transcription in response to cytokines and growth factors. It mediates the expression of many genes in response to cellular stimuli and plays a key role in cell growth, apoptosis, and immune processes. |
| 7 | TP53 | Tumor protein p53 | Tumor suppressor protein that responds to various cellular stresses and regulates the expression of target genes. It causes a stop of the cell cycle, apoptosis, DNA repair, and metabolic changes. Mutations in this gene are associated with different human cancers. |
| 8 | EGF | Epidermal growth factor | Epidermal growth factor, which acts as a mitogenic factor by binding to a cell surface epidermal growth factor receptor. It plays an important role in the growth, proliferation, and differentiation of many cell types. |
| 9 | GSK3B | Glycogen synthase kinase 3 beta | Serine-threonine kinase, a member of the glycogen synthase kinase subfamily, regulates glucose homeostasis and is involved in energy metabolism, inflammation, mitochondrial dysfunction, and apoptosis. |
| 10 | PTEN | Phosphatase and tensin homolog | Phosphatidylinositol-3,4,5-triphosphate-3-phosphatase, a tumor suppressor. It inhibits AKT/PKB signaling pathway. |
Publisher’s Note: MDPI stays neutral with regard to jurisdictional claims in published maps and institutional affiliations. |
© 2020 by the authors. Licensee MDPI, Basel, Switzerland. This article is an open access article distributed under the terms and conditions of the Creative Commons Attribution (CC BY) license (http://creativecommons.org/licenses/by/4.0/).
Share and Cite
Saik, O.V.; Klimontov, V.V. Bioinformatic Reconstruction and Analysis of Gene Networks Related to Glucose Variability in Diabetes and Its Complications. Int. J. Mol. Sci. 2020, 21, 8691. https://doi.org/10.3390/ijms21228691
Saik OV, Klimontov VV. Bioinformatic Reconstruction and Analysis of Gene Networks Related to Glucose Variability in Diabetes and Its Complications. International Journal of Molecular Sciences. 2020; 21(22):8691. https://doi.org/10.3390/ijms21228691
Chicago/Turabian StyleSaik, Olga V., and Vadim V. Klimontov. 2020. "Bioinformatic Reconstruction and Analysis of Gene Networks Related to Glucose Variability in Diabetes and Its Complications" International Journal of Molecular Sciences 21, no. 22: 8691. https://doi.org/10.3390/ijms21228691
APA StyleSaik, O. V., & Klimontov, V. V. (2020). Bioinformatic Reconstruction and Analysis of Gene Networks Related to Glucose Variability in Diabetes and Its Complications. International Journal of Molecular Sciences, 21(22), 8691. https://doi.org/10.3390/ijms21228691