How Machine Learning Methods Helped Find Putative Rye Wax Genes Among GBS Data

 , , and
Abstract
1. Introduction
Rye Genetic Maps—Genes and QTL
2. Results
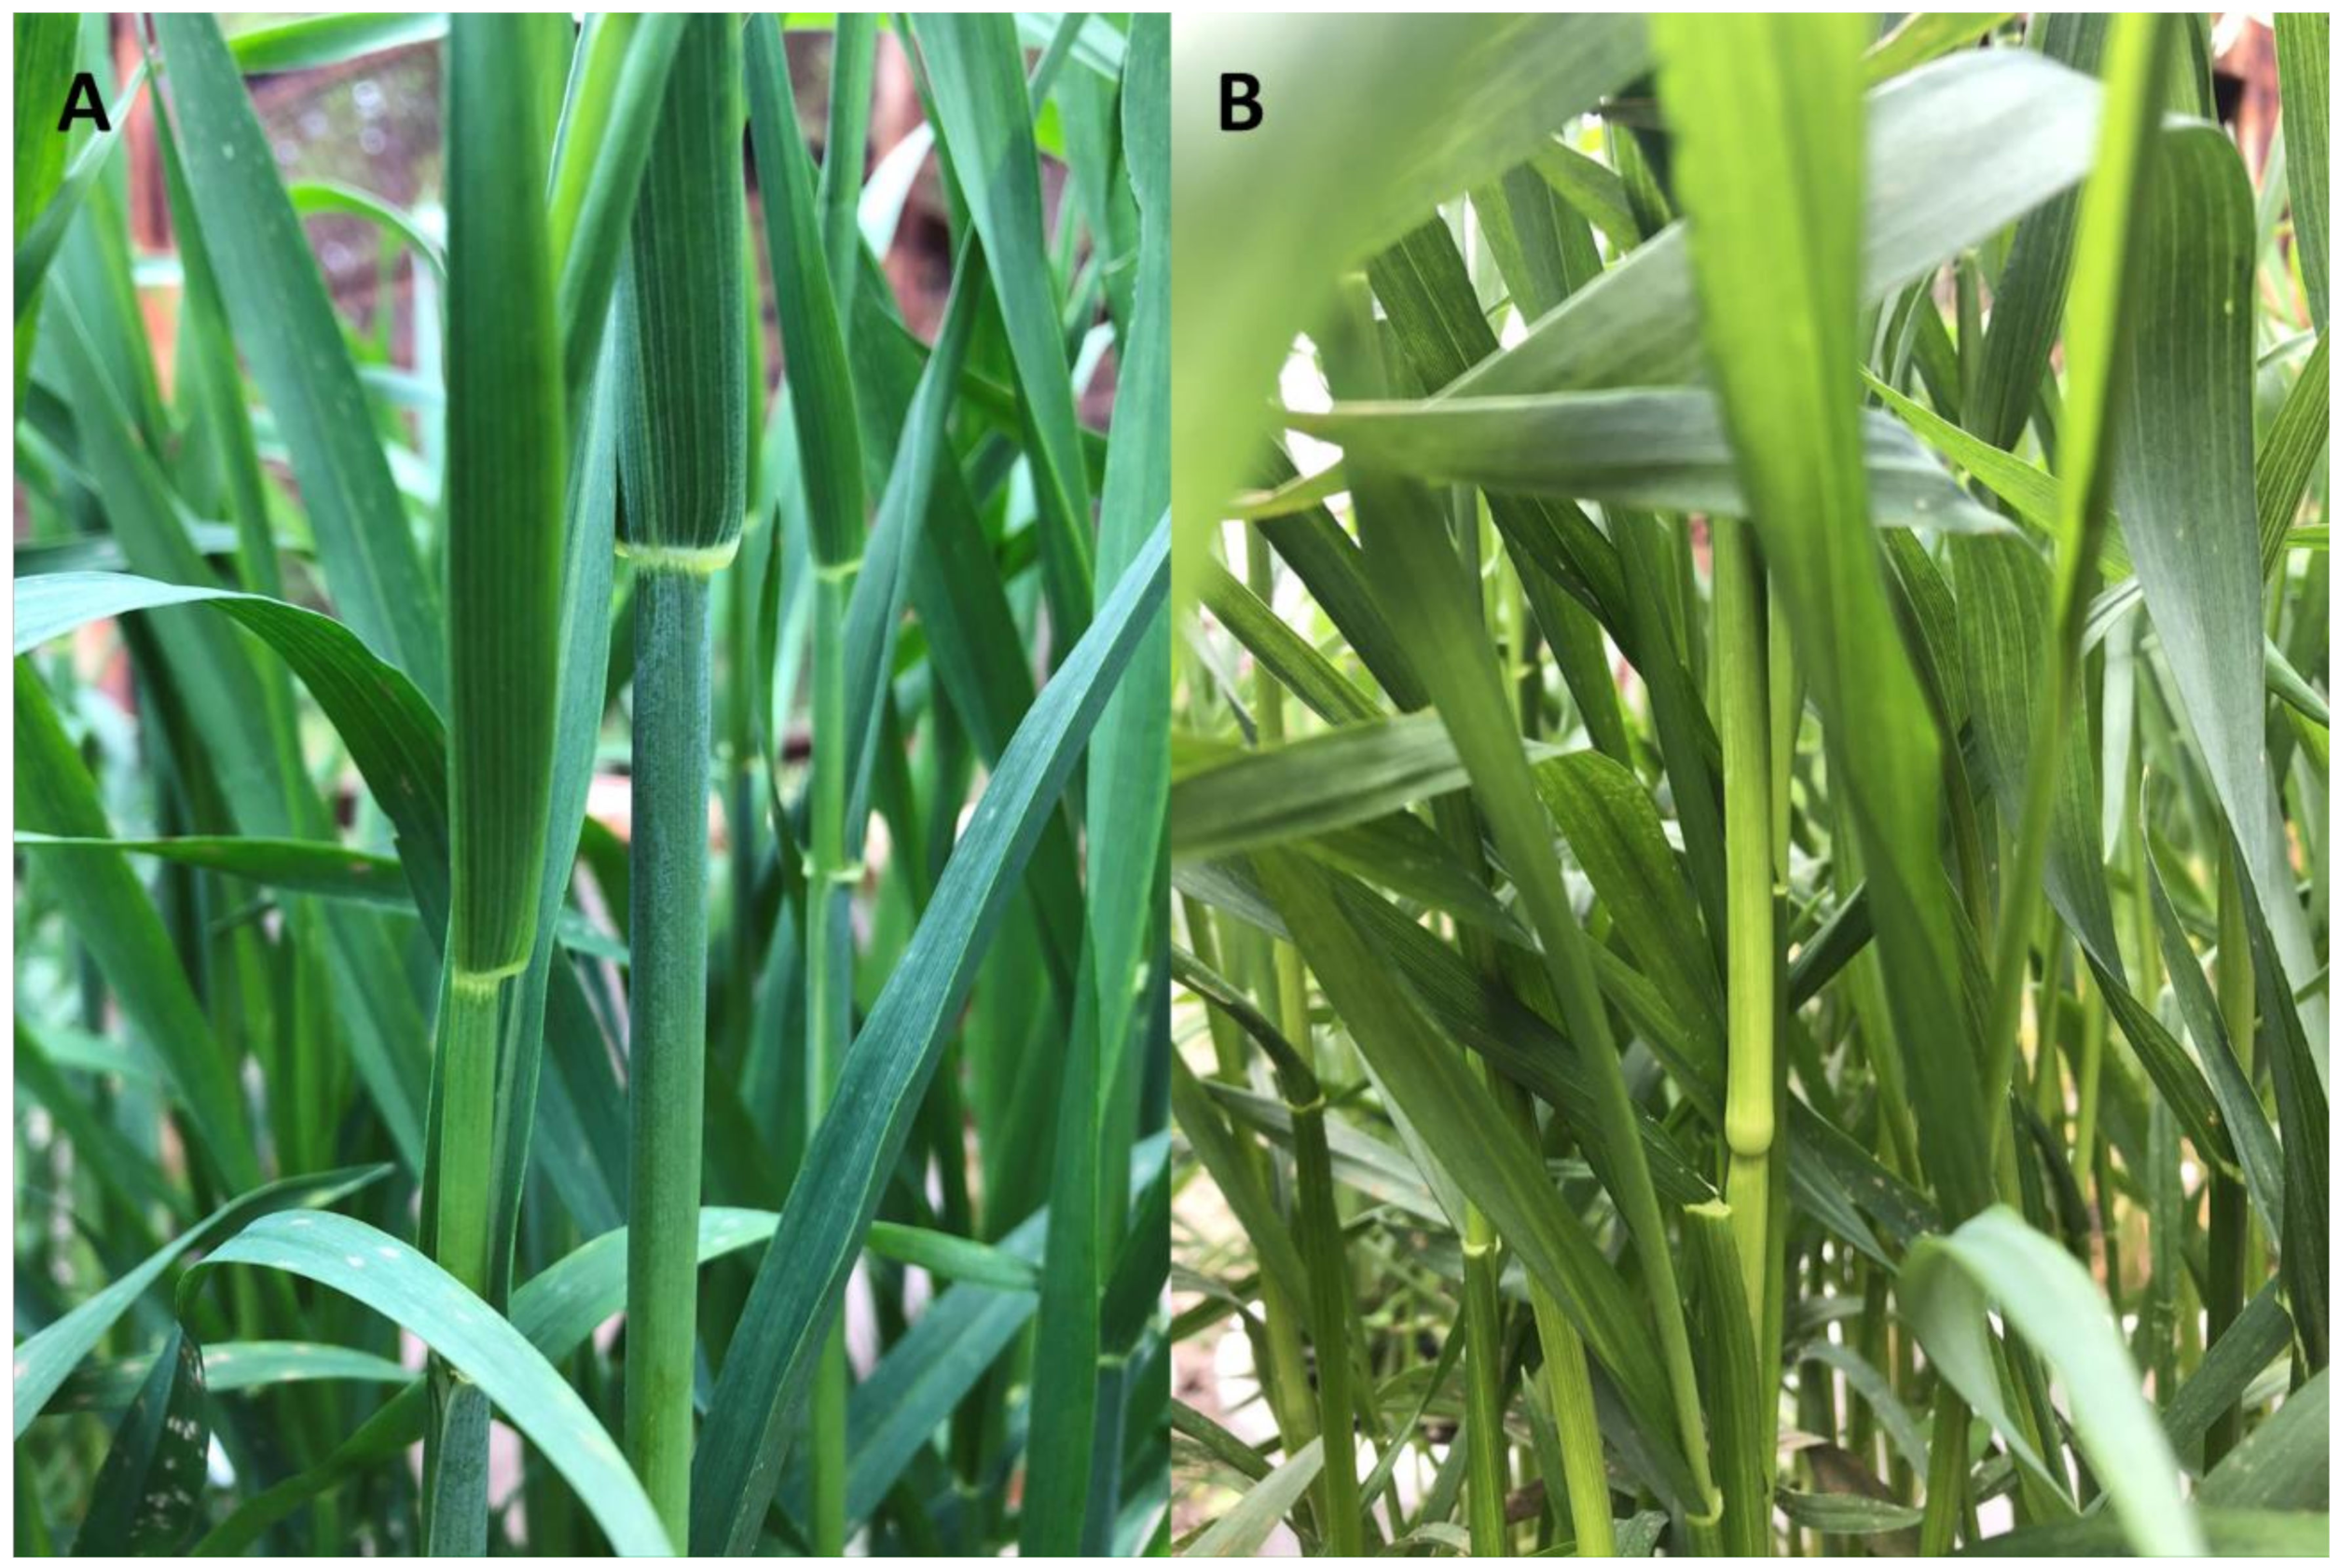
2.1. Effect of Lack of Wax Cover on Phenotypic Features in the Mapping Population
2.2. Genotyping by Sequencing the BK2 Mapping Population with DArTseq Technology
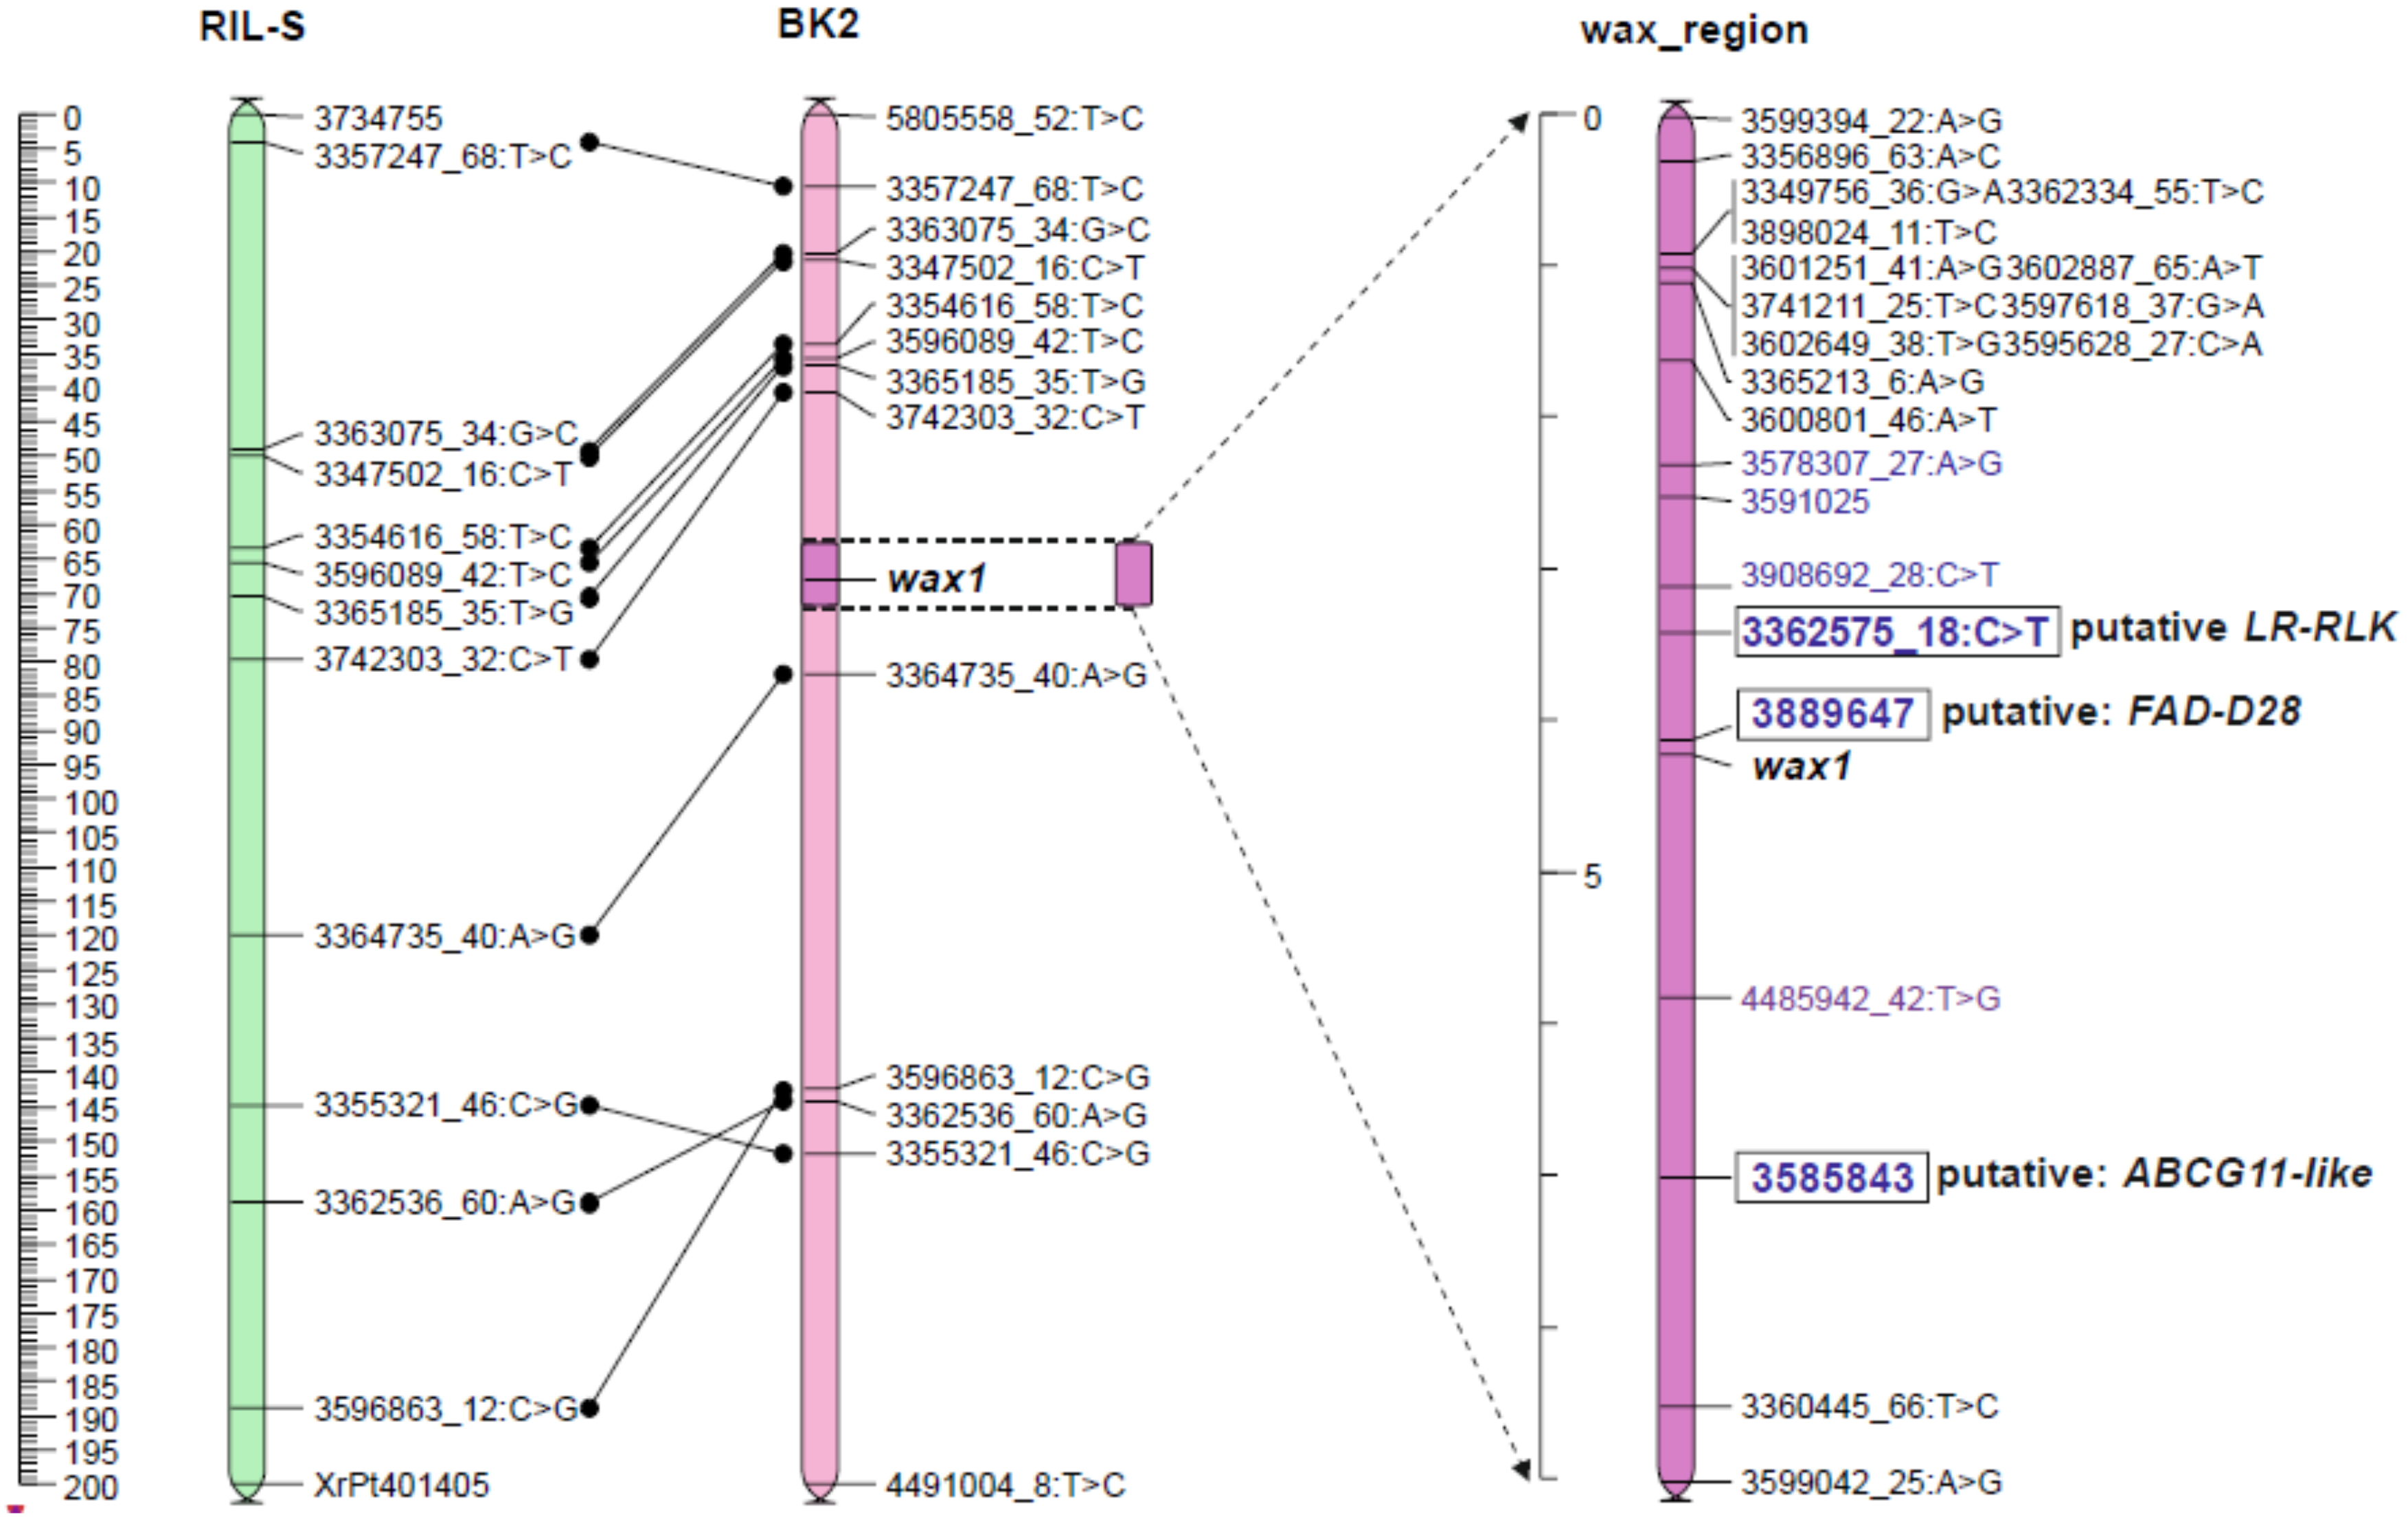
2.3. Position of the Wax Locus in the Rye Genome Determined Using Mapping Procedure
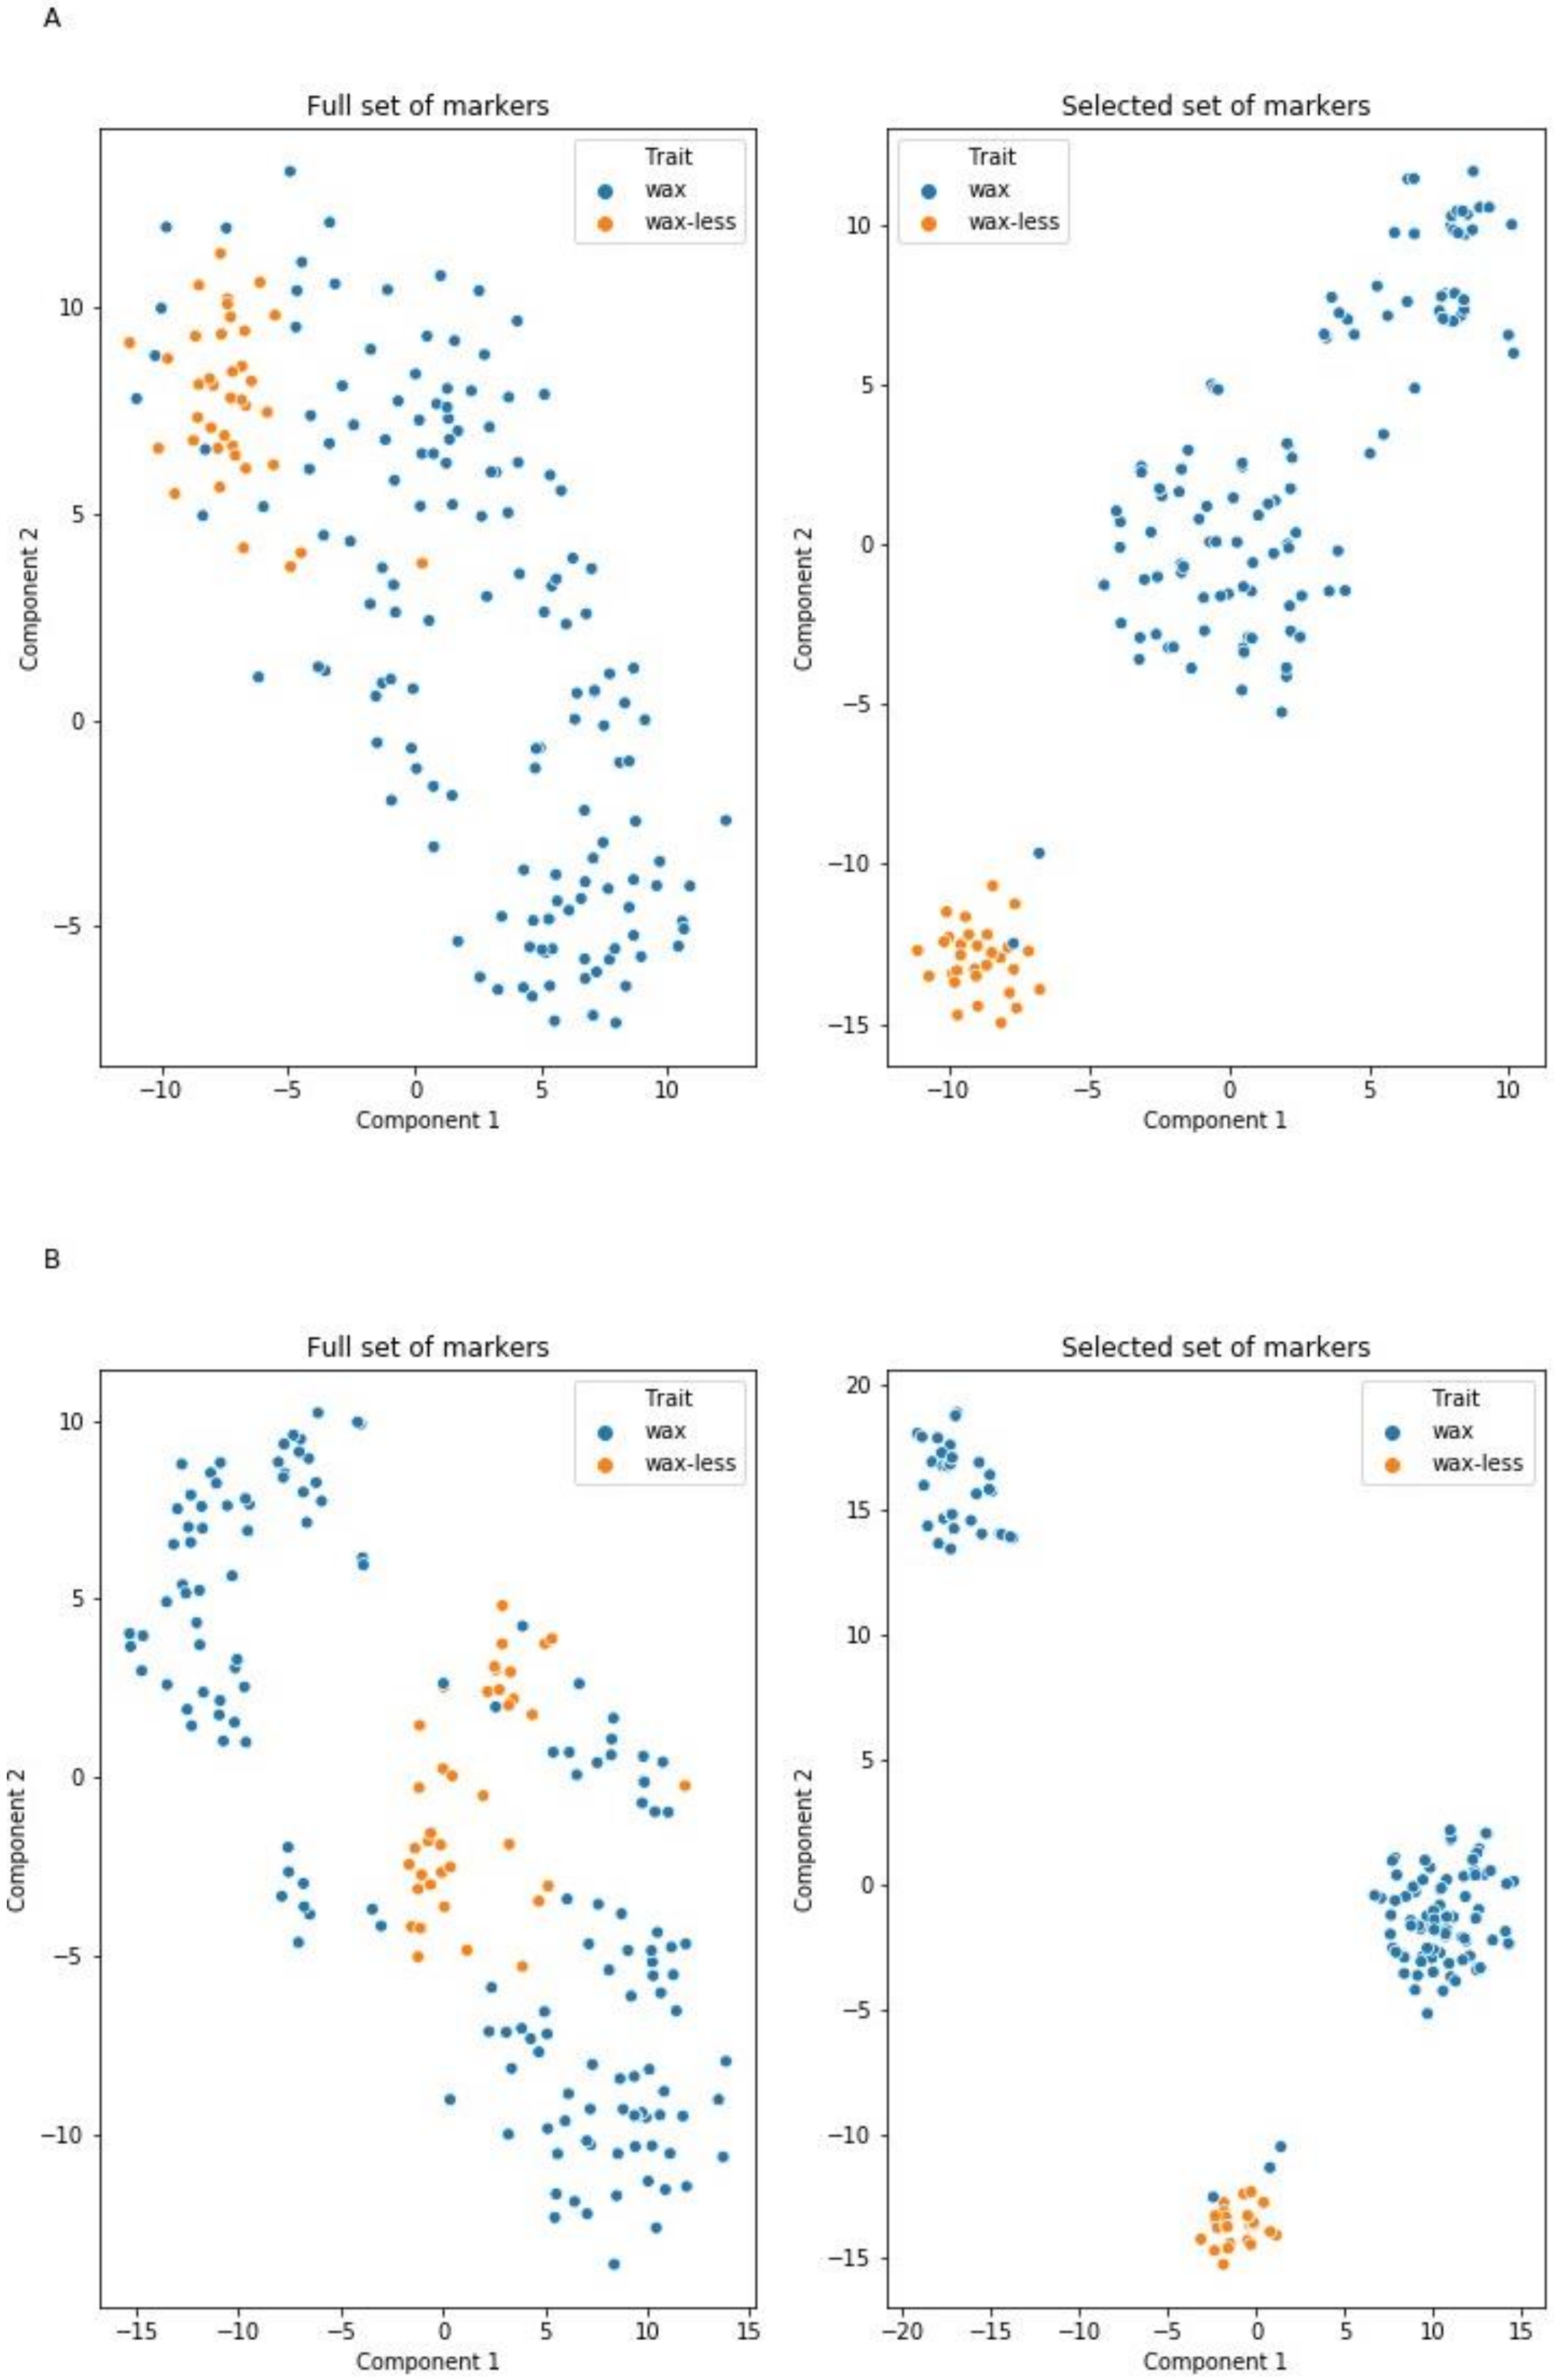
2.4. Markers Distinguishing Between Waxy and Waxless Plants Detected Using Machine Learning (ML) Methods
2.5. Genetic Map of Wax Region
2.5.1. Candidate Genes for Wax Layer Creation
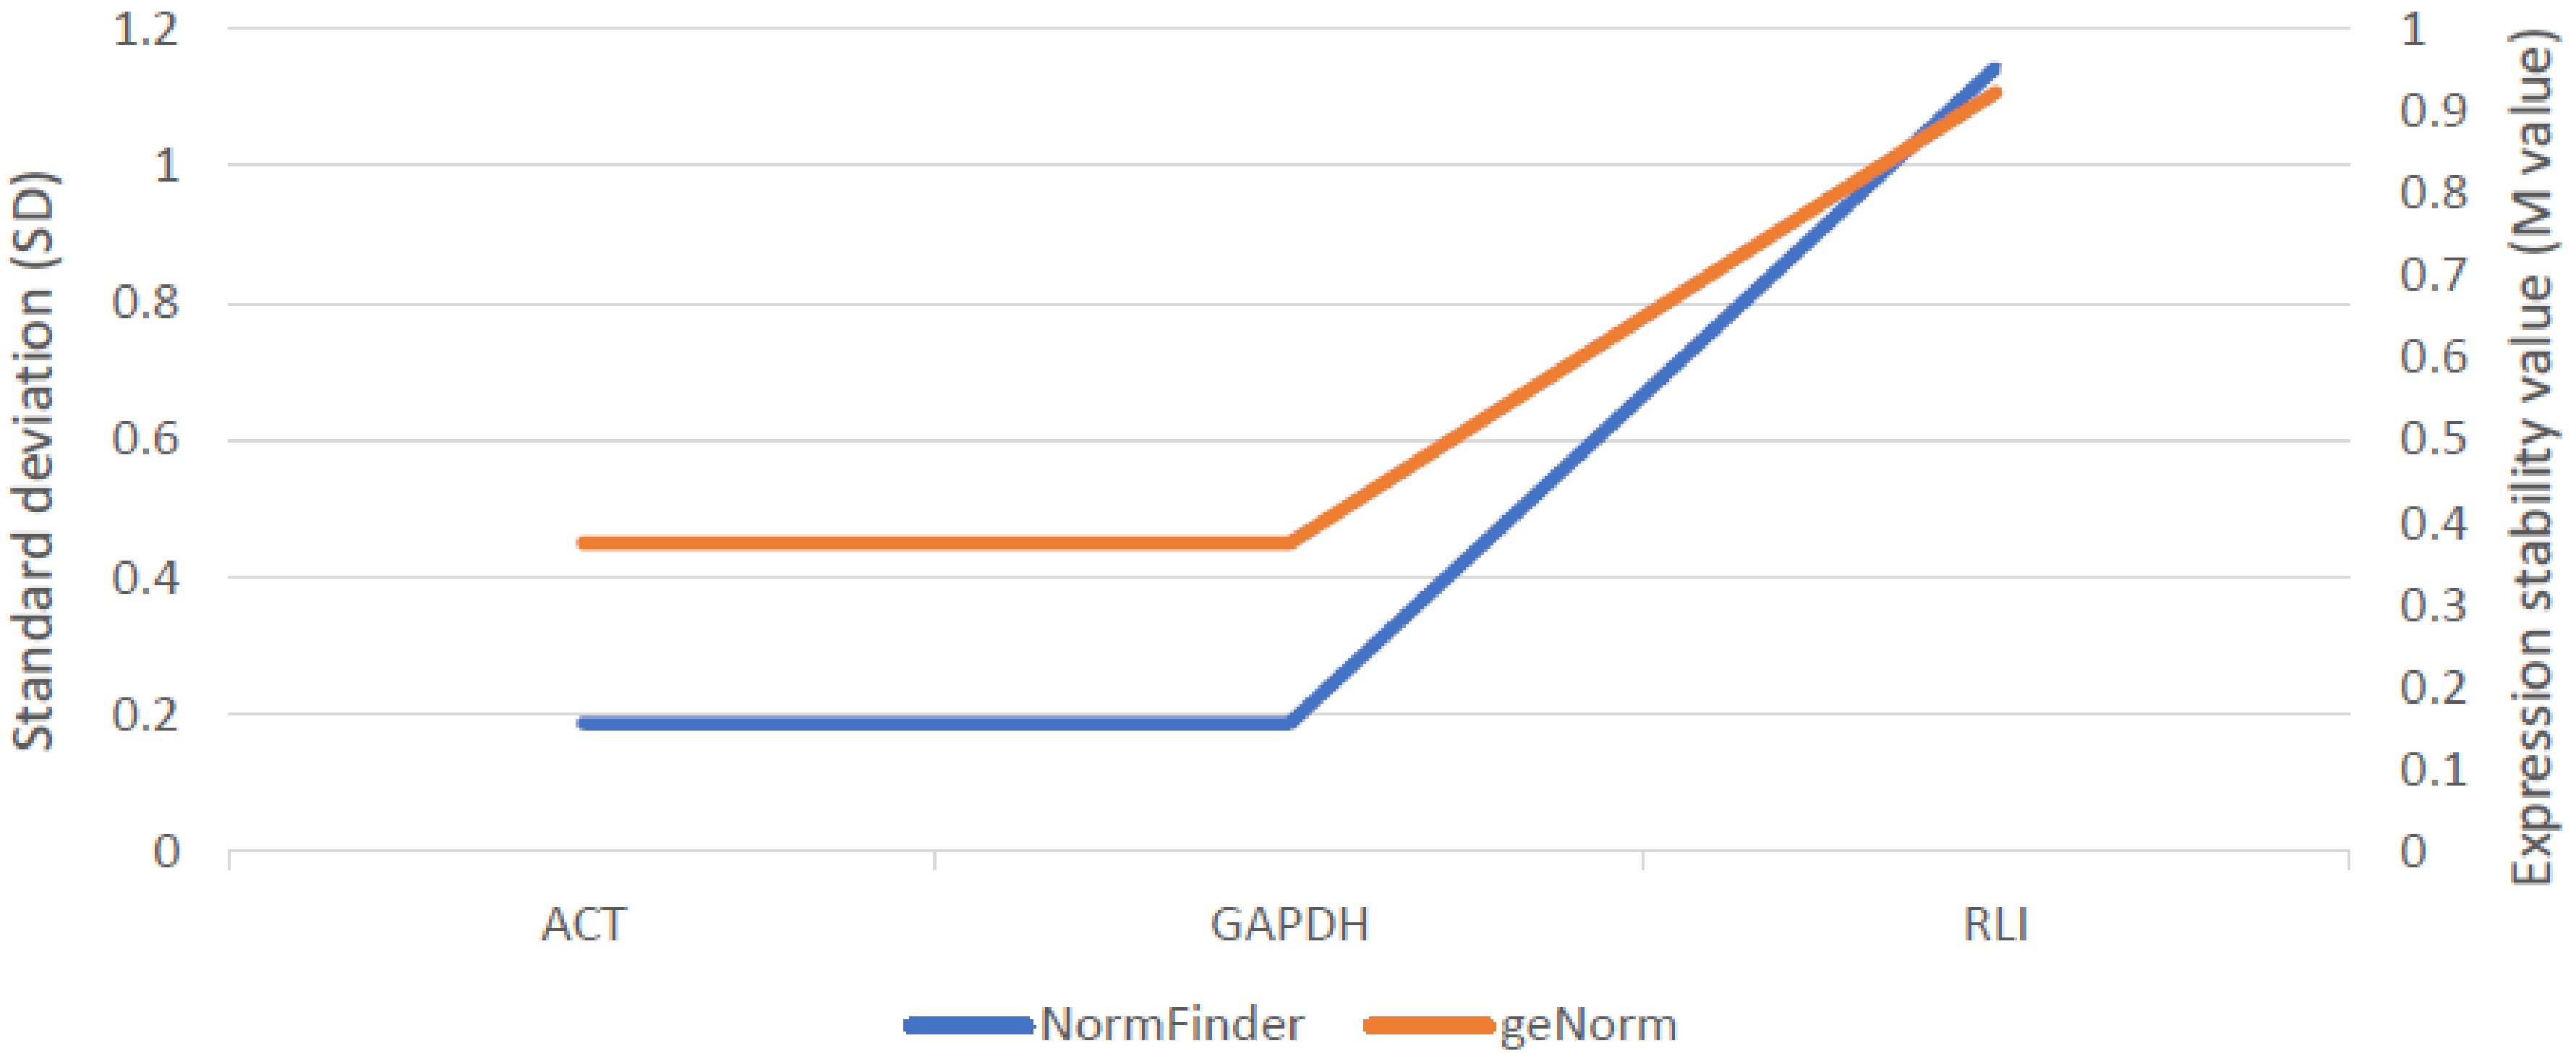
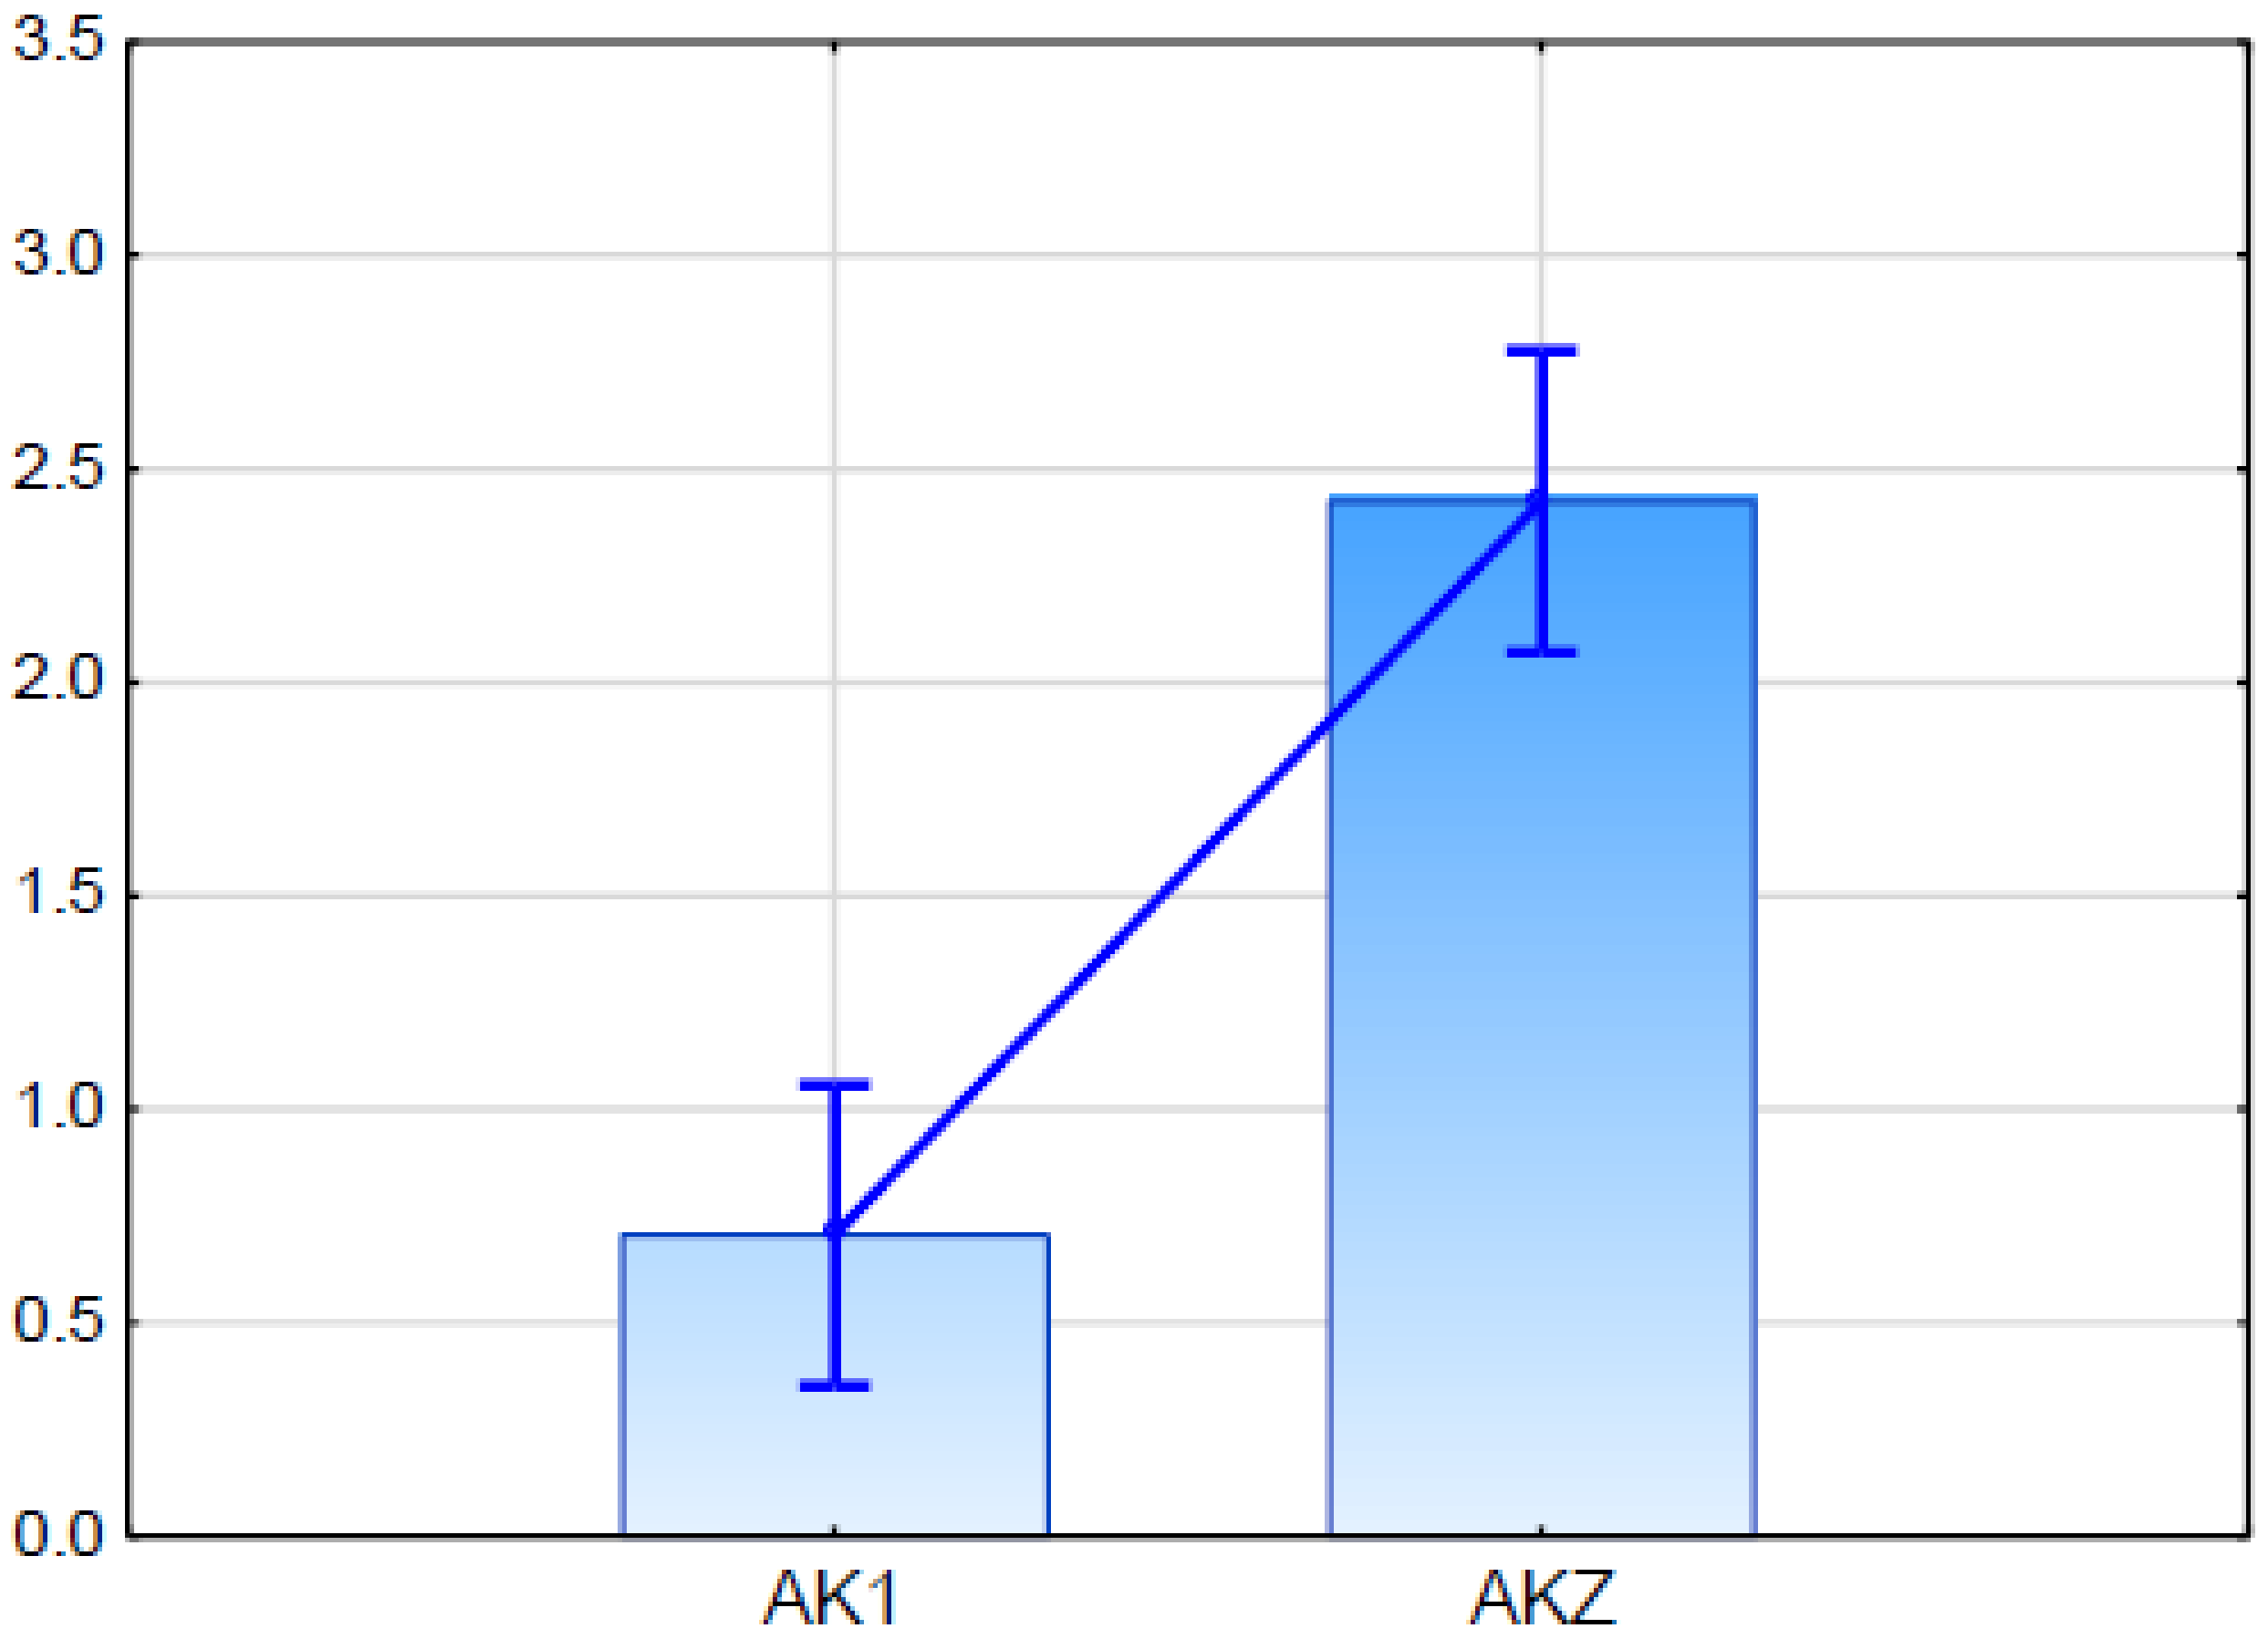
2.5.2. Expression Analysis of Candidate Gene for ABCG11 Transporter
3. Discussion
3.1. Mapping Procedure with ML Methods Support
3.2. Candidate Gen for ABC Transporter G Family Member
3.3. Putative Candidate Gene for Fatty Acid Desaturase (FAD)
3.4. Putative Candidate Gene for Leucine-Rich Repeat Receptor-Like Protein Kinase (LRR RLK)
3.5. Summary
4. Material and Methods
Supplementary Materials
Author Contributions
Funding
Conflicts of Interest
Abbreviations
| ABC | ATP-binding cassette |
| BRs | brassinosteroids |
| CER | eceriferum |
| cM | centimorgan |
| CT | compactness of the spike |
| cv | cultivar |
| DArTseq | sequencing-based diversity array technology |
| FA | fatty acid |
| FAD | fatty acid desaturase |
| FD | flowering date |
| GBS | genotyping by sequencing |
| GNPS | number of grains per spike |
| GWPS | weight of grains per spike |
| LOD | logarithm of odds |
| linklod | critical LOD |
| LR | logistic regression |
| LRR | leucine-rich repeat |
| ML | machine learning |
| MLH | maximum likelihood |
| NCBI | National Center of Biotechnology Information |
| PH | plant height |
| RIL | recombinant inbred line |
| RLK | receptor-like protein kinase |
| RM | regression mapping |
| SL | spike length |
| SNPS | number of spikelets per spike |
| TGW | thousand grain weight |
| TN | tiller number |
| VLCFA | very long-chain fatty acid |
References
- Ji, X.; Jetter, R. Very long chain alkylresorcinols accumulate in the intracuticular wax of rye (Secale cereale L.) leaves near the tissue surface. Phytochemistry 2008, 69, 1197–1207. [Google Scholar] [CrossRef] [PubMed]
- Yeats, T.H.; Rose, J.K. The Formation and Function of Plant Cuticles1. Plant. Physiol. 2013, 163, 5–20. [Google Scholar] [CrossRef] [PubMed]
- Würschum, T.; Langer, S.M.; Longin, C.F.H.; Tucker, M.R.; Leiser, W.L. Refining the genetic architecture of flag leaf glaucousness in wheat. Theor. Appl. Genet. 2020, 133, 981–991. [Google Scholar] [CrossRef] [PubMed]
- Koch, K.; Dommisse, A.; Niemietz, A.; Barthlott, W.; Wandelt, K. Nanostructure of epicuticular plant waxes: Self-assembly of wax tubules. Surf. Sci. 2009, 603, 1961–1968. [Google Scholar] [CrossRef]
- Zhang, J.-Y.; Broeckling, C.D.; Blancaflor, E.B.; Sledge, M.K.; Sumner, L.W.; Wang, Z.-Y. Overexpression of WXP1, a putative Medicago truncatula AP2 domain-containing transcription factor gene, increases cuticular wax accumulation and enhances drought tolerance in transgenic alfalfa (Medicago sativa). Plant J. 2005, 42, 689–707. [Google Scholar] [CrossRef]
- Kim, K.W.; Ahn, J.J.; Lee, J.-H. Micromorphology of epicuticular wax structures of the garden strawberry leaves by electron microscopy: Syntopism and polymorphism. Micron 2009, 40, 327–334. [Google Scholar] [CrossRef]
- Maier, C.G.-A.; Post-Beittenmiller, D. Epicuticular wax on leek in vitro developmental stages and seedlings under varied growth conditions. Plant Sci. 1998, 134, 53–67. [Google Scholar] [CrossRef]
- Magnucka, E.G.; Suzuki, Y.; Pietr, S.J.; Kozubek, A.; Zarnowski, R. Cycloate, an inhibitor of fatty acid elongase, modulates the metabolism of very-long-side-chain alkylresorcinols in rye seedlings. Pest. Manag. Sci. 2009, 65, 1065–1070. [Google Scholar] [CrossRef]
- Aarts, M.G.; Keijzer, C.J.; Stiekema, W.J.; Pereira, A. Molecular characterization of the CER1 gene of Arabidopsis involved in epicuticular wax biosynthesis and pollen fertility. Plant Cell 1995, 7, 2115–2127. [Google Scholar]
- Haslam, T.M.; Mañas-Fernández, A.; Zhao, L.; Kunst, L. Arabidopsis ECERIFERUM2 Is a Component of the Fatty Acid Elongation Machinery Required for Fatty Acid Extension to Exceptional Lengths. Plant Physiol. 2012, 160, 1164–1174. [Google Scholar] [CrossRef]
- Hannoufa, A.; Negruk, V.; Eisner, G.; Lemieux, B. The CER3 gene of Arabidopsis thaliana is expressed in leaves, stems, roots, flowers and apical meristems. Plant J. 1996, 10, 459–467. [Google Scholar] [CrossRef] [PubMed]
- Rowland, O.; Zheng, H.; Hepworth, S.R.; Lam, P.; Jetter, R.; Kunst, L. CER4 Encodes an Alcohol-Forming Fatty Acyl-Coenzyme A Reductase Involved in Cuticular Wax Production in Arabidopsis. Plant. Physiol. 2006, 142, 866–877. [Google Scholar] [CrossRef] [PubMed]
- Pighin, J.A. Plant Cuticular Lipid Export Requires an ABC Transporter. Science 2004, 306, 702–704. [Google Scholar] [CrossRef] [PubMed]
- Fiebig, A.; Mayfield, J.A.; Miley, N.L.; Chau, S.; Fischer, R.L.; Preuss, D. Alterations in CER6, a gene identical to CUT1, differentially affect long-chain lipid content on the surface of pollen and stems. Plant Cell 2000, 12, 2001–2008. [Google Scholar] [CrossRef]
- Hooker, T.S.; Millar, A.A.; Kunst, L. Significance of the Expression of the CER6 Condensing Enzyme for Cuticular Wax Production in Arabidopsis. Plant Physiol. 2002, 129, 1568–1580. [Google Scholar] [CrossRef]
- Hooker, T.S.; Lam, P.; Zheng, H.; Kunst, L. A Core Subunit of the RNA-Processing/Degrading Exosome Specifically Influences Cuticular Wax Biosynthesis in Arabidopsis. Plant Cell 2007, 19, 904–913. [Google Scholar] [CrossRef]
- Lü, S.; Song, T.; Kosma, D.K.; Parsons, E.P.; Rowland, O.; Jenks, M.A. ArabidopsisCER8encodes LONG-CHAIN ACYL-COA SYNTHETASE 1 (LACS1) that has overlapping functions with LACS2 in plant wax and cutin synthesis. Plant J. 2009, 59, 553–564. [Google Scholar] [CrossRef]
- Lü, S.; Zhao, H.; Marais, D.L.D.; Parsons, E.P.; Wen, X.; Xu, X.; Bangarusamy, D.K.; Wang, G.; Rowland, O.; Juenger, T.; et al. Arabidopsis ECERIFERUM9 Involvement in Cuticle Formation and Maintenance of Plant Water Status. Plant Physiol. 2012, 159, 930–944. [Google Scholar] [CrossRef]
- Zhao, H.; Zhang, H.; Cui, P.; Ding, F.; Wang, G.; Li, R.; Jenks, M.A.; Lu, S.; Xiong, L. The Putative E3 Ubiquitin Ligase ECERIFERUM9 Regulates Abscisic Acid Biosynthesis and Response during Seed Germination and Postgermination Growth in Arabidopsis. Plant Physiol. 2014, 165, 1255–1268. [Google Scholar] [CrossRef]
- Zheng, H.; Rowland, O.; Kunst, L. Disruptions of the Arabidopsis Enoyl-CoA Reductase Gene Reveal an Essential Role for Very-Long-Chain Fatty Acid Synthesis in Cell Expansion during Plant Morphogenesis. Plant Cell 2005, 17, 1467–1481. [Google Scholar] [CrossRef]
- Suo, B.; Seifert, S.; Kirik, V. Arabidopsis GLASSY HAIR genes promote trichome papillae development. J. Exp. Bot. 2013, 64, 4981–4991. [Google Scholar] [CrossRef] [PubMed]
- Zhang, X.; Liu, Z.; Wang, P.; Wang, Q.; Yang, S.; Feng, H. Fine mapping of BrWax1, a gene controlling cuticular wax biosynthesis in Chinese cabbage (Brassica rapa L. ssp. pekinensis). Mol. Breed. 2013, 32, 867–874. [Google Scholar] [CrossRef]
- Wang, C.; Li, H.; Li, Y.; Meng, Q.; Xie, F.; Xu, Y.; Wan, Z. Genetic characterization and fine mapping BrCER4 in involved cuticular wax formation in purple cai-tai (Brassica rapa L. var. purpurea). Mol. Breed. 2019, 39, 12. [Google Scholar] [CrossRef]
- Liu, D.; Dong, X.; Liu, Z.; Tang, J.; Zhuang, M.; Zhang, Y.; Lv, H.; Liu, Y.; Li, Z.; Fang, Z.; et al. Fine Mapping and Candidate Gene Identification for Wax Biosynthesis Locus, BoWax1 in Brassica oleracea L. var. capitata. Front. Plant. Sci. 2018, 9. [Google Scholar] [CrossRef] [PubMed]
- Sturaro, M.; Hartings, H.; Schmelzer, E.; Velasco, R.; Salamini, F.; Motto, M. Cloning and Characterization of GLOSSY1, a Maize Gene Involved in Cuticle Membrane and Wax Production1[w]. Plant Physiol. 2005, 138, 478–489. [Google Scholar] [CrossRef]
- Zhou, L.; Ni, E.; Yang, J.; Zhou, H.; Liang, H.; Li, J.; Jiang, D.; Wang, Z.; Liu, Z.; Zhuang, C. Rice OsGL1-6 Is Involved in Leaf Cuticular Wax Accumulation and Drought Resistance. PLoS ONE 2013, 8, e65139. [Google Scholar] [CrossRef]
- Adamski, N.M.; Bush, M.S.; Simmonds, J.; Turner, A.S.; Mugford, S.G.; Jones, A.; Findlay, K.; Pedentchouk, N.; Von Wettstein-Knowles, P.; Uauy, C.; et al. TheInhibitor of wax 1locus (Iw1) prevents formation of β- and OH-β-diketones in wheat cuticular waxes and maps to a sub-cM interval on chromosome arm 2BS. Plant J. 2013, 74, 989–1002. [Google Scholar] [CrossRef]
- Wu, H.; Qin, J.; Han, J.; Zhao, X.; Ouyang, S.; Liang, Y.; Zhang, N.; Wang, Z.; Wu, Q.; Xie, J.; et al. Comparative High-Resolution Mapping of the Wax Inhibitors Iw1 and Iw2 in Hexaploid Wheat. PLoS ONE 2013, 8, e84691. [Google Scholar] [CrossRef]
- Zhang, Z.; Wang, W.; Li, W. Genetic Interactions Underlying the Biosynthesis and Inhibition of β-Diketones in Wheat and Their Impact on Glaucousness and Cuticle Permeability. PLoS ONE 2013, 8, e54129. [Google Scholar] [CrossRef]
- Nishijima, R.; Iehisa, J.C.M.; Matsuoka, Y.; Takumi, S. The cuticular wax inhibitor locus Iw2 in wild diploid wheat Aegilops tauschii: Phenotypic survey, genetic analysis, and implications for the evolution of common wheat. BMC Plant. Biol. 2014, 14, 246. [Google Scholar] [CrossRef]
- Xu, Z.; Yuan, C.; Wang, J.; Fu, D.; Wu, J. Mapping the glaucousness suppressor Iw1 from wild emmer wheat “PI 481521.”. Crop J. 2015, 3, 37–45. [Google Scholar] [CrossRef][Green Version]
- Von Wettstein-Knowles, P.; Wettstein-Knowles, P. Biosynthetic relationships between β-diketones and esterified alkan-2-ols deduced from epicuticular wax of barley mutants. Mol. Genet. Genom. 1976, 144, 43–48. [Google Scholar] [CrossRef]
- Hen-Avivi, S.; Savin, O.; Racovita, R.C.; Lee, W.-S.; Adamski, N.M.; Malitsky, S.; Almekias-Siegl, E.; Levy, M.; Vautrin, S.; Bergès, H.; et al. A Metabolic Gene Cluster in the Wheat W1 and the Barley Cer-cqu Loci Determines β-Diketone Biosynthesis and Glaucousness. Plant Cell 2016, 28, 1440–1460. [Google Scholar] [CrossRef] [PubMed]
- Bird, D.A.; Beisson, F.; Brigham, A.; Shin, J.; Greer, S.; Jetter, R.; Kunst, L.; Wu, X.; Yephremov, A.; Samuels, L.; et al. Characterization of Arabidopsis ABCG11/WBC11, an ATP binding cassette (ABC) transporter that is required for cuticular lipid secretion†. Plant J. 2007, 52, 485–498. [Google Scholar] [CrossRef] [PubMed]
- Panikashvili, D.; Savaldi-Goldstein, S.; Mandel, T.; Yifhar, T.; Franke, R.B.; Höfer, R.; Schreiber, L.; Chory, J.; Aharoni, A. The Arabidopsis DESPERADO/AtWBC11 Transporter Is Required for Cutin and Wax Secretion. Plant Physiol. 2007, 145, 1345–1360. [Google Scholar] [CrossRef]
- Panikashvili, D.; Shi, J.; Bocobza, S.; Franke, R.B.; Schreiber, L.; Aharoni, A. The Arabidopsis DSO/ABCG11 Transporter Affects Cutin Metabolism in Reproductive Organs and Suberin in Roots. Mol. Plant. 2010, 3, 563–575. [Google Scholar] [CrossRef] [PubMed]
- Bessire, M.; Borel, S.; Fabre, G.; Carraça, L.; Efremova, N.; Yephremov, A.; Cao, Y.; Jetter, R.; Jacquat, A.-C.; Métraux, J.-P.; et al. A Member of the PLEIOTROPIC DRUG RESISTANCE Family of ATP Binding Cassette Transporters Is Required for the Formation of a Functional Cuticle in Arabidopsis. Plant Cell 2011, 23, 1958–1970. [Google Scholar] [CrossRef]
- Chen, G.; Komatsuda, T.; Ma, J.F.; Nawrath, C.; Pourkheirandish, M.; Tagiri, A.; Hu, Y.-G.; Sameri, M.; Li, X.; Zhao, X.; et al. An ATP-binding cassette subfamily G full transporter is essential for the retention of leaf water in both wild barley and rice. Proc. Natl. Acad. Sci. USA 2011, 108, 12354–12359. [Google Scholar] [CrossRef]
- Panikashvili, D.; Shi, J.; Schreiber, L.; Aharoni, A. The Arabidopsis ABCG13 transporter is required for flower cuticle secretion and patterning of the petal epidermis. New Phytol. 2011, 190, 113–124. [Google Scholar] [CrossRef]
- Qin, P.; Tu, B.; Wang, Y.; Deng, L.; Quilichini, T.D.; Li, T.; Wang, H.; Ma, B.; Li, S. ABCG15 Encodes an ABC Transporter Protein, and is Essential for Post-Meiotic Anther and Pollen Exine Development in Rice. Plant Cell Physiol. 2012, 54, 138–154. [Google Scholar] [CrossRef]
- Li, L.; Li, D.; Liu, S.; Ma, X.; Dietrich, C.R.; Hu, H.-C.; Zhang, G.; Liu, Z.; Zheng, J.; Wang, G.; et al. The Maize glossy13 Gene, cloned via BSR-Seq and Seq-Walking Encodes a Putative ABC Transporter Required for the Normal Accumulation of Epicuticular Waxes. PLoS ONE 2013, 8, e82333. [Google Scholar] [CrossRef] [PubMed]
- Tulloch, A.P.; Hoffman, L.L. Epicuticular waxes of Secale cereale and Triticale hexaploide leaves. Phytochemistry 1974, 13, 2535–2540. [Google Scholar] [CrossRef]
- Korzun, V.; Malyshev, S.; Voylokov, A.; Börner, A. RFLP-based mapping of three mutant loci in rye (Secale cereale L.) and their relation to homoeologous loci within the Gramineae. Theor. Appl. Genet. 1997, 95, 468–473. [Google Scholar] [CrossRef]
- Malyshev, S.; Korzun, V.; Voylokov, A.; Smirnov, V.; Börner, A. Linkage mapping of mutant loci in rye (Secale cereale L.). Theor. Appl. Genet. 2001, 103, 70–74. [Google Scholar] [CrossRef]
- Lawrence, C.J.; Dong, Q.; Polacco, M.L.; Seigfried, T.E.; Brendel, V. MaizeGDB, the community database for maize genetics and genomics. Nucleic Acids Res. 2004, 32, 393D–397. [Google Scholar] [CrossRef] [PubMed]
- Milczarski, P.; Bolibok-Brągoszewska, H.; Myśków, B.; Stojałowski, S.; Heller-Uszyńska, K.; Góralska, M.; Brągoszewski, P.; Uszyński, G.; Kilian, A.; Rakoczy-Trojanowska, M. A High-Density Consensus Map of Rye (Secale cereale L.) Based on DArT Markers. PLoS ONE 2011, 6, e28495. [Google Scholar] [CrossRef]
- Gawroński, P.; Pawełkowicz, M.; Tofil, K.; Uszyński, G.; Sharifova, S.; Ahluwalia, S.; Tyrka, M.; Wędzony, M.; Kilian, A.; Bolibok-Brągoszewska, H. DArT Markers Effectively Target Gene Space in the Rye Genome. Front. Plant Sci. 2016, 7. [Google Scholar] [CrossRef]
- Hussain, W.; Baenziger, P.S.; Belamkar, V.; Guttieri, M.J.; Venegas, J.P.; Easterly, A.; Sallam, A.; Poland, J. Genotyping-by-Sequencing Derived High-Density Linkage Map and its Application to QTL Mapping of Flag Leaf Traits in Bread Wheat. Sci. Rep. 2017, 7, 16394. [Google Scholar] [CrossRef]
- Borzęcka, E.; Hawliczek, A.; Bolibok, L.; Gawroński, P.; Tofil, K.; Milczarski, P.; Stojałowski, S.; Myśków, B.; Targońska-Karasek, M.; Grądzielewska, A.; et al. Effective BAC clone anchoring with genotyping-by-sequencing and Diversity Arrays Technology in a large genome cereal rye. Sci. Rep. 2018, 8, 8428. [Google Scholar] [CrossRef]
- Yao, X.; Wu, K.; Yao, Y.; Bai, Y.; Ye, J.; Chi, D. Construction of a high-density genetic map: Genotyping by sequencing (GBS) to map purple seed coat color (Psc) in hulless barley. Hereditas 2018, 155, 37. [Google Scholar] [CrossRef]
- Gutierrez-Gonzalez, J.J.; Mascher, M.; Poland, J.; Muehlbauer, G.J. Dense genotyping-by-sequencing linkage maps of two Synthetic W7984×Opata reference populations provide insights into wheat structural diversity. Sci. Rep. 2019, 9, 1–15. [Google Scholar] [CrossRef]
- Ferreira, A.; Da Silva, M.F.; Silva, L.D.C.E.; Cruz, C.D. Estimating the effects of population size and type on the accuracy of genetic maps. Genet. Mol. Biol. 2006, 29, 187–192. [Google Scholar] [CrossRef]
- Kumar, J.; Pratap, A.; Solanki, R.K. Basics of Molecular Genetic Mapping and QTL Analysis in Plants. Adv. Biotechnol. 2010, 35–52. [Google Scholar] [CrossRef]
- Devos, K.M.; Atkinson, M.D.; Chinoy, C.N.; Francis, H.A.; Harcourt, R.L.; Koebner, R.M.D.; Liu, C.J.; Masojć, P.; Xie, D.X.; Gale, M.D. Chromosomal rearrangements in the rye genome relative to that of wheat. Theor. Appl. Genet. 1993, 85, 673–680. [Google Scholar] [CrossRef] [PubMed]
- Martis, M.M.; Zhou, R.; Haseneyer, G.; Schmutzer, T.; Vrána, J.; Kubaláková, M.; König, S.; Kugler, K.G.; Scholz, U.; Hackauf, B.; et al. Reticulate Evolution of the Rye Genome[W][OPEN]. Plant Cell 2013, 25, 3685–3698. [Google Scholar] [CrossRef]
- Milczarski, P.; Hanek, M.; Tyrka, M.; Stojałowski, S. The application of GBS markers for extending the dense genetic map of rye (Secale cereale L.) and the localization of the Rfc1 gene restoring male fertility in plants with the C source of sterility-inducing cytoplasm. J. Appl. Genet. 2016, 57, 439–451. [Google Scholar] [CrossRef]
- Bauer, E.; Schmutzer, T.; Barilar, I.; Mascher, M.; Gundlach, H.; Martis, M.M.; Twardziok, S.O.; Hackauf, B.; Gordillo, A.; Wilde, P.; et al. Towards a whole-genome sequence for rye (Secale cereale L.). Plant J. 2017, 89, 853–869. [Google Scholar] [CrossRef]
- Hackauf, B.; Rudd, S.; Van Der Voort, J.R.; Miedaner, T.; Wehling, P. Comparative mapping of DNA sequences in rye (Secale cereale L.) in relation to the rice genome. Theor. Appl. Genet. 2008, 118, 371–384. [Google Scholar] [CrossRef]
- Korzun, V.; Melz, G.; Börner, A. RFLP mapping of the dwarfing (Ddw1) and hairy peduncle (Hp) genes on chromosome 5 of rye (Secale cereale L.). Theor. Appl. Genet. 1996, 92, 1073–1077. [Google Scholar] [CrossRef]
- Stojałowski, S.; Myśeków, B.; Hanek, M. Phenotypic effect and chromosomal localization of Ddw3, the dominant dwarfing gene in rye (Secale cereale L.). Euphytica 2014, 201, 43–52. [Google Scholar] [CrossRef][Green Version]
- Bienias, A.; Góralska, M.; Masojć, P.; Milczarski, P.; Myśków, B. The GAMYB gene in rye: Sequence, polymorphisms, map location, allele-specific markers, and relationship with α-amylase activity. BMC Genom. 2020, 21, 1–15. [Google Scholar] [CrossRef] [PubMed]
- Miedaner, T.; Glass, C.; Dreyer, F.; Wilde, P.; Wortmann, H.; Geiger, H.H. Mapping of genes for male fertility restoration in ‘Pampa’ CMS winter rye (Secale cereale L.). Theor. Appl. Genet. 2000, 101, 1226–1233. [Google Scholar] [CrossRef]
- Bednarek, P.T.; Lewandowska, R.; Kubicka, H.; Masojć, P. Linkage groups and the indirect chromosome location of cms-P-linked AFLPs. Cell Mol. Biol. Lett. 2002, 7, 721–736. [Google Scholar] [PubMed]
- Stojałowski, S.; Jaciubek, M.; Masojć, P. Rye SCAR markers for male fertility restoration in the P cytoplasm are also applicable to marker-assisted selection in the C cytoplasm. J. Appl. Genet. 2005, 46, 371–373. [Google Scholar] [PubMed]
- Stojałowski, S.; Milczarski, P.; Hanek, M.; Bolibok-Brągoszewska, H.; Myśków, B.; Kilian, A.; Rakoczy-Trojanowska, M. DArT markers tightly linked with the Rfc1 gene controlling restoration of male fertility in the CMS-C system in cultivated rye (Secale cereale L.). J. Appl. Genet. 2011, 52, 313–318. [Google Scholar] [CrossRef] [PubMed]
- Hackauf, B.; Bauer, E.; Korzun, V.; Miedaner, T. Fine mapping of the restorer gene Rfp3 from an Iranian primitive rye (Secale cereale L.). Theor. Appl. Genet. 2017, 108, 1149–1189. [Google Scholar] [CrossRef] [PubMed]
- Mago, R.; Miah, H.; Lawrence, G.; Wellings, C.; Spielmeyer, W.; Bariana, H.; McIntosh, R.; Pryor, A.; Ellis, J. High-resolution mapping and mutation analysis separate the rust resistance genes Sr31, Lr26 and Yr9 on the short arm of rye chromosome 1. Theor. Appl. Genet. 2005, 112, 41–50. [Google Scholar] [CrossRef]
- Święcka, S.; Berdzik, M.; Myśeków, B. Genetic mapping of the ScHd1 gene in rye and an assessment of its relationship with earliness per se and plant morphology. J. Appl. Genet. 2014, 55, 469–473. [Google Scholar] [CrossRef][Green Version]
- Börner, A.; Korzun, V.; Voylokov, A.; Worland, A.; Weber, W. Genetic mapping of quantitative trait loci in rye (Secale cereale L.). Euphytica 2000, 116, 203–209. [Google Scholar] [CrossRef]
- Miedaner, T.; Koch, S.; Seggl, A.; Schmiedchen, B.; Wilde, P. Quantitative genetic parameters for selection of biomass yield in hybrid rye. Plant. Breed. 2011, 131, 100–103. [Google Scholar] [CrossRef]
- Myśków, B.; Hanek, M.; Banek-Tabor, A.; Maciorowski, R.; Stojałowski, S. The application of high-density genetic maps of rye for the detection of QTLs controlling morphological traits. J. Appl. Genet. 2013, 55, 15–26. [Google Scholar] [CrossRef]
- Hackauf, B.; Haffke, S.; Fromme, F.J.; Roux, S.R.; Kusterer, B.; Musmann, D.; Kilian, A.; Miedaner, T. QTL mapping and comparative genome analysis of agronomic traits including grain yield in winter rye. Theor. Appl. Genet. 2017, 130, 1801–1817. [Google Scholar] [CrossRef] [PubMed]
- Myśków, B.; Stojałowski, S.; Milczarski, P.; Masojć, P. Mapping of sequence-specific markers and loci controlling preharvest sprouting and alpha-amylase activity in rye (Secale cereale L.) on the genetic map of an F2(S120×S76) population. J. Appl. Genet. 2010, 51, 283–287. [Google Scholar] [CrossRef] [PubMed]
- Myśeków, B.; Stojałowski, S.; Łań, A.; Bolibok-Brągoszewska, H.; Rakoczy-Trojanowska, M.; Kilian, A. Detection of the quantitative trait loci for α-amylase activity on a high-density genetic map of rye and comparison of their localization to loci controlling preharvest sprouting and earliness. Mol. Breed. 2011, 30, 367–376. [Google Scholar] [CrossRef] [PubMed]
- Milczarski, P.; Masojć, P.; Krajewski, P.; Stochmal, A.; Kowalczyk, M.; Angelov, M.; Ivanova, V.; Schollenberger, M.; Wakuliński, W.; Banaszak, Z.; et al. QTL mapping for benzoxazinoid content, preharvest sprouting, α-amylase activity, and leaf rust resistance in rye (Secale cereale L.). PLoS ONE 2017, 12, e0189912. [Google Scholar] [CrossRef]
- Schrider, D.R.; Kern, A.D. Supervised Machine Learning for Population Genetics: A New Paradigm. Trends Genet. 2018, 34, 301–312. [Google Scholar] [CrossRef]
- Ornella, L.; Cervigni, G.; Tapia, E. Applications of Machine Learning for Maize Breeding. In Crop Stress and its Management: Perspectives and Strategies; Venkateswarlu, B., Shanker, A.K., Shanker, C., Eds.; Springer: New York, NY, USA, 2013; pp. 163–192. [Google Scholar]
- González-Camacho, J.M.; Ornella, L.; Pérez-Rodríguez, P.; Gianola, D.; Dreisigacker, S.; Crossa, J. Applications of Machine Learning Methods to Genomic Selection in Breeding Wheat for Rust Resistance. Plant Genome 2018, 11, 170104. [Google Scholar] [CrossRef]
- Parmley, K.A.; Higgins, R.H.; Ganapathysubramanian, B.; Sarkar, S.; Singh, A. Machine Learning Approach for Prescriptive Plant Breeding. Sci. Rep. 2019, 9, 1–12. [Google Scholar] [CrossRef]
- Verrier, P.J.; Bird, D.A.; Burla, B.; Dassa, E.; Forestier, C.; Geißler, M.; Klein, M.; Kolukisaoglu, Ü.; Lee, Y.; Martinoia, E.; et al. Plant ABC proteins—a unified nomenclature and updated inventory. Trends Plant. Sci. 2008, 13, 151–159. [Google Scholar] [CrossRef]
- Andolfo, G.; Ruocco, M.; Di Donato, A.; Frusciante, L.; Lorito, M.; Scala, F.; Ercolano, M.R. Genetic variability and evolutionary diversification of membrane ABC transporters in plants. BMC Plant. Biol. 2015, 15, 51. [Google Scholar] [CrossRef]
- Borghi, L.; Kang, J.; Francisco, R.D.B. Filling the Gap: Functional Clustering of ABC Proteins for the Investigation of Hormonal Transport in planta. Front. Plant. Sci. 2019, 10. [Google Scholar] [CrossRef]
- Luo, B.; Xue, X.-Y.; Hu, W.-L.; Wang, L.-J.; Chen, X.-Y. An ABC Transporter Gene of Arabidopsis thaliana, AtWBC11, is Involved in Cuticle Development and Prevention of Organ Fusion. Plant. Cell Physiol. 2007, 48, 1790–1802. [Google Scholar] [CrossRef] [PubMed]
- Ukitsu, H.; Kuromori, T.; Toyooka, K.; Goto, Y.; Matsuoka, K.; Sakuradani, E.; Shimizu, S.; Kamiya, A.; Imura, Y.; Yuguchi, M.; et al. Cytological and Biochemical Analysis of COF1, an Arabidopsis Mutant of an ABC Transporter Gene. Plant. Cell Physiol. 2007, 48, 1524–1533. [Google Scholar] [CrossRef] [PubMed]
- McFarlane, H.E.; Shin, J.J.; Bird, D.A.; Samuels, A.L. Arabidopsis ABCG Transporters, Which Are Required for Export of Diverse Cuticular Lipids, Dimerize in Different Combinations. Plant. Cell 2010, 22, 3066–3075. [Google Scholar] [CrossRef] [PubMed]
- Banasiak, J.; Biała, W.; Staszków, A.; Swarcewicz, B.; Kępczyńska, E.; Figlerowicz, M.; Jasiński, M. A Medicago truncatula ABC transporter belonging to subfamily G modulates the level of isoflavonoids. J. Exp. Bot. 2013, 64, 1005–1015. [Google Scholar] [CrossRef]
- Wójcicka, A. Surface Waxes as a Plant Defense Barrier Towards Grain Aphid. Acta Biol. Cracoviensia S. Bot. 2015, 57, 95–103. [Google Scholar] [CrossRef]
- Dhanyalakshmi, K.H.; Soolanayakanahally, R.Y.; Rahman, T.; Tanino, K.T.; Nataraja, K.N. Leaf Cuticular Wax, a Trait for Multiple Stress Resistance in Crop Plants. In Abiotic and Biotic Stress in Plants; de Oliveira, B.A., Ed.; IntechOpen: London, UK, 2019. [Google Scholar] [CrossRef]
- Los, D.A.; Murata, N. Structure and expression of fatty acid desaturases. Biochim. et Biophys. Acta (BBA) Lipids Lipid Metab. 1998, 1394, 3–15. [Google Scholar] [CrossRef]
- Dong, C.-J.; Cao, N.; Zhang, Z.-G.; Shang, Q. Characterization of the Fatty Acid Desaturase Genes in Cucumber: Structure, Phylogeny, and Expression Patterns. PLoS ONE 2016, 11, e0149917. [Google Scholar] [CrossRef]
- Feng, J.; Dong, Y.; Liu, W.; He, Q.; Daud, M.K.; Chen, J.; Zhu, S. Genome-wide identification of membrane-bound fatty acid desaturase genes in Gossypium hirsutum and their expressions during abiotic stress. Sci. Rep. 2017, 7, srep45711. [Google Scholar] [CrossRef]
- Zhiguo, E.; Chen, C.; Yang, J.; Tong, H.; Li, T.; Wang, L.; Chen, H. Genome-wide analysis of fatty acid desaturase genes in rice (Oryza sativa L.). Sci. Rep. 2019, 9, 1–11. [Google Scholar] [CrossRef]
- Wang, Y.H.; Irving, H.R. Developing a model of plant hormone interactions. Plant. Signal. Behav. 2011, 6, 494–500. [Google Scholar] [CrossRef] [PubMed]
- Sadura, I.; Janeczko, A. Physiological and molecular mechanisms of brassinosteroid-induced tolerance to high and low temperature in plants. Biol. Plant 2018, 62, 601–616. [Google Scholar] [CrossRef]
- The International Wheat Genome Sequencing Consortium (IWGSC); Appels, R.; Eversole, K.; Stein, N.; Feuillet, C.; Keller, B.; Rogers, J.; Pozniak, C.J.; Choulet, F.; Distelfel, D.A.; et al. Shifting the limits in wheat research and breeding using a fully annotated reference genome. Science 2018, 361, eaar7191. [Google Scholar] [CrossRef] [PubMed]
- Rabanus-Wallace, M.T.; Hackauf, B.; Mascher, M.; Lux, T.; Wicker, T.; Gundlach, H.; Báez, M.; Houben, A.; Mayer, K.F.X.; Guo, L.; et al. Chromosome-scale genome assembly provides insights into rye biology, evolution, and agronomic potential. bioRxiv 2019. [Google Scholar] [CrossRef]
- Braun, E.-M.; Tsvetkova, N.; Rotter, B.; Siekmann, D.; Schwefel, K.; Krezdorn, N.; Plieske, J.; Winter, P.; Melz, G.; Voylokov, A.V.; et al. Gene Expression Profiling and Fine Mapping Identifies a Gibberellin 2-Oxidase Gene Co-segregating With the Dominant Dwarfing Gene Ddw1 in Rye (Secale cereale L.). Front. Plant. Sci. 2019, 10. [Google Scholar] [CrossRef]
- Hall, T.A. BioEdit: A user-friendly biological sequence alignment editor and analysis program for Windows 95/98/NT. Nucl Acids Symp. Ser. 1999, 41, 95–98. [Google Scholar]
- Untergasser, A.; Cutcutache, I.; Koressaar, T.; Ye, J.; Faircloth, B.C.; Remm, M.; Rozen, S.G. Primer3—new capabilities and interfaces. Nucleic Acids Res. 2012, 40, e115. [Google Scholar] [CrossRef]
- Varoquaux, G.; Buitinck, L.; Louppe, G.; Grisel, O.; Pedregosa, F.; Mueller, A. Scikit-learn. GetMobile Mob. Comput. Commun. 2015, 19, 29–33. [Google Scholar] [CrossRef]


| Trait | Generation | Mean | Standard Deviation | Sample Number | t-Statistic | Degrees of Freedom (df) | Probability Level (p-Value) | |||
|---|---|---|---|---|---|---|---|---|---|---|
| 1 | 2 | 1 | 2 | 1 | 2 | |||||
| PH * | F2 | 116.10 | 127.07 | 29.10 | 26.34 | 200 | 68 | −2.75 | 266 | 0.006 |
| F3 | 96.40 | 102.25 | 26.19 | 28.44 | 248 | 128 | −1.99 | 374 | 0.047 | |
| TN | F2 | 3.83 | 3.38 | 2.11 | 1.60 | 202 | 69 | 1.62 | 269 | 0.106 |
| F3 | 3.53 | 3.36 | 1.88 | 1.65 | 248 | 128 | 0.88 | 374 | 0.380 | |
| SL | F2 | 10.45 | 10.21 | 1.74 | 1.72 | 196 | 67 | 0.97 | 261 | 0.333 |
| F3 | 9.27 | 9.23 | 1.40 | 1.29 | 245 | 126 | 0.30 | 369 | 0.768 | |
| SNPS * | F2 | 32.84 | 34.27 | 4.84 | 4.97 | 196 | 67 | −2.07 | 261 | 0.040 |
| F3 | 30.75 | 32.27 | 4.32 | 3.79 | 245 | 126 | −3.34 | 369 | 0.001 | |
| CT * | F2 | 31.84 | 33.93 | 4.54 | 4.46 | 196 | 67 | −3.27 | 261 | 0.001 |
| F3 | 33.41 | 35.34 | 3.73 | 4.38 | 245 | 126 | −4.43 | 369 | 0.000 | |
| GNPS | F2 | 39.14 | 39.90 | 25.68 | 27.20 | 196 | 67 | −0.20 | 261 | 0.839 |
| F3 | 21.21 | 21.68 | 17.60 | 17.32 | 245 | 126 | −0.25 | 369 | 0.807 | |
| GWPS | F2 | 1.36 | 1.36 | 0.60 | 0.69 | 159 | 55 | −0.04 | 212 | 0.965 |
| F3 | 0.64 | 0.57 | 0.39 | 0.41 | 182 | 106 | 1.41 | 286 | 0.160 | |
| TGW | F2 | 28.16 | 27.41 | 6.43 | 7.07 | 159 | 55 | 0.74 | 212 | 0.463 |
| F3 | 22.21 | 21.80 | 6.72 | 6.21 | 182 | 106 | 0.51 | 286 | 0.611 | |
| FD * | F3 | 28.61 | 29.01 | 0.87 | 0.89 | 133 | 50 | −2.73 | 181 | 0.007 |
| Silico | SNP | Total | |
|---|---|---|---|
| incomplete data | 447 | 2914 | 3361 |
| monomorphic | 2630 | 1267 | 3897 |
| polymorphic | 25812 | 6545 | 32357 |
| including | |||
| 1R * | 917 | 191 | 1108 |
| 2R * | 927 | 208 | 1135 |
| 3R * | 977 | 152 | 1129 |
| 4R * | 873 | 188 | 1061 |
| 5R * | 1086 | 169 | 1255 |
| 6R * | 1165 | 231 | 1396 |
| 7R * | 789 | 183 | 972 |
| mean per chromosome | 962 | 189 | 1151 |
| unassigned ** | 19152 | 5070 | 24222 |
| Marker | Assignment to 2R | LR Coefficient | Random Forest Coefficient | XGBoost Coefficient | Impact | Distance from Wax Locus [cM] | Annotation |
|---|---|---|---|---|---|---|---|
| 3591025 | A | 0.636 | 0.017 | 0.825 | 1.478 | 1.691 | - |
| 3593882 | B | 0.553 | 0.022 | 0.024 | 0.599 | unmapped | + |
| 3578307_27:A>G | B | 0.413 | 0.013 | 0.013 | 0.439 | 1.944 | - |
| 3889647 | A | 0.285 | 0.025 | 0.035 | 0.345 | 0.088 | + |
| 3908692_28:C>T | B | 0.315 | 0.014 | 0.008 | 0.337 | 1.097 | - |
| 3362575_18:C>T | B | 0.192 | 0.014 | 0.086 | 0.293 | 0.81 | + |
| 4485942_42:T>G | B | 0.192 | 0.002 | 0.069 | 0.263 | 0.86 | - |
| 3597393_10:T>G | B | 0.062 | 0.005 | 0.162 | 0.228 | unmapped | - |
| 3358122 | A | 0.162 | 0.014 | 0.019 | 0.195 | 7.162 | - |
| 3585843 | A | 0.169 | 0.015 | 0.01 | 0.193 | 2.056 | + |
| 3341848 | A | 0.064 | 0.002 | 0.002 | 0.067 | 6.917 | + |
| 4092788_55:G>A | B | 0.044 | 0.004 | 0.009 | 0.058 | 22.593 | + |
| 3750485 | B | 0.022 | 0.01 | 0.002 | 0.034 | unmapped | - |
| Marker | Description | Total Score | E Value | Identity | Accession |
|---|---|---|---|---|---|
| 3889647 1 | Predicted: glycine soja long-chain-fatty-acid--AMP ligase FadD28-like (LOC114378589), mRNA | 71 | 1E–09 | 90% | XM_028337226.1 |
| 3362575_18:C>T 1,2 | Predicted: Aegilops tauschii subsp. tauschii probably inactive leucine-rich repeat receptor-like protein kinase At5g06940 (LOC109756806), mRNA | 112 | 4E–22 | 96% | XM_020315644.1 |
| 3585843 1 | Predicted: Oryza brachyantha ABC transporter G family member 11-like (LOC102717335), mRNA | 128 | 2E–26 | 100% | XM_006652486.2 |
| Gene | Primer Pair | Sequence 5′–3′ |
|---|---|---|
| Actin (ACT) | ACT Fw | AAGATGGGACGTCTTGATGG |
| ACT Rev | GGATCTTCATCGGCATCACT | |
| Glyceraldehyde 3-phosphate dehydrogenase (GAPDH) | GAPDH Fw | AGATGCCCCTATGTTTGTGG |
| GAPDH Rev | GTGGTGCAGCTAGCATTTGA | |
| RNase L inhibitor (RLI) | RLI Fw | TTGAGCAACTCATGGACCAG |
| RLI Rev | TGCTTTCCAAGGCACAAACAT | |
| ATP binding cassette transporter, subfamily G (ABCG11-like) | ABCG_F_1297 | GGTGATGGATTCAAGGGGCA |
| ABCG_R_1382 | CGCGCGACATGTTGATGAAT |
© 2020 by the authors. Licensee MDPI, Basel, Switzerland. This article is an open access article distributed under the terms and conditions of the Creative Commons Attribution (CC BY) license (http://creativecommons.org/licenses/by/4.0/).
Share and Cite
Góralska, M.; Bińkowski, J.; Lenarczyk, N.; Bienias, A.; Grądzielewska, A.; Czyczyło-Mysza, I.; Kapłoniak, K.; Stojałowski, S.; Myśków, B. How Machine Learning Methods Helped Find Putative Rye Wax Genes Among GBS Data. Int. J. Mol. Sci. 2020, 21, 7501. https://doi.org/10.3390/ijms21207501
Góralska M, Bińkowski J, Lenarczyk N, Bienias A, Grądzielewska A, Czyczyło-Mysza I, Kapłoniak K, Stojałowski S, Myśków B. How Machine Learning Methods Helped Find Putative Rye Wax Genes Among GBS Data. International Journal of Molecular Sciences. 2020; 21(20):7501. https://doi.org/10.3390/ijms21207501
Chicago/Turabian StyleGóralska, Magdalena, Jan Bińkowski, Natalia Lenarczyk, Anna Bienias, Agnieszka Grądzielewska, Ilona Czyczyło-Mysza, Kamila Kapłoniak, Stefan Stojałowski, and Beata Myśków. 2020. "How Machine Learning Methods Helped Find Putative Rye Wax Genes Among GBS Data" International Journal of Molecular Sciences 21, no. 20: 7501. https://doi.org/10.3390/ijms21207501
APA StyleGóralska, M., Bińkowski, J., Lenarczyk, N., Bienias, A., Grądzielewska, A., Czyczyło-Mysza, I., Kapłoniak, K., Stojałowski, S., & Myśków, B. (2020). How Machine Learning Methods Helped Find Putative Rye Wax Genes Among GBS Data. International Journal of Molecular Sciences, 21(20), 7501. https://doi.org/10.3390/ijms21207501