Consumption of Wild Rice (Zizania latifolia) Prevents Metabolic Associated Fatty Liver Disease through the Modulation of the Gut Microbiota in Mice Model

Abstract
1. Introduction
2. Results
2.1. General Nutrition Composition
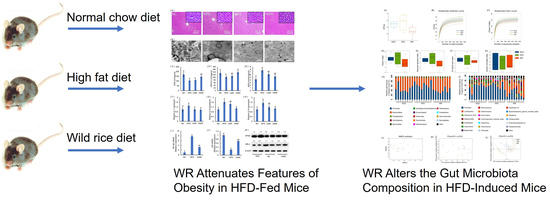
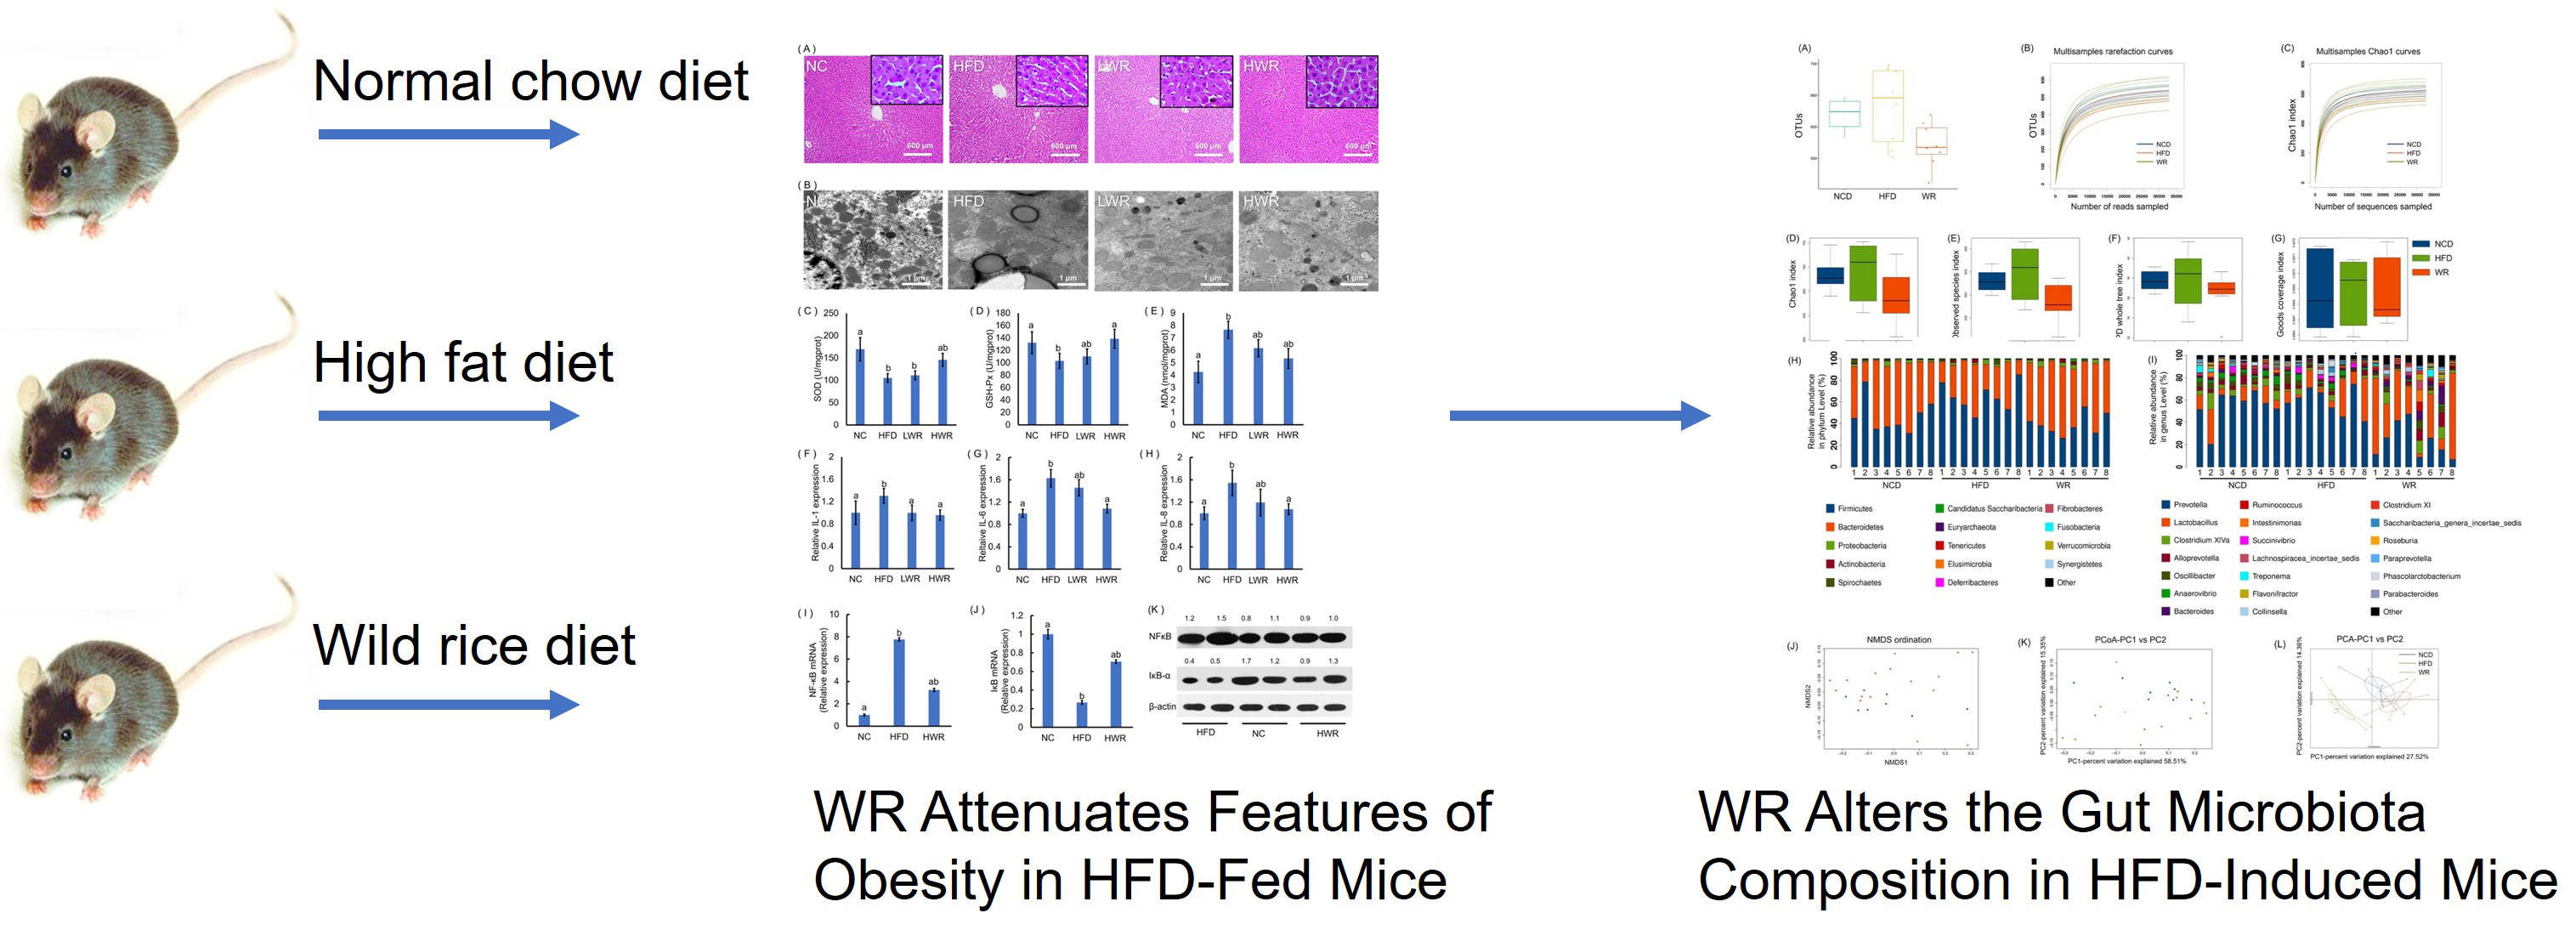
2.2. WR Attenuates Features of Obesity in HFD-Fed Mice
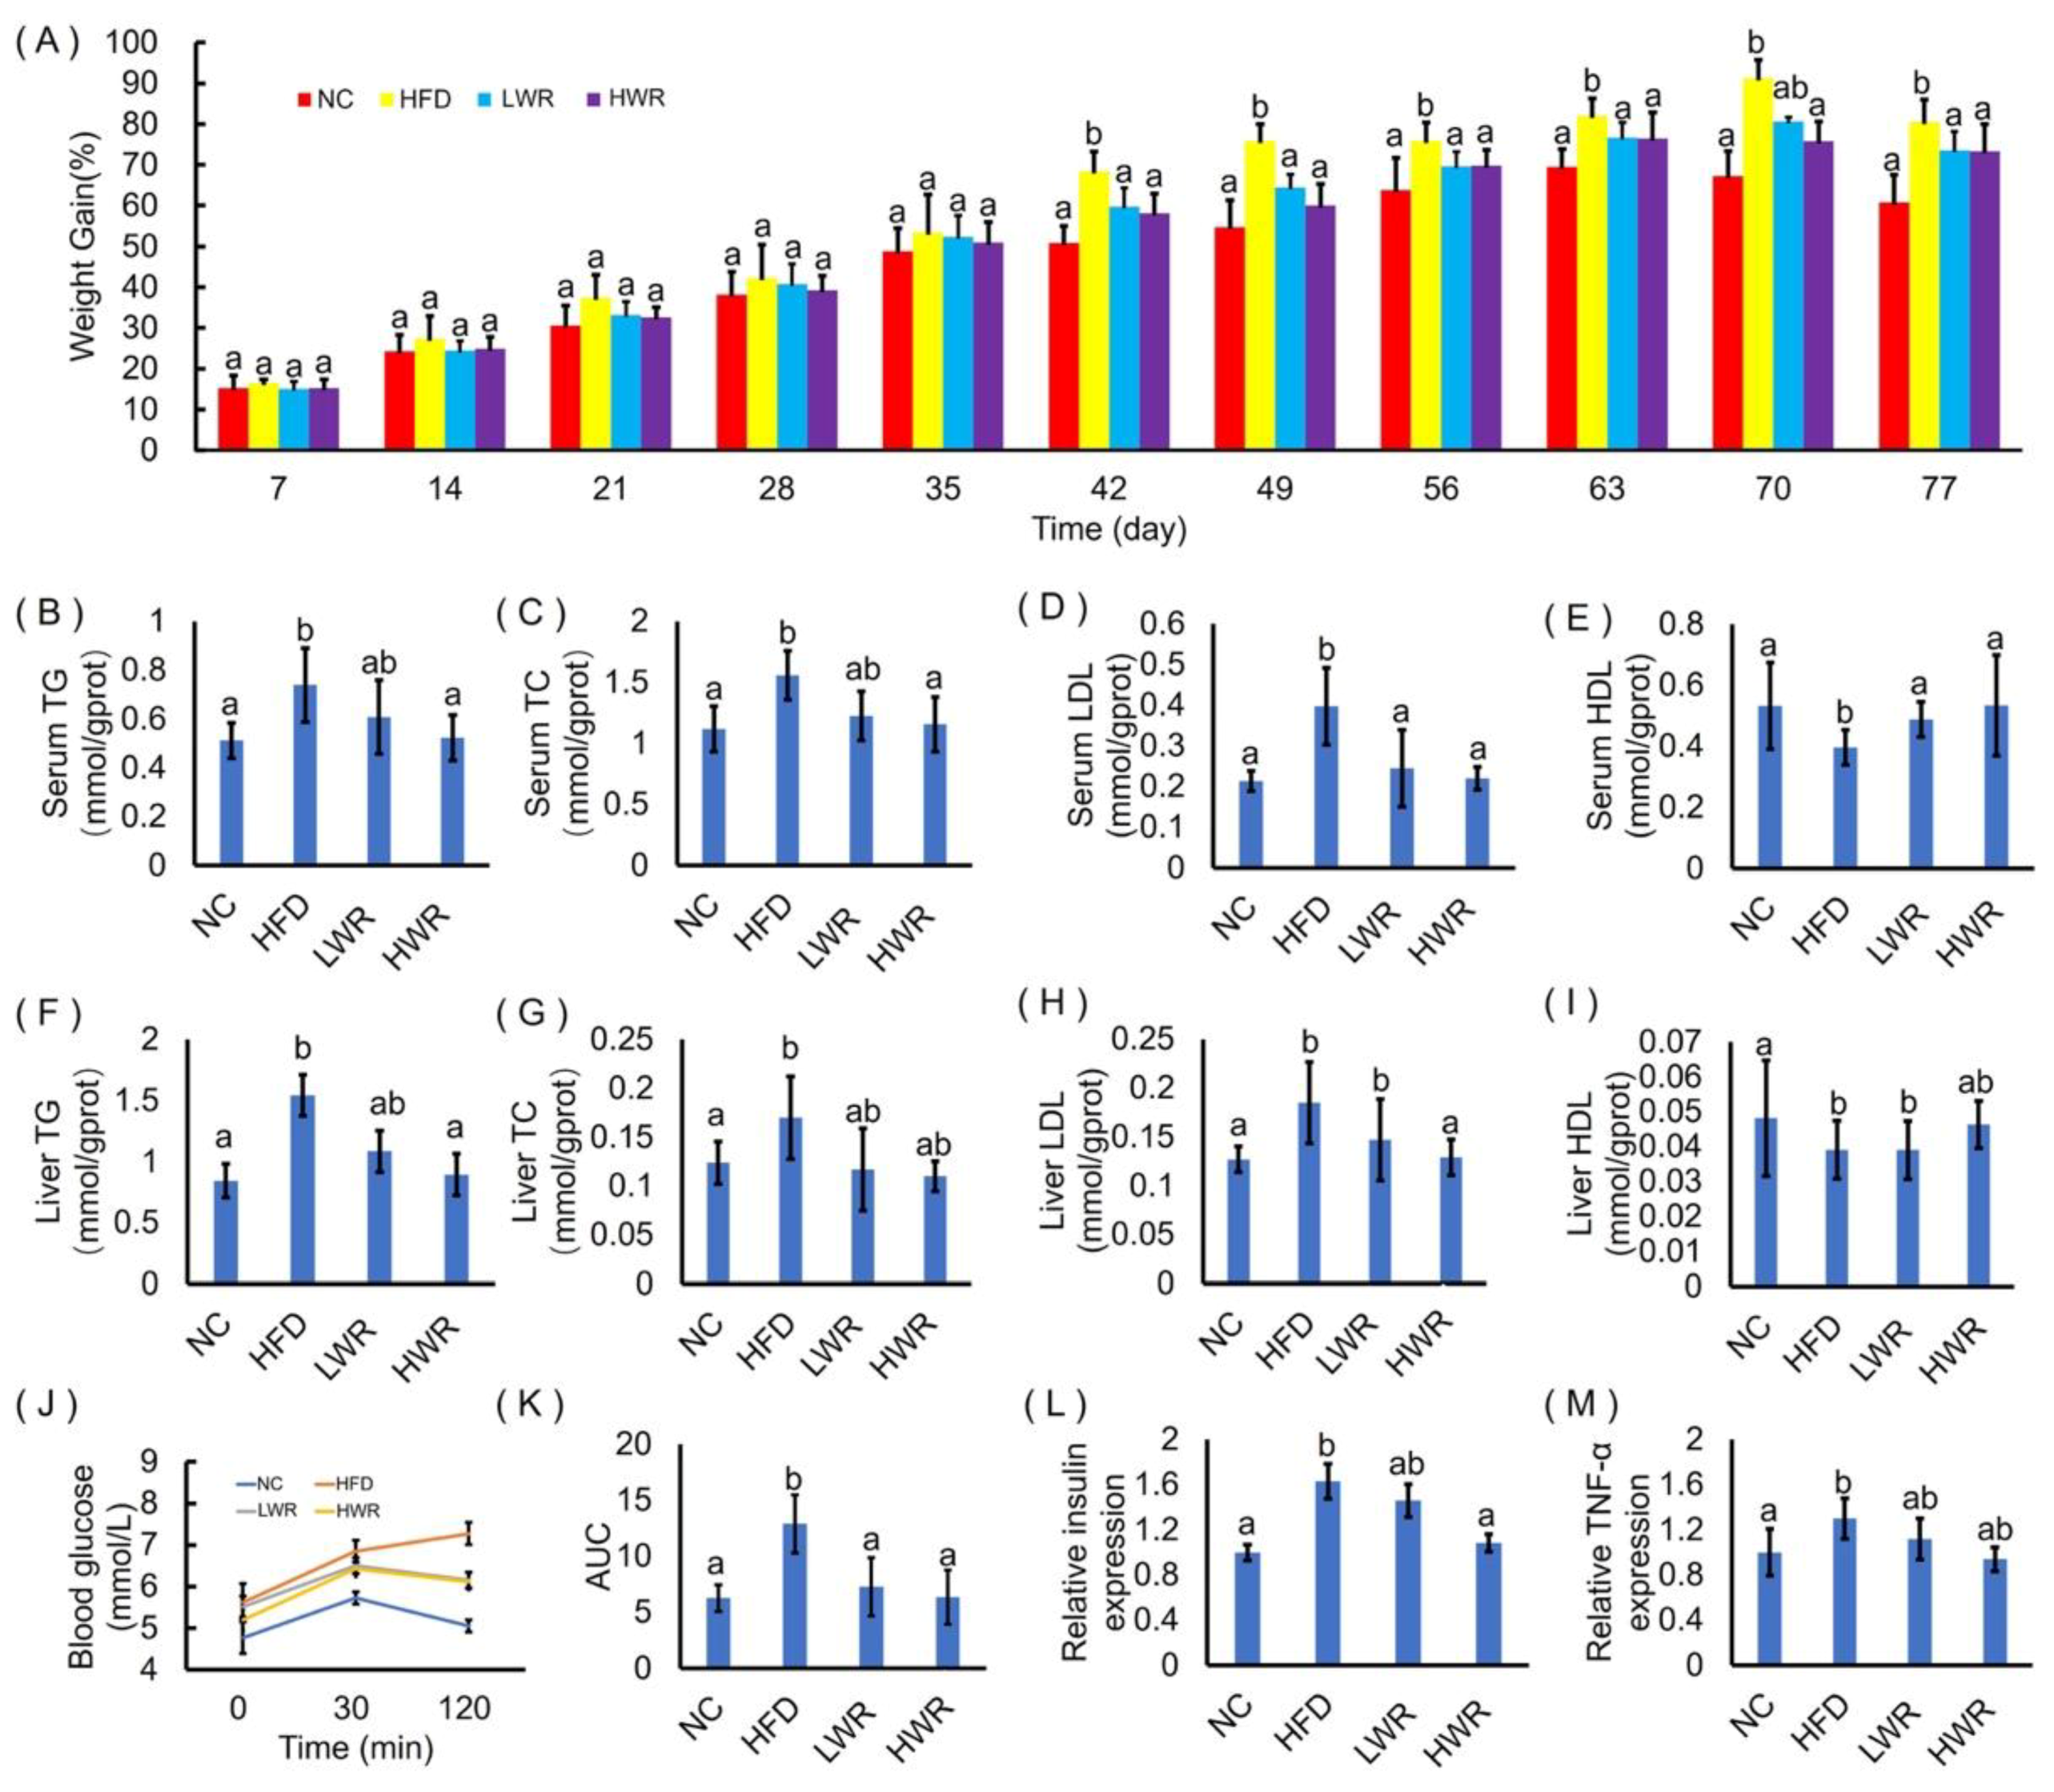
2.3. WR Prevents HFD-Induced Liver Steatosis, Oxidative Stress, and Systemic Low-Grade Inflammation
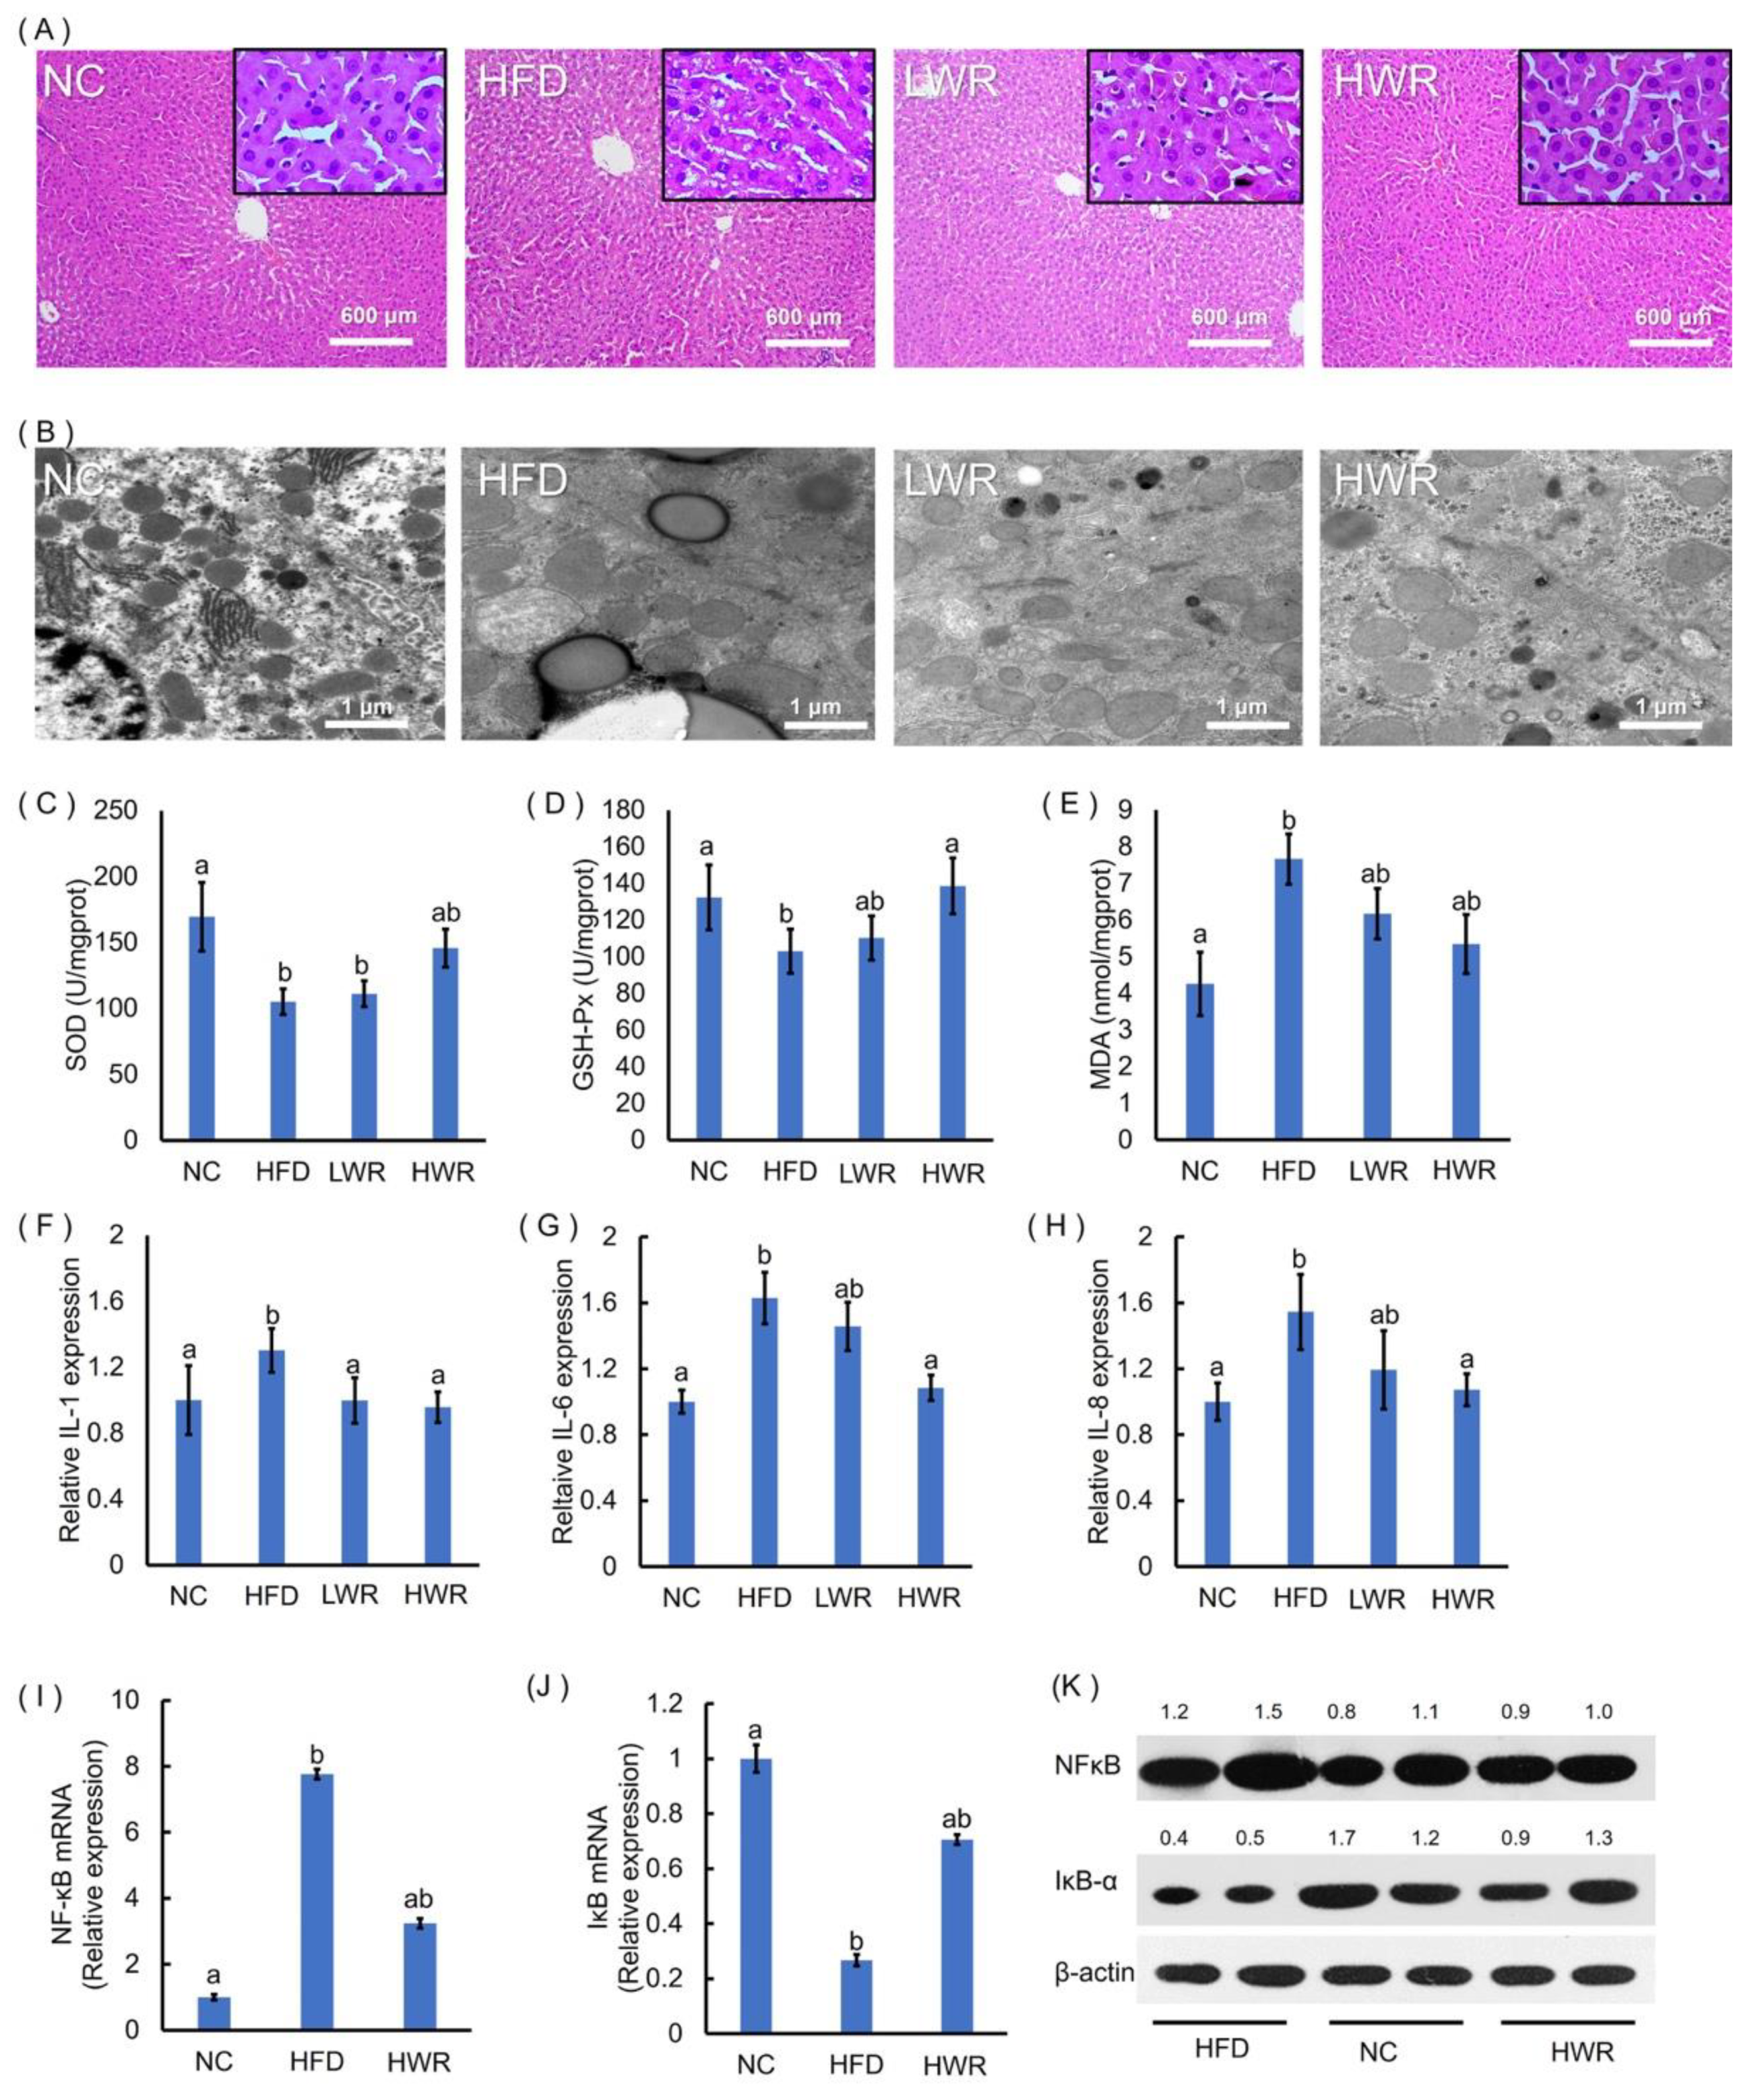
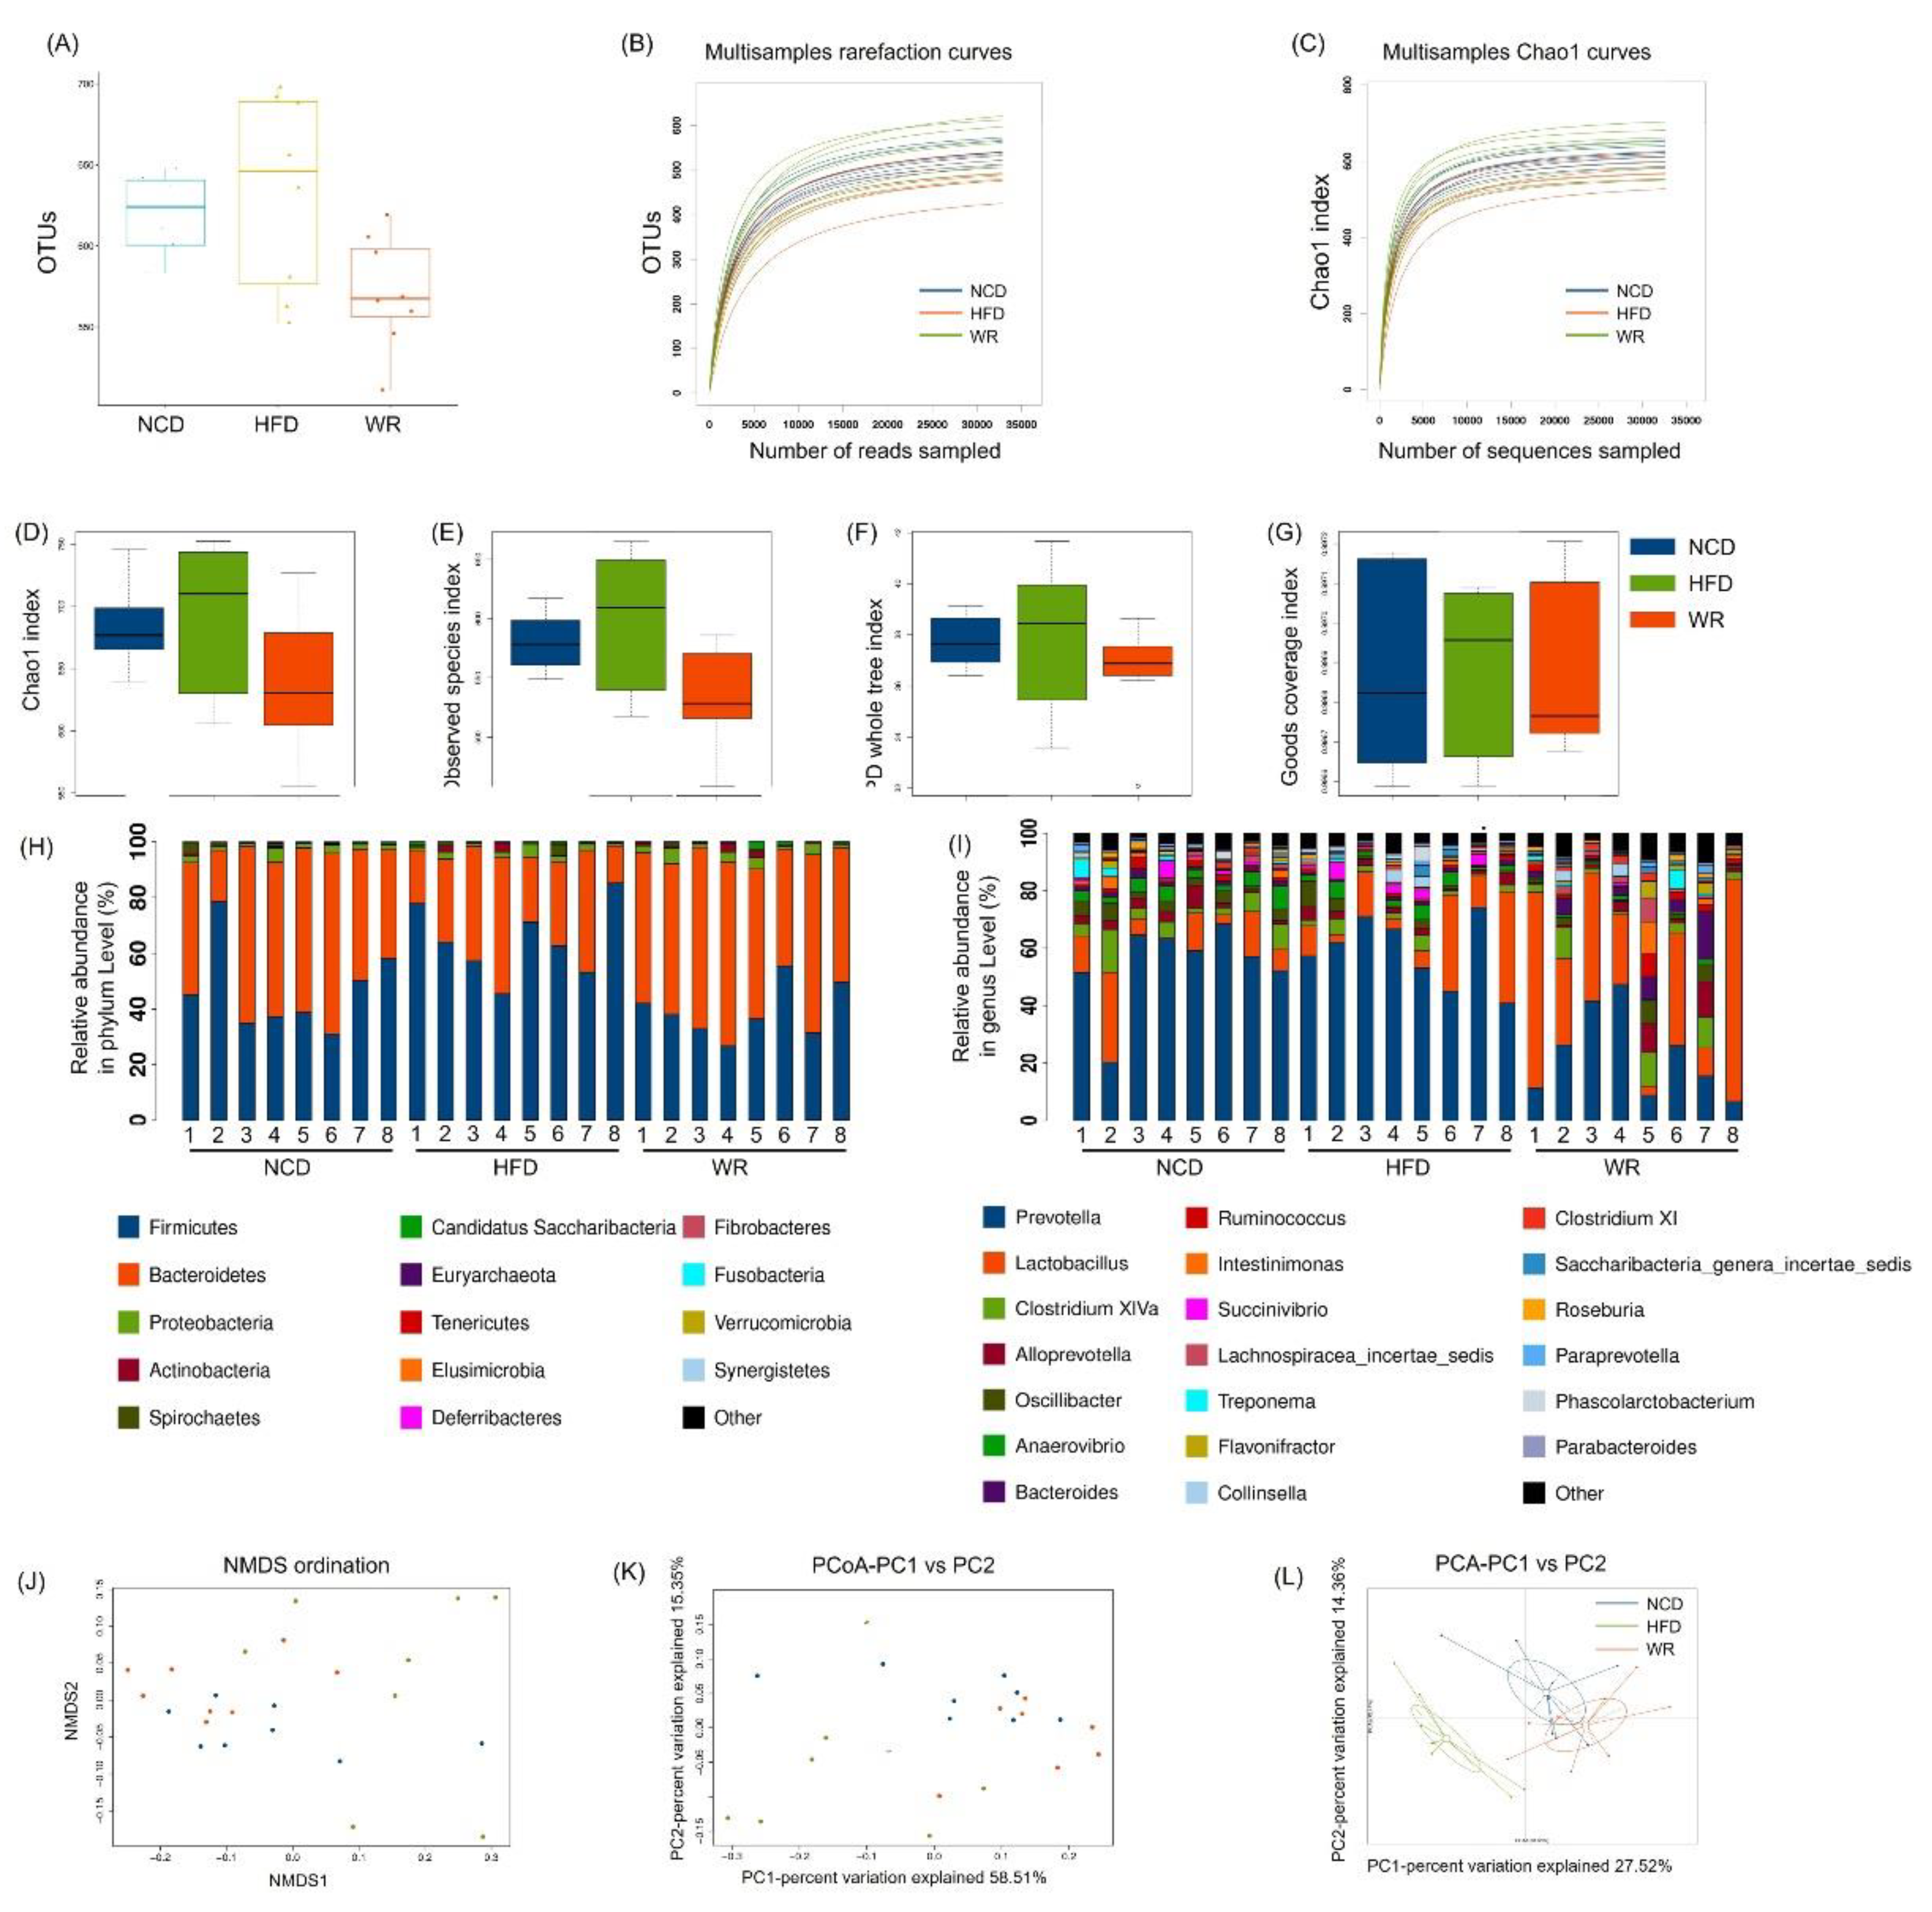
2.4. WR Alters the Gut Microbiota Composition in HFD-Induced Mice
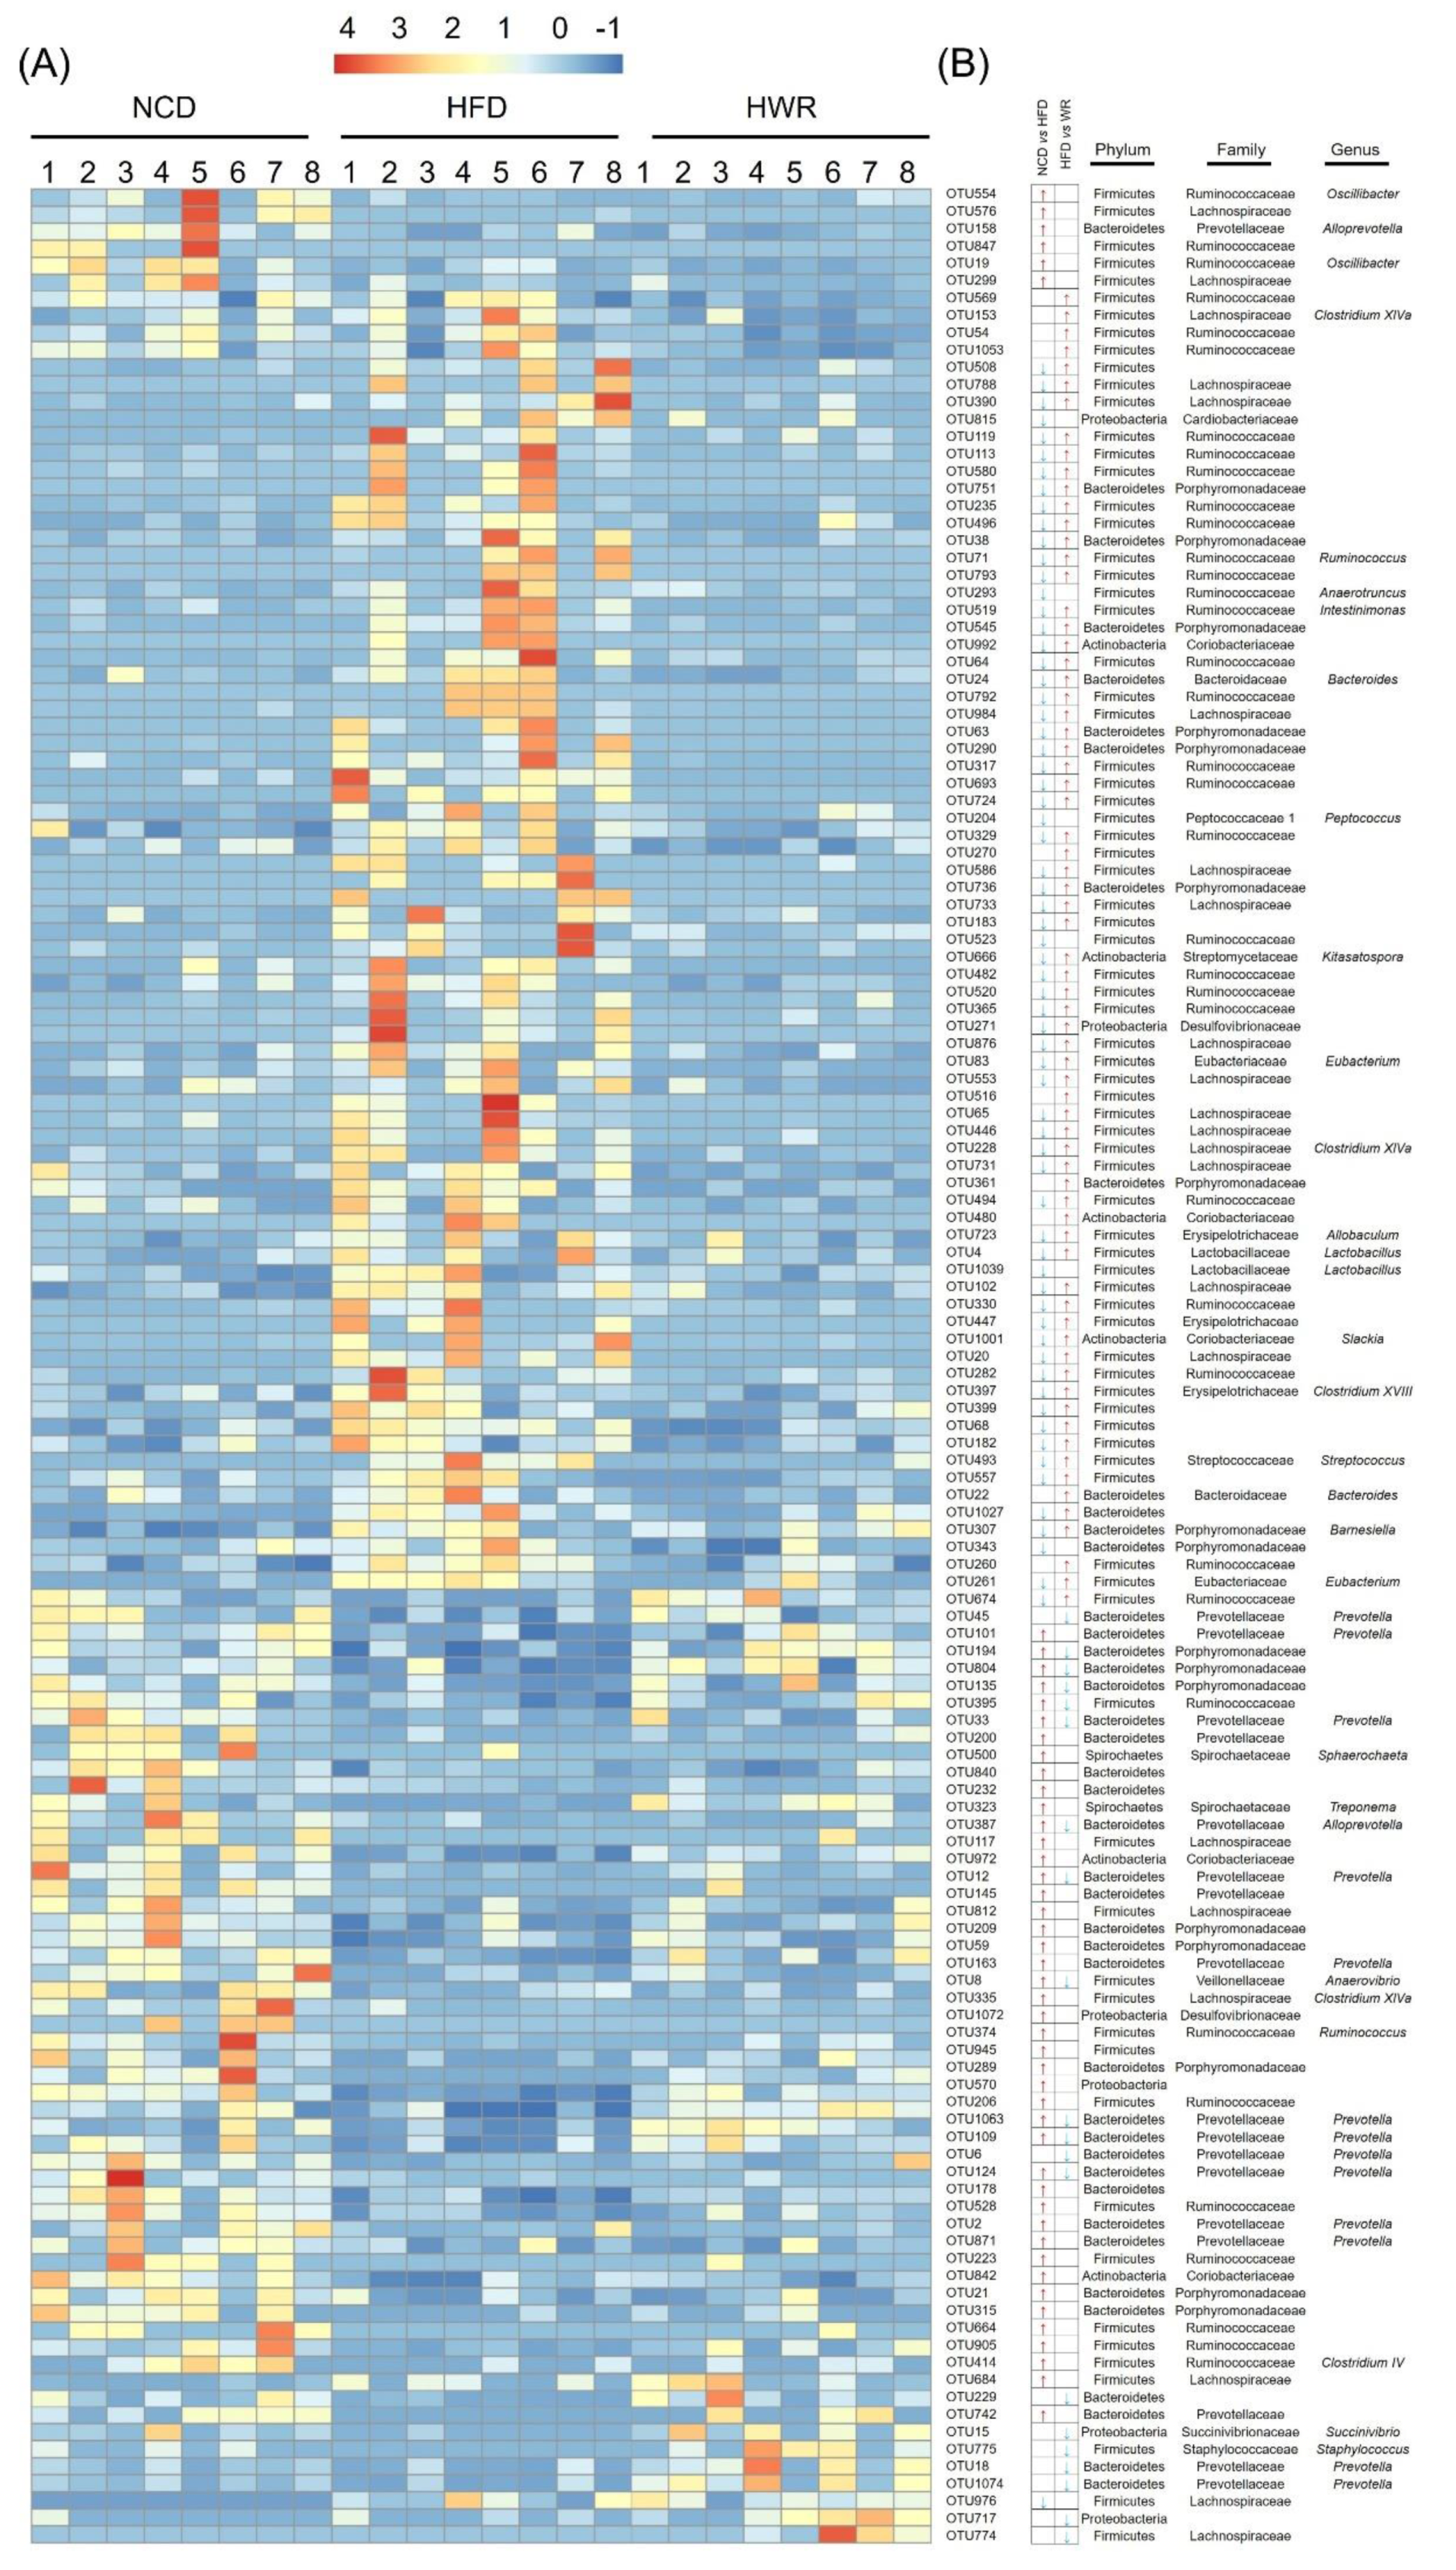
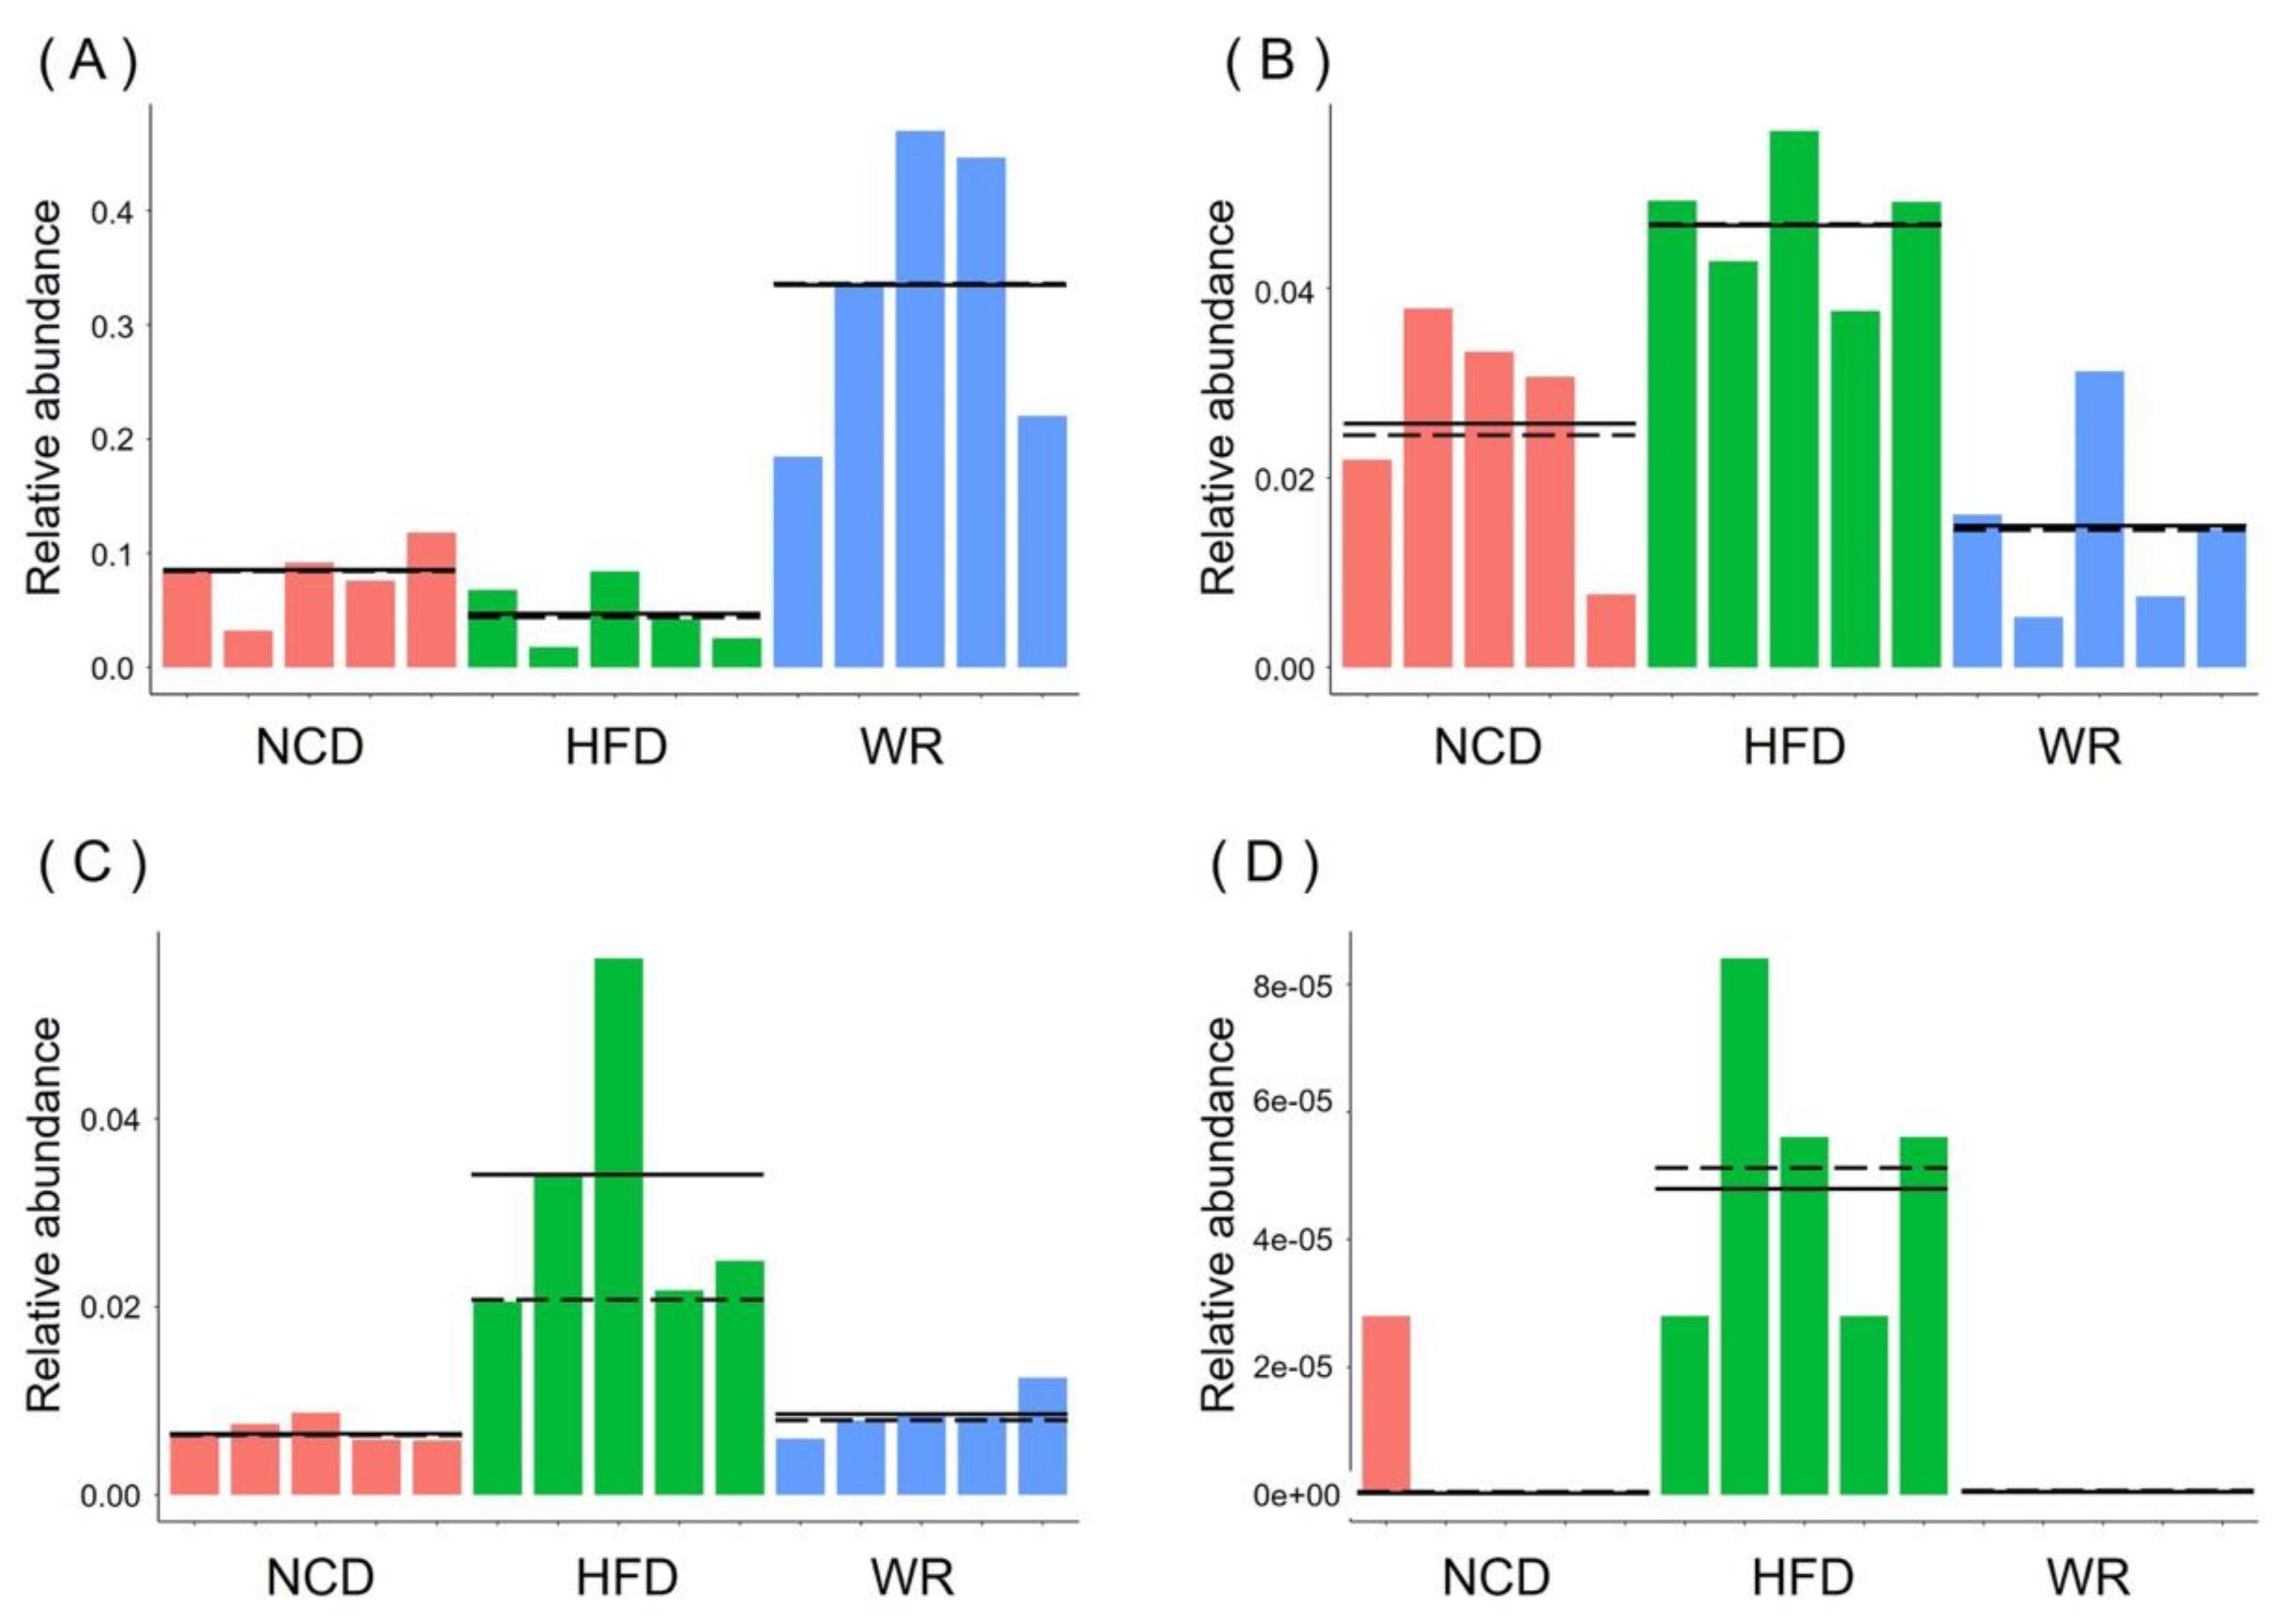
2.5. WR Modulates the Key Phylotypes of Gut Microbiota in HFD-Fed Mice
3. Discussion
4. Materials and Methods
4.1. Diet Preparation
4.2. Proximate Composition Analysis
4.3. Animal Trial
4.4. Biochemical Analysis
4.5. Oral Glucose Tolerance Tests
4.6. Liver Histopathology
4.7. Liver Ultrastructure Examination
4.8. Western Blot Analysis
4.9. Gene Expression Analysis
4.10. Gut Microbiota Analysis
4.11. Statistical Analysis
4.12. Accession Number
5. Conclusions
Supplementary Materials
Author Contributions
Funding
Conflicts of Interest
References
- Eslam, M.; Newsome, P.N.; Sarin, S.K.; Anstee, Q.M.; Targher, G.; Romero-Gomez, M.; Zelber-Sagi, S.; Wong, V.W.-S.; Dufour, J.F.; Schattenberg, J.M.; et al. A new definition for metabolic dysfunction-associated fatty liver disease: An international expert consensus statement. J. Hepatol. 2020, 73, 202–209. [Google Scholar] [CrossRef] [PubMed]
- Eslam, M.; Sanyal, A.J.; George, J. International Consensus Panel, MAFLD: A Consensus-Driven Proposed Nomenclature for Metabolic Associated Fatty Liver Disease. Gastroenterology 2020, 158, 1999–2014. [Google Scholar] [CrossRef] [PubMed]
- Ye, Q.; Zou, B.; Yeo, Y.H.; Li, J.; Huang, D.Q.; Wu, Y.; Yang, H.; Liu, C.; Kam, L.Y.; Tan, X.X.E.; et al. Global prevalence, incidence, and outcomes of non-obese or lean non-alcoholic fatty liver disease: A systematic review and meta-analysis. Lancet Gastroenterol. Hepatol. 2020, 8, 739–752. [Google Scholar] [CrossRef]
- Loomba, R.; Sanyal, A.J. The Global NAFLD Epidemic. Nat. Rev. Gastro. Hepat. 2013, 10, 686–690. [Google Scholar] [CrossRef]
- Younossi, Z.M.; Blissett, D.; Blissett, R.; Henry, L.; Stepanova, M.; Younossi, Y.; Racila, A.; Hunt, S.; Beckerman, R. The economic and clinical burden of nonalcoholic fatty liver disease in the United States and Europe. Hepatology 2016, 64, 1577–1586. [Google Scholar] [CrossRef]
- Spahis, S.; Alvarez, F.; Ahmed, N.; Dubois, J.; Jalbout, R.; Paganelli, M.; Grzywacz, K.; Delvin, E.; Peretti, N.; Levy, E. Non-alcoholic fatty liver disease severity and metabolic complications in obese children: Impact of omega-3 fatty acids. J. Nutr. Biochem. 2018, 58, 28–36. [Google Scholar] [CrossRef]
- Tilg, H.; Moschen, A.R.; Roden, M. NAFLD and diabetes mellitus. Nat. Rev. Gastroenterol. Hepatol. 2017, 14, 32–42. [Google Scholar] [CrossRef]
- Marcuccilli, M.; Chonchol, M. NAFLD and Chronic Kidney Disease. Int. J. Mol. Sci. 2016, 17, 562. [Google Scholar] [CrossRef]
- Safari, Z.; Gérard, P. The links between the gut microbiome and non-alcoholic fatty liver disease (NAFLD). Cell. Mol. Life Sci. 2019, 76, 1541–1558. [Google Scholar] [CrossRef]
- Esteve, E.; Ricart, W.; Fernándezreal, J.M. Gut microbiota interactions with obesity, insulin resistance and type 2 diabetes: Did gut microbiote co-evolve with insulin resistance? Curr. Opin. Clin. Nutr. 2011, 14, 483–490. [Google Scholar] [CrossRef]
- Chang, C.J.; Lin, C.S.; Lu, C.C.; Martel, J.; Ko, Y.F.; Ojcius, D.M.; Tseng, S.F.; Wu, T.R.; Chen, Y.Y.M.; Young, J.D. Corrigendum: Ganoderma lucidum reduces obesity in mice by modulating the composition of the gut microbiota. Nat. Commun. 2017, 6, 7489. [Google Scholar] [CrossRef] [PubMed]
- Méndez-Salazar, E.O.; Ortiz-López, M.G.; de los Ángeles Granados-Silvestre, M.; Palacios-Gonzalez, B.; Menjivar, M. Altered Gut Microbiota and Compositional Changes in Firmicutes and Proteobacteria in Mexican Undernourished and Obese Children. Front. Microbiol. 2018, 9, 2494. [Google Scholar] [CrossRef]
- Chen, F.; Esmaili, S.; Rogers, G.B.; Bugianesi, E.; Petta, S.; Marchesini, G.; Bayoumi, A.; Metwally, M.; Azardaryany, M.K.; Coulter, S.; et al. Lean NAFLD: A Distinct Entity Shaped by Differential Metabolic Adaptation. Hepatology 2020, 71, 1213–1227. [Google Scholar] [CrossRef] [PubMed]
- Milosevic, I.; Vujovic, A.; Barac, A.; Djelic, M.; Korac, M.; Radovanovic Spurnic, A.; Gmizic, I.; Stevanovic, O.; Djordjevic, V.; Lekic, N.; et al. Gut-Liver Axis, Gut Microbiota, and Its Modulation in the Management of Liver Diseases: A Review of the Literature. Int. J. Mol. Sci. 2019, 20, 395. [Google Scholar] [CrossRef] [PubMed]
- Leung, C.; Rivera, L.; Furness, J.B.; Angus, P.W. The role of the gut microbiota in NAFLD. Nat. Rev. Gastroenterol. Hepatol. 2016, 13, 412–425. [Google Scholar] [CrossRef] [PubMed]
- Kim, T.T.; Parajuli, N.; Sung, M.M.; Bairwa, S.C.; Levasseur, J.; Soltys, C.M.; Wishart, D.S.; Madsen, K.; Schertzer, J.D.; Jrb, D. Fecal transplant from resveratrol-fed donors improves glycaemia and cardiovascular features of the metabolic syndrome in mice. Am. J. Physiol. Endocrinol. Metab. 2018, 315, 511–519. [Google Scholar] [CrossRef]
- De Palma, G.; Lynch, M.D.; Lu, J.; Dang, V.T.; Deng, Y.; Jury, J.; Umeh, G.; Miranda, P.M.; Pastor, M.P.; Sidani, S. Transplantation of fecal microbiota from patients with irritable bowel syndrome alters gut function and behavior in recipient mice. Sci. Transl. Med. 2017, 9, eaaf6397. [Google Scholar] [CrossRef]
- Zhang, H.; Cao, P.; Agellon, L.B.; Zhai, C.-K. Wild rice (Zizania latifolia (Griseb) Turcz) improves the serum lipid profile and antioxidant status of rats fed with a high fat/cholesterol diet. Brit. J. Nutr. 2009, 102, 1723–1727. [Google Scholar] [CrossRef]
- Zhai, C.; Lu, C.; Zhang, X.; Sun, G.; Lorenz, K. Comparative study on nutritional value of Chinese and North American wild rice. Food Compos. Anal. 2001, 14, 371–382. [Google Scholar] [CrossRef]
- Moghadasian, M.H.; Zhao, R.; Ghazawwi, N.; Le, K.; Apea-Bah, F.B.; Beta, T.; Shen, G.X. Inhibitory effects of North American wild rice on monocyte adhesion and inflammatory modulators in low-density lipoprotein receptor-knockout mice. J. Agric. Food Chem. 2017, 65, 9054–9060. [Google Scholar] [CrossRef]
- Sumczynski, D.; Koubová, E.; Šenkárová, L.; Orsavová, J. Rice flakes produced from commercial wild rice: Chemical compositions, vitamin B compounds, mineral and trace element contents and their dietary intake evaluation. Food Chem. 2018, 264, 386–392. [Google Scholar] [CrossRef] [PubMed]
- Anwar, F.; Zengin, G.; Alkharfy, K.; Marcu, M. Wild rice (Zizania sp.): A potential source of valuable ingredients for nutraceuticals and functional foods. Riv. Ital. Sostanze Gr. 2017, 565, 81–89. [Google Scholar]
- Qiu, Y.; Liu, Q.; Beta, T. Antioxidant properties of commercial wild rice and analysis of soluble and insoluble phenolic acids. Food Chem. 2010, 121, 140–147. [Google Scholar] [CrossRef]
- Qiu, Y.; Liu, Q.; Beta, T. Antioxidant activity of commercial wild rice and identification of flavonoid compounds in active fractions. J. Agric. Food Chem. 2009, 57, 7543–7551. [Google Scholar] [CrossRef]
- Chu, M.J.; Liu, X.M.; Yan, N.; Wang, F.Z.; Du, Y.M.; Zhang, Z.F. Partial purification, identification, and quantitation of antioxidants from wild rice (Zizania latifolia). Molecules 2018, 23, 2782. [Google Scholar] [CrossRef]
- Chu, M.J.; Du, Y.M.; Liu, X.M.; Yan, N.; Wang, F.Z.; Zhang, Z.F. Extraction of proanthocyanidins from Chinese wild rice (Zizania latifolia) and analyses of structural composition and potential bioactivities of different fractions. Molecules 2019, 24, 1681. [Google Scholar] [CrossRef]
- Tao, W.; Zhang, Y.; Shen, X.; Cao, Y.; Shi, J.; Ye, X.; Chen, S. Rethinking the mechanism of the health benefits of proanthocyanidins: Absorption, metabolism, and interaction with gut microbiota. Compr. Rev. Food Sci. Food Saf. 2019, 18, 971–985. [Google Scholar] [CrossRef]
- Ji, Y.; Chung, Y.M.; Park, S.; Jeong, D.; Kim, B.; Holzapfel, W.H. Dose dependent anti-obesity effect of three different Lactobacillus sakei strains using a diet induced obese murine model. PeerJ Prepr. 2018, 6, e26959v1. [Google Scholar]
- Wickens, K.L.; Barthow, C.A.; Murphy, R.; Abels, P.R.; Maude, R.M.; Stone, P.R.; Mitchell, E.A.; Stanley, T.V.; Purdie, G.L.; Kang, J.M. Early pregnancy probiotic supplementation with Lactobacillus rhamnosus HN001 may reduce the prevalence of gestational diabetes mellitus: A randomised controlled trial. Brit. J. Nutr. 2017, 117, 804–813. [Google Scholar] [CrossRef]
- Gao, C.; Major, A.; Rendon, D.; Lugo, M.; Jackson, V.; Shi, Z.; Mori-Akiyama, Y.; Versalovic, J. Histamine H2 receptor-mediated suppression of intestinal inflammation by probiotic Lactobacillus reuteri. MBio 2015, 6. [Google Scholar] [CrossRef]
- Han, S.-F.; Zhang, H.; Zhai, C.-K. Protective potentials of wild rice (Zizania latifolia (Griseb) Turcz) against obesity and lipotoxicity induced by a high-fat/cholesterol diet in rats. Food Chem. Toxicol. 2012, 50, 2263–2269. [Google Scholar] [CrossRef]
- Han, S.; Zhang, H.; Qin, L.; Zhai, C. Effects of dietary carbohydrate replaced with wild rice (Zizania latifolia (Griseb) Turcz) on insulin resistance in rats fed with a high-fat/cholesterol diet. Nutrients 2013, 5, 552–564. [Google Scholar] [CrossRef] [PubMed]
- Lee, S.-S.; Baek, Y.-S.; Eun, C.-S.; Yu, M.-H.; Baek, N.-I.; Chung, D.-k.; Bang, M.-H.; Yang, S.-A. Tricin derivatives as anti-inflammatory and anti-allergic constituents from the aerial part of Zizania latifolia. Biosci. Biotech. Bioch. 2015, 79, 700–706. [Google Scholar] [CrossRef] [PubMed]
- Sonnenburg, E.D.; Smits, S.A.; Tikhonov, M.; Higginbottom, S.K.; Wingreen, N.S.; Sonnenburg, J.L. Diet-induced extinctions in the gut microbiota compound over generations. Nature 2016, 529, 212. [Google Scholar] [CrossRef] [PubMed]
- Etxeberria, U.; Arias, N.; Boqué, N.; Macarulla, M.; Portillo, M.; Martínez, J.; Milagro, F. Reshaping faecal gut microbiota composition by the intake of trans-resveratrol and quercetin in high-fat sucrose diet-fed rats. J. Nutr. Biochem. 2015, 26, 651–660. [Google Scholar] [CrossRef]
- Yang, J.; Lee, Y.; Kim, Y.; Lee, S.; Ryu, S.; Fukuda, S.; Hase, K.; Yang, C.; Lim, H.; Kim, M. Gut commensal Bacteroides acidifaciens prevents obesity and improves insulin sensitivity in mice. Mucosal Immunol. 2017, 10, 104. [Google Scholar] [CrossRef] [PubMed]
- Flint, H.J. The impact of nutrition on the human microbiome. Nutr. Rev. 2012, 70, S10–S13. [Google Scholar] [CrossRef]
- Holscher, H.D. Dietary fiber and prebiotics and the gastrointestinal microbiota. Gut Microbes 2017, 8, 172–184. [Google Scholar] [CrossRef]
- Yang, X.; Kwame, O.D.; Huang, Y.; He, C.; Yang, H.; He, S.; Li, J.; Li, J.; Berthold, H.; Yin, Y. Resistant Starch Regulates Gut Microbiota: Structure, Biochemistry and Cell Signalling. Cell. Physiol. Biochem. 2017, 42, 306–318. [Google Scholar] [CrossRef]
- Błażejewski, A.J.; Thiemann, S.; Schenk, A.; Pils, M.C.; Gálvez, E.J.; Roy, U.; Heise, U.; de Zoete, M.R.; Flavell, R.A.; Strowig, T. Microbiota normalization reveals that canonical caspase-1 activation exacerbates chemically induced intestinal inflammation. Cell Rep. 2017, 19, 2319–2330. [Google Scholar] [CrossRef]
- Storelli, G.; Strigini, M.; Grenier, T.; Bozonnet, L.; Schwarzer, M.; Daniel, C.; Matos, R.; Leulier, F. Drosophila perpetuates nutritional mutualism by promoting the fitness of its intestinal symbiont Lactobacillus plantarum. Cell Metab. 2018, 27, 362–377. [Google Scholar] [CrossRef] [PubMed]
- Khare, P.; Jagtap, S.; Jain, Y.; Baboota, R.K.; Mangal, P.; Boparai, R.K.; Bhutani, K.K.; Sharma, S.S.; Premkumar, L.S.; Kondepudi, K.K.; et al. Cinnamaldehyde supplementation prevents fasting-induced hyperphagia, lipid accumulation, and inflammation in high-fat diet-fed mice. Biofactors 2016, 42, 201–211. [Google Scholar]
- Nihei, N.; Okamoto, H.; Furune, T.; Ikuta, N.; Sasaki, K.; Rimbach, G.; Yoshikawa, Y.; Terao, K. Dietary α-cyclodextrin modifies gut microbiota and reduces fat accumulation in high-fat-diet-fed obese mice. Biofactors 2018, 44, 336–347. [Google Scholar] [CrossRef] [PubMed]
- Wu, C.; Tian, Y.; Yu, J.; Zhang, R.; Zhang, X.; Guo, P. The pandanus tectorius fruit extract (PTF) modulates the gut microbiota and exerts anti-hyperlipidaemic effects. Phytomedicine 2019, 58, 152863. [Google Scholar] [CrossRef] [PubMed]
- Singh, D.P.; Singh, J.; Boparai, R.K.; Zhu, J.; Mantri, S.; Khare, P.; Khardori, R.; Kondepudi, K.K.; Chopra, K.; Bishnoi, M. Isomalto-oligosaccharides, a prebiotic, functionally augment green tea effects against high fat diet-induced metabolic alterations via preventing gut dysbacteriosis in mice. Pharm. Res. 2017, 123, 103–113. [Google Scholar] [CrossRef]
- Hjorth, M.; Roager, H.M.; Larsen, T.; Poulsen, S.; Licht, T.R.; Bahl, M.I.; Zohar, Y.; Astrup, A. Pre-treatment microbial Prevotella-to-Bacteroides ratio, determines body fat loss success during a 6-month randomized controlled diet intervention. Int. J. Obes. 2018, 42, 580. [Google Scholar] [CrossRef]
- Rios-Covian, D.; Salazar, N.; Gueimonde, M.; de los Reyes-Gavilan, C.G. Shaping the metabolism of intestinal Bacteroides population through diet to improve human health. Front. Microbiol. 2017, 8, 376. [Google Scholar] [CrossRef]
- Larsen, J.M. The immune response to Prevotella bacteria in chronic inflammatory disease. Immunology 2017, 151, 363–374. [Google Scholar] [CrossRef]
- Domingueti, C.P.; Dusse, L.M.S.A.; das Graças Carvalho, M.; de Sousa, L.P.; Gomes, K.B.; Fernandes, A.P. Diabetes mellitus: The linkage between oxidative stress, inflammation, hypercoagulability and vascular complications. J. Diabetes Complicat. 2016, 30, 738–745. [Google Scholar] [CrossRef]
- Cooke, A.A.; Connaughton, R.M.; Lyons, C.L.; McMorrow, A.M.; Roche, H.M. Fatty acids and chronic low grade inflammation associated with obesity and the metabolic syndrome. Eur. J. Pharmacol. 2016, 785, 207–214. [Google Scholar] [CrossRef]
- Kilkenny, C.; Browne, W.J.; Cuthill, I.C.; Emerson, M.; Altman, D.G. Improving bioscience research reporting: The ARRIVE guidelines for reporting animal research. PLoS Biol. 2010, 8, e1000412. [Google Scholar] [CrossRef] [PubMed]
- Maleszewski, J.J.; Orellana, V.M.; Hodge, D.O.; Kuhl, U.; Schultheiss, H.-P.; Cooper, L.T. Long-term risk of recurrence, morbidity and mortality in giant cell myocarditis. Am. J. Cardiol. 2015, 115, 1733–1738. [Google Scholar] [CrossRef] [PubMed]
- Yuan, X.-L.; Zhang, P.; Liu, X.-M.; Du, Y.-M.; Hou, X.-D.; Cheng, S.; Zhang, Z.-F. Cytological assessments and transcriptome profiling demonstrate that evodiamine inhibits growth and induces apoptosis in a renal carcinoma cell line. Sci. Rep. 2017, 7, 12572. [Google Scholar] [CrossRef] [PubMed]
- Xu, P.; Zhang, Y.; Liu, Y.; Yuan, Q.; Song, L.; Liu, M.; Liu, Z.; Yang, Y.; Li, J.; Li, D. Fibroblast growth factor 21 attenuates hepatic fibrogenesis through TGF-β/smad2/3 and NF-κB signaling pathways. Toxicol. Appl. Pharm. 2016, 290, 43–53. [Google Scholar] [CrossRef]
- Magoč, T.; Salzberg, S.L. FLASH: Fast length adjustment of short reads to improve genome assemblies. Bioinformatics 2011, 27, 2957–2963. [Google Scholar] [CrossRef]
- Edgar, R.C.; Haas, B.J.; Clemente, J.C.; Quince, C.; Knight, R. UCHIME improves sensitivity and speed of chimera detection. Bioinformatics 2011, 27, 2194–2200. [Google Scholar] [CrossRef]
- Lozupone, C.A.; Hamady, M.; Kelley, S.T.; Knight, R. Quantitative and qualitative β diversity measures lead to different insights into factors that structure microbial communities. Appl. Environ. Microbiol. 2007, 73, 1576–1585. [Google Scholar] [CrossRef]
- RC Team. R: A Language and Environment for Statistical Computing; MSOR Connections; RC Team: Vienna, Austria, 2014; Volume 1. [Google Scholar]
- Mahnert, A.; Moissl-Eichinger, C.; Berg, G. Microbiome interplay: Plants alter microbial abundance and diversity within the built environment. Front. Microbiol. 2015, 6, 887. [Google Scholar] [CrossRef]
- Segata, N.; Izard, J.; Waldron, L.; Gevers, D.; Miropolsky, L.; Garrett, W.S.; Huttenhower, C. Metagenomic biomarker discovery and explanation. Genome Biol. 2011, 12, 1–18. [Google Scholar] [CrossRef]


| Composition | White Rice (g/100 g) | Red Rice (g/100 g) | Wild Rice (g/100 g) |
|---|---|---|---|
| Crude protein | 10.19 ± 0.29 a | 11.78 ± 0.11 a | 15.6 ± 0.21 b |
| Total fat | 0.67 ± 0.01 a | 1.36 ± 0.05 b | 1.12 ± 0.01 b |
| Moisture | 11.76 ± 0.10 a | 10.61 ± 0.17 a | 10.16 ± 0.12 a |
| Total ash | 0.30 ± 0.02 a | 1.38 ± 0.02 b | 1.31 ± 0.25 b |
| Sodium | 11.8 ± 0.87 a | 84.5 ± 4.55 b | 5.21 ± 0.61 c |
| Dietary fiber | 0.42 ± 0.01 a | 2.68 ± 0.01 b | 6.83 ± 0.11 c |
| Resistant starch | 1.41 ± 0.04 | 0.95 ± 0.01 | 10.87 ± 0.15 |
| Total phenolic [25] | 1.30 ± 0.00 a | 1.40 ± 0.00 a | 2.10 ± 0.00 b |
© 2020 by the authors. Licensee MDPI, Basel, Switzerland. This article is an open access article distributed under the terms and conditions of the Creative Commons Attribution (CC BY) license (http://creativecommons.org/licenses/by/4.0/).
Share and Cite
Hou, X.-D.; Yan, N.; Du, Y.-M.; Liang, H.; Zhang, Z.-F.; Yuan, X.-L. Consumption of Wild Rice (Zizania latifolia) Prevents Metabolic Associated Fatty Liver Disease through the Modulation of the Gut Microbiota in Mice Model. Int. J. Mol. Sci. 2020, 21, 5375. https://doi.org/10.3390/ijms21155375
Hou X-D, Yan N, Du Y-M, Liang H, Zhang Z-F, Yuan X-L. Consumption of Wild Rice (Zizania latifolia) Prevents Metabolic Associated Fatty Liver Disease through the Modulation of the Gut Microbiota in Mice Model. International Journal of Molecular Sciences. 2020; 21(15):5375. https://doi.org/10.3390/ijms21155375
Chicago/Turabian StyleHou, Xiao-Dong, Ning Yan, Yong-Mei Du, Hui Liang, Zhong-Feng Zhang, and Xiao-Long Yuan. 2020. "Consumption of Wild Rice (Zizania latifolia) Prevents Metabolic Associated Fatty Liver Disease through the Modulation of the Gut Microbiota in Mice Model" International Journal of Molecular Sciences 21, no. 15: 5375. https://doi.org/10.3390/ijms21155375
APA StyleHou, X.-D., Yan, N., Du, Y.-M., Liang, H., Zhang, Z.-F., & Yuan, X.-L. (2020). Consumption of Wild Rice (Zizania latifolia) Prevents Metabolic Associated Fatty Liver Disease through the Modulation of the Gut Microbiota in Mice Model. International Journal of Molecular Sciences, 21(15), 5375. https://doi.org/10.3390/ijms21155375