Article

Single Cell Transcriptome Analysis of Niemann–Pick Disease, Type C1 Cerebella

1
Division of Translational Medicine, Eunice Kennedy Shriver National Institute of Child Health and Human Development, National Institutes of Health, Bethesda, MD 20892, USA
2
Human Biochemical Genetics Section, National Human Genome Research Institute, National Institutes of Health, Bethesda, MD 20892, USA
3
Pediatric Translational Research Branch, National Institute of Arthritis and Musculoskeletal and Skin Disease, National Institutes of Health, Bethesda, MD 20892, USA
4
Molecular Genomic Core, Eunice Kennedy Shriver National Institute of Child Health and Human Development, National Institutes of Health, Bethesda, MD 20892, USA
5
10CRC, Rm. 5-2571, 10 Center Dr., Bethesda, MD 20892, USA
*
Author to whom correspondence should be addressed.
They contributed equally to this work.
Int. J. Mol. Sci. 2020, 21(15), 5368; https://doi.org/10.3390/ijms21155368
Submission received: 4 July 2020 / Revised: 23 July 2020 / Accepted: 24 July 2020 / Published: 28 July 2020

Abstract

:
Niemann–Pick disease, type C1 (NPC1) is a lysosomal disease characterized by endolysosomal storage of unesterified cholesterol and decreased cellular cholesterol bioavailability. A cardinal symptom of NPC1 is cerebellar ataxia due to Purkinje neuron loss. To gain an understanding of the cerebellar neuropathology we obtained single cell transcriptome data from control (Npc1+/+) and both three-week-old presymptomatic and seven-week-old symptomatic mutant (Npc1−/−) mice. In seven-week-old Npc1−/− mice, differential expression data was obtained for neuronal, glial, vascular, and myeloid cells. As anticipated, we observed microglial activation and increased expression of innate immunity genes. We also observed increased expression of innate immunity genes by other cerebellar cell types, including Purkinje neurons. Whereas neuroinflammation mediated by microglia may have both neuroprotective and neurotoxic components, the contribution of increased expression of these genes by non-immune cells to NPC1 pathology is not known. It is possible that dysregulated expression of innate immunity genes by non-immune cells is neurotoxic. We did not anticipate a general lack of transcriptomic changes in cells other than microglia from presymptomatic three-week-old Npc1−/− mice. This observation suggests that microglia activation precedes neuronal dysfunction. The data presented in this paper will be useful for generating testable hypotheses related to disease progression and Purkinje neurons loss as well as providing insight into potential novel therapeutic interventions.

1. Introduction

Niemann–Pick disease, type C1 (NPC1, MIM #257220) is a rare neurodegenerative disease caused by reduced function of NPC1 [1]. The NPC1 protein, in conjunction with NPC2, functions to transport cholesterol out of the endolysosomal compartment [2]. Decreased NPC1 or NPC2 function leads to endolysosomal storage of unesterified cholesterol and other lipids [3,4]. Mutations of NPC1 account for approximately 95% of the cases of NPC, and the other 5% are due to pathogenic variants in NPC2 [5]. Data from large sequence databases are consistent with an incidence of NPC1 on the order of 1/90,000 and suggest that there may be a late-onset NPC1 phenotype with a significantly higher incidence [6]. During the neonatal period, infants with NPC1 may present with cholestatic liver disease [7], but after the neonatal period, progressive neurological disease dominates the clinical picture. Characteristic neurological manifestations include progressive supranuclear gaze palsy, gelastic cataplexy, seizures, cognitive impairment, and cerebellar ataxia [5,8,9].
Cerebellar ataxia is a cardinal symptom of NPC1. The cerebellum accounts for more than half of the total number of neurons in the central nervous system (CNS) [10]. Its primary function is to coordinate motor control and coordination, but recent work suggests it also plays a role in other processes such as cognition [11]. The cerebellar cortex has a relatively simple three-layer organization [12]. The central layer is composed of a single layer of Purkinje neurons. Purkinje neurons are large inhibitory GABAergic neurons that function to integrate cerebellar neuronal input and provide the sole output of the cerebellum via axons that project to the deep cerebellar nuclei. The Purkinje neuron layer lies between the inner granule layer composed primarily of excitatory granule neurons, and the outer molecular layer composed primarily of granule neuron axons (parallel fibers) and the Purkinje neuron dendritic tree. In addition to the glutamatergic granule neurons, the granule layer also contains other neuronal subtypes including various interneurons such as inhibitory Golgi cells and glutamatergic unipolar brush cells, the latter of which function to amplify signals from the vestibular ganglia and provide information on spatial orientation. Basket cells, found in the molecular layer, synapse on the Purkinje neuron cell and provide inhibitory input. In addition to neurons, the cerebellum contains numbers of supporting glial cells (astrocytes, ependymal cells, and oligodendrocytes), vascular associated cells, and myeloid (microglia and monocytes/macrophages).
Cerebellar ataxia in NPC1 results from the progressive loss of cerebellar Purkinje neurons. Purkinje neuron loss in NPC1 occurs in a stereotypic anterior to posterior gradient with relative preservation of a subset of aldolase C positive Purkinje neurons [13]. Although Purkinje neuron loss has been reported to be cell autonomous [14], histopathological changes are observed in astrocytes and oligodendrocytes [15], and microglial activation is a predominant aspect of and likely contributor to NPC1 neuropathology [16]. Npc1 expression in astrocytes significantly increases survival for Npc1−/− mice, suggesting glial cells dysfunction is involved in disease progression [17]. Differences in RNA expression between control and mutant tissue can be used to obtain insight into biological processes that are altered in the disease state, and groups have compared cerebellar transcriptomes between control and NPC1 mutant mice at different ages [18,19,20,21]. However, transcriptome analysis of intact tissue/lobules mask potentially significant expression changes at the individual cellular level. Single cell transcriptome analysis has been extensively applied to characterize neuronal cell populations from the entire brain [22,23] and notably the cerebellum [24]. To gain insight into pathological processes occurring in individual cerebellar cell types we performed single cell RNA sequencing (scRNAseq) on cerebellar tissue collected from asymptomatic three-week-old and symptomatic seven-week-old male Npc1−/− (BALB/Npc1m1N) and corresponding control Npc1+/+ littermates. Understanding the individual cellular contributions to NPC1 pathology may lead to therapeutic approaches targeting various aspects of the pathological cascade.

2. Results

2.1. Cell Type Specific Transcriptomes from Symptomatic 7-Week Old NPC1 Mice

Single cell RNA sequencing was used to obtain cerebellar single cell transcriptome data from seven-week-old male NPC1 mutant (Npc1−/−) and littermate control (Npc1+/+) mice. Two cerebella from each genotype yielded 1875 and 1430 single-cell transcriptomes from Npc1+/+ and Npc1−/− tissue, respectively. Visualization by t-distributed stochastic neighbor embedding (t-SNE) allowed for the identification of clusters of cells with similar transcriptomes (Figure 1A and Figure S1). Cell-type-specific transcripts (signature transcripts) were used to identify the type of cell in the t-SNE clusters, and the number of cells identified for both genotypes is shown in Figure 1B. Based on expression of signature transcripts, we identified transcriptomes corresponding to myeloid cells (monocytes and microglia), vascular cells (endothelial, vascular smooth muscle, vascular leptomeningeal and arachnoid barrier), glial cells (astrocytes, oligodendrocytes, ependymal) and neurons (basket, unipolar brush, cerebellar granule, interneurons, Purkinje). Figure S1 shows the distribution of specific signature transcripts corresponding to cell transcriptome clusters on the t-SNE plot. The signature transcripts used to identify most cell types correspond to known histological markers (Figure 1C) and have been used by others to identify cell type specific transcriptomes in scRNAseq experiments [22,23,25]. In the cerebellum calbindin, there is an immunohistochemical marker of Purkinje neurons, IBA1 and CD68 label microglia, TBR2 (product of Eomes) labels unipolar brush neurons, CD117 (product of Kit) labels basket/stellate neurons, OLIG2 labels oligodendrocytes, NEUROD1 labels cerebellar granule neurons, GFAP and AQP4 are astrocyte markers, NEUN (product of Snap25) labels most neurons, and parvalbumin is used to identify interneurons. Based on transcriptome data (Figure S1) and immunohistochemical staining (Figure 1C), we show that aquaporin 1 (Aqp1) can be used to identify ependymal secretory cells. From the scRNAseq data, there appeared to be a decreased number of astrocytes, oligodendrocytes, granule neurons and unipolar brush neurons in the Npc1 mutant cerebella when compared to the control data (Figure 1B). However, these apparent differences could not be confirmed experimentally (Figure 1D). This discrepancy may be due to increased sensitivity of Npc1−/− cells to the enzymatic disassociation required to prepare samples for scRNAseq. In the following sections we will catalogue and compare cerebellar cell type specific transcriptome data from seven-week-old Npc1+/+ and Npc1−/− mice.

2.2. Myeloid Transcriptomes

Consistent with previous work on immune cells in the brain of Npc1−/− mice [16,26], we did not observe infiltrating peripheral immune cells other than perivascular monocytes/macrophages. Monocytes and microglia are both characterized by the high expression of C1qa, while Pf4 (also named Cxcl4) and Tmem119 are respectively specific for monocytes and microglia (Figure S1, [25]). No significant gene expression differences were observed comparing Npc1 control and null monocytes. However, consistent with our prior work characterizing transcript levels in FACS isolated microglia [27], we observed major gene expression differences between Npc1+/+ and Npc1−/− microglia.
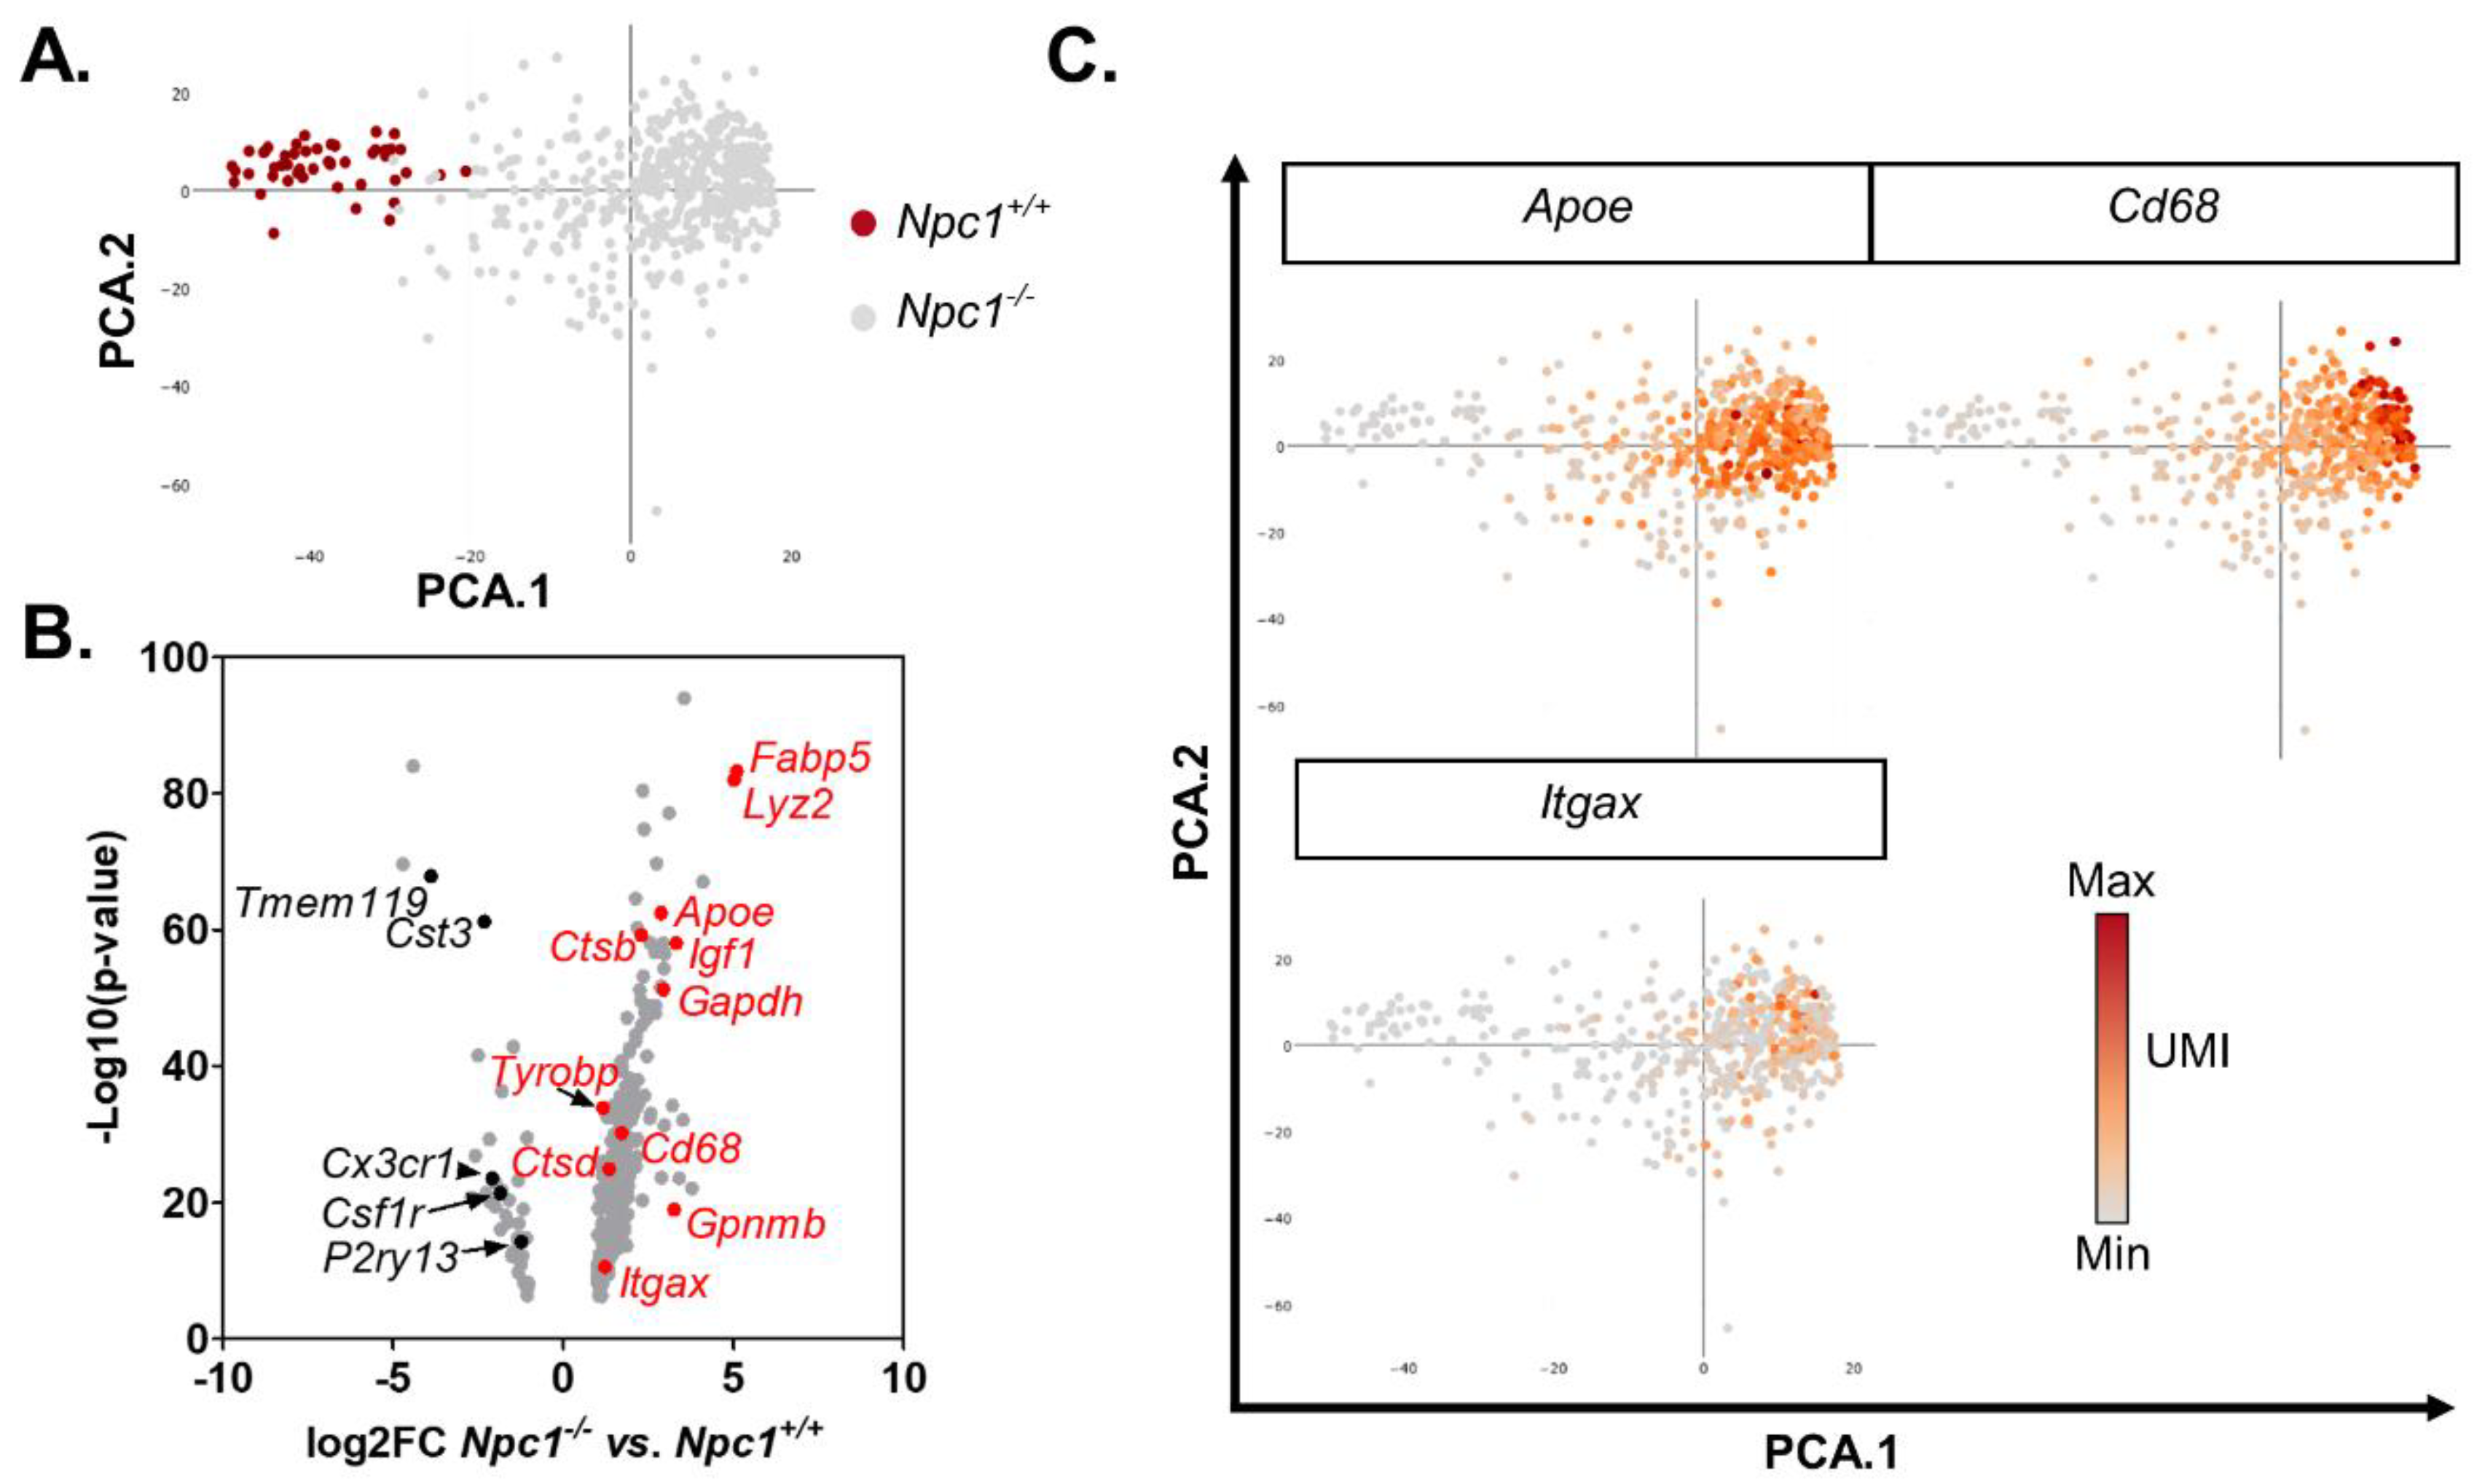
Microglia are central nervous system resident immune cells that originate from the yolk sac during development [28]. The t-SNE plot identified two populations of microglia (Figure 1A and Figure S1). Principal component analysis (PCA) of the microglia transcriptomes shows a distribution of the cells along the first dimension of the PCA based on genotype (Figure 2A). Npc1−/− microglia can be differentiated from Npc1+/+ microglia based on reduced expression of the linage markers Csf1r, Cst3, Cx3cr1, P2ry13 and Tmem119 (Figure 2B, [27]). A continuum of activation between the non-activated ramified state and the reactive amoeboid state is suggested by increased expression of Cd22, Cd68, Gapdh, Hpse, Igf1, Itgax, and Trem2 in Npc1−/− microglia (Figure 2B,C). This expression pattern is consistent with a subset of the microglia in Npc1−/− being classified as disease associate microglia (DAM). DAM were initially described in an Alzheimer disease mouse model and are thought to be neuroprotective [29], thus supporting the concept that subpopulations of microglia in NPC1 have neurotoxic or neuroprotective activity [27]. Decreased expression of Csf1r in Npc1−/− microglia likely explains a prior unpublished observation that treatment of Npc1−/− mice with PLX3397, a CSF1R inhibitor used to deplete microglia, did not have a demonstratable effect on either cerebellar histopathology or survival of Npc1−/− mice (Figure S2A,B).
Pathway analysis of differentially expressed genes showed similarities in microglia activation between NPC1 and common neurodegenerative diseases (Figure S2C, [30]). Thus, we compared our results with single cell transcriptome data from amyotrophic lateral sclerosis and Alzheimer disease mouse models [29]. Based on transcriptome analysis, activated microglia isolated from seven-week-old Npc1−/− cerebellum more closely resemble those from the Alzheimer disease mouse model (rPearson = 0.55, p < 0.001) than the amyotrophic lateral sclerosis mouse model (rPearson = −0.48, p < 0.001) when compared to their respective controls (Figure S2D). Expression of neuroprotective genes Igf1, Gpnmb and Spp1 is increased in microglia from both NPC1 and Alzheimer disease mouse models. In contrast, expression of these three genes is decreased in microglia from the amyotrophic lateral sclerosis mouse model. Flow cytometry analysis of cerebellar microglia from control and Npc1 mutant mice confirmed increase protein expression of DAM markers CD11c (product of Itgax) and apolipoprotein E (Apoe) in Npc1−/− cerebellar microglia (Figure S2E).

2.3. Vascular Associated Cell Transcriptomes

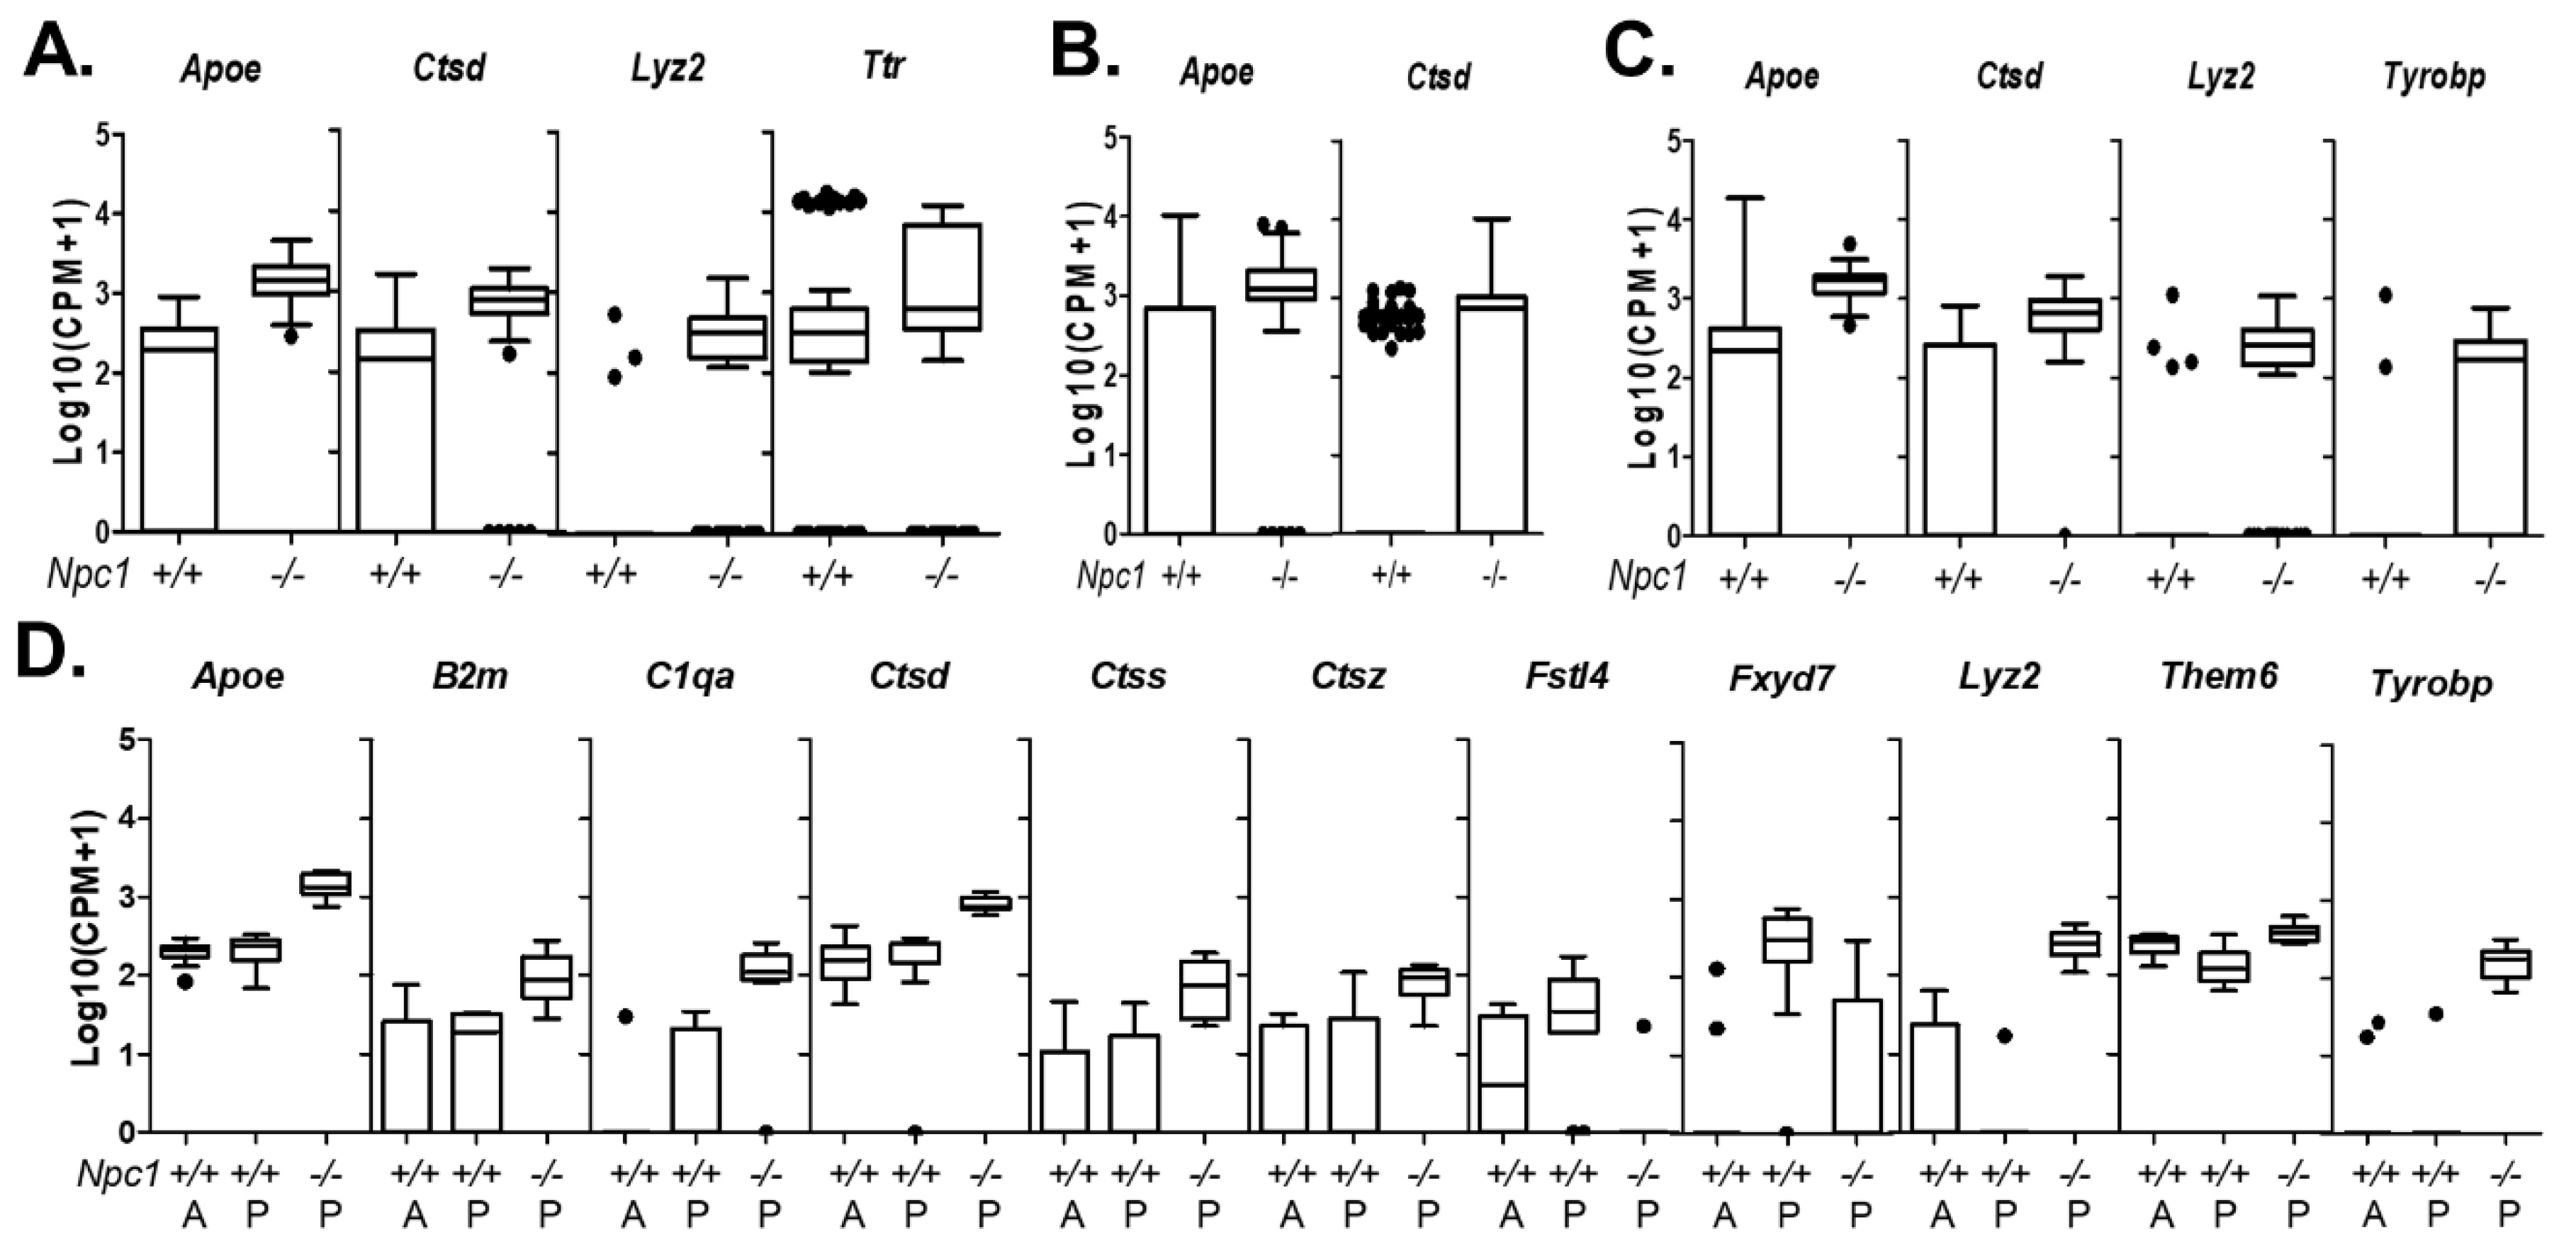
Single cell sequencing can identify multiple cell types associated with central nervous system blood vessels [23]. In our data set, we were able to identify four vascular associated cell types. These included vascular smooth muscle, endothelial cells, arachnoid barrier cells, and vascular leptomeningeal cells (Figure 1A,B and Figure S1). Vascular smooth muscle cells are characterized by the expression of Acta2, Myh11, Myl9, and Tagln [25]. Data for Acta2 are shown in Figure S1. Table S1 provides a description of differentially expressed genes and their relevance to NPC1 for all identified cell types. When looking at genes with increased expression, the most enriched pathway is “vascular smooth muscle cell contraction,” which supports our identification (Table S2). Comparison of Npc1+/+ and Npc1−/− vascular smooth muscle gene expression showed four genes with a significant differential expression: Apoe, Ctsd, Lyz2, and Map3k7cl (Figure 3A). Endothelial cells are characterized by expression of Cldn5 and Pecam1 (Figure 1 and Figure S1). Pathway analysis of genes enriched in endothelial cells support the exchange function of these cell between the circulation and tissue and nitric oxide signaling important for angiogenesis (Table S2). Comparison between genotypes identified five genes with significant differential expression in Npc1−/− endothelial cells. The differentially expressed genes are Apoe, Ctla2a, Ctsb, Ctsd, and Lyz2 (Figure 3B, Table S1). Vascular leptomeningeal cells and arachnoid barrier cells are identified by high expression levels of Dcn, Col1a1 and Col1a2 (Figure 1 and Figure S1). They are differentiated by expression of Colec12 by vascular leptomeningeal cells and Slc47a1 by arachnoid barrier cells (Figure S3). No differentially expressed genes were identified in arachnoid barrier cells. The low number of transcriptomes corresponding to arachnoid barrier cells likely decreased our sensitivity to identify differentially expressed genes. Similar to vascular smooth muscle and endothelial cells, increased expression of Ctsd, Lyz2, and Tyrobp was observed in Npc1−/− vascular leptomeningeal cells (Figure 3C). Pathway analysis on genes enriched in both arachnoid barrier cells and vascular leptomeningeal cells support the similarities between these cells and their involvement in vasculature. Insulin-like growth factor is involved in blood vessel homeostasis [31], and heparin binding is enriched in both clusters (Table S2).

2.4. Glial Cell Transcriptomes

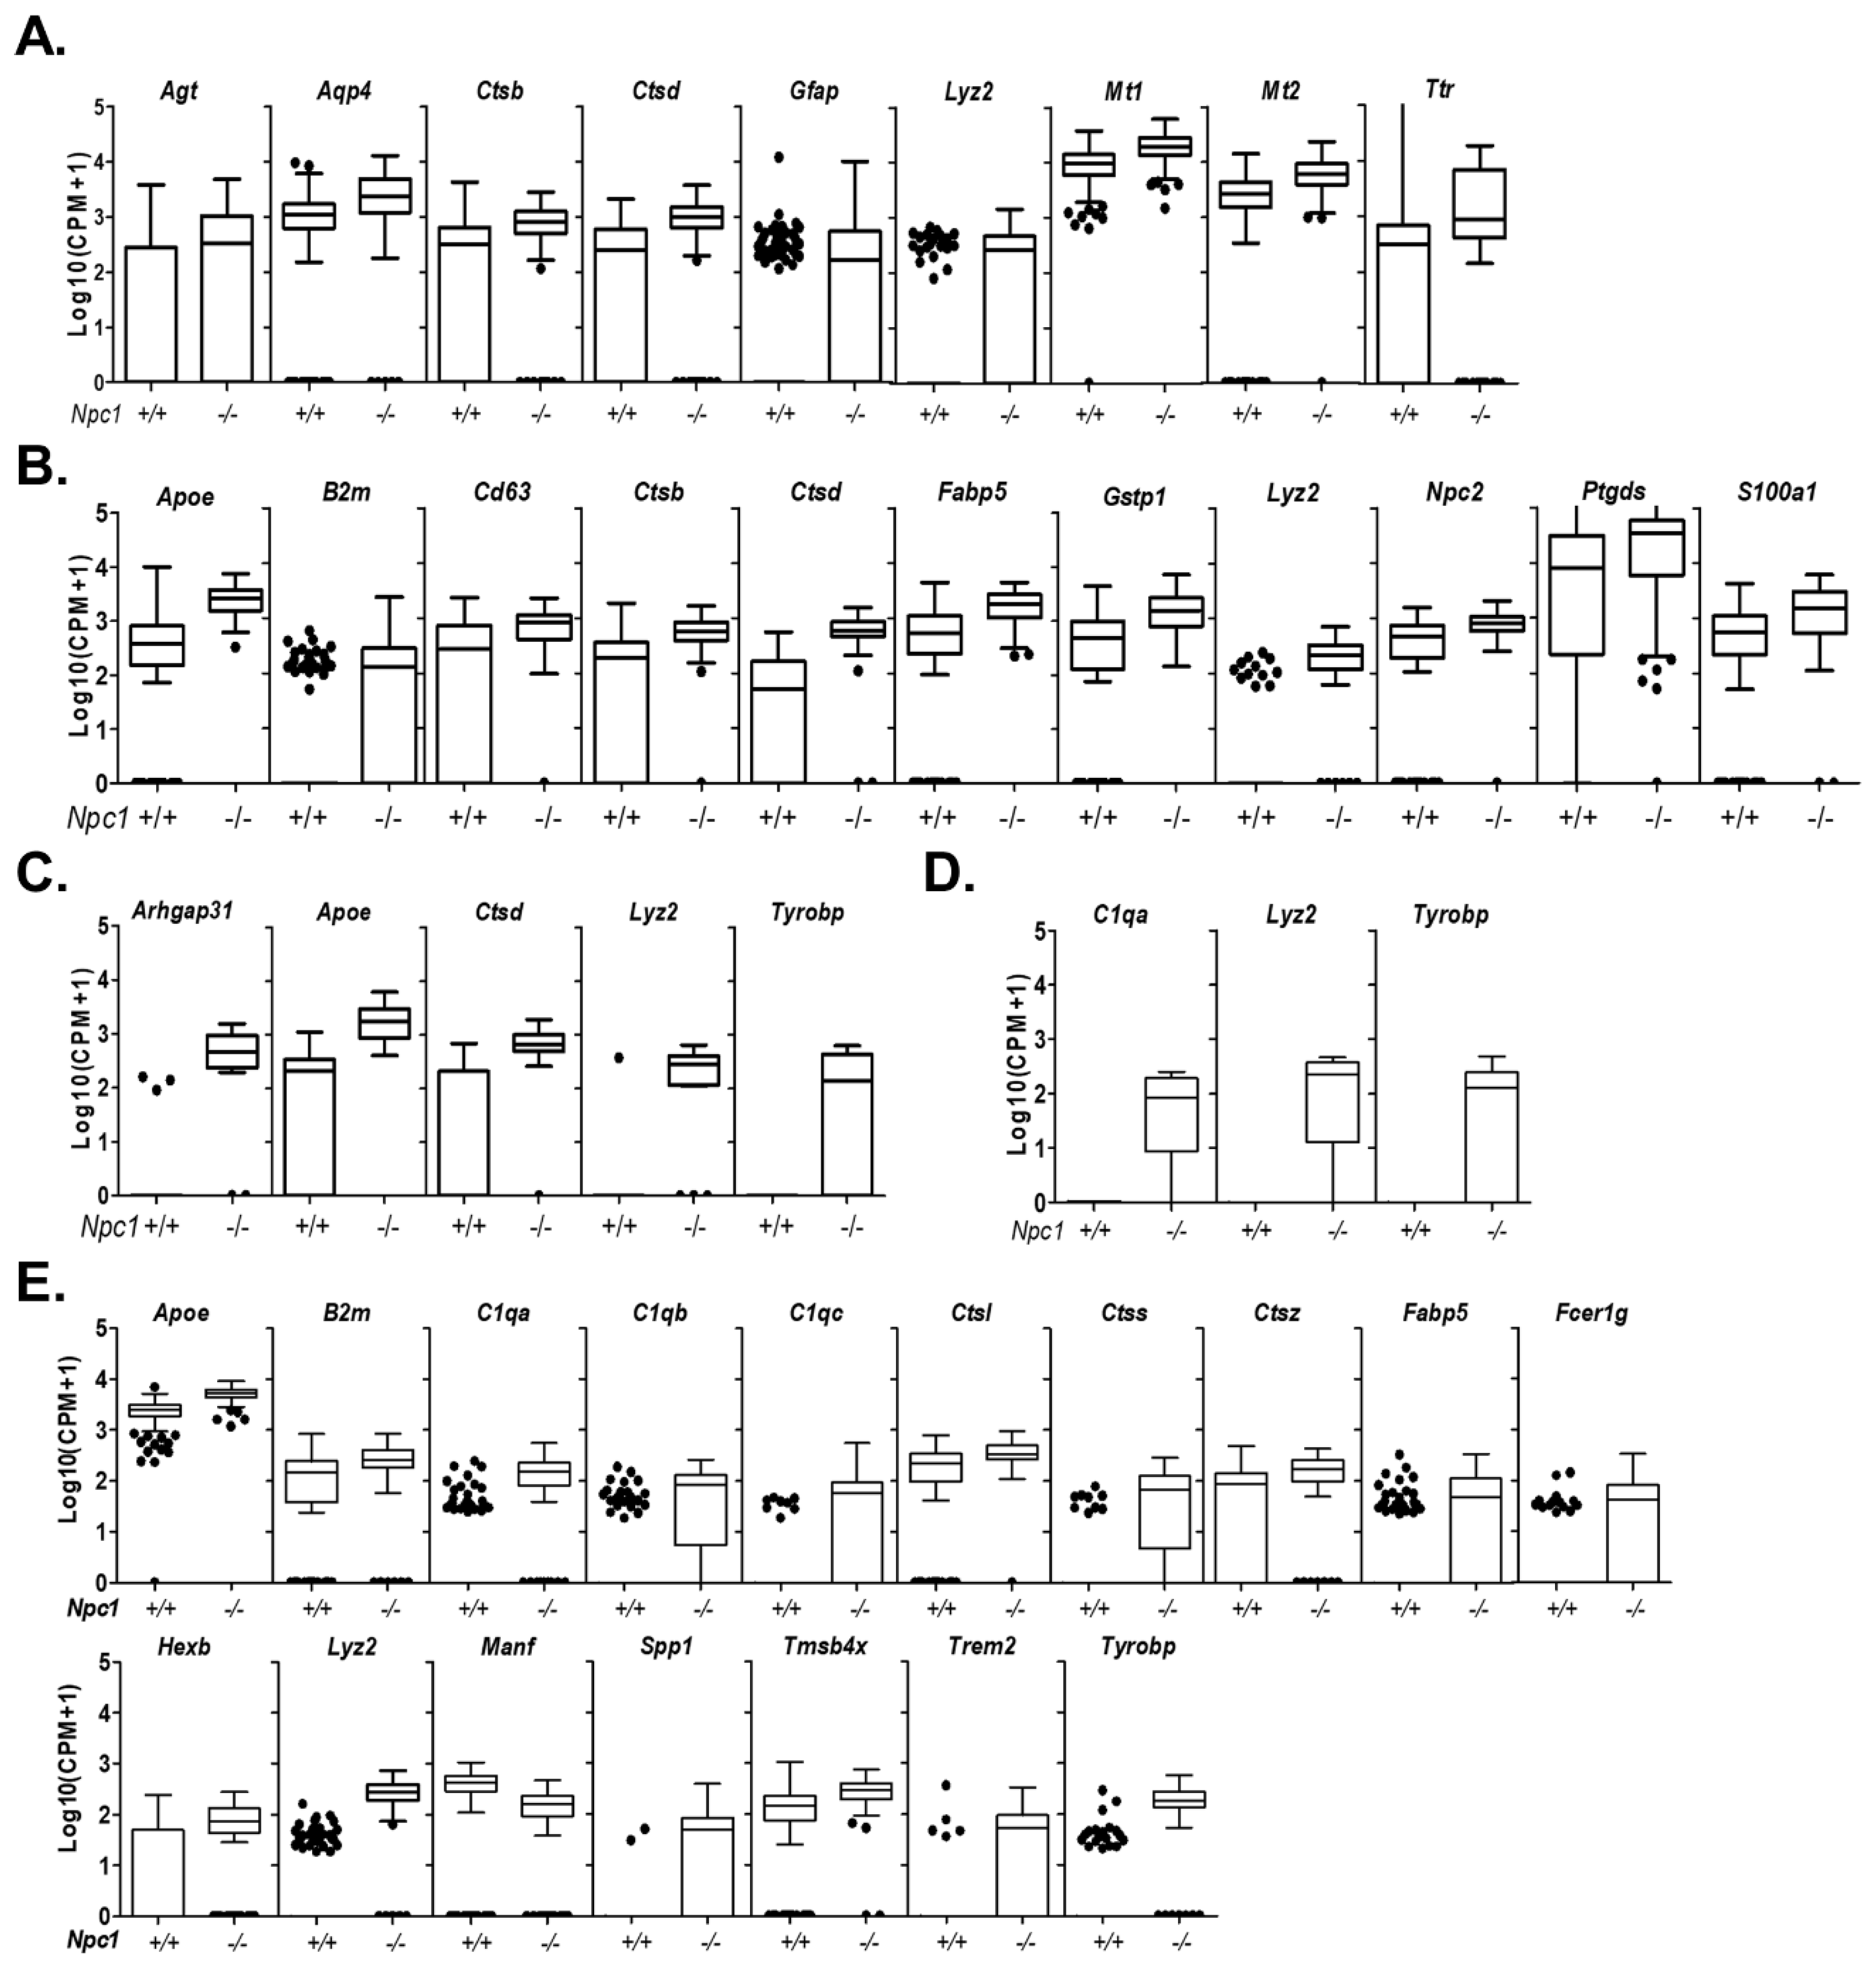
Glial cells in the cerebellum include astrocytes, oligodendrocyte precursors, oligodendrocytes, and, due to its proximity with the fourth ventricle, both ciliated and secretory ependymal cells. Astrocytes are characterized by the expression of Slc1a3 (Figure S1). Slc1a3 encodes SLC1A3 (GLAST, EAAT1), the main ionotropic glutamate transporter of the cerebellum [32]. Pathway analysis on genes enriched in astrocytes highlight the supportive functions of these cells in buffering ions and neurotransmitters (Table S2). Npc1+/+ astrocytes partition into two distinct populations (Figure S4A) corresponding to “homeostatic” and “reactive” astrocytes [33]. Reactive astrocytes are characterized by decreased expression of both Slc1a3 and Gdf10 (growth differentiation factor 10 or bone morphogenetic protein 3B) and increased expression of both Aqp4 (Aquaporin-4) and Gfap (Glial fibrillary acidic protein) (Figure S4B). In contrast, Npc1−/− astrocytes are not clearly separated into the homeostatic and reactive populations (Figure S4A). Instead Npc1−/− astrocytes have transcriptomes that represent a continuum between the homeostatic and reactive states (Figure S4B). Unfortunately, the depth of the sequencing did not allow us to determine the “polarity” of the Npc1−/− reactive astrocytes (GfaphighAqp4high) based on polarization markers suggested by Liddelow et al. [33]. Activated microglia induce A1 astrocyte polarization (neurotoxic) by secretion of IL-1α, TNF, and C1q. However, the absence of a significant phenotypic difference between Npc1−/−:C1qa+/+ and Npc1−/−:C1qa−/− mice [19] suggests that Npc1−/− astrocytes do not acquire an A1 neurotoxic polarity. Nine transcripts corresponding to Agt, Aqp4, Ctsb, Ctsd, Gfap, Lyz2, Mt1, Mt2, and Ttr were observed to have significantly increased expression in Npc1−/− astrocytes relative to littermate control mice (Figure 4A, Table S1).
Transcriptomes corresponding to oligodendrocytes are identified based upon high expression of Mog, Olig1, Olig2, and Mag. Data corresponding to Mog is shown in Figure S1. T-SNE plots of oligodendrocytes, independent of genotype, show two clusters (Figure S4C). These two clusters correspond to precursor (Marcks and Gpr17 positive) and differentiated (Mog and Car2 positive) oligodendrocytes (Figures S1 and S4D,F). Supporting this identification, pathways with increased expression include axon ensheathment, oligodendrocytes development and myelination (Table S2). Eleven genes with significantly increased expression were identified in Npc1−/− differentiated oligodendrocytes. These were Apoe, B2m, Cd63, Ctsb, Ctsd, Fabp5, Gstp1, Lyz2, Npc2, Ptgds, and S100a1 (Figure 4B, Table S1). Five transcripts were significantly overexpressed in Npc1−/− precursor oligodendrocytes. Apoe, Ctsd, and Lyz2 were overexpressed in both precursor and differentiated oligodendrocytes, whereas increased expression of Arhgap31 and Tyrobp was only observed in precursor oligodendrocyte transcriptomes (Figure 4C, Table S1).
Ependymal cells are organized in a tight monolayer that lines the ventricles of the brain forming a physical barrier between brain tissue and the cerebral spinal fluid (CSF) filled ventricles (reviewed in [34]). Ependymal cells are involved in the production and regulation of the composition of cerebrospinal fluid. Via the action of luminal cilia, ependymal cells promote circulation of CSF. In the cerebellum they form the epithelial layer of the fourth ventricle. Whereas the function of specific proteins involved in forming a tight junction barrier between the ventricles and the brain (ZO1, OCLN, and CX43) and hydrocephalic pressure regulation (Aquaporin 4 and 11) have been studied, relatively little is known regarding the biology of these cells [35]. There are two main types of ependymal cells, ciliated and secretory. Ciliated ependymal cells are characterized by high expression of Ccdc153 and Tmem212 and secretory ependymal cells are characterized by high expression of Aqp1 and Sostdc1 (Figures S1 and S4G,H). Analysis of ependymal ciliated cell transcriptomes confirmed the expression of cilium related genes and the lack of angiogenesis or stem cell related function as described by Shah et al. [36] (Table S2). Comparison of Npc1+/+ and Npc1−/− transcriptomes showed increased expression of C1qa, Lyz2, and Tyrobp (Figure 1D). Consistent with their hydrodynamic and metabolic function, the most highly enriched biological processes in ependymal cells were primary energy metabolism and transmembrane transport (Table S2). Comparison of Npc1+/+ and Npc1−/− transcriptomes showed significantly increased expression of 16 genes and significantly decreased expression of one gene in Npc1−/− secretory ependymal cells (Figure 4E, Table S1). The genes showing increased expression were Apoe, B2m, C1qa, C1qb, C1qc, Ctsl, Ctss, Ctsz, Fabp5, Fcer1g, Hexb, Lyz2, Spp1 (Osteopontin), Tmsb4x, Trem2, and Tyrobp. The only gene with significantly decreased expression was Manf.

2.5. Neuronal Transcriptomes

The majority of neurons can be identified by expression of synaptosome-associated protein 25 (Snap25) encoding the protein NEUN (Figure 1C and Figure S1). Among Snap25-positive cells, specific neurons can be differentiated based on expression of characteristic transcripts. This includes expression of Eomesodermin (Eomes/TBR2) in unipolar brush cells, calbindin 1 (Calb1) and ryanodine receptor 1 (Ryr1) in Purkinje neurons, cerebellin-3 precursor (Cbln3) and neurogenic differentiation 1 (Neurod1) in cerebellar granule cells, and CD117 (Kit) in basket/stellate cells (Figure 1C and Figure S1).
Basket and stellate cells are GABAergic inhibitory interneurons present in the cerebellar molecular layer identified by expression of Snap25 and Kit (coding for NEUN and CD117, respectively, Figure S1). Although basket and stellate neurons are morphologically distinct and innervate Purkinje neurons differently [37], we were not able to differentiate their transcriptomes. Pathway analysis of basket/stellate cell transcriptomes was notable for expression of genes encoding synaptic GABA receptors, neurotransmitter transporters and ion transporters (Table S2). A significant increase in expression of Apoe, Ctsd, Lyz2, and Ttr was observed in Npc1−/− basket/stellate neurons (Figure 5A).
Cerebellar granule neurons are glutamatergic neurons localized in the inner granule layer. They are the most common neuron in the cerebellum. Cerebellar granule neurons receive input from mossy fibers coming from the pontine nuclei and project axons into the molecular layer, where they form excitatory synapses on Purkinje neuron dendrites. Transcriptomes corresponding to cerebellar granule neurons were identified by expression of Snap25, Neurod1, and Clbn3 (Figure S1) and showed enrichment of genes involved in glutamatergic signaling (Table S2). Like what we observed for basket/stellate neurons, the cerebellar granule neurons from Npc1 mutant mice have increased expression of Apoe and Ctsd (Figure 5B).
Unipolar brush cells are small, Eomes/TBR2 positive (Figure 1 and Figure S1) glutamatergic neurons, residing in the granular layer of the cerebellar cortex [38]. In Asic5 mutant mice, dysfunction of unipolar brush cells results in cerebellar ataxia [39]. Pathway analysis confirmed the glutamatergic signaling of these cells (Table S2). Four transcripts show significantly increased expression in Npc1−/− unipolar brush cells (Figure 5C). Like basket/stellate and cerebellar granule neurons, unipolar brush cells have increased expression of Apoe and Ctsd. Expression of both Lyz2 and Tyrobp was also increased.
Purkinje neurons are very large neurons organized in a monolayer between the molecular and granular layer of the cerebellar cortex (Figure 1 and Figure S1). Purkinje neurons are GABAergic neurons that integrate inputs from other cerebellar neurons and project axons to the deep cerebellar nuclei. Enriched pathways are consistent with GABAergic signaling (Table S2). These neurons are of particular interest because progressive rostral to caudal loss of Purkinje neurons is a pathological hallmark of NPC1 [40], and loss of Purkinje neurons results in cerebellar ataxia, a major clinical feature of NPC1 [5,8,9]. Purkinje neurons transcriptomes were identified by high expression of Calb1, Car8, and Ryr1 [22] (Figure S1).
Clustering analysis identified two distinct populations of Purkinje neurons, but did not separate based on genotype (Figure S5A). One of the clusters consisted of transcriptomes from 12 Npc1+/+ Purkinje neurons and the other cluster included 22 transcriptomes evenly distributed between Npc1+/+ and Npc1−/− Purkinje neurons. We suspected that the clustering might be related to location of the Purkinje neurons in the cerebellum, since Purkinje neurons in anterior lobules (I to VI) are substantially lost by seven weeks of age. Classification of these two clusters as anterior and posterior Purkinje neurons (Figure S5B) is supported by prior data and the Allen Brain Atlas [20,41]. Calb1 and Car8, known Purkinje neuron markers, show uniform expression, whereas Sv2c and Abdh3 show decreased and Car7 and B3galt5 [42] show increased expression in posterior Purkinje neurons (Figure S5C). This is consistent with in situ expression data from the Alan Brain Atlas (Figure S5D). This assignment was supported by looking at expression of aldolase C (Aldoc). Aldolase C protein is expressed in Purkinje neurons that are relatively resistant to neurodegeneration in NPC1 [13], and Aldoc expression is increased in posterior lobules (https://porterlab.shinyapps.io/cerebellarlobules/). Mean Aldoc expression was decreased in Npc1+/+ Purkinje neurons in the anterior cluster (4777 ± 3282 CPM) versus those from the posterior cluster (14,692 ± 5325 CPM). Mean Aldoc expression (12,130 ± 9769 CPM) in the Npc1−/− neurons was similar to the posterior cluster Npc1+/+ Purkinje neurons.
Differential gene expression analysis between Npc1−/− and posterior Npc1+/+ Purkinje neurons showed 11 genes with a differential expression: Apoe, B2m, C1qa, Ctsd, Ctss, Ctsz, Fstl4, Fxyd7, Lyz2, Them6, and Tyrobp (Figure 5D, Table S1). Increased expression of Apoe, Ctsd, Lyz2 and Tyrobp in Npc1−/− Purkinje neurons overlap with what we observed in other cerebellar neurons (Figure 5A–C), and increased expression of B2m, C1qa, Ctss, Ctsz, and Tyrobp was observed in other Npc1−/− cerebellar cell type transcriptomes.

2.6. Protein Validation of Selective Genes Demonstrating Increased Expression in Npc1−/− Transcriptomes

Due to the multiple factors that influence translation and protein stability, proteomic and transcriptomic results do not always correlate [43]. Therefore, we evaluated protein expression of cathepsin D (Ctsd), lysozyme (Lyz2), DAP12 (Tyrobp), and APOE (Apoe) in cerebellar tissue from Npc1+/+ and Npc1−/− mice. Expression of β2 microglobulin (β2m) was quantified using an Enzyme Linked Immunosorbent Assay (ELISA). Consistent with the transcriptomic results, increased protein expression in Npc1−/− cerebellar tissue was confirmed for cathepsin D, lysozyme, DAP12, and β2 microglobulin (Figure 6 and Figure S6). In contrast, APOE levels were not elevated. Both lysozyme and cathepsin D have been shown to be increased in NPC1 patient serum [44,45]; thus, they, along with other secreted proteins with elevate expression may be potential biomarkers of disease status in cerebral spinal fluid. Increased protein expression could indicate functional relevance to NPC1 pathology that can be explored in future studies.

2.7. Cell Type Specific Transcriptomes from Asymptomatic Three-Week-Old NPC1 Mice

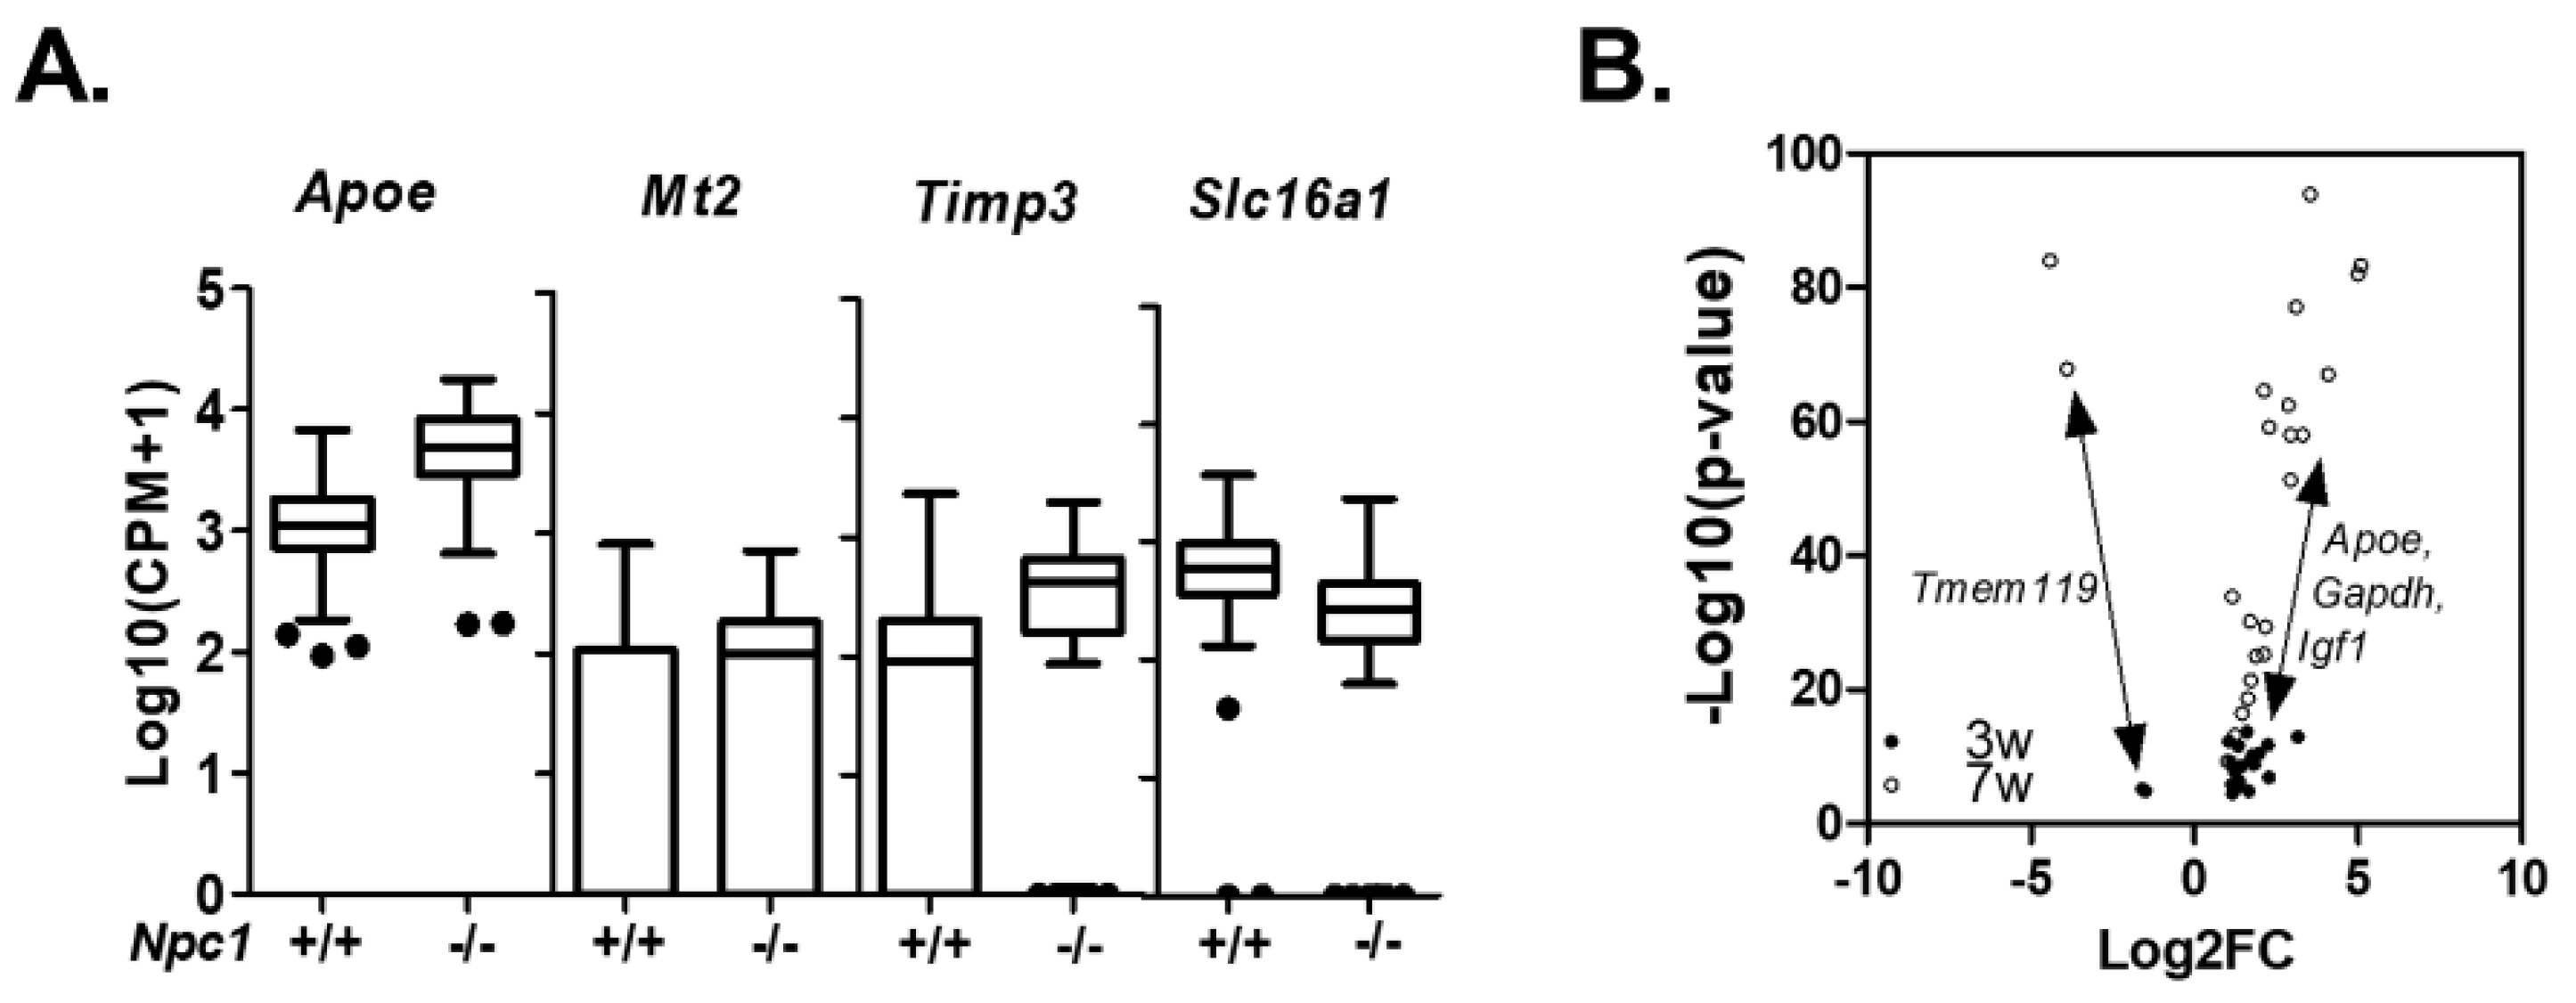
To explore early changes taking place in the cerebellum of Npc1−/− mice, we obtained scRNAseq data from asymptomatic 3-week-old animals. At this age there is significant unesterified cholesterol storage, but neither gliosis nor Purkinje neurons loss has yet occurred [16,46]. We obtained single-cell transcriptome data from 2738 Npc1+/+ and 1752 Npc1−/− cells. At 3-weeks of age tSNE clustering identified transcriptomes corresponding to the same cerebellar cell types that we identified at 7-weeks of age (Figure S7). Comparison of Npc1+/+ and Npc1−/− transcriptomes at 3-weeks of age showed no significant genotype differences for arachnoid barrier cells, vascular smooth muscle cells, vascular leptomeningeal cells, oligodendrocytes, ependymal cell, cerebellar granule neurons, stellate/basket neurons, unipolar brush neurons or Purkinje neurons. This surprising observation was not due to a low number of transcriptomes since at three weeks we had data for more individual transcriptomes for both genotypes than we had for the seven-week-old symptomatic mice. Significant differences were only observed for endothelial cells and microglia. In endothelial cells, we observed altered expression of four genes. These included increased expression of Apoe, Timp3, and Mt2 and decreased expression of Slc16a1 (Figure 7A, Table S2). Only Apoe also showed increased expression in Npc1−/− endothelial cells at both three and seven weeks of age. Differential expression of either Timp3 or Slc16a1 was not observed in other cell types at either three or seven weeks.

3. Discussion

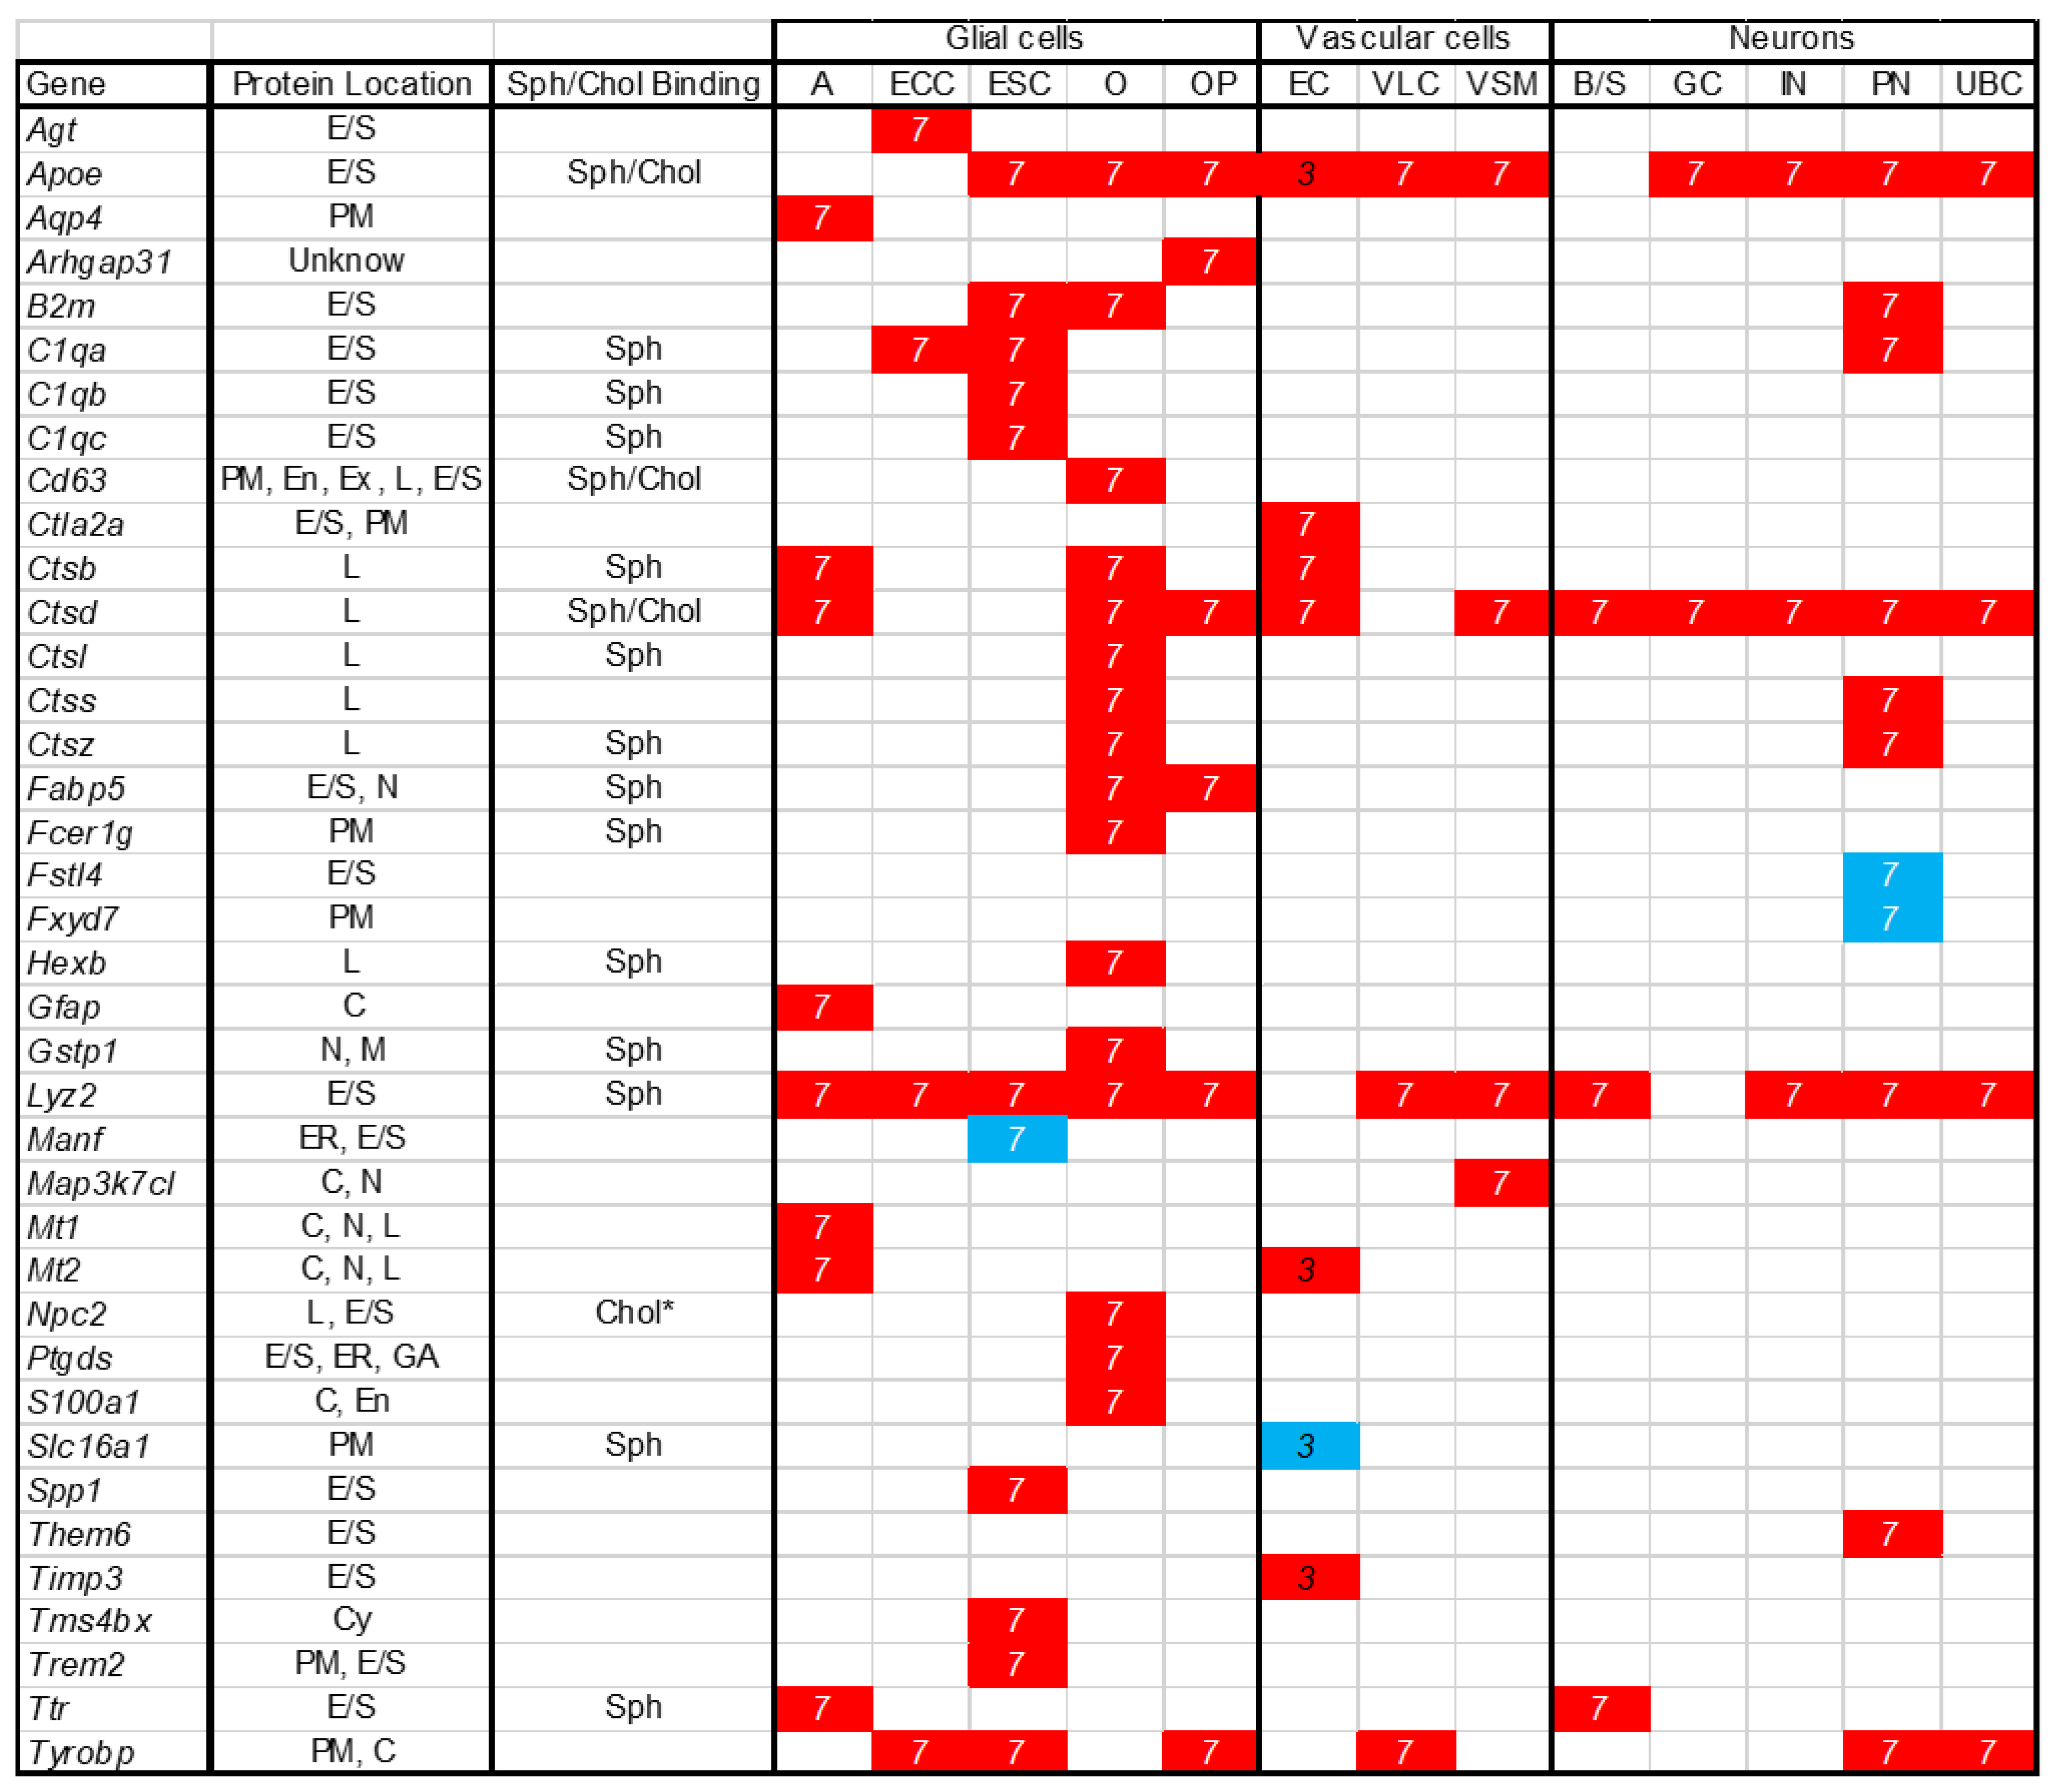
Comparison of transcriptome data between control and disease tissue can be used to obtain insight into biological processes. Although multiple groups, including ours, have studied whole tissue transcriptome data comparing NPC1 control and mutant cerebellar expression, to our knowledge this is the first report of single cell transcriptomic data from an NPC1 model system. Although scRNAseq is limited by the depth of coverage one can obtain, it has the potential to identify differential gene expression in individual cell types that could be masked when performing whole tissue RNAseq. In this paper we compare cerebellar scRNAseq data from Npc1+/+ and Npc1−/− mice at both seven weeks (symptomatic) and three weeks (asymptomatic) of age. We focused on the cerebellum given that Purkinje neuron loss is a major pathological finding in NPC1, and the resulting cerebellar ataxia is a cardinal symptom in this disorder. The cell type specific data on differentially expressed genes and the subcellular location of the encoded protein are summarized in Figure 8. This dataset should be useful in further understanding the components of the pathological cascade that leads to Purkinje neuron loss in NPC1 disease.
We did not anticipate either the limited number of differentially expressed transcripts or that the same set of transcripts (namely Apoe, Ctsd, Lyz2, and Tyrobp) would be identified in multiple different cell types in the seven-week data. The low number of differentially expressed genes identified might be due to limited sequencing depth inherent to scRNAseq. Arguing against this explanation is that we were able to, as expected from prior work, identity a large number of differentially expressed genes in microglia. Alternatively, the small number of genes with altered expression could indicate that cerebellar pathology is secondary to pathology in another brain region. The cerebellum is highly connected to the thalamus via the cerebellothalamic tract, and the thalamus is one of the earliest regions demonstrating neuropathology in the Npc1−/− mouse model [47]. Similarly, Gurda et al. [48] showed that autophagic defects in climbing fibers originating from the inferior olivary nuclei correlate both temporally and specially with Purkinje neuron loss in the NPC1 cat model. The concept that cerebellar pathology might be driven by pathology in another brain may explain how limited Purkinje neuron transduction by gene therapy results in significant Purkinje neuron sparing and survival [49].
Of the 38 genes identified as dysregulated in non-myeloid cells, 26% correspond to lysosomal proteins (Figure 8). This was anticipated based on prior work describing increased expression of lysosomal proteins in NPC1 models [50,51,52]. Of the 36 genes showing increased expression, 18 (50%) encode secreted proteins. Promoting lysosomal exocytosis has been proposed as a mechanism for clearance of stored cholesterol [53,54,55,56]. Thus, it is possible that this represents minor pathway that cells utilize to redistribute cholesterol resulting in increased expression of secreted proteins to compensate for their loss. Secreted proteins are also candidates for biomarkers [45]. Interestingly, 42% (16/38) of the dysregulated genes encode sphingolipid-binding proteins [57] (Figure 8). Sphingosine and sphingolipids accumulate in NPC1 and have been proposed to contribute to NPC pathology [58,59,60], and miglustat, a glycosphingolipid synthesis inhibitor, has shown efficacy in slowing NPC1 disease progression [61,62]. In contrast to the high fraction of sphingolipid-binding proteins, only three of the dysregulated genes (Apoe, Ctsd, and Cd63) encode proteins were shown by Hulce et al. [63] to interact with cholesterol. NPC2 is also known to bind cholesterol [64]. Determining whether this intersection between dysregulated gene expression and sphingolipid-binding proteins is of functional relevance will require future investigation.
As noted above, expression of four transcripts (ApoE, Ctsd, Lyz2, and Tyrobp) was elevated in multiple cerebellar cell types, including neurons, from Npc1−/− mice. ApoE encodes Apolipoprotein E (APOE). APOE is a major protein component of high-density lipoproteins that transport cholesterol between cells in the central nervous system. The APOE4 variant of APOE has been identified as a risk factor for Alzheimer’s disease [65] and is associated with increased disease severity in NPC1 patients [66]. Injured or stressed neurons increase synthesis of APOE [67], and this is consistent with our current observation of increased Apoe expression in basket/stellate, granule, unipolar and Purkinje neurons in Npc1−/− cerebella. Ctsd encodes cathepsin D, a lysosomal aspartyl protease. Increased expression of cathepsin D has been reported NPC1cerebellum and it has been proposed that increased cathepsin D enzyme activity could contribute to neuronal vulnerability in NPC1 [68]. Lyz2 encodes lysozyme, a glycoside hydrolase that functions in the innate immunity response against gram-positive bacteria. Increased expression of lysozyme has previously been observed in NPC1 [18,19,20,21,44,69]; however, this has been assumed to be secondary to immune cell activation. Our current data show that Lyz2 is highly expressed by multiple non-myeloid cell types including basket/stellate, unipolar brush, and Purkinje neurons. It is possible that elevated expression of lysozyme in Purkinje neurons functionally contributes to their loss. Prior work on Sanfilippo syndrome type B has shown although lysozyme expression is ubiquitous, lysozyme protein accumulates specifically in disease susceptible neurons, and this group correlated lysozyme protein expression with formation of hyperphosphorylated tau in the same neurons [70]. Alterations in tau function have previously been proposed as a component of the NPC1 pathology [71,72,73,74,75]. Tyrobp encodes TYRO protein tyrosine kinase binding protein (DAP12). DAP12 functions as a signaling adaptor protein for multiple plasma membrane receptors. DAP12 appears to have multiple functions including involvement in bone modeling, myelination and inflammation [76]. It is likely that TYROBP plays a role in neuroinflammation in that loss of DAP12 function delays disease progression in a mouse Alzheimer disease model [77]. However, TYROBP genetic variants may predispose to early onset Alzheimer disease [78]. Further work will be needed to determine if increased expression of these four genes is involved in the cerebellar pathology of NPC1 or if they can be utilized as biomarkers to monitor neurological disease.
Purkinje neuron loss and resulting cerebellar ataxia are cardinal features of NPC1, thus we were particularly interested in determining transcriptomic changes in NPC1 mutant Purkinje neurons. Our seven-week scRNAseq data was sensitive enough to separate anterior and posterior Purkinje neurons. In the surviving posterior Npc1−/− Purkinje neurons, we identified 11 genes with significantly altered expression. These included the four transcripts (ApoE, Ctsd, Lyz2, and Tyrobp) discussed above, two additional cathepsins (Ctss and Ctsz), B2m, C1qa, Fstl4, Fxyd7, and Them6. CTSS but not CTSZ protein expression has been shown to be increased in lysosomes isolated from NPC1 mutant mouse brain tissue [79]. Dysregulation of cathepsin enzymatic activity has been proposed to be a pathogenic factor in multiple lysosomal storage diseases including NPC1 [80,81,82]. B2m encodes Beta2-microglobulin and increased CSF levels have been associated with neuroinflammation [83]. C1qa encodes a subunit of complement C1. Increased expression of C1qa does not appear to contribute to NPC1 neuropathology since neurological disease progression is not altered in Npc1−/−:C1qa−/− double mutant mice [19]. Fxyd7 encodes a protein, FXYD7, which interacts with NaK-ATPase to regulate neuronal excitability [84]. Fstl4 encodes follistatin-related protein 4 precursor (SPIG1), a protein that can bind pro-BDNF (Brain Derived Neurotrophic Factor) and impairs it maturation [15]. It has been postulated that decreased BDNF levels in neurodegenerative disorders leads to an imbalance of excitatory/inhibitory neurotransmission that may contribute to neuronal loss [85]. Thus, increased Fxyd7 and Fstl4 expression may be a compensatory response to maintain normal excitability in Purkinje neurons resistant to neurodegeneration [86]. Them6 encodes a thioesterase of unknown function. These data on differential gene expression in Npc1−/− Purkinje neurons should be considered as hypothesis generating, and further work will be needed to determine if altered expression of any of these genes contributes directly to Purkinje neuron loss.
With respect to glial cells, oligodendrocytes and ependymal secretory cells had a relatively large number of transcriptomic changes in the Npc1−/− mice. Interestingly, oligodendrocytes were the only cell type in which we observed increased expression of Npc2. Npc1−/− oligodendrocytes also show increased expression of Ptgds (prostaglandin-H2 d-isomerase) and Gstp1 (glutathione S-transferase P1) two genes where increased expression has been proposed to be neuroprotective [87,88]. In addition to immune-related (B2m, C1qa, C1qb, C1qc, Lyz2, Tyrobp) and lysosomal (Ctsl, Ctss, Ctsz, Hexb) genes, ependymal secretory cells express a number of genes that may be in response to the ongoing neurodegeneration. Increased expression of Trem2, Manf, and Spp1 may be neuroprotective. TREM2 variants are associated with Alzheimer disease [89] and soluble TREM2 (sTREM2) enhances microglial uptake and degradation of Amyloid beta [90]. Cerebrospinal fluid (CSF) levels of sTREM2 may be an early biomarker for onset of Alzheimer disease [91]. Manf encodes mesencephalic astrocyte-derived neurotrophic factor and may protect against Aβ toxicity [92]. Spp1 encodes osteopontin, a cytokine that appears to have both neuroprotective and neurotoxic properties in neurodegenerative disorders [93]. Expression of solute carrier family 1 member 3 (Slc1a3) was utilized as a marker gene to identity astrocytes. When averaged across all cells, Slc1a3 expression was lower in Npc1−/− astrocytes. Although not significant in our dataset, this observation is consistent with western blot data showing decreased protein expression [94]. Npc1−/− astrocytes have transcriptomes that represent a continuum between the homeostatic (Slc1a3high) and reactive (Slc1a3low) states. Slc1a3 encodes the main ionotropic glutamate transporter in the cerebellum (GLAST, EAAT1). Glutamate is an excitatory neurotransmitter and elevated extracellular glutamate levels can be neurotoxic. Mutation of SLC1A3 underlies type-6 episodic ataxia [95]. Thus, if decreased expression of Slc1a3 leads to a functional deficiency of glutamate uptake by Npc1−/− astrocytes, then glutamate neurotoxicity may be a contributing factor in Purkinje neuron loss. Future work will focus on determining if these differentially expressed genes contribute to NPC1 neuropathology or if their products are potential biomarkers of NPC1 disease progression.
In order to obtain insight into pathogenic processes that occur prior to neuronal loss in the NPC1 mouse model, we also obtained single cell transcriptomic data on cerebellum isolated from asymptomatic three-week-old Npc1+/+ and Npc1−/− mice. We did not anticipate the paucity of transcriptomic changes at this age in cells other than microglia. Central nervous system cholesterol storage is present at birth and increases markedly between postnatal day 1 and seven weeks of age occurs early in the disease process and increases [96]. Significant unesterified cholesterol storage is present in Npc1−/− microglia at birth [16]. Cholesterol storage in Purkinje neurons can be visualized in Purkinje neurons by postnatal day 9 [97] and Purkinje neuron loss is first observed around postnatal day 40 [98]. Sphingoid bases and gangliosides are elevated at 4 weeks of age and increase significantly between 4 and 7 weeks of age [99]. Given that significant unesterified cholesterol and lipid storage is present in asymptomatic Npc1−/− mice, we expected to observe early transcriptome changes that preceded loss of Purkinje neurons. It is possible that cell autonomous death of Purkinje neurons is driven by low abundance transcripts that are not detectable with the current experimental approach. Alternatively, although significant unesterified cholesterol accumulation is present at this age, the 3-week time point may precede significant impact on Purkinje neuron function. However, we did observe a few early transcriptome differences in vascular endothelial cells and multiple changes in microglia.
Four transcripts (Apoe, Mt2, Timp3, and Slc16a1) showed altered expression in three-week Npc1−/− endothelial cells. Mt2 encodes metallothionein 2, and was also observed, along with Mt1, to also have increased expression in astrocytes from seven-week-old Npc1−/− mice. Metallothionines are cysteine rich proteins that are involved in the binding, transport and detoxification of heavy metals. Alterations of heavy metal homeostasis has been described in NPC1 [100]. These data suggest that this may be an early pathological component of NPC1. Timp3 encodes tissue inhibitor of matrix Metalloproteinase-3, a soluble protein that promotes blood–brain barrier integrity and is neuroprotective in traumatic brain injury models [101]. Slc16a1 encodes a proton-coupled transporter that transports monocarboxylates such as lactate, pyruvate and ketone bodies across the plasma membrane. This could reflect a switch toward glycolytic metabolism previously reported in NPC1 [16,46]. These data indicate that endothelial cells may be one of the first non-immune cell types to respond to initial NPC1 metabolic changes.
In stark contrast to the general lack of genotype related difference in neuronal transcriptomes, at three weeks of age, Npc1−/− microglia already show reduced expression of linage (Tmem119) and increased expression of activation (Cd68, Igf1 and Gapdh) markers. These observations are consistent with our prior data showing corresponding changes at the protein level [27]. This observation of microglial activation preceding significant changes in neuronal transcriptome changes is consistent with the recent observation by Kavetsky et al. [102] that showed increased interactions and engulfment of dendrites by microglia in the molecular layer prior to Purkinje neuron degeneration. The Npc1−/− microglia transcriptomes from seven-week-old mice can be classified as disease-associated microglia initially described in Alzheimer disease [29]. Our current data support the concept that NPC1 microglia have both neuroprotective and neurotoxic activity [27]. This dual role will confound efforts to treat NPC1 by general approaches to reduce microglia activity. Our data also clearly show that microglial activation is an early, potentially neuroprotective, process that proceeds significant alterations in neuronal transcriptomes.
Although microglia are the endogenous immune cells in the central nervous system, our scRNAseq data show that multiple Npc1−/− cell types express genes related to the innate immune response by seven weeks of age. In fact, this innate immunity response predominates in detectable transcriptomic changes. It is possible that these cells are responding to a “danger signal” to which the microglia are more responsive. Given the mixed neuroprotective and neurotoxic components of neuroinflammation, it is possible that the early specific microglial response may be neuroprotective, but the change to a general chronic innate immune response by nonimmune cells may be neurotoxic. It is thus plausible that targeting the general nonimmune cell innate immune response may be a potential therapeutic target and potentially more effective than therapies directed at microglia alone.
To our knowledge this is the first report of scRNAseq comparing transcriptomes from NPC1 and control cerebellar tissue. These data complement prior studies comparing whole tissue transcriptomes. This work should be considered an exploratory, hypothesis generating study. Future work will be needed to establish if proteins corresponding transcriptome changes can be exploited as biomarkers to monitor disease progression and therapy, or if the proposed pathological mechanisms contribute to NPC1 cerebellar neuropathology and can be exploited as therapeutic targets.

4. Materials and Methods

4.1. Mouse Models and Phenotypic Evaluation

All mouse experiments were approved by the NICHD Animal Care and Use Committee Protocol #15-002 and #18-002. BALB/c-Npc1+/− were obtained from the Jackson Laboratory (Bar Harbor, ME, USA). Heterozygous Npc1+/nih mice (BALB/cNctr-Npc1m1N/J strain) [103] were bred to obtain control (Npc1+/+) and mutant (Npc1−/−) littermates. Mice genotype were identified by PCR using the primers listed in Table S3. Water and mouse chow, control or with 290 mg·kg−1 PLX3397 (Selleckchem, Houston, TX, USA), were available ad libitum. Genotyping PCR was performed using ear punch DNA. A humane survival endpoint was defined as hunched posture, reluctance to move, inability to remain upright when moving, and weight loss >30% of peak weight.

4.2. Generation of Single-Cell Suspensions, Single-Cell Reverse Transcription, Library Preparation, and Sequencing from Mouse Cerebella

Resected cerebella were dissociated using papain dissociation for 15 min according to the manufacturer’s instruction for 15 min (Worthington Biochemical Corporation, Lakewood, NJ, USA). Cell dissociation quality, density and viability were evaluated by trypan blue staining and TC20 automated cell counter (Bio-Rad, Hercules, CA, USA) and direct observation of the cell. Two pairs of three- and seven-week-old mouse cerebella (Npc1+/+ and Npc1−/−) and were run separately on chromium 10x Single Cell Chips (10x Genomics, San Francisco, CA, USA). Libraries were prepared using Chromium Single Cell Library kit V3 for the seven-week-old samples and V3.1 for the three-week-old samples (10x Genomics) and sequenced on an Illumina HiSeq2500 using 100bp paired-end sequencing. Raw sequencing data were processed using Cell Ranger (v1.3.1, 10x Genomics) to produce gene-level counts for each cell in each sample. Each sample was aggregated to form a single matrix. All subsequent analysis was performed using Automated Single Cell Analysis Platform VI [104]. Cells with greater than 95% of genes with zero assigned reads were removed. Genes with counts in less than four cells were filtered out. Remaining blood cells (Hbb+) seen in the final data were manually excluded from the analysis. The data were normalized using Voom [105]. Hierarchical clustering on the t-SNE dataset using the K-mean method were applied. The lists of differentially expressed genes, identified using limma [106], for each cluster were generated by testing for genes that had a log2 fold change greater than one between cells in one cluster compared with all other cells listed in Table S1. Pathway analysis using gene ontology results are in Table S3. Cell population with less than 10 events were not included in the comparisons. Raw data are available on SRA under the accession number: PRJNA606815.

4.3. Immunofluorescence and Flow Cytometry Analysis

Brain cerebellar tissue was processed as described. Mice were euthanized at seven weeks by CO2 asphyxiation and transcardially perfused with ice-cold 4% paraformaldehyde in PBS, pH 7.4. The brains were post fixed in 4% paraformaldehyde solution for 24 h and then cryoprotected in 30% sucrose (Sigma-Aldrich Millipore, St. Louis, MO, USA). Cerebellar tissues were cryostat-sectioned parasagittally (20 μm) and floating sections were collected in PBS with 0.25% Triton X-100 (Sigma-Aldrich Millipore, St. Louis, MO, USA). Sections were stained at 4 °C overnight with the antibody and dyes listed in Table S3. Images were taken using a Zeiss Axio Observer Z1 microscope fitted with an automated scanning stage, Colibri II LED illumination, and Zeiss ZEN2 software using a high-res AxioCam MRm camera and a 20× objective (Zeiss, Oberkochen Germany). Each fluorophore channel was pseudo-colored in ZEN2, exported as .czi file, and analyzed using ImageJ [107]. Gating strategy and cell preparation for FACS analysis on mice cerebella are extensively described in [16]. Mean Fluorescence intensities were extracted using FlowJo software (TreeStar, Ashland, Covington, OR, USA).

4.4. Statistical and Informatic Analysis

All statistical comparisons outside of the scRNAseq analysis were performed with GraphPad Prism 5 software (San Diego, CA, USA). All box and whiskers plot display the Tukey method and have Mann-Whitney test p < 0.01 when comparing Npc1+/+ to Npc1−/−. For the lifespan estimation, data were plotted in Kaplan–Meier survival curves, using the log rank test for survival analysis, plotting percent survival as a function of time in days. Results were considered significant if the p value was <0.05. Figures and Tables were created in Microsoft Office 365 or 2016 (Redmond, WA, USA).

Supplementary Materials

Supplementary material can be found at https://www.mdpi.com/1422-0067/21/15/5368/s1.

Author Contributions

Conceptualization, A.C. and F.D.P.; methodology, A.C.; software, A.C., K.M., and J.I.; formal analysis, A.C., F.N., K.M., M.F., and J.C.Y.; investigation, A.C., J.C.Y., M.F.; resources, J.S.-V., J.I., F.N., C.A.W., and N.X.C.; data curation, A.C., K.M., and J.I.; writing—original draft preparation, A.C.; writing—review and editing, A.C., F.D.P., M.F., N.X.C., C.A.W., J.C.Y., F.N., and J.S.-V.; visualization, A.C., K.M.; supervision, A.C. and F.D.P.; project administration, N.X.C., C.A.W., and F.D.P.; funding acquisition, F.D.P. All authors have read and agreed to the published version of the manuscript.

Funding

This research was funded by the intramural research programs of the Eunice Kennedy Shriver National Institute of Child Health and Human Development (ZIA HD000139), the National Human Genome Research Institute, and the National Institute of Arthritis and Musculoskeletal and Skin Disease. This work was also supported by a grant from the Ara Parseghian Medical Research Foundation.

Acknowledgments

We would like to thank the National Heart Lung and Blood flow cytometry cores for assistance with cell isolation and analysis and the Eunice Kennedy Shriver National Institute of Child Health and Human development Molecular Genomics Core for library preparation and sequencing. Additionally, we appreciate the assistance of the Eunice Kennedy Shriver National Institute of Child Health and Human development animal care staff.

Conflicts of Interest

The authors declare no conflicts of interest.

Abbreviations

ADAlzheimer’s disease
ALSAmyotrophic Lateral Sclerosis
BDNFBrain Derived Neurotrophic Factor
CNSCentral Nervous System
CPMCount Per Million
CSFCerebral Spinal Fluid
DAMDisease Associated Microglia
EAAT1Excitatory Amino Acid Transporter 1
ELISAEnzyme Linked Immunosorbent Assay
FACSFluorescence-Activated Cell Sorting
FCFold Change
GABAGamma-AminoButyric Acid
GLASTGlutamate Aspartate Transporter 1
NEUNNeuronal Nuclei
NPCNiemann-Pick disease, type C
PBSPhosphate Buffer Solution
PCAPrinciple Component Analysis
PCRPolymerase Chain Reaction
scRNAseqSingle Cell Ribonucleic Acid Sequencing
SRASequence Read Archive
TNFTumor Necrosis Factor
t-SNEt-distributed Stochastic Neighbor Embedding
UMIUnique Molecular Identifier

References

  1. Carstea, E.D.; Morris, J.A.; Coleman, K.G.; Loftus, S.K.; Zhang, D.; Cummings, C.; Gu, J.; Rosenfeld, M.A.; Pavan, W.J.; Krizman, D.B.; et al. Niemann-Pick C1 disease gene: Homology to mediators of cholesterol homeostasis. Science 1997, 277, 228–231. [Google Scholar] [CrossRef] [PubMed] [Green Version]
  2. Peake, K.B.; Vance, J.E. Normalization of cholesterol homeostasis by 2-hydroxypropyl-beta-cyclodextrin in neurons and glia from Niemann-Pick C1 (NPC1)-deficient mice. J. Biol. Chem. 2012, 287, 9290–9298. [Google Scholar] [CrossRef] [Green Version]
  3. Pentchev, P.G.; Comly, M.E.; Kruth, H.S.; Patel, S.; Proestel, M.; Weintroub, H. The cholesterol storage disorder of the mutant BALB/c mouse. A primary genetic lesion closely linked to defective esterification of exogenously derived cholesterol and its relationship to human type C Niemann-Pick disease. J. Biol. Chem. 1986, 261, 2772–2777. [Google Scholar]
  4. Vanier, M.T. Lipid changes in Niemann-Pick disease type C brain: Personal experience and review of the literature. Neurochem. Res. 1999, 24, 481–489. [Google Scholar] [CrossRef] [PubMed]
  5. Vanier, M.T. Niemann-Pick disease type C. Orphanet J. Rare Dis. 2010, 5, 16. [Google Scholar] [CrossRef] [PubMed] [Green Version]
  6. Wassif, C.A.; Cross, J.L.; Iben, J.; Sanchez-Pulido, L.; Cougnoux, A.; Platt, F.M.; Ory, D.S.; Ponting, C.P.; Bailey-Wilson, J.E.; Biesecker, L.G.; et al. High incidence of unrecognized visceral/neurological late-onset Niemann-Pick disease, type C1, predicted by analysis of massively parallel sequencing data sets. Genet. Med. 2016, 18, 41–48. [Google Scholar] [CrossRef] [PubMed] [Green Version]
  7. Yerushalmi, B.; Sokol, R.J.; Narkewicz, M.R.; Smith, D.; Ashmead, J.W.; Wenger, D.A. Niemann-pick disease type C in neonatal cholestasis at a North American Center. J. Pediatric. Gastroenterol. Nutr. 2002, 35, 44–50. [Google Scholar] [CrossRef] [Green Version]
  8. Crocker, A.C.; Farber, S. Niemann-Pick disease: A review of eighteen patients. Medicine 1958, 37, 1–95. [Google Scholar] [CrossRef]
  9. Patterson, M. Niemann-Pick Disease Type C. In GeneReviews®; Adam, M.P., Ardinger, H.H., Pagon, R.A., Wallace, S.E., Bean, L.J.H., Stephens, K., Amemiya, A., Eds.; University of Washington: Seattle, WA, USA, 1993. [Google Scholar]
  10. Sotelo, C. Cellular and genetic regulation of the development of the cerebellar system. Prog. Neurobiol. 2004, 72, 295–339. [Google Scholar] [CrossRef]
  11. Schmahmann, J.D. The role of the cerebellum in cognition and emotion: Personal reflections since 1982 on the dysmetria of thought hypothesis, and its historical evolution from theory to therapy. Neuropsychol. Rev. 2010, 20, 236–260. [Google Scholar] [CrossRef]
  12. Sillitoe, R.V.; Fu, Y.; Watson, C. Cerebellum. In The Mouse Nervous System; Elsevier: New York, NY, USA, 2012; pp. 360–397. [Google Scholar]
  13. Sarna, J.R.; Larouche, M.; Marzban, H.; Sillitoe, R.V.; Rancourt, D.E.; Hawkes, R. Patterned Purkinje cell degeneration in mouse models of Niemann-Pick type C disease. J. Comp. Neurol. 2003, 456, 279–291. [Google Scholar] [CrossRef]
  14. Ko, D.C.; Milenkovic, L.; Beier, S.M.; Manuel, H.; Buchanan, J.; Scott, M.P. Cell-autonomous death of cerebellar purkinje neurons with autophagy in Niemann-Pick type C disease. PLoS Genet. 2005, 1, 81–95. [Google Scholar] [CrossRef]
  15. Suzuki, M.; Sugimoto, Y.; Ohsaki, Y.; Ueno, M.; Kato, S.; Kitamura, Y.; Hosokawa, H.; Davies, J.P.; Ioannou, Y.A.; Vanier, M.T.; et al. Endosomal accumulation of Toll-like receptor 4 causes constitutive secretion of cytokines and activation of signal transducers and activators of transcription in Niemann-Pick disease type C (NPC) fibroblasts: A potential basis for glial cell activation in the NPC brain. J. Neurosci. 2007, 27, 1879–1891. [Google Scholar] [CrossRef] [Green Version]
  16. Cougnoux, A.; Drummond, R.A.; Collar, A.L.; Iben, J.R.; Salman, A.; Westgarth, H.; Wassif, C.A.; Cawley, N.X.; Farhat, N.Y.; Ozato, K.; et al. Microglia activation in Niemann-Pick disease, type C1 is amendable to therapeutic intervention. Hum. Mol. Genet. 2018, 27, 2076–2089. [Google Scholar] [CrossRef] [Green Version]
  17. Zhang, M.; Strnatka, D.; Donohue, C.; Hallows, J.L.; Vincent, I.; Erickson, R.P. Astrocyte-only Npc1 reduces neuronal cholesterol and triples life span of Npc1−/− mice. J. Neurosci. Res. 2008, 86, 2848–2856. [Google Scholar] [CrossRef] [Green Version]
  18. Liao, G.H.; Wen, Z.N.; Irizarry, K.; Huang, Y.; Mitsouras, K.; Darmani, M.; Leon, T.; Shi, L.M.; Bi, X.N. Abnormal gene expression in cerebellum of Npc1−/− mice during postnatal development. Brain Res. 2010, 1325, 128–140. [Google Scholar] [CrossRef] [Green Version]
  19. Lopez, M.E.; Klein, A.D.; Scott, M.P. Complement is dispensable for neurodegeneration in Niemann-Pick disease type C. J. Neuroinflamm. 2012, 9, 216. [Google Scholar] [CrossRef] [Green Version]
  20. Martin, K.B.; Williams, I.M.; Cluzeau, C.V.; Cougnoux, A.; Dale, R.K.; Iben, J.R.; Cawley, N.X.; Wassif, C.A.; Porter, F.D. Identification of Novel Pathways Associated with Patterned Cerebellar Purkinje Neuron Degeneration in Niemann-Pick Disease, Type C1. Int. J. Mol. Sci. 2019, 21. [Google Scholar] [CrossRef] [Green Version]
  21. Vazquez, M.C.; del Pozo, T.; Robledo, F.A.; Carrasco, G.; Pavez, L.; Olivares, F.; Gonzalez, M.; Zanlungo, S. Alteration of Gene Expression Profile in Niemann-Pick Type C Mice Correlates with Tissue Damage and Oxidative Stress. PLoS ONE 2011, 6. [Google Scholar] [CrossRef] [PubMed] [Green Version]
  22. Rosenberg, A.B.; Roco, C.M.; Muscat, R.A.; Kuchina, A.; Sample, P.; Yao, Z.; Graybuck, L.T.; Peeler, D.J.; Mukherjee, S.; Chen, W.; et al. Single-cell profiling of the developing mouse brain and spinal cord with split-pool barcoding. Science 2018, 360, 176–182. [Google Scholar] [CrossRef] [Green Version]
  23. Zeisel, A.; Hochgerner, H.; Lonnerberg, P.; Johnsson, A.; Memic, F.; van der Zwan, J.; Haring, M.; Braun, E.; Borm, L.E.; La Manno, G.; et al. Molecular Architecture of the Mouse Nervous System. Cell 2018, 174, 999–1014.e1022. [Google Scholar] [CrossRef] [Green Version]
  24. Carter, R.A.; Bihannic, L.; Rosencrance, C.; Hadley, J.L.; Tong, Y.; Phoenix, T.N.; Natarajan, S.; Easton, J.; Northcott, P.A.; Gawad, C. A Single-Cell Transcriptional Atlas of the Developing Murine Cerebellum. Curr. Biol. 2018. [Google Scholar] [CrossRef] [Green Version]
  25. Gokce, O.; Stanley, G.M.; Treutlein, B.; Neff, N.F.; Camp, J.G.; Malenka, R.C.; Rothwell, P.E.; Fuccillo, M.V.; Sudhof, T.C.; Quake, S.R. Cellular Taxonomy of the Mouse Striatum as Revealed by Single-Cell RNA-Seq. Cell Rep. 2016, 16, 1126–1137. [Google Scholar] [CrossRef] [Green Version]
  26. Cho, S.M.; Vardi, A.; Platt, N.; Futerman, A.H. Absence of infiltrating peripheral myeloid cells in the brains of mouse models of lysosomal storage disorders. J. Neurochem. 2019, 148, 625–638. [Google Scholar] [CrossRef]
  27. Cougnoux, A.; Clifford, S.; Salman, A.; Ng, S.L.; Bertin, J.; Porter, F.D. Necroptosis inhibition as a therapy for Niemann-Pick disease, type C1: Inhibition of RIP kinases and combination therapy with 2-hydroxypropyl-beta-cyclodextrin. Mol. Genet. Metab. 2018, 125, 345–350. [Google Scholar] [CrossRef]
  28. Prinz, M.; Tay, T.L.; Wolf, Y.; Jung, S. Microglia: Unique and common features with other tissue macrophages. Acta Neuropathol. 2014, 128, 319–331. [Google Scholar] [CrossRef]
  29. Keren-Shaul, H.; Spinrad, A.; Weiner, A.; Matcovitch-Natan, O.; Dvir-Szternfeld, R.; Ulland, T.K.; David, E.; Baruch, K.; Lara-Astaiso, D.; Toth, B.; et al. A Unique Microglia Type Associated with Restricting Development of Alzheimer‘s Disease. Cell 2017, 169, 1276–1290.e1217. [Google Scholar] [CrossRef]
  30. Cougnoux, A.; Drummond, R.A.; Fellmeth, M.; Navid, F.; Collar, A.L.; Iben, J.; Kulkarni, A.B.; Pickel, J.; Schiffmann, R.; Wassif, C.A.; et al. Unique molecular signature in mucolipidosis type IV microglia. J. Neuroinflamm. 2019, 16, 276. [Google Scholar] [CrossRef] [Green Version]
  31. Lopez-Lopez, C.; LeRoith, D.; Torres-Aleman, I. Insulin-like growth factor I is required for vessel remodeling in the adult brain. Proc. Natl. Acad. Sci. USA 2004, 101, 9833–9838. [Google Scholar] [CrossRef] [Green Version]
  32. Martinez-Lozada, Z.; Guillem, A.M.; Robinson, M.B. Transcriptional Regulation of Glutamate Transporters: From Extracellular Signals to Transcription Factors. Adv. Pharm. 2016, 76, 103–145. [Google Scholar] [CrossRef] [Green Version]
  33. Liddelow, S.A.; Guttenplan, K.A.; Clarke, L.E.; Bennett, F.C.; Bohlen, C.J.; Schirmer, L.; Bennett, M.L.; Munch, A.E.; Chung, W.S.; Peterson, T.C.; et al. Neurotoxic reactive astrocytes are induced by activated microglia. Nature 2017, 541, 481–487. [Google Scholar] [CrossRef] [PubMed]
  34. Moore, S.A. The Spinal Ependymal Layer in Health and Disease. Vet. Pathol. 2016, 53, 746–753. [Google Scholar] [CrossRef] [Green Version]
  35. Mishra, P.K.; Teale, J.M. Transcriptome analysis of the ependymal barrier during murine neurocysticercosis. J. Neuroinflamm. 2012, 9, 141. [Google Scholar] [CrossRef] [PubMed] [Green Version]
  36. Shah, P.T.; Stratton, J.A.; Stykel, M.G.; Abbasi, S.; Sharma, S.; Mayr, K.A.; Koblinger, K.; Whelan, P.J.; Biernaskie, J. Single-Cell Transcriptomics and Fate Mapping of Ependymal Cells Reveals an Absence of Neural Stem Cell Function. Cell 2018, 173, 1045–1057. [Google Scholar] [CrossRef] [PubMed] [Green Version]
  37. Ango, F.; Wu, C.; Van der Want, J.J.; Wu, P.; Schachner, M.; Huang, Z.J. Bergmann glia and the recognition molecule CHL1 organize GABAergic axons and direct innervation of Purkinje cell dendrites. PLoS Biol. 2008, 6, e103. [Google Scholar] [CrossRef]
  38. Haines, D.E.; Manto, M.-U.J.T.C. E. Mugnaini and A. Floris, The Unipolar Brush Cell: A Neglected Neuron of the Mammalian Cerebellar Cortex, J Comp Neurol, 339:174–180, 1994: Elucidating a Cell of the Cerebellar Cortex that Largely Evaded Detection. Cerebellum 2015, 14, s12311–s015. [Google Scholar] [CrossRef] [Green Version]
  39. Kreko-Pierce, T.; Boiko, N.; Harbidge, D.G.; Marcus, D.C.; Stockand, J.D.; Pugh, J.R. Cerebellar Ataxia Caused by Type II Unipolar Brush Cell Dysfunction in the Asic5 Knockout Mouse. Sci. Rep. 2020, 10, 2168. [Google Scholar] [CrossRef]
  40. Higashi, Y.; Murayama, S.; Pentchev, P.G.; Suzuki, K. Cerebellar degeneration in the Niemann-Pick type C mouse. Acta Neuropathol. 1993, 85, 175–184. [Google Scholar] [CrossRef]
  41. Morris, J.A.; Royall, J.J.; Bertagnolli, D.; Boe, A.F.; Burnell, J.J.; Byrnes, E.J.; Copeland, C.; Desta, T.; Fischer, S.R.; Goldy, J.; et al. Divergent and nonuniform gene expression patterns in mouse brain. Proc. Natl. Acad. Sci. USA 2010, 107, 19049–19054. [Google Scholar] [CrossRef] [Green Version]
  42. Chung, C.; Puthanveetil, P.; Ory, D.S.; Lieberman, A.P. Genetic and pharmacological evidence implicates cathepsins in Niemann-Pick C cerebellar degeneration. Hum. Mol. Genet. 2016, 25, 1434–1446. [Google Scholar] [CrossRef] [Green Version]
  43. Liu, Y.; Beyer, A.; Aebersold, R. On the Dependency of Cellular Protein Levels on mRNA Abundance. Cell 2016, 165, 535–550. [Google Scholar] [CrossRef] [PubMed] [Green Version]
  44. Alam, M.S.; Getz, M.; Safeukui, I.; Yi, S.; Tamez, P.; Shin, J.; Velazquez, P.; Haldar, K. Genomic expression analyses reveal lysosomal, innate immunity proteins, as disease correlates in murine models of a lysosomal storage disorder. PLoS ONE 2012, 7, e48273. [Google Scholar] [CrossRef] [PubMed]
  45. Cluzeau, C.V.; Watkins-Chow, D.E.; Fu, R.; Borate, B.; Yanjanin, N.; Dail, M.K.; Davidson, C.D.; Walkley, S.U.; Ory, D.S.; Wassif, C.A.; et al. Microarray expression analysis and identification of serum biomarkers for Niemann-Pick disease, type C1. Hum. Mol. Genet. 2012, 21, 3632–3646. [Google Scholar] [CrossRef] [PubMed] [Green Version]
  46. Kennedy, B.E.; Hundert, A.S.; Goguen, D.; Weaver, I.C.; Karten, B. Presymptomatic Alterations in Amino Acid Metabolism and DNA Methylation in the Cerebellum of a Murine Model of Niemann-Pick Type C Disease. Am. J. Pathol. 2016, 186, 1582–1597. [Google Scholar] [CrossRef] [PubMed] [Green Version]
  47. Pressey, S.N.; Smith, D.A.; Wong, A.M.; Platt, F.M.; Cooper, J.D. Early glial activation, synaptic changes and axonal pathology in the thalamocortical system of Niemann-Pick type C1 mice. Neurobiol. Dis. 2012, 45, 1086–1100. [Google Scholar] [CrossRef] [PubMed] [Green Version]
  48. Gurda, B.L.; Bagel, J.H.; Fisher, S.J.; Schultz, M.L.; Lieberman, A.P.; Hand, P.; Vite, C.H.; Swain, G.P. LC3 Immunostaining in the Inferior Olivary Nuclei of Cats With Niemann-Pick Disease Type C1 Is Associated With Patterned Purkinje Cell Loss. J. Neuropathol. Exp. Neurol. 2018, 77, 229–245. [Google Scholar] [CrossRef]
  49. Chandler, R.J.; Williams, I.M.; Gibson, A.L.; Davidson, C.D.; Incao, A.A.; Hubbard, B.T.; Porter, F.D.; Pavan, W.J.; Venditti, C.P. Systemic AAV9 gene therapy improves the lifespan of mice with Niemann-Pick disease, type C1. Hum. Mol. Genet. 2017, 26, 52–64. [Google Scholar] [CrossRef]
  50. Cologna, S.M.; Jiang, X.S.; Backlund, P.S.; Cluzeau, C.V.; Dail, M.K.; Yanjanin, N.M.; Siebel, S.; Toth, C.L.; Jun, H.S.; Wassif, C.A.; et al. Quantitative proteomic analysis of Niemann-Pick disease, type C1 cerebellum identifies protein biomarkers and provides pathological insight. PLoS ONE 2012, 7, e47845. [Google Scholar] [CrossRef]
  51. Pergande, M.R.; Zarate, E.; Haney-Ball, C.; Davidson, C.D.; Scesa, G.; Givogri, M.I.; Bongarzone, E.R.; Cologna, S.M. Standard-flow LC and thermal focusing ESI elucidates altered liver proteins in late stage Niemann-Pick, type C1 disease. Bioanalysis 2019, 11, 1067–1083. [Google Scholar] [CrossRef]
  52. Subramanian, K.; Rauniyar, N.; Lavallee-Adam, M.; Yates, J.R., III; Balch, W.E. Quantitative Analysis of the Proteome Response to the Histone Deacetylase Inhibitor (HDACi) Vorinostat in Niemann-Pick Type C1 disease. Mol. Cell Proteom. 2017, 16, 1938–1957. [Google Scholar] [CrossRef] [Green Version]
  53. Feltes, M.; Gale, S.E.; Moores, S.; Ory, D.S.; Schaffer, J.E. Monitoring the itinerary of lysosomal cholesterol in Niemann-Pick Type C1-deficient cells after cyclodextrin treatment. J. Lipid Res. 2020, 61, 403–412. [Google Scholar] [CrossRef] [PubMed] [Green Version]
  54. Xu, M.; Liu, K.; Swaroop, M.; Porter, F.D.; Sidhu, R.; Firnkes, S.; Ory, D.S.; Marugan, J.J.; Xiao, J.; Southall, N.; et al. delta-Tocopherol reduces lipid accumulation in Niemann-Pick type C1 and Wolman cholesterol storage disorders. J. Biol. Chem. 2012, 287, 39349–39360. [Google Scholar] [CrossRef] [PubMed] [Green Version]
  55. Vacca, F.; Vossio, S.; Mercier, V.; Moreau, D.; Johnson, S.; Scott, C.C.; Montoya, J.P.; Moniatte, M.; Gruenberg, J. Cyclodextrin triggers MCOLN1-dependent endo-lysosome secretion in Niemann-Pick type C cells. J. Lipid Res. 2019, 60, 832–843. [Google Scholar] [CrossRef] [PubMed] [Green Version]
  56. Chen, F.W.; Li, C.; Ioannou, Y.A. Cyclodextrin induces calcium-dependent lysosomal exocytosis. PLoS ONE 2010, 5, e15054. [Google Scholar] [CrossRef] [PubMed] [Green Version]
  57. Haberkant, P.; Stein, F.; Hoglinger, D.; Gerl, M.J.; Brugger, B.; Van Veldhoven, P.P.; Krijgsveld, J.; Gavin, A.C.; Schultz, C. Bifunctional Sphingosine for Cell-Based Analysis of Protein-Sphingolipid Interactions. ACS Chem. Biol. 2016, 11, 222–230. [Google Scholar] [CrossRef]
  58. Lloyd-Evans, E.; Morgan, A.J.; He, X.; Smith, D.A.; Elliot-Smith, E.; Sillence, D.J.; Churchill, G.C.; Schuchman, E.H.; Galione, A.; Platt, F.M. Niemann-Pick disease type C1 is a sphingosine storage disease that causes deregulation of lysosomal calcium. Nat. Med. 2008, 14, 1247–1255. [Google Scholar] [CrossRef]
  59. Rodriguez-Lafrasse, C.; Rousson, R.; Pentchev, P.G.; Louisot, P.; Vanier, M.T. Free sphingoid bases in tissues from patients with type C Niemann-Pick disease and other lysosomal storage disorders. Biochim. Biophys. Acta 1994, 1226, 138–144. [Google Scholar] [CrossRef]
  60. te Vruchte, D.; Lloyd-Evans, E.; Veldman, R.J.; Neville, D.C.; Dwek, R.A.; Platt, F.M.; van Blitterswijk, W.J.; Sillence, D.J. Accumulation of glycosphingolipids in Niemann-Pick C disease disrupts endosomal transport. J. Biol. Chem. 2004, 279, 26167–26175. [Google Scholar] [CrossRef] [Green Version]
  61. Patterson, M.C.; Garver, W.S.; Giugliani, R.; Imrie, J.; Jahnova, H.; Meaney, F.J.; Nadjar, Y.; Vanier, M.T.; Moneuse, P.; Morand, O.; et al. Long-term survival outcomes of patients with Niemann-Pick disease type C receiving miglustat treatment: A large retrospective observational study. J. Inherit. Metab. Dis. 2020. [Google Scholar] [CrossRef]
  62. Patterson, M.C.; Mengel, E.; Vanier, M.T.; Moneuse, P.; Rosenberg, D.; Pineda, M. Treatment outcomes following continuous miglustat therapy in patients with Niemann-Pick disease Type C: A final report of the NPC Registry. Orphanet J. Rare Dis. 2020, 15, 104. [Google Scholar] [CrossRef] [Green Version]
  63. Hulce, J.J.; Cognetta, A.B.; Niphakis, M.J.; Tully, S.E.; Cravatt, B.F. Proteome-wide mapping of cholesterol-interacting proteins in mammalian cells. Nat. Methods 2013, 10, 259–264. [Google Scholar] [CrossRef] [PubMed] [Green Version]
  64. Friedland, N.; Liou, H.L.; Lobel, P.; Stock, A.M. Structure of a cholesterol-binding protein deficient in Niemann-Pick type C2 disease. Proc. Natl. Acad. Sci. USA 2003, 100, 2512–2517. [Google Scholar] [CrossRef] [PubMed] [Green Version]
  65. Liu, C.C.; Liu, C.C.; Kanekiyo, T.; Xu, H.; Bu, G. Apolipoprotein E and Alzheimer disease: Risk, mechanisms and therapy. Nat. Rev. Neurol. 2013, 9, 106–118. [Google Scholar] [CrossRef] [Green Version]
  66. Fu, R.; Yanjanin, N.M.; Elrick, M.J.; Ware, C.; Lieberman, A.P.; Porter, F.D. Apolipoprotein E genotype and neurological disease onset in Niemann-Pick disease, type C1. Am. J. Med. Genet. A 2012, 158A, 2775–2780. [Google Scholar] [CrossRef] [PubMed] [Green Version]
  67. Xu, Q.; Bernardo, A.; Walker, D.; Kanegawa, T.; Mahley, R.W.; Huang, Y. Profile and regulation of apolipoprotein E (ApoE) expression in the CNS in mice with targeting of green fluorescent protein gene to the ApoE locus. J. Neurosci. 2006, 26, 4985–4994. [Google Scholar] [CrossRef] [PubMed]
  68. Amritraj, A.; Peake, K.; Kodam, A.; Salio, C.; Merighi, A.; Vance, J.E.; Kar, S. Increased activity and altered subcellular distribution of lysosomal enzymes determine neuronal vulnerability in Niemann-Pick type C1-deficient mice. Am. J. Pathol. 2009, 175, 2540–2556. [Google Scholar] [CrossRef] [PubMed] [Green Version]
  69. Alam, M.S.; Getz, M.; Yi, S.; Kurkewich, J.; Safeukui, I.; Haldar, K. Plasma signature of neurological disease in the monogenetic disorder Niemann-Pick Type C. J. Biol. Chem. 2014, 289, 8051–8066. [Google Scholar] [CrossRef] [Green Version]
  70. Ohmi, K.; Kudo, L.C.; Ryazantsev, S.; Zhao, H.Z.; Karsten, S.L.; Neufeld, E.F. Sanfilippo syndrome type B, a lysosomal storage disease, is also a tauopathy. Proc. Natl. Acad. Sci. USA 2009, 106, 8332–8337. [Google Scholar] [CrossRef] [Green Version]
  71. Distl, R.; Treiber-Held, S.; Albert, F.; Meske, V.; Harzer, K.; Ohm, T.G. Cholesterol storage and tau pathology in Niemann-Pick type C disease in the brain. J. Pathol. 2003, 200, 104–111. [Google Scholar] [CrossRef]
  72. Mattsson, N.; Zetterberg, H.; Bianconi, S.; Yanjanin, N.M.; Fu, R.; Mansson, J.E.; Porter, F.D.; Blennow, K. Miglustat treatment may reduce cerebrospinal fluid levels of the axonal degeneration marker tau in niemann-pick type C. JIMD Rep. 2012, 3, 45–52. [Google Scholar] [CrossRef] [Green Version]
  73. Pacheco, C.D.; Elrick, M.J.; Lieberman, A.P. Tau deletion exacerbates the phenotype of Niemann-Pick type C mice and implicates autophagy in pathogenesis. Hum. Mol. Genet. 2009, 18, 956–965. [Google Scholar] [CrossRef] [PubMed] [Green Version]
  74. Villemagne, V.L.; Velakoulis, D.; Dore, V.; Bozinoski, S.; Masters, C.L.; Rowe, C.C.; Walterfang, M. Imaging of tau deposits in adults with Niemann-Pick type C disease: A case-control study. Eur. J. Nucl. Med. Mol. Imaging 2019, 46, 1132–1138. [Google Scholar] [CrossRef] [PubMed]
  75. Yu, W.; Ko, M.; Yanagisawa, K.; Michikawa, M. Neurodegeneration in heterozygous Niemann-Pick type C1 (NPC1) mouse: Implication of heterozygous NPC1 mutations being a risk for tauopathy. J. Biol. Chem. 2005, 280, 27296–27302. [Google Scholar] [CrossRef] [PubMed] [Green Version]
  76. Colonna, M. DAP12 signaling: From immune cells to bone modeling and brain myelination. J. Clin. Investig. 2003, 111, 313–314. [Google Scholar] [CrossRef]
  77. Audrain, M.; Haure-Mirande, J.V.; Wang, M.; Kim, S.H.; Fanutza, T.; Chakrabarty, P.; Fraser, P.; St George-Hyslop, P.H.; Golde, T.E.; Blitzer, R.D.; et al. Integrative approach to sporadic Alzheimer‘s disease: Deficiency of TYROBP in a tauopathy mouse model reduces C1q and normalizes clinical phenotype while increasing spread and state of phosphorylation of tau. Mol. Psychiatry 2019, 24, 1383–1397. [Google Scholar] [CrossRef] [Green Version]
  78. Pottier, C.; Ravenscroft, T.A.; Brown, P.H.; Finch, N.A.; Baker, M.; Parsons, M.; Asmann, Y.W.; Ren, Y.; Christopher, E.; Levitch, D.; et al. TYROBP genetic variants in early-onset Alzheimer‘s disease. Neurobiol. Aging 2016, 48, 222.e9–222.e15. [Google Scholar] [CrossRef] [Green Version]
  79. Sleat, D.E.; Wiseman, J.A.; Sohar, I.; El-Banna, M.; Zheng, H.Y.; Moore, D.F.; Lobel, P. Proteomic analysis of mouse models of Niemann-Pick C disease reveals alterations in the steady-state levels of lysosomal proteins within the brain. Proteomics 2012, 12, 3499–3509. [Google Scholar] [CrossRef] [Green Version]
  80. De Pasquale, V.; Moles, A.; Pavone, L.M. Cathepsins in the Pathophysiology of Mucopolysaccharidoses: New Perspectives for Therapy. Cells 2020, 9. [Google Scholar] [CrossRef] [Green Version]
  81. Siintola, E.; Partanen, S.; Stromme, P.; Haapanen, A.; Haltia, M.; Maehlen, J.; Lehesjoki, A.E.; Tyynela, J. Cathepsin D deficiency underlies congenital human neuronal ceroid-lipofuscinosis. Brain 2006, 129, 1438–1445. [Google Scholar] [CrossRef] [Green Version]
  82. Seo, Y.; Kim, H.S.; Kang, I.; Choi, S.W.; Shin, T.H.; Shin, J.H.; Lee, B.C.; Lee, J.Y.; Kim, J.J.; Kook, M.G.; et al. Cathepsin S contributes to microglia-mediated olfactory dysfunction through the regulation of Cx3cl1-Cx3cr1 axis in a Niemann-Pick disease type C1 model. Glia 2016, 64, 2291–2305. [Google Scholar] [CrossRef]
  83. Svatonova, J.; Borecka, K.; Adam, P.; Lanska, V. Beta2-microglobulin as a diagnostic marker in cerebrospinal fluid: A follow-up study. Dis. Markers 2014, 2014, 495402. [Google Scholar] [CrossRef] [PubMed]
  84. Beguin, P.; Crambert, G.; Monnet-Tschudi, F.; Uldry, M.; Horisberger, J.D.; Garty, H.; Geering, K. FXYD7 is a brain-specific regulator of Na,K-ATPase alpha 1-beta isozymes. EMBO J. 2002, 21, 3264–3273. [Google Scholar] [CrossRef] [PubMed] [Green Version]
  85. Kim, J.; Lee, S.; Kang, S.; Kim, S.H.; Kim, J.C.; Yang, M.; Moon, C. Brain-derived neurotropic factor and GABAergic transmission in neurodegeneration and neuroregeneration. Neural Regen. Res. 2017, 12, 1733–1741. [Google Scholar] [CrossRef]
  86. Elrick, M.J.; Pacheco, C.D.; Yu, T.; Dadgar, N.; Shakkottai, V.G.; Ware, C.; Paulson, H.L.; Lieberman, A.P. Conditional Niemann-Pick C mice demonstrate cell autonomous Purkinje cell neurodegeneration. Hum. Mol. Genet. 2010, 19, 837–847. [Google Scholar] [CrossRef] [PubMed] [Green Version]
  87. Cruz Duarte, P.; St-Jacques, B.; Ma, W. Prostaglandin E2 contributes to the synthesis of brain-derived neurotrophic factor in primary sensory neuron in ganglion explant cultures and in a neuropathic pain model. Exp. Neurol. 2012, 234, 466–481. [Google Scholar] [CrossRef]
  88. Sun, K.H.; Chang, K.H.; Clawson, S.; Ghosh, S.; Mirzaei, H.; Regnier, F.; Shah, K. Glutathione-S-transferase P1 is a critical regulator of Cdk5 kinase activity. J. Neurochem. 2011, 118, 902–914. [Google Scholar] [CrossRef]
  89. Guerreiro, R.; Wojtas, A.; Bras, J.; Carrasquillo, M.; Rogaeva, E.; Majounie, E.; Cruchaga, C.; Sassi, C.; Kauwe, J.S.; Younkin, S.; et al. TREM2 variants in Alzheimer’s disease. N. Eng. J. Med. 2013, 368, 117–127. [Google Scholar] [CrossRef] [Green Version]
  90. Zhong, L.; Xu, Y.; Zhuo, R.; Wang, T.; Wang, K.; Huang, R.; Wang, D.; Gao, Y.; Zhu, Y.; Sheng, X.; et al. Soluble TREM2 ameliorates pathological phenotypes by modulating microglial functions in an Alzheimer’s disease model. Nat. Commun. 2019, 10, 1365. [Google Scholar] [CrossRef] [Green Version]
  91. Suarez-Calvet, M.; Kleinberger, G.; Araque Caballero, M.A.; Brendel, M.; Rominger, A.; Alcolea, D.; Fortea, J.; Lleo, A.; Blesa, R.; Gispert, J.D.; et al. sTREM2 cerebrospinal fluid levels are a potential biomarker for microglia activity in early-stage Alzheimer’s disease and associate with neuronal injury markers. EMBO Mol. Med. 2016, 8, 466–476. [Google Scholar] [CrossRef]
  92. Xu, S.; Di, Z.; He, Y.; Wang, R.; Ma, Y.; Sun, R.; Li, J.; Wang, T.; Shen, Y.; Fang, S.; et al. Mesencephalic astrocyte-derived neurotrophic factor (MANF) protects against Abeta toxicity via attenuating Abeta-induced endoplasmic reticulum stress. J. Neuroinflamm. 2019, 16, 35. [Google Scholar] [CrossRef] [Green Version]
  93. Carecchio, M.; Comi, C. The role of osteopontin in neurodegenerative diseases. J. Alzheimers Dis. 2011, 25, 179–185. [Google Scholar] [CrossRef]
  94. Rabenstein, M.; Peter, F.; Rolfs, A.; Frech, M.J. Impact of Reduced Cerebellar EAAT Expression on Purkinje Cell Firing Pattern of NPC1-deficient Mice. Sci. Rep. 2018, 8, 3318. [Google Scholar] [CrossRef] [PubMed] [Green Version]
  95. Choi, K.D.; Jen, J.C.; Choi, S.Y.; Shin, J.H.; Kim, H.S.; Kim, H.J.; Kim, J.S.; Choi, J.H. Late-onset episodic ataxia associated with SLC1A3 mutation. J. Hum. Genet. 2017, 62, 443–446. [Google Scholar] [CrossRef] [PubMed]
  96. Xie, C.; Burns, D.K.; Turley, S.D.; Dietschy, J.M. Cholesterol is sequestered in the brains of mice with Niemann-Pick type C disease but turnover is increased. J. Neuropathol. Exp. Neurol. 2000, 59, 1106–1117. [Google Scholar] [CrossRef] [PubMed] [Green Version]
  97. Reid, P.C.; Sakashita, N.; Sugii, S.; Ohno-Iwashita, Y.; Shimada, Y.; Hickey, W.F.; Chang, T.Y. A novel cholesterol stain reveals early neuronal cholesterol accumulation in the Niemann-Pick type C1 mouse brain. J. Lipid Res. 2004, 45, 582–591. [Google Scholar] [CrossRef] [Green Version]
  98. Tanaka, J.; Nakamura, H.; Miyawaki, S. Cerebellar involvement in murine sphingomyelinosis: A new model of Niemann-Pick disease. J. Neuropathol. Exp. Neurol. 1988, 47, 291–300. [Google Scholar] [CrossRef]
  99. Fan, M.; Sidhu, R.; Fujiwara, H.; Tortelli, B.; Zhang, J.; Davidson, C.; Walkley, S.U.; Bagel, J.H.; Vite, C.; Yanjanin, N.M.; et al. Identification of Niemann-Pick C1 disease biomarkers through sphingolipid profiling. J. Lipid Res. 2013, 54, 2800–2814. [Google Scholar] [CrossRef] [Green Version]
  100. Hung, Y.H.; Faux, N.G.; Killilea, D.W.; Yanjanin, N.; Firnkes, S.; Volitakis, I.; Ganio, G.; Walterfang, M.; Hastings, C.; Porter, F.D.; et al. Altered transition metal homeostasis in Niemann-Pick disease, type C1. Metallomics 2014, 6, 542–553. [Google Scholar] [CrossRef] [Green Version]
  101. Gibb, S.L.; Zhao, Y.; Potter, D.; Hylin, M.J.; Bruhn, R.; Baimukanova, G.; Zhao, J.; Xue, H.; Abdel-Mohsen, M.; Pillai, S.K.; et al. TIMP3 Attenuates the Loss of Neural Stem Cells, Mature Neurons and Neurocognitive Dysfunction in Traumatic Brain Injury. Stem Cells 2015, 33, 3530–3544. [Google Scholar] [CrossRef]
  102. Kavetsky, L.; Green, K.K.; Boyle, B.R.; Yousufzai, F.A.K.; Padron, Z.M.; Melli, S.E.; Kuhnel, V.L.; Jackson, H.M.; Blanco, R.E.; Howell, G.R.; et al. Increased interactions and engulfment of dendrites by microglia precede Purkinje cell degeneration in a mouse model of Niemann Pick Type-C. Sci. Rep. 2019, 9, 14722. [Google Scholar] [CrossRef] [Green Version]
  103. Loftus, S.K.; Morris, J.A.; Carstea, E.D.; Gu, J.Z.; Cummings, C.; Brown, A.; Ellison, J.; Ohno, K.; Rosenfeld, M.A.; Tagle, D.A.; et al. Murine model of Niemann-Pick C disease: Mutation in a cholesterol homeostasis gene. Science 1997, 277, 232–235. [Google Scholar] [CrossRef] [PubMed]
  104. Gardeux, V.; David, F.P.A.; Shajkofci, A.; Schwalie, P.C.; Deplancke, B. ASAP: A web-based platform for the analysis and interactive visualization of single-cell RNA-seq data. Bioinformatics 2017, 33, 3123–3125. [Google Scholar] [CrossRef] [PubMed] [Green Version]
  105. Law, C.W.; Chen, Y.; Shi, W.; Smyth, G.K. voom: Precision weights unlock linear model analysis tools for RNA-seq read counts. Genome Biol. 2014, 15, R29. [Google Scholar] [CrossRef] [PubMed] [Green Version]
  106. Ritchie, M.E.; Phipson, B.; Wu, D.; Hu, Y.; Law, C.W.; Shi, W.; Smyth, G.K. limma powers differential expression analyses for RNA-sequencing and microarray studies. Nucleic Acids Res. 2015, 43, e47. [Google Scholar] [CrossRef]
  107. Schindelin, J.; Arganda-Carreras, I.; Frise, E.; Kaynig, V.; Longair, M.; Pietzsch, T.; Preibisch, S.; Rueden, C.; Saalfeld, S.; Schmid, B.; et al. Fiji: An open-source platform for biological-image analysis. Nat. Methods 2012, 9, 676–682. [Google Scholar] [CrossRef] [Green Version]
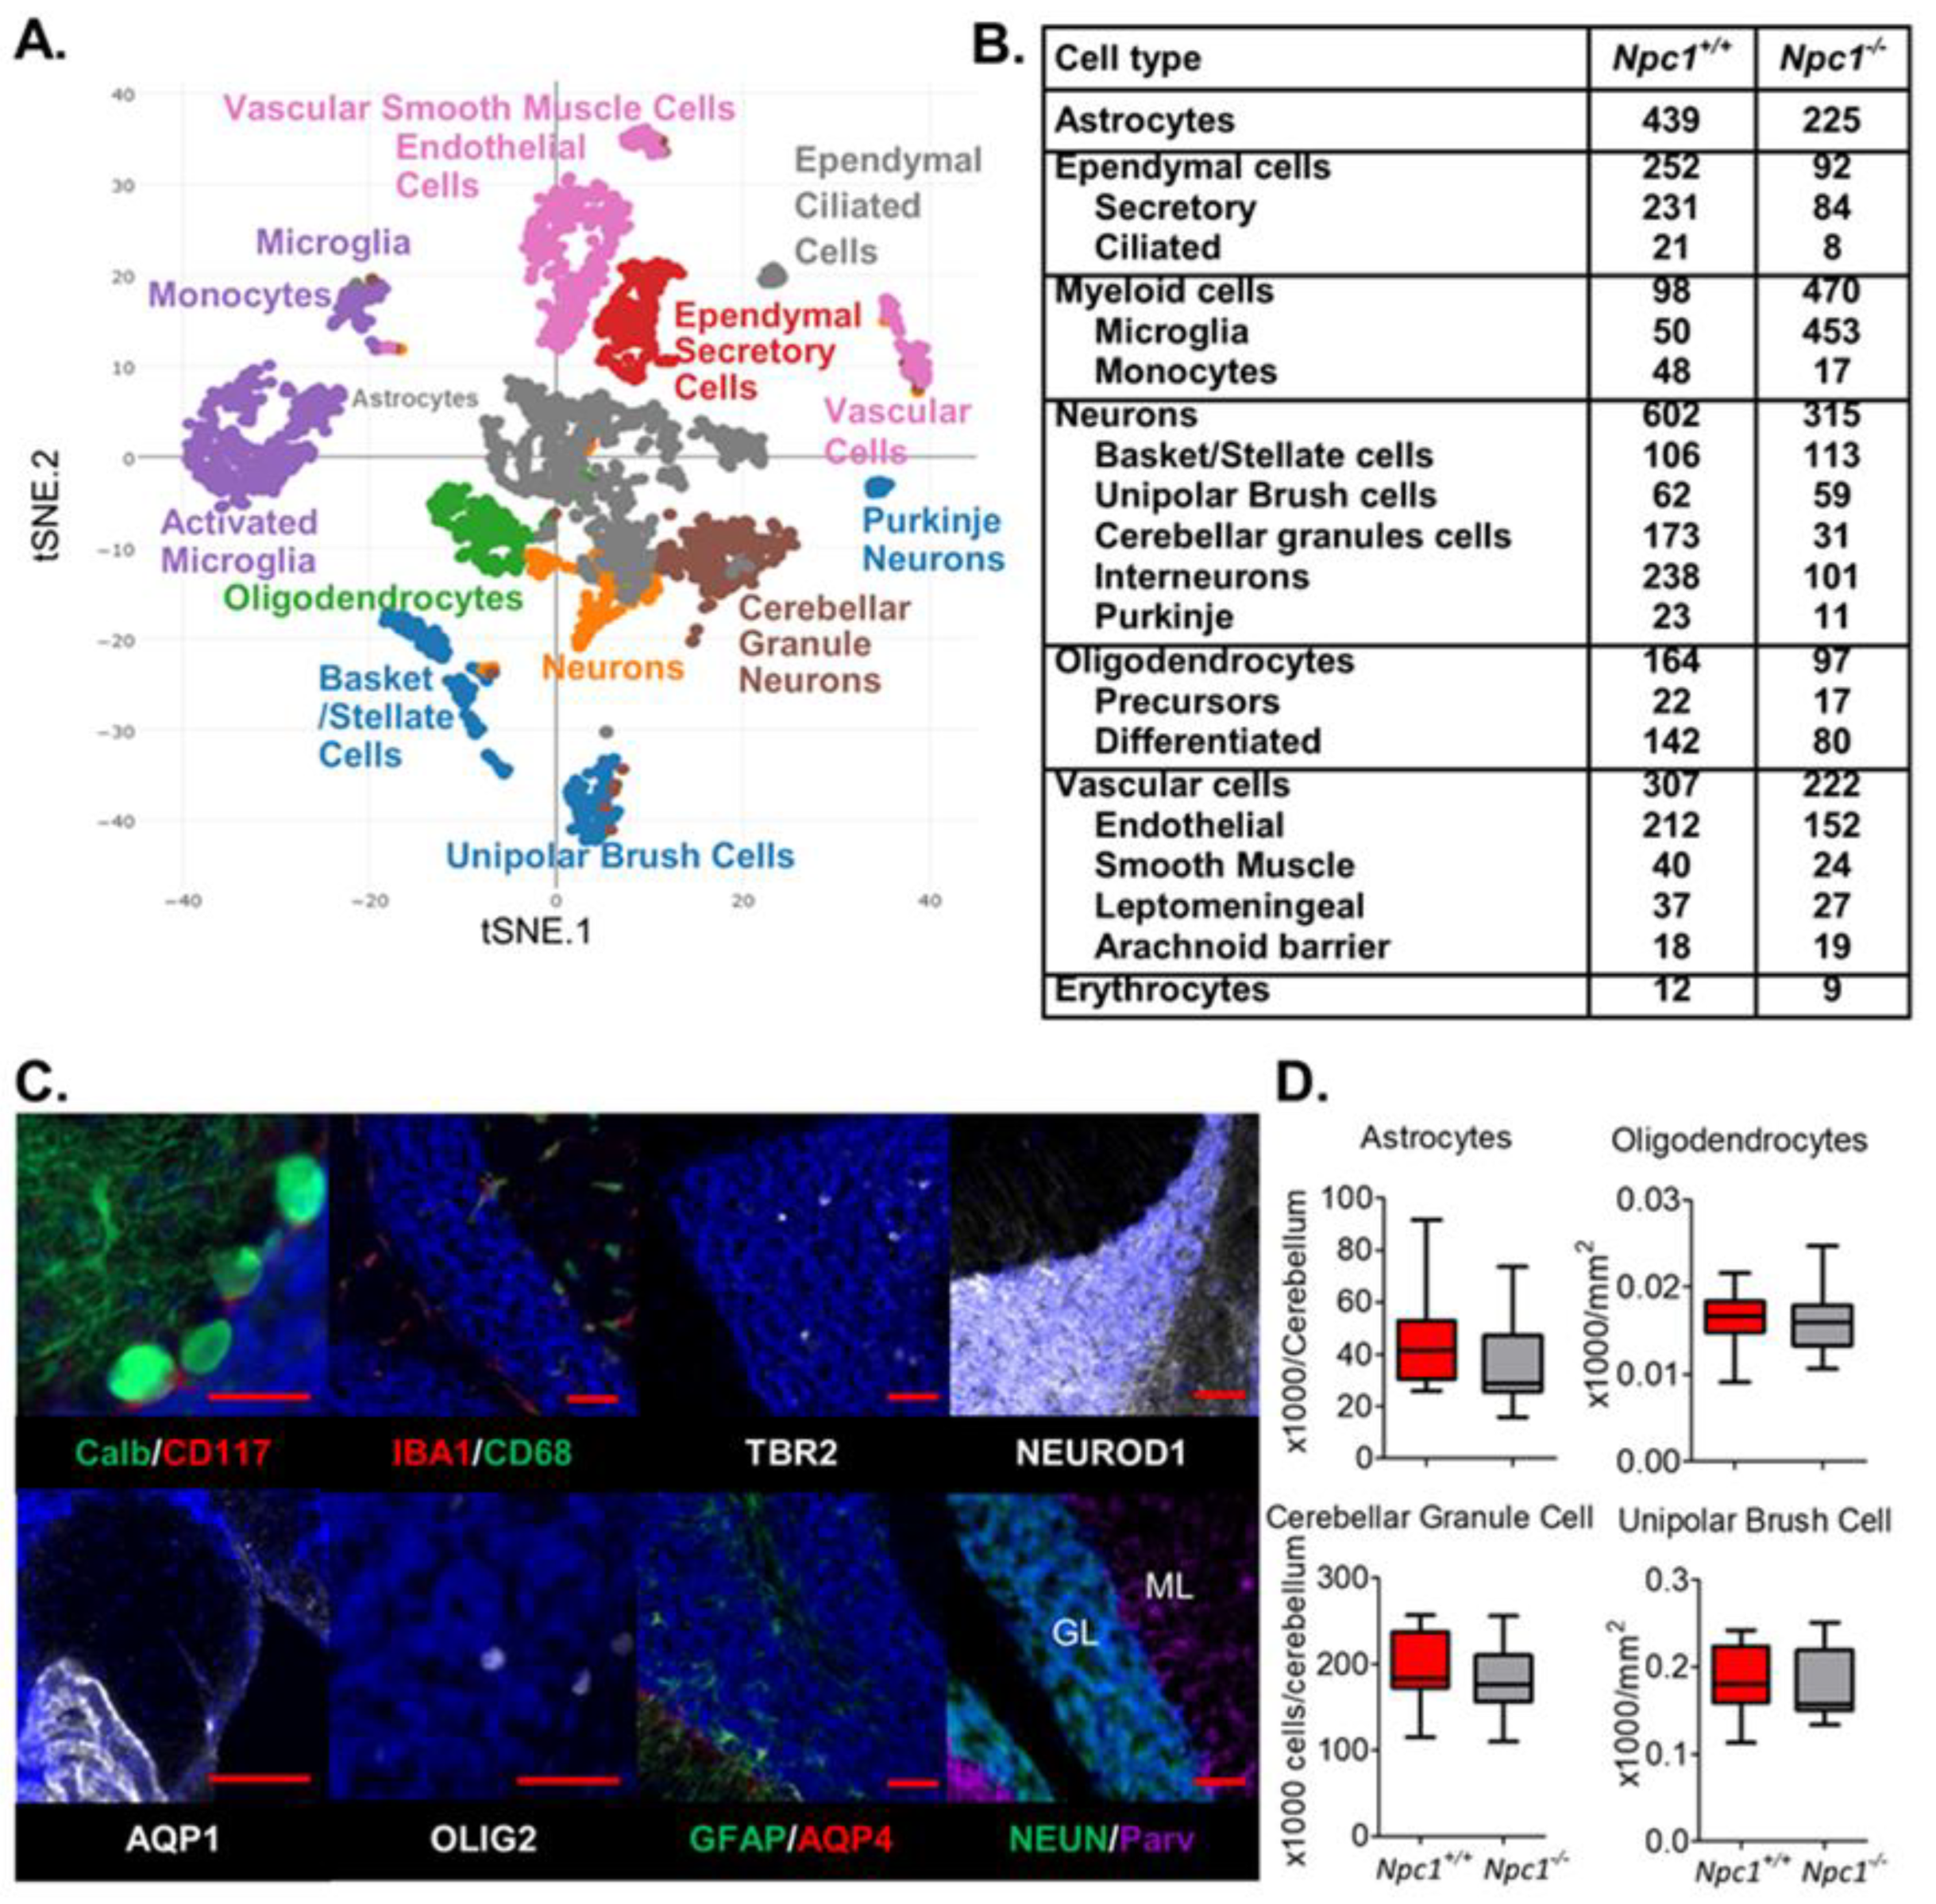
Figure 1. Identification of cerebellar cell populations. (A) Automatic K-means clustering was used to generate a t-SNE plot of single cell transcriptomes from Npc1+/+ and Npc1−/− cerebellar tissue at seven weeks of age. (B) Number of cerebellar cell type specific transcriptomes obtained from Npc1+/+ and Npc1−/− seven-week-old mice. (C) Representative immunostaining using antibodies corresponding to signature transcripts in seven-week-old mouse cerebella. Calb (Calbindin, Purkinje neurons); CD117 (basket/stellate neurons); IBA1 (microglia); CD68 (myeloid cells); TBR2 (unipolar brush neurons); NEUROD1 (cerebellar granule neurons); AQP1 (ependymal secretory cells); OLIG2 (oligodendrocytes); GFAP (astrocytes); AQP4 (astrocytes); NEUN (neurons); Parv (Parvalbumin, interneurons). Scale bar = 50 µm. (D) Histopathological quantification of number of cerebellar granule neurons, oligodendrocytes, astrocytes, and unipolar brush cells in parasagittal sections of seven-week-old cerebella. N > 6.
Ijms 21 05368 g001
Figure 2. Differentially expressed genes in microglia. (A) Principal component analysis (PCA) of gene expression in microglia from seven-week-old Npc1+/+ (red) and Npc1−/− (gray) cerebellar tissue. (B) Volcano plot of differential gene expression between control and Npc1 mutant mice. (C) PCA plots showing expression level of microglial activation markers (Apoe, Cd68, and Igax). Increasing red intensity corresponds to increasing unique molecular identifier (UMI) counts.
Ijms 21 05368 g002
Figure 3. Differentially expressed genes in vascular cells. Tukey box plots of differentially expressed genes in vascular smooth muscle cells (A), endothelial cells (B), and vascular leptomeningeal cells (C).
Ijms 21 05368 g003
Figure 4. Differentially expressed genes in glial cells. Tukey box plot of differentially expressed genes in astrocytes (A), oligodendrocyte precursors (B), differentiated oligodendrocytes (C), ependymal ciliated (D), and ependymal secretory cells (E) between genotype.
Ijms 21 05368 g004
Figure 5. Differentially expressed genes in neuronal cells. Tukey box plots of differentially expressed genes in basket/stellate neurons (A), granule neurons (B), unipolar brush cells (C), and Purkinje neurons (D). In control cerebellum, anterior (A) and posterior (B) Purkinje neurons could be differentiated. In Npc1−/− cerebellum from seven-week-old mice, only posterior Purkinje neurons were identified.
Ijms 21 05368 g005
Figure 6. Protein validation of selected differentially expressed transcripts identified in 7-week old Npc1−/− cerebella. Immunohistochemistry quantification of cathepsin D (A), lysozyme (B), DAP12 (C), and apolipoprotein E (APOE) (D). Representative examples of cerebellar staining are provided in Figure S6. β2 microglobulin (E) was quantified by ELISA. N > 6.
Ijms 21 05368 g006
Figure 7. Differentially expressed genes at three weeks of age. (A) Tukey Box plot of genes showing differential expression Npc1+/+ and Npc1−/− endothelial cells. (B) Volcano plot of significantly differentially expressed genes in microglia from Npc1+/+ and Npc1−/−. X axis Log2 fold change between Npc1−/− and Npc1+/+ microglia. Y axis is the -Log10 p-value. Black dots and clear circles indicate data from three- and seven-week-old mice, respectively.
Ijms 21 05368 g007
Figure 8. Single cell expression data for 38 differentially expressed gene. Increased (red) and decreased (blue) at both three and seven weeks is indicated for specific cell types. A: astrocytes; ECC: ependymal ciliated cells; ESC: ependymal secretory cells; O: oligodendrocytes; OP: oligodendrocytes precursor; EC: endothelial cells; VLC: vascular leptomeningeal cells; VSM: vascular smooth muscle cells; B/S: basket/stellate cells; GC: granule cells; IN: interneurons; PN: Purkinje neurons; UBC: unipolar brush cells. Cellular location of the encoded proteins is from Uniprot. E/S: extracellular space or secreted; PM: plasma membrane; C: cytoplasm; N: nucleus; ER: endoplasmic reticulum; GA: Golgi apparatus; L: lysosome; En: endosome; Ex: exosome; M: mitochondrion; Cy: cytoskeleton. Sphingolipid binding is from Haberkant et al. [57]. Cholesterol binding is from Hulce et al. [63] and * [64].
Ijms 21 05368 g008