Effect of Angiotensin II on Bone Erosion and Systemic Bone Loss in Mice with Tumor Necrosis Factor-Mediated Arthritis

 ,
,  and
and 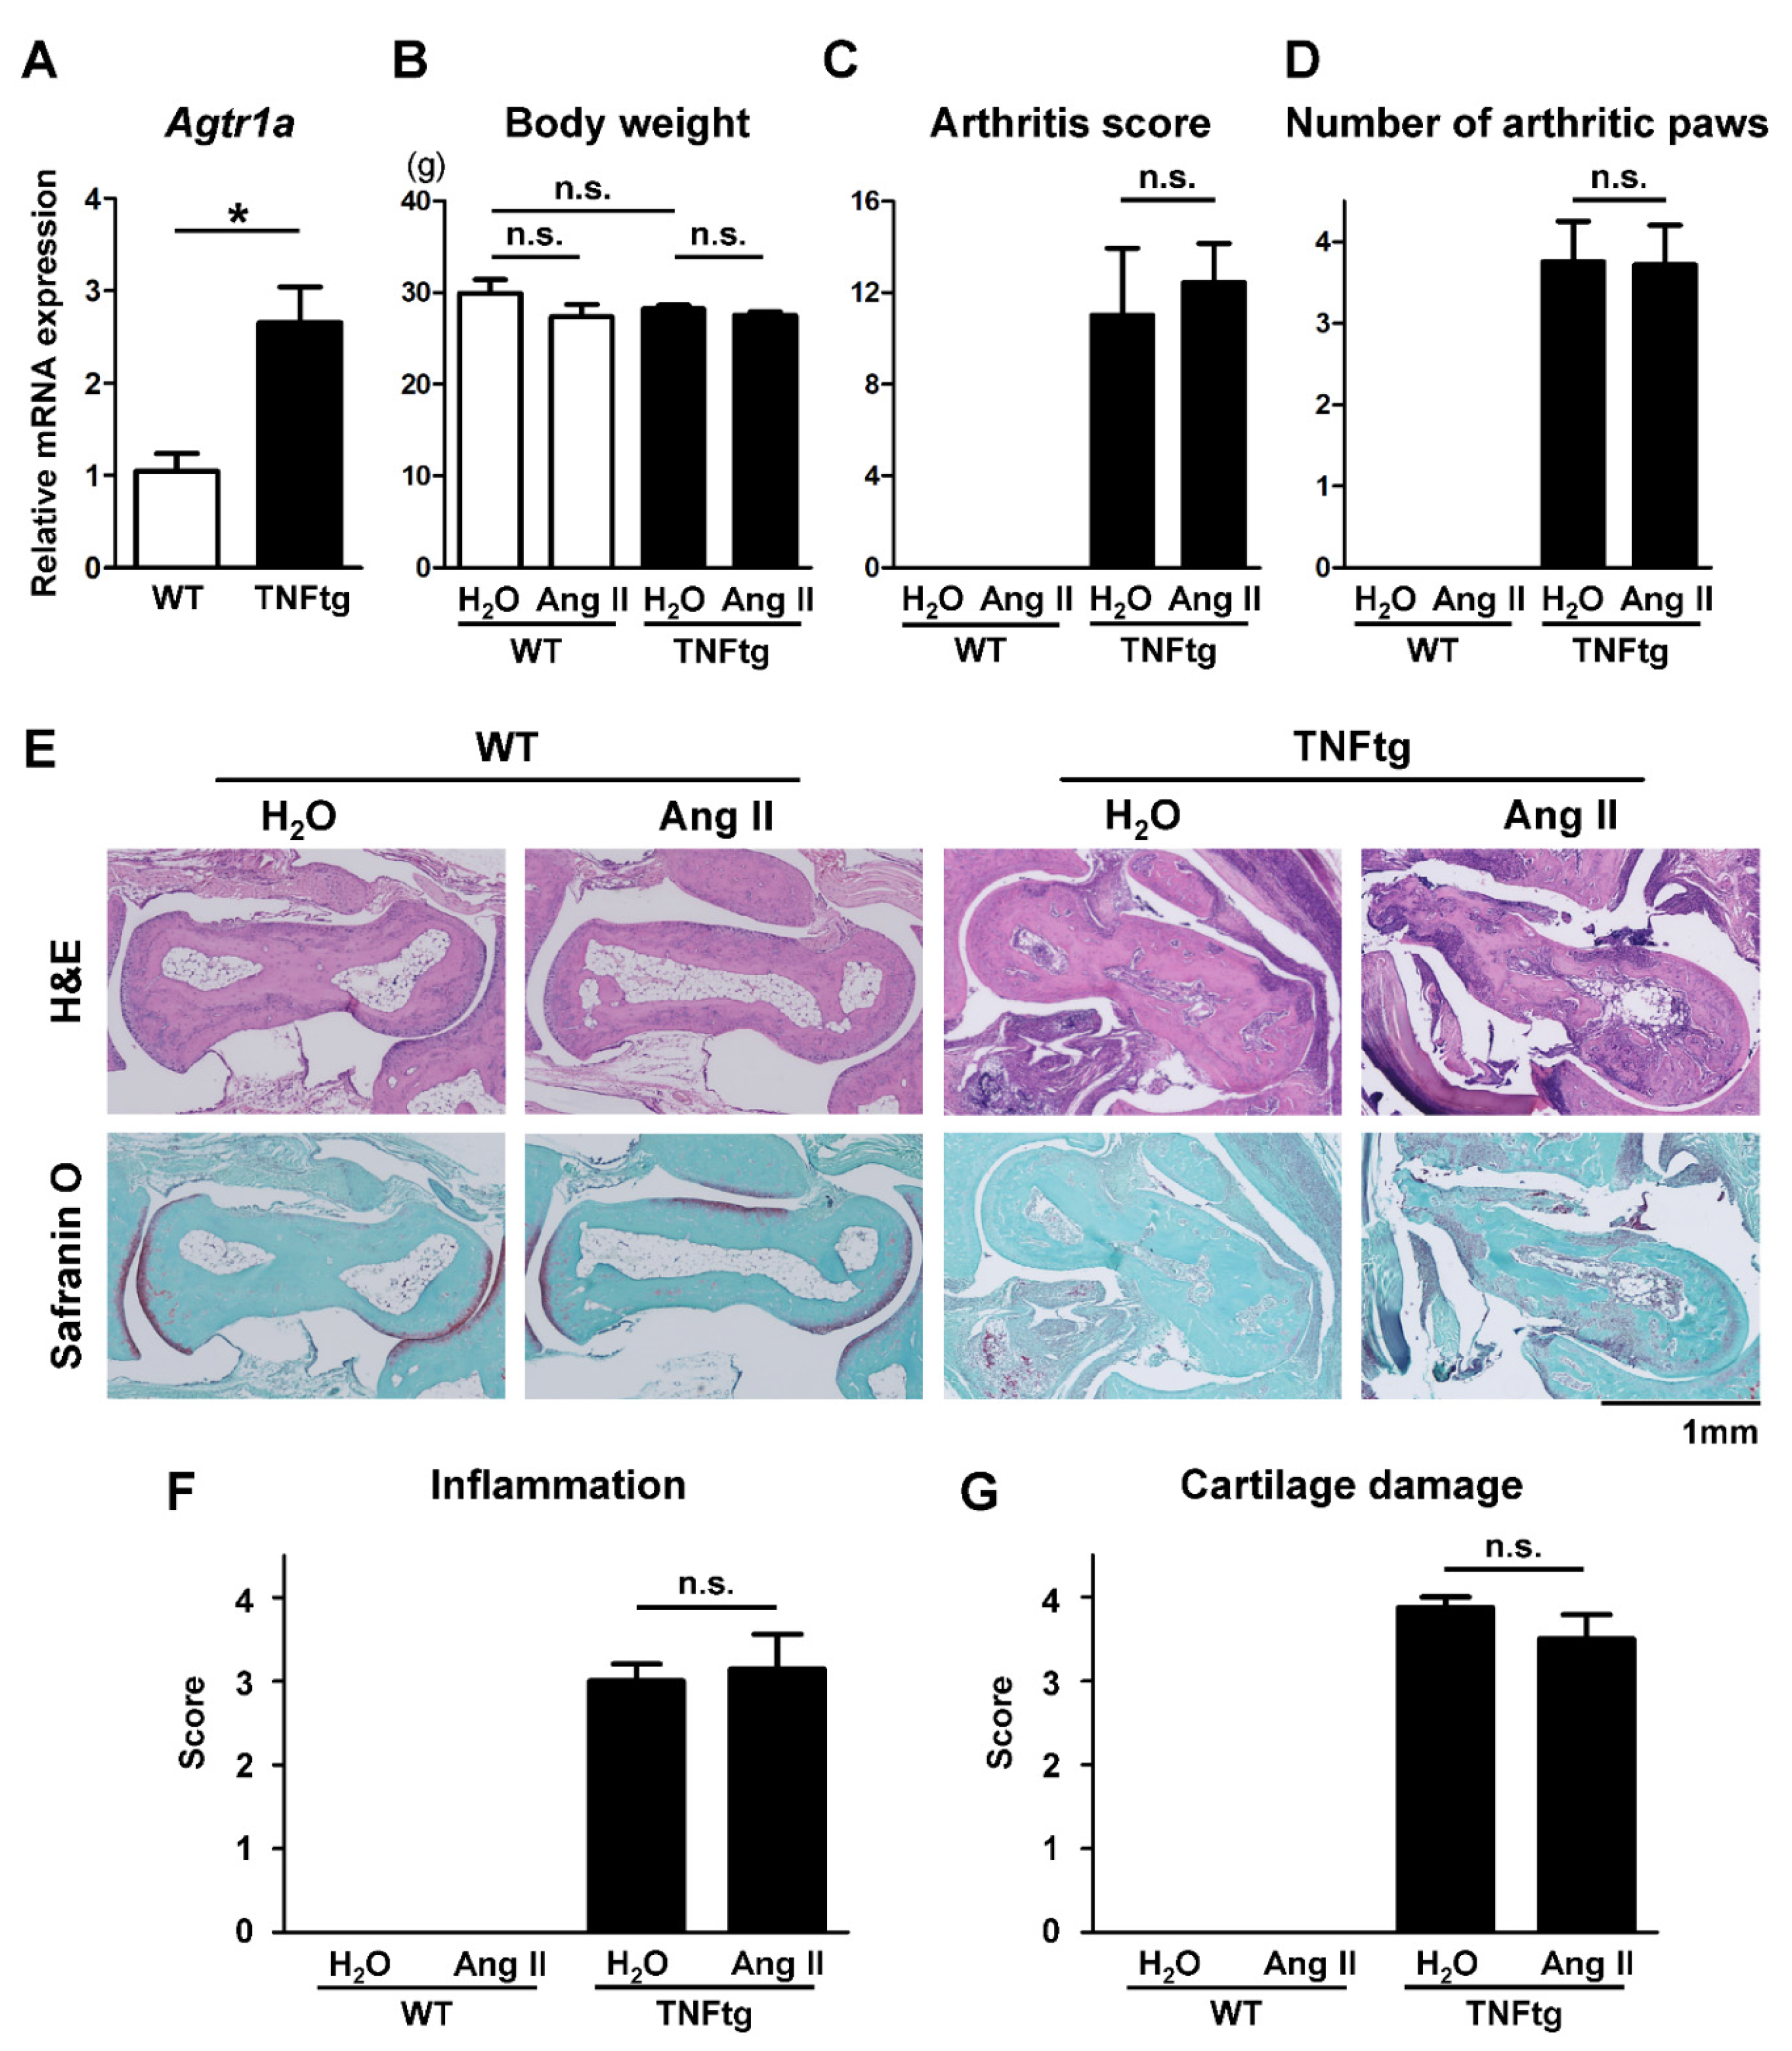
Abstract
1. Introduction
2. Results
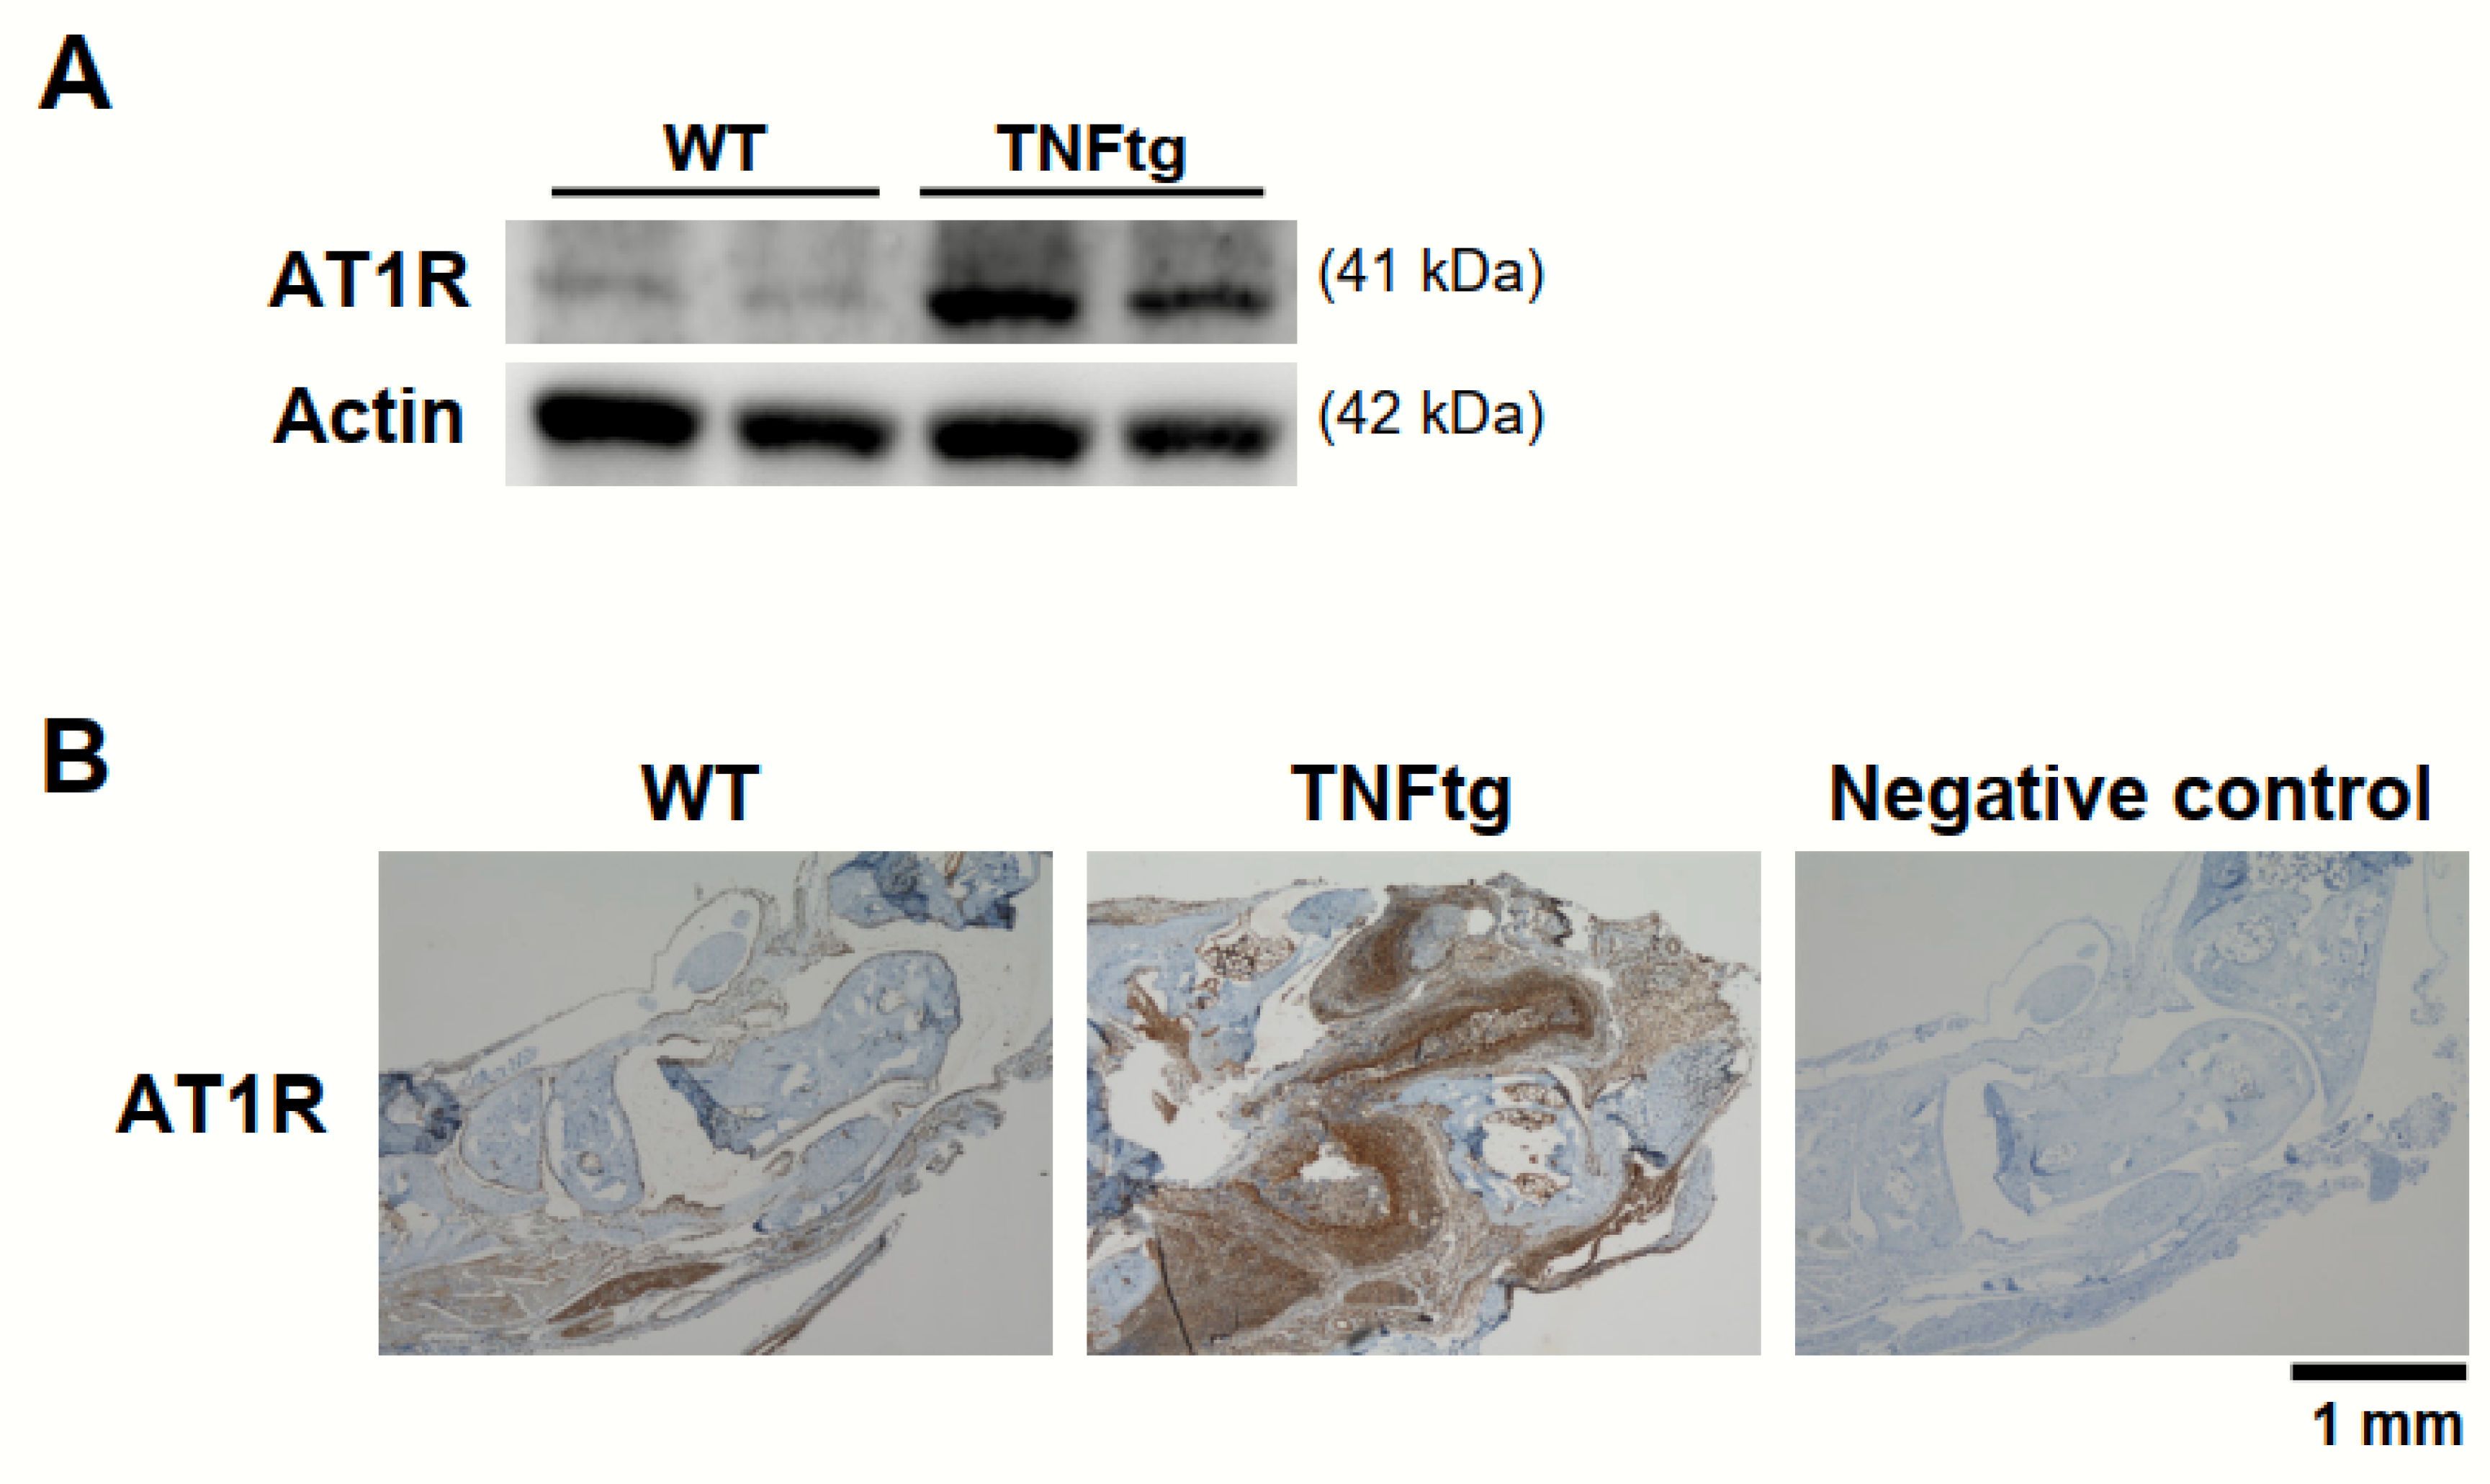
2.1. Increased AT1R Expression in the Joint Tissue of Tumor Necrosis Factor-Transgenic (TNFtg) Mice
2.2. No Significant Effect of Ang II Administration on the Severity of Inflammatory Cell Infiltration in TNFtg Mice
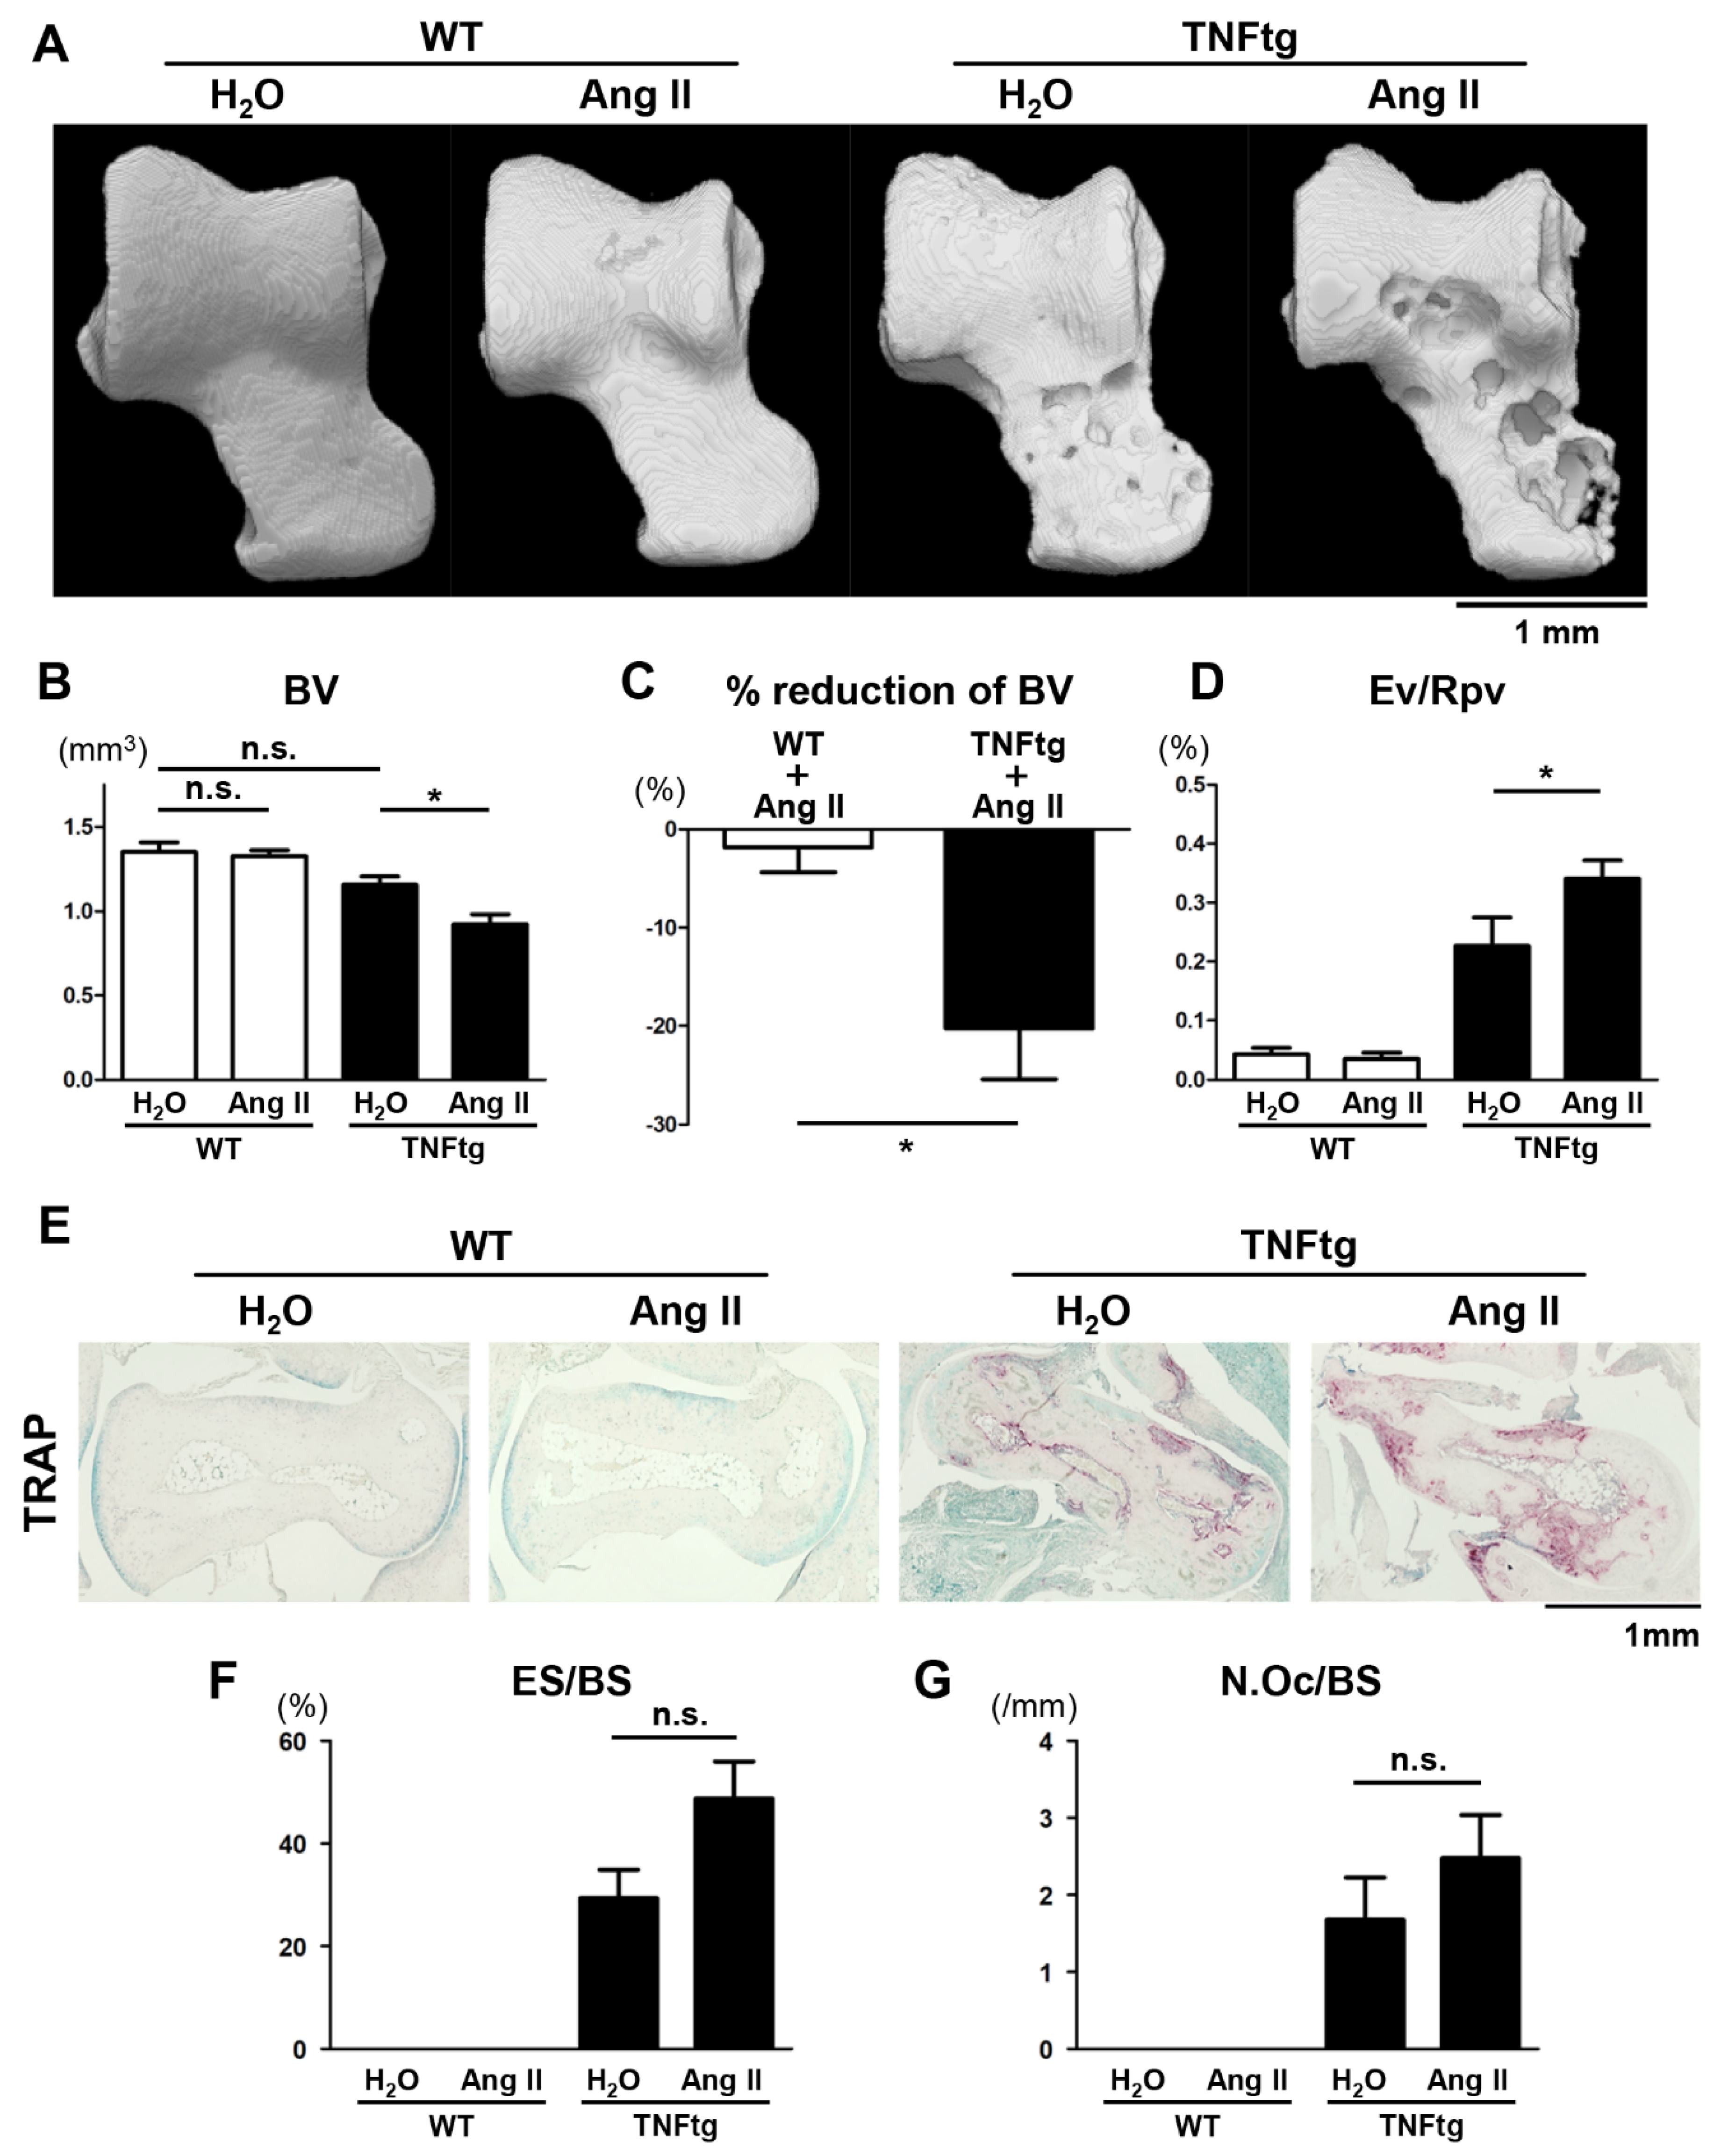
2.3. Exacerbation of Bone Erosion by Ang II Administration in TNFtg Mice
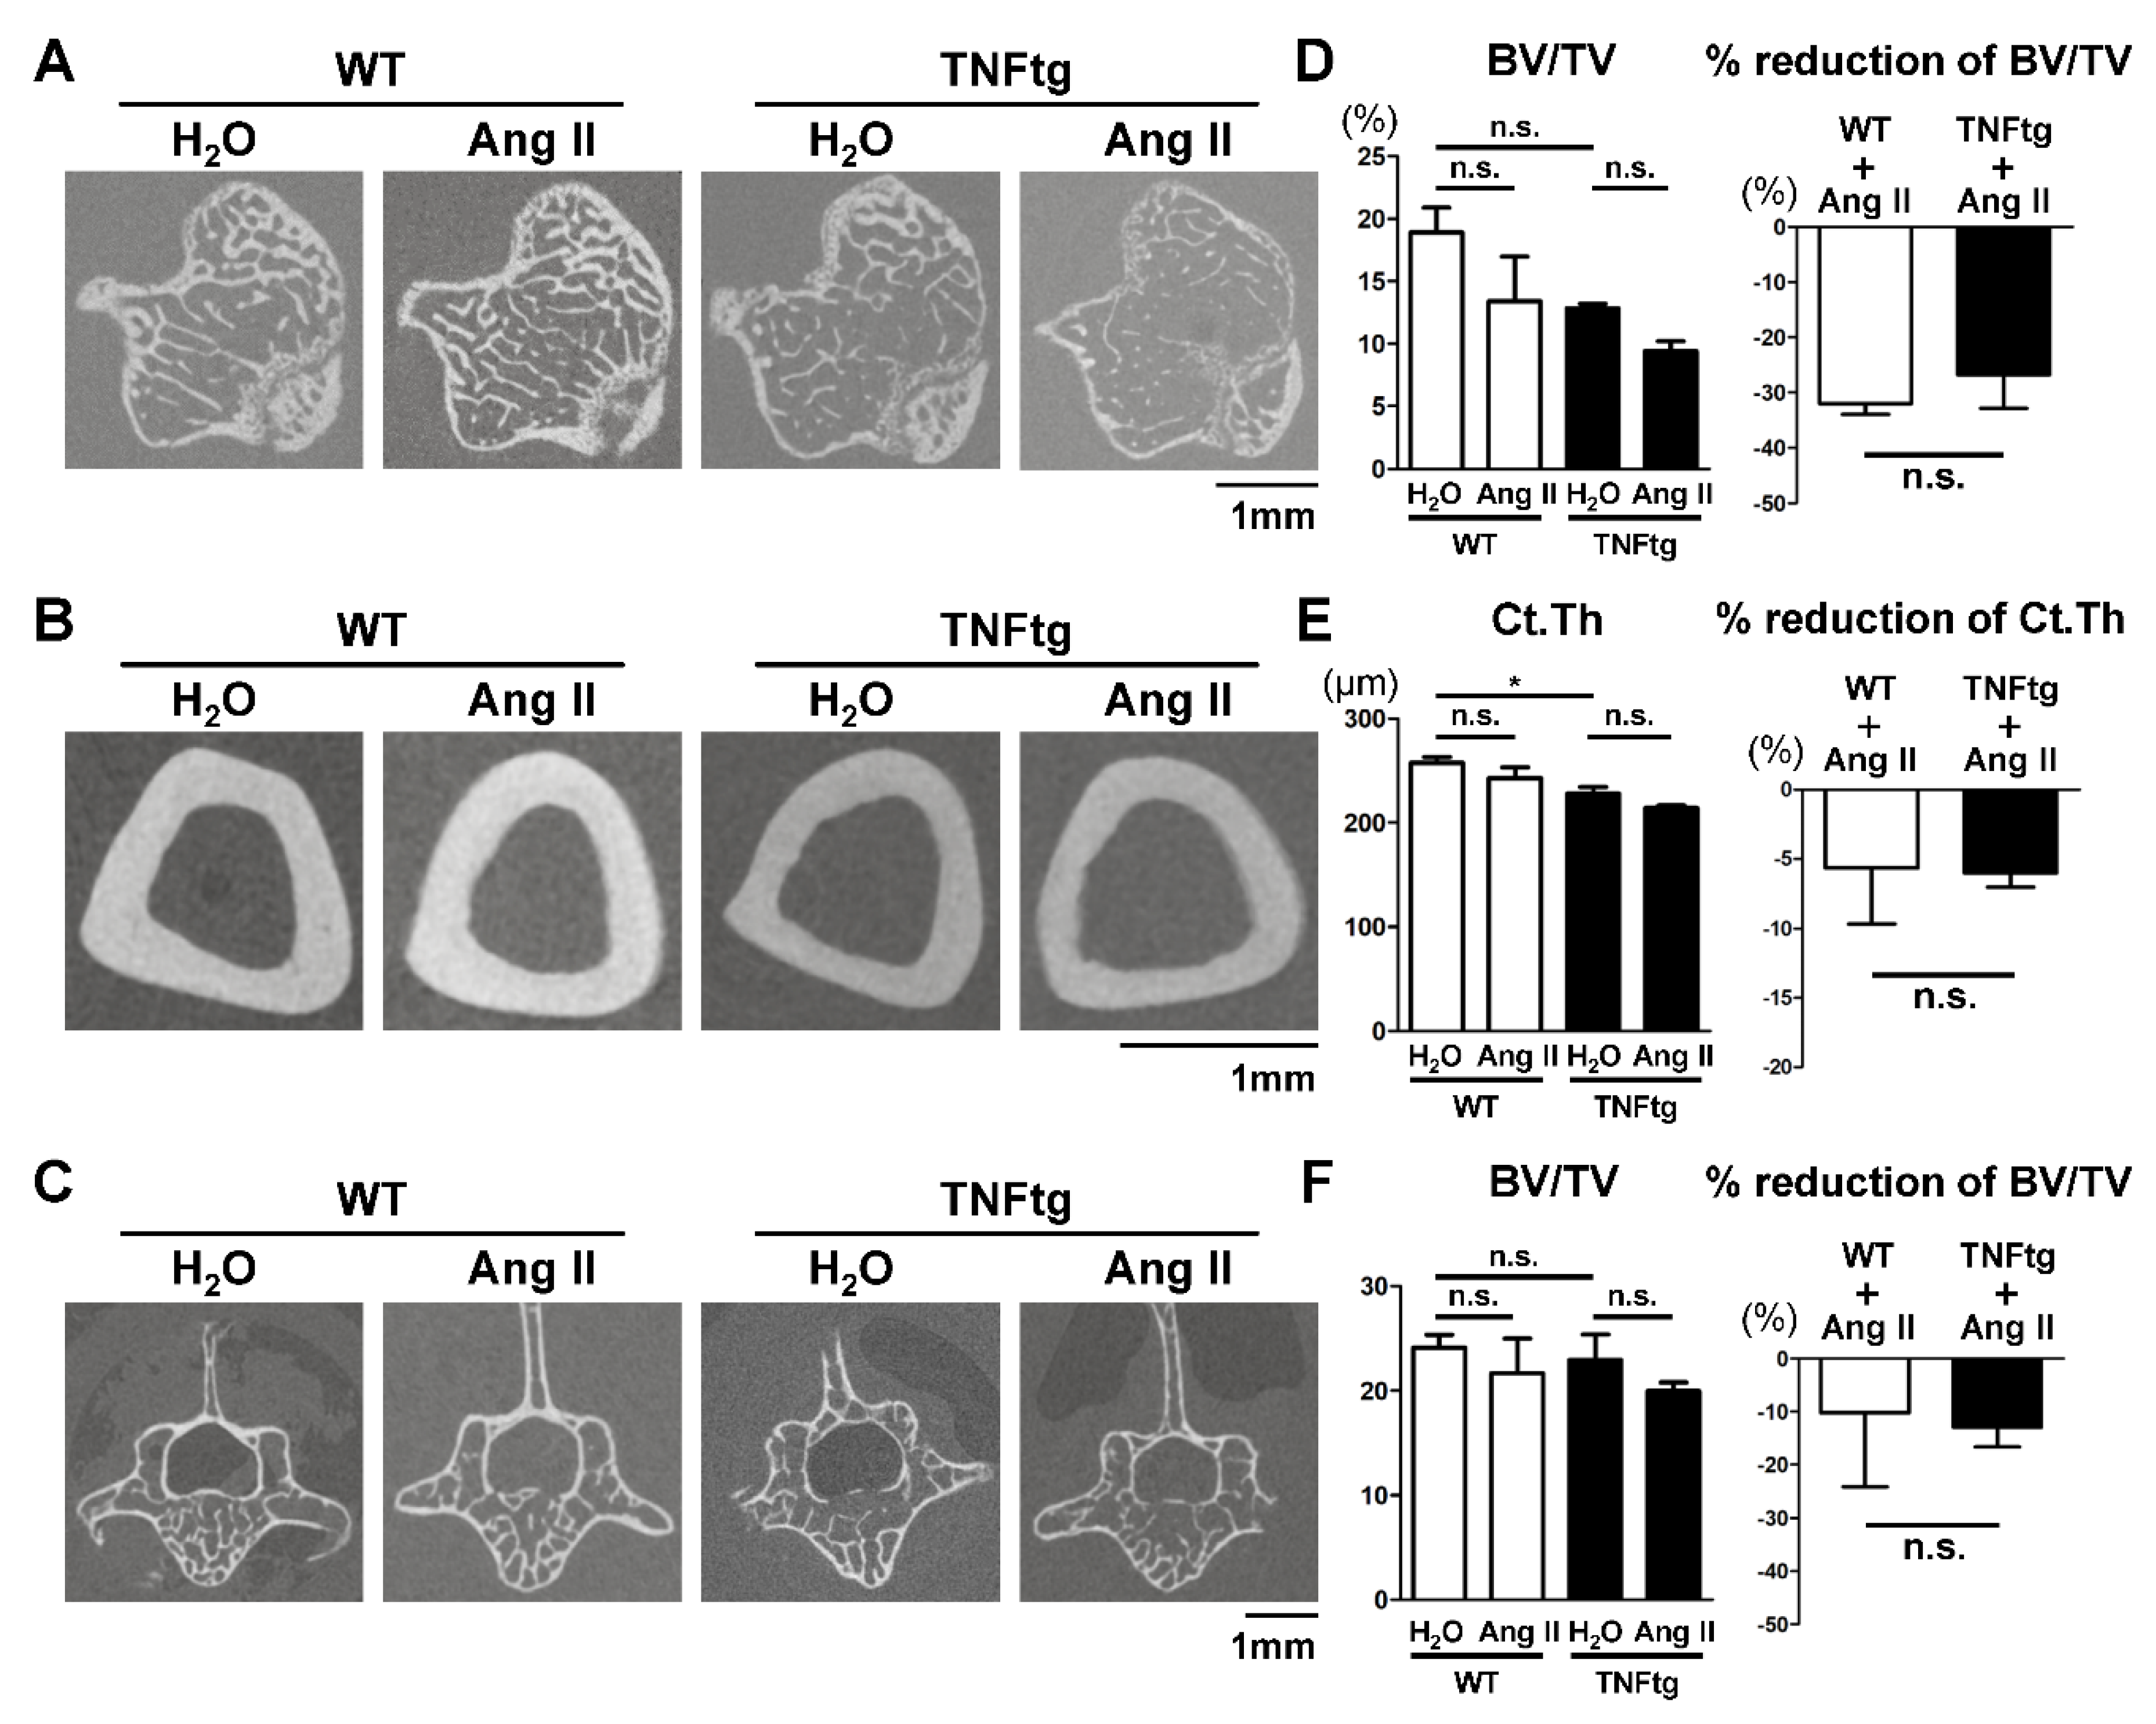
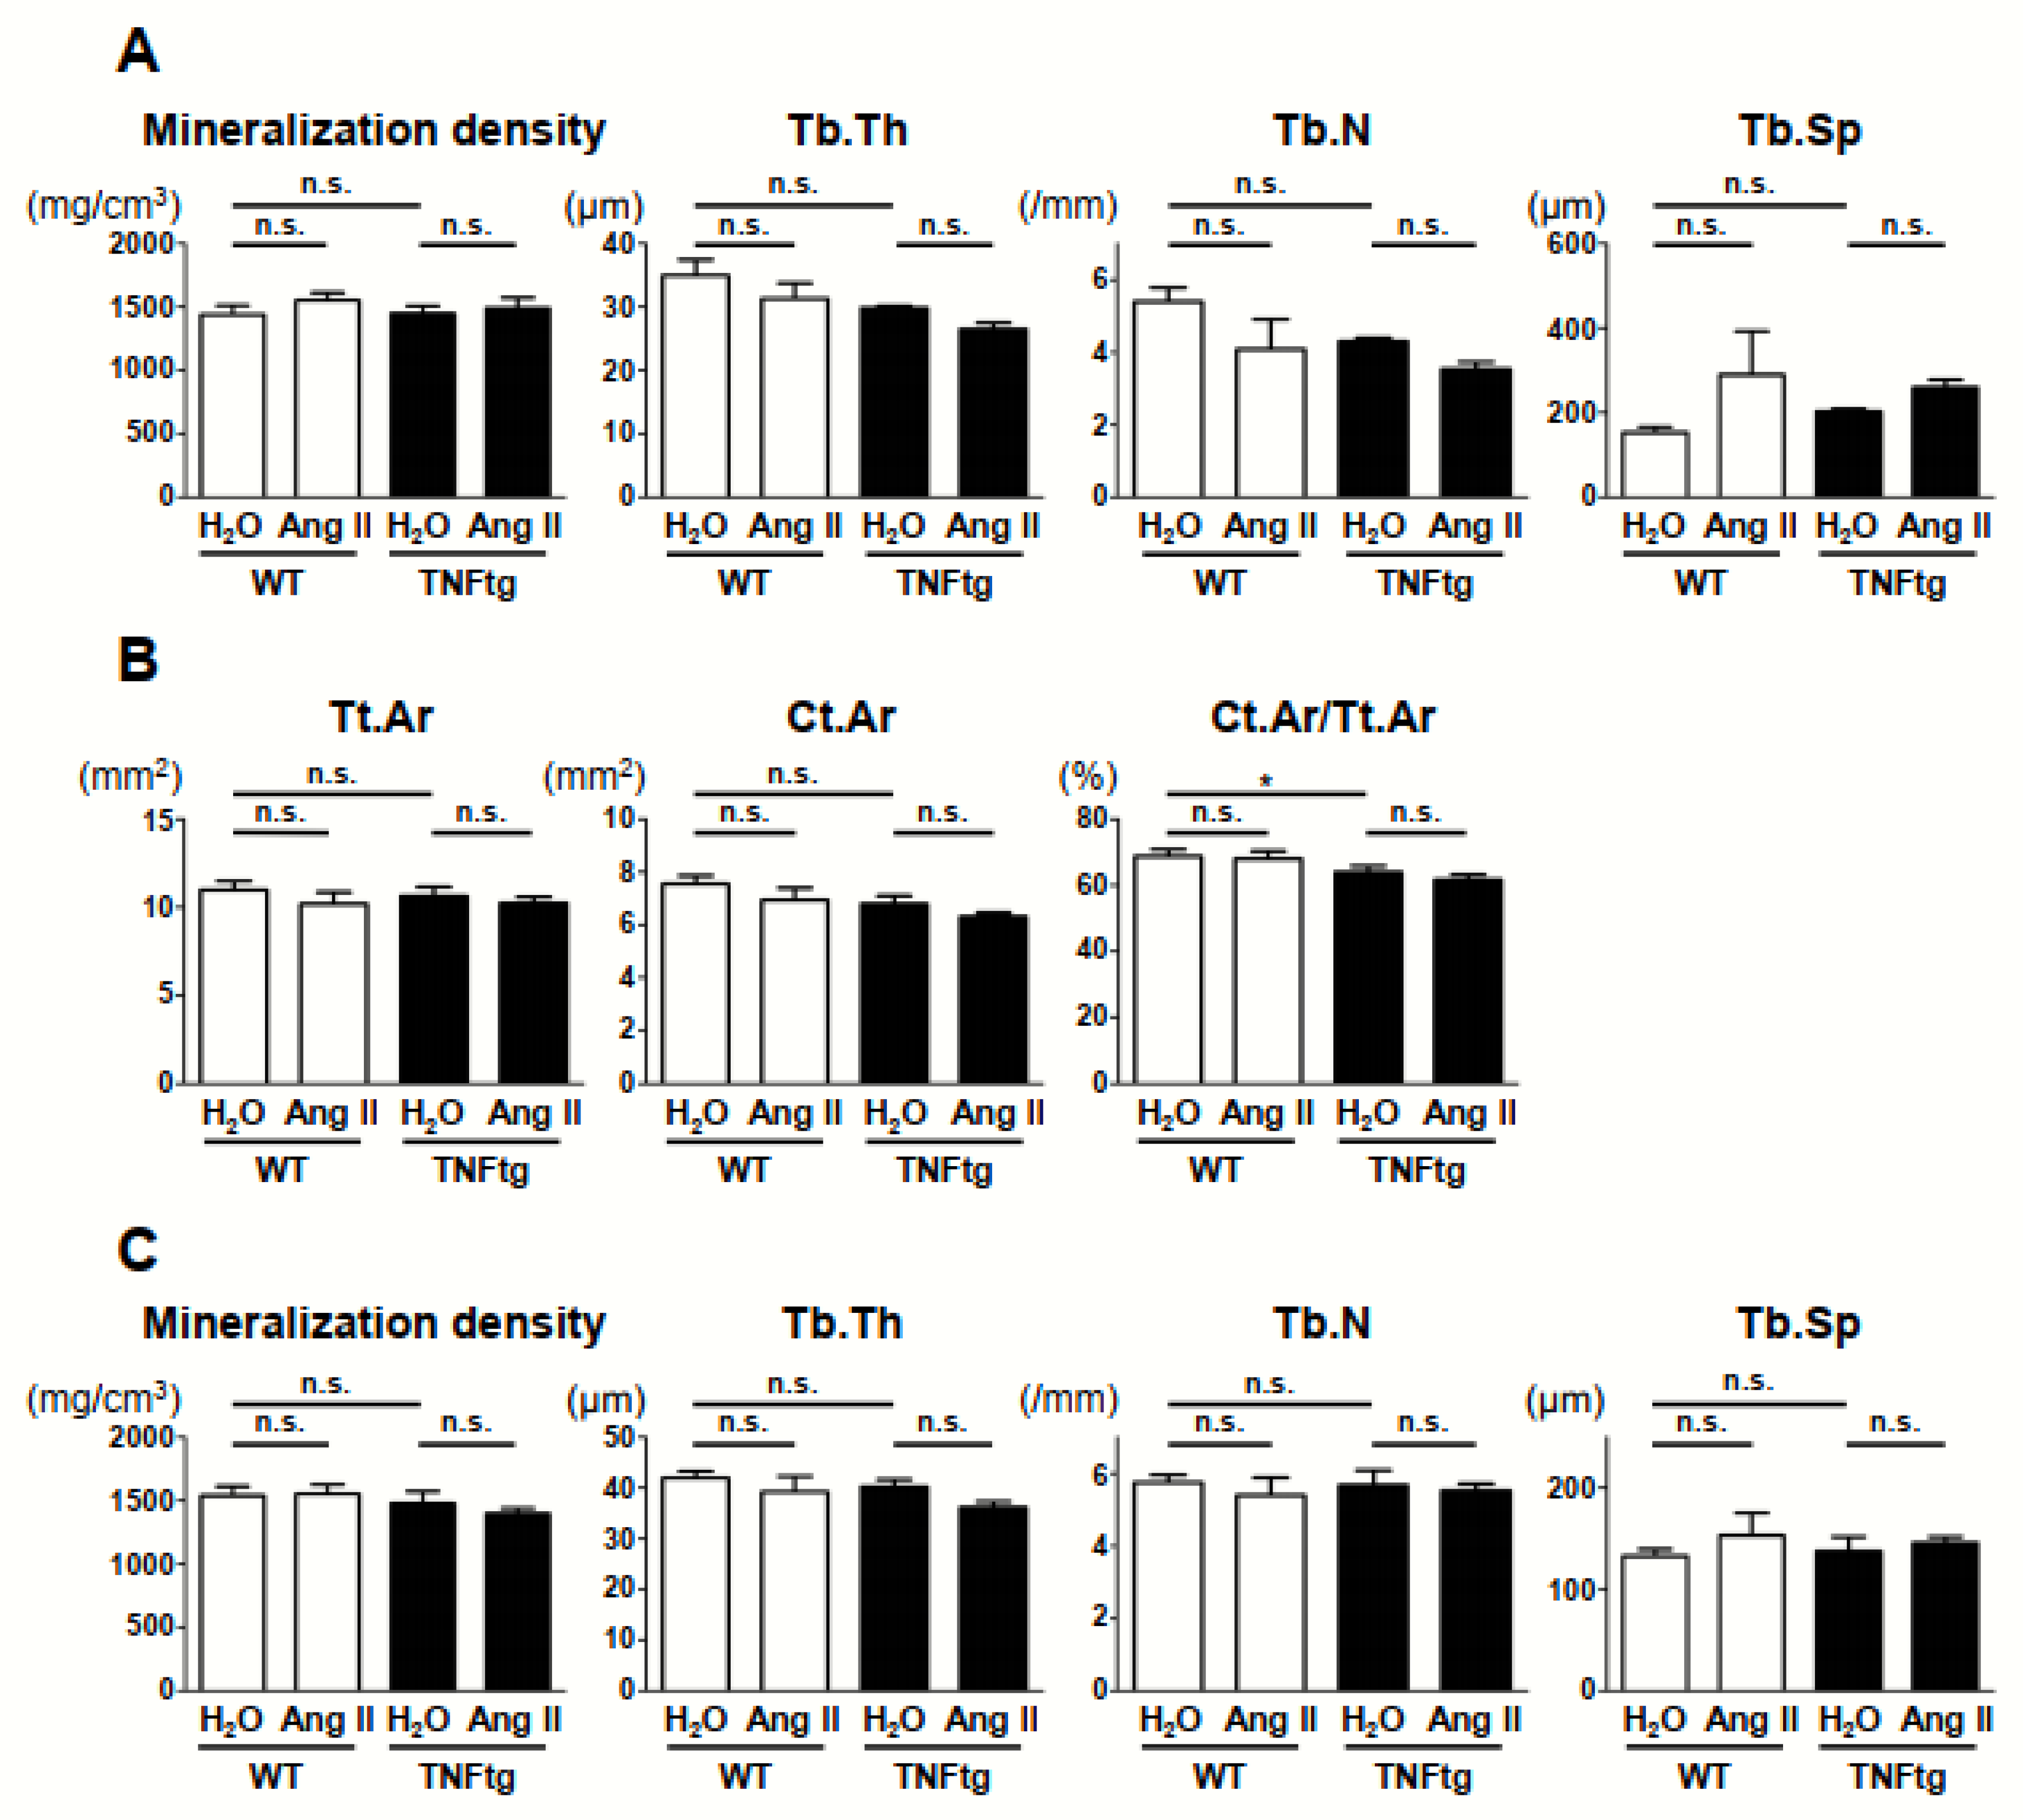
2.4. No Detectable Changes in the Trabecular and Cortical Bone Parameters with Ang II Administration
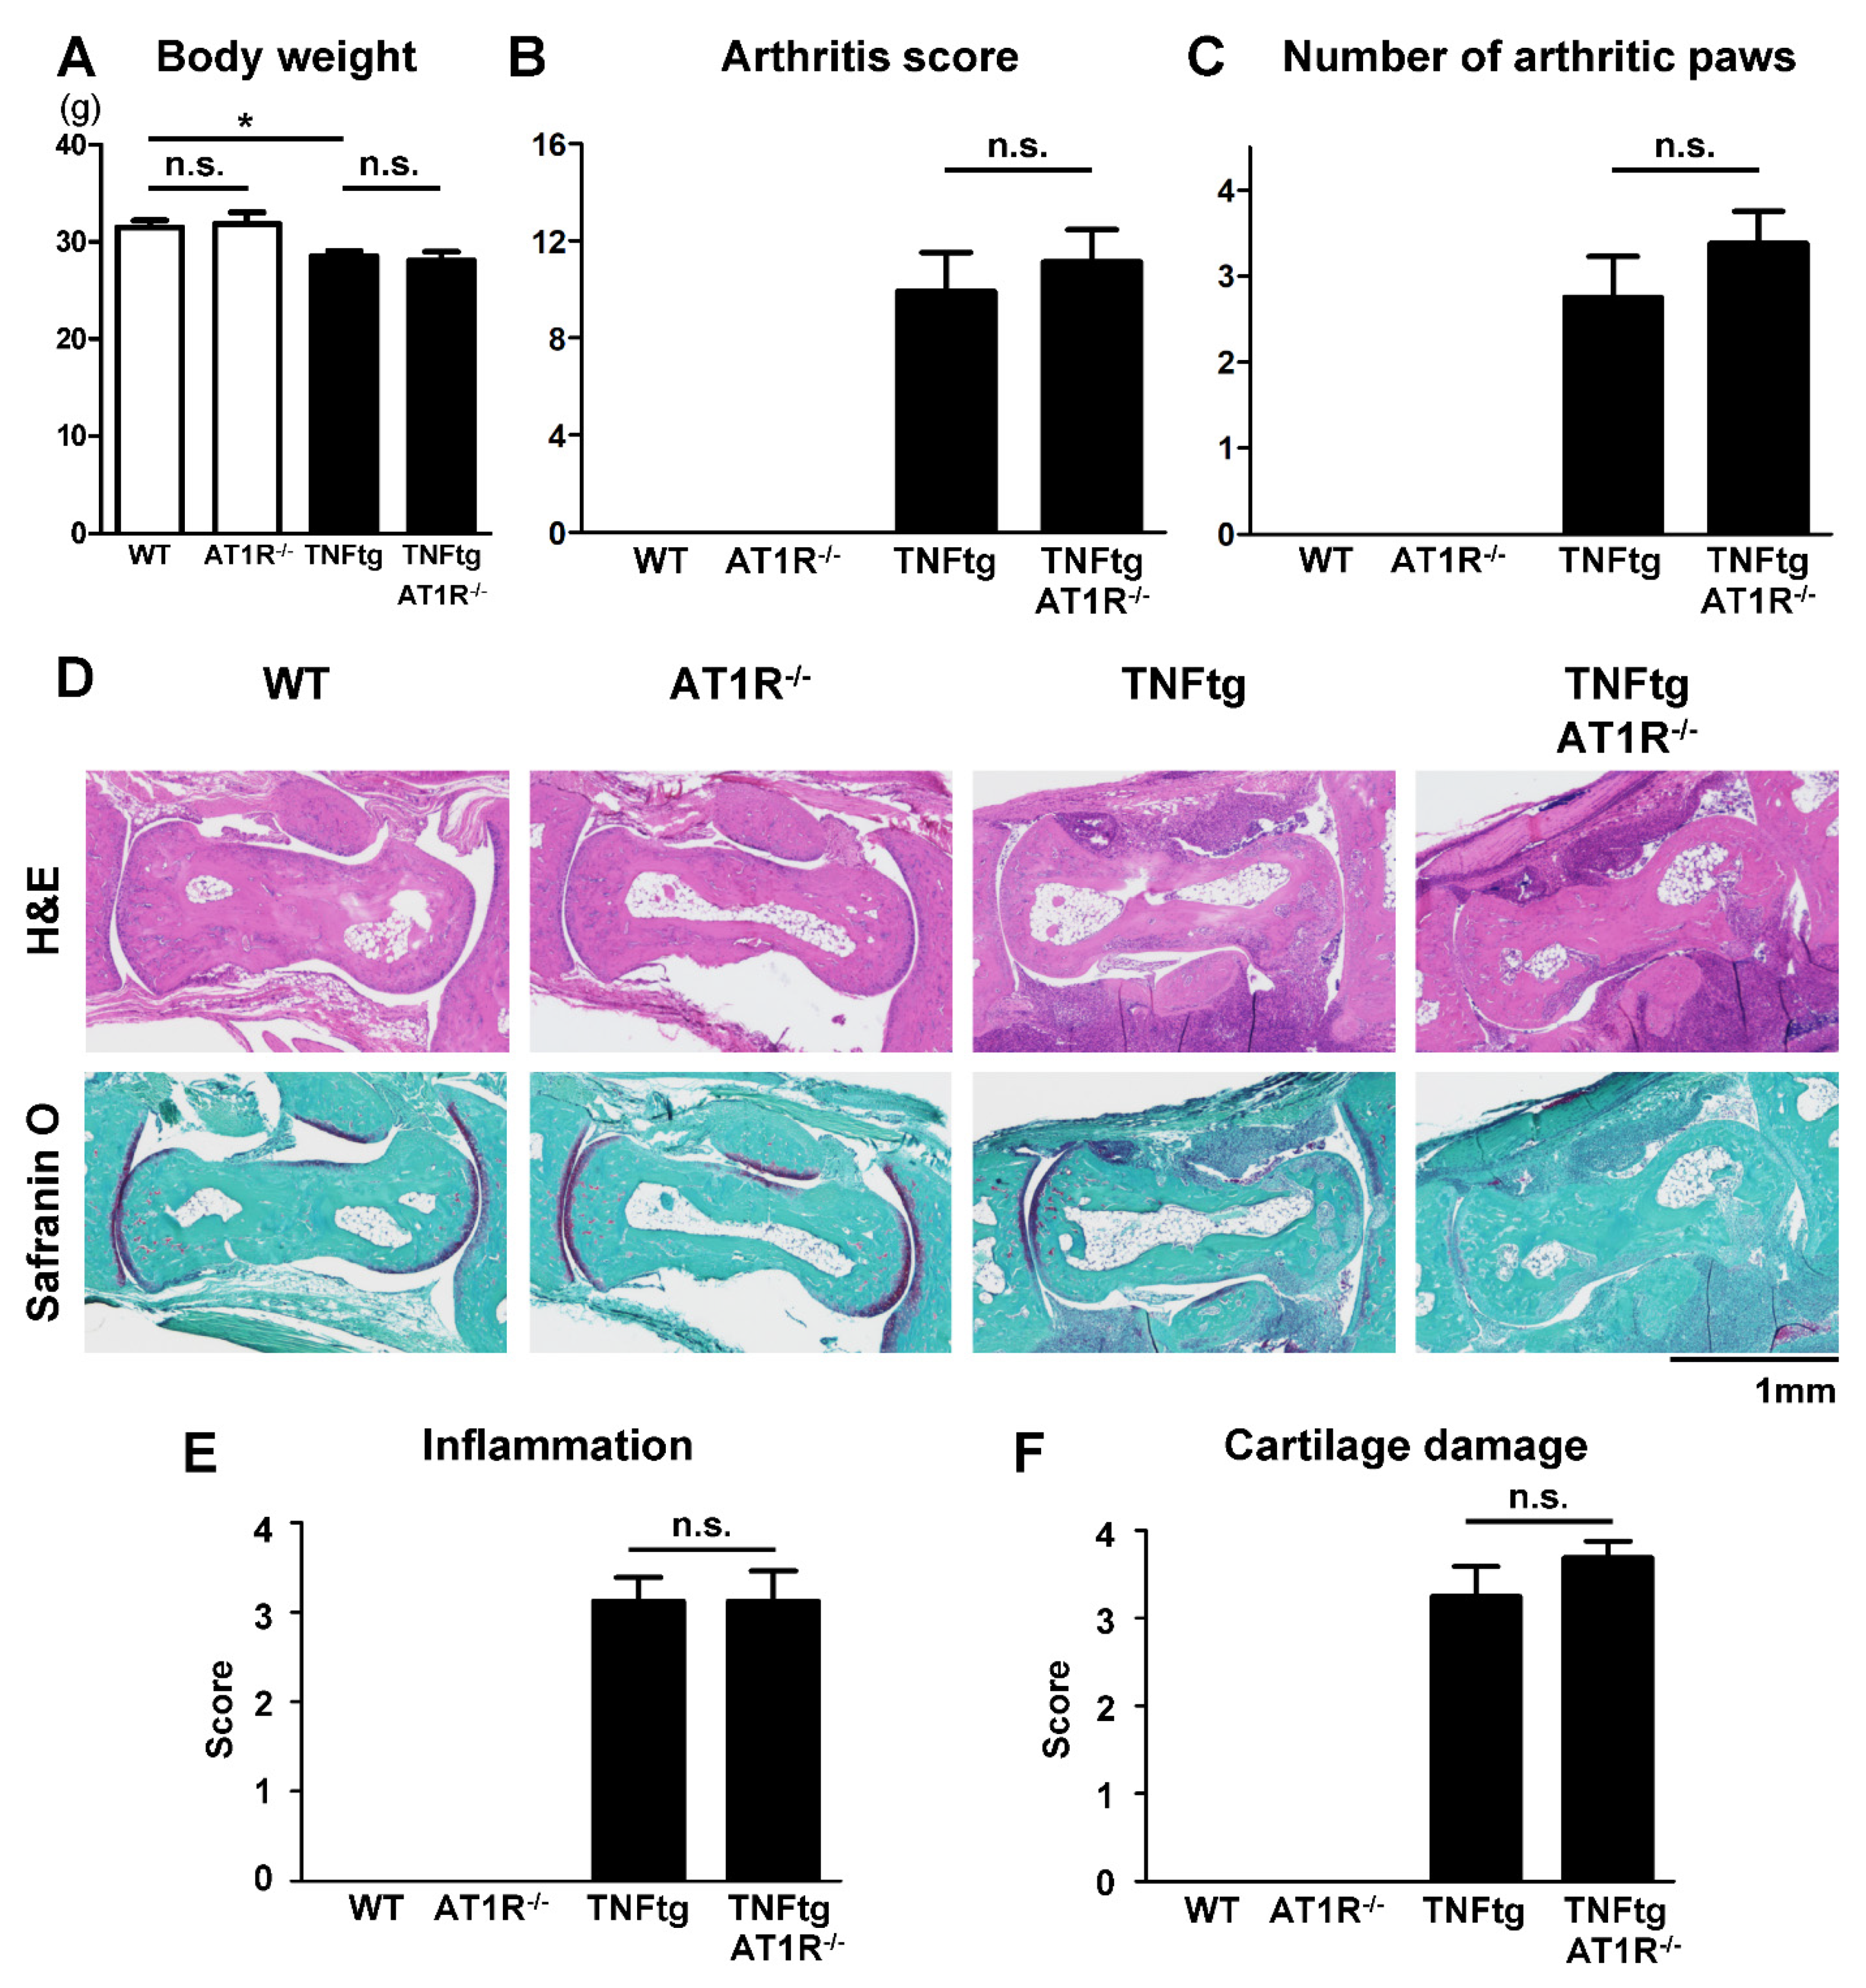
2.5. Effect of AT1R Deficiency on the Severity of Inflammatory Cell Infiltration in TNFtg Mice
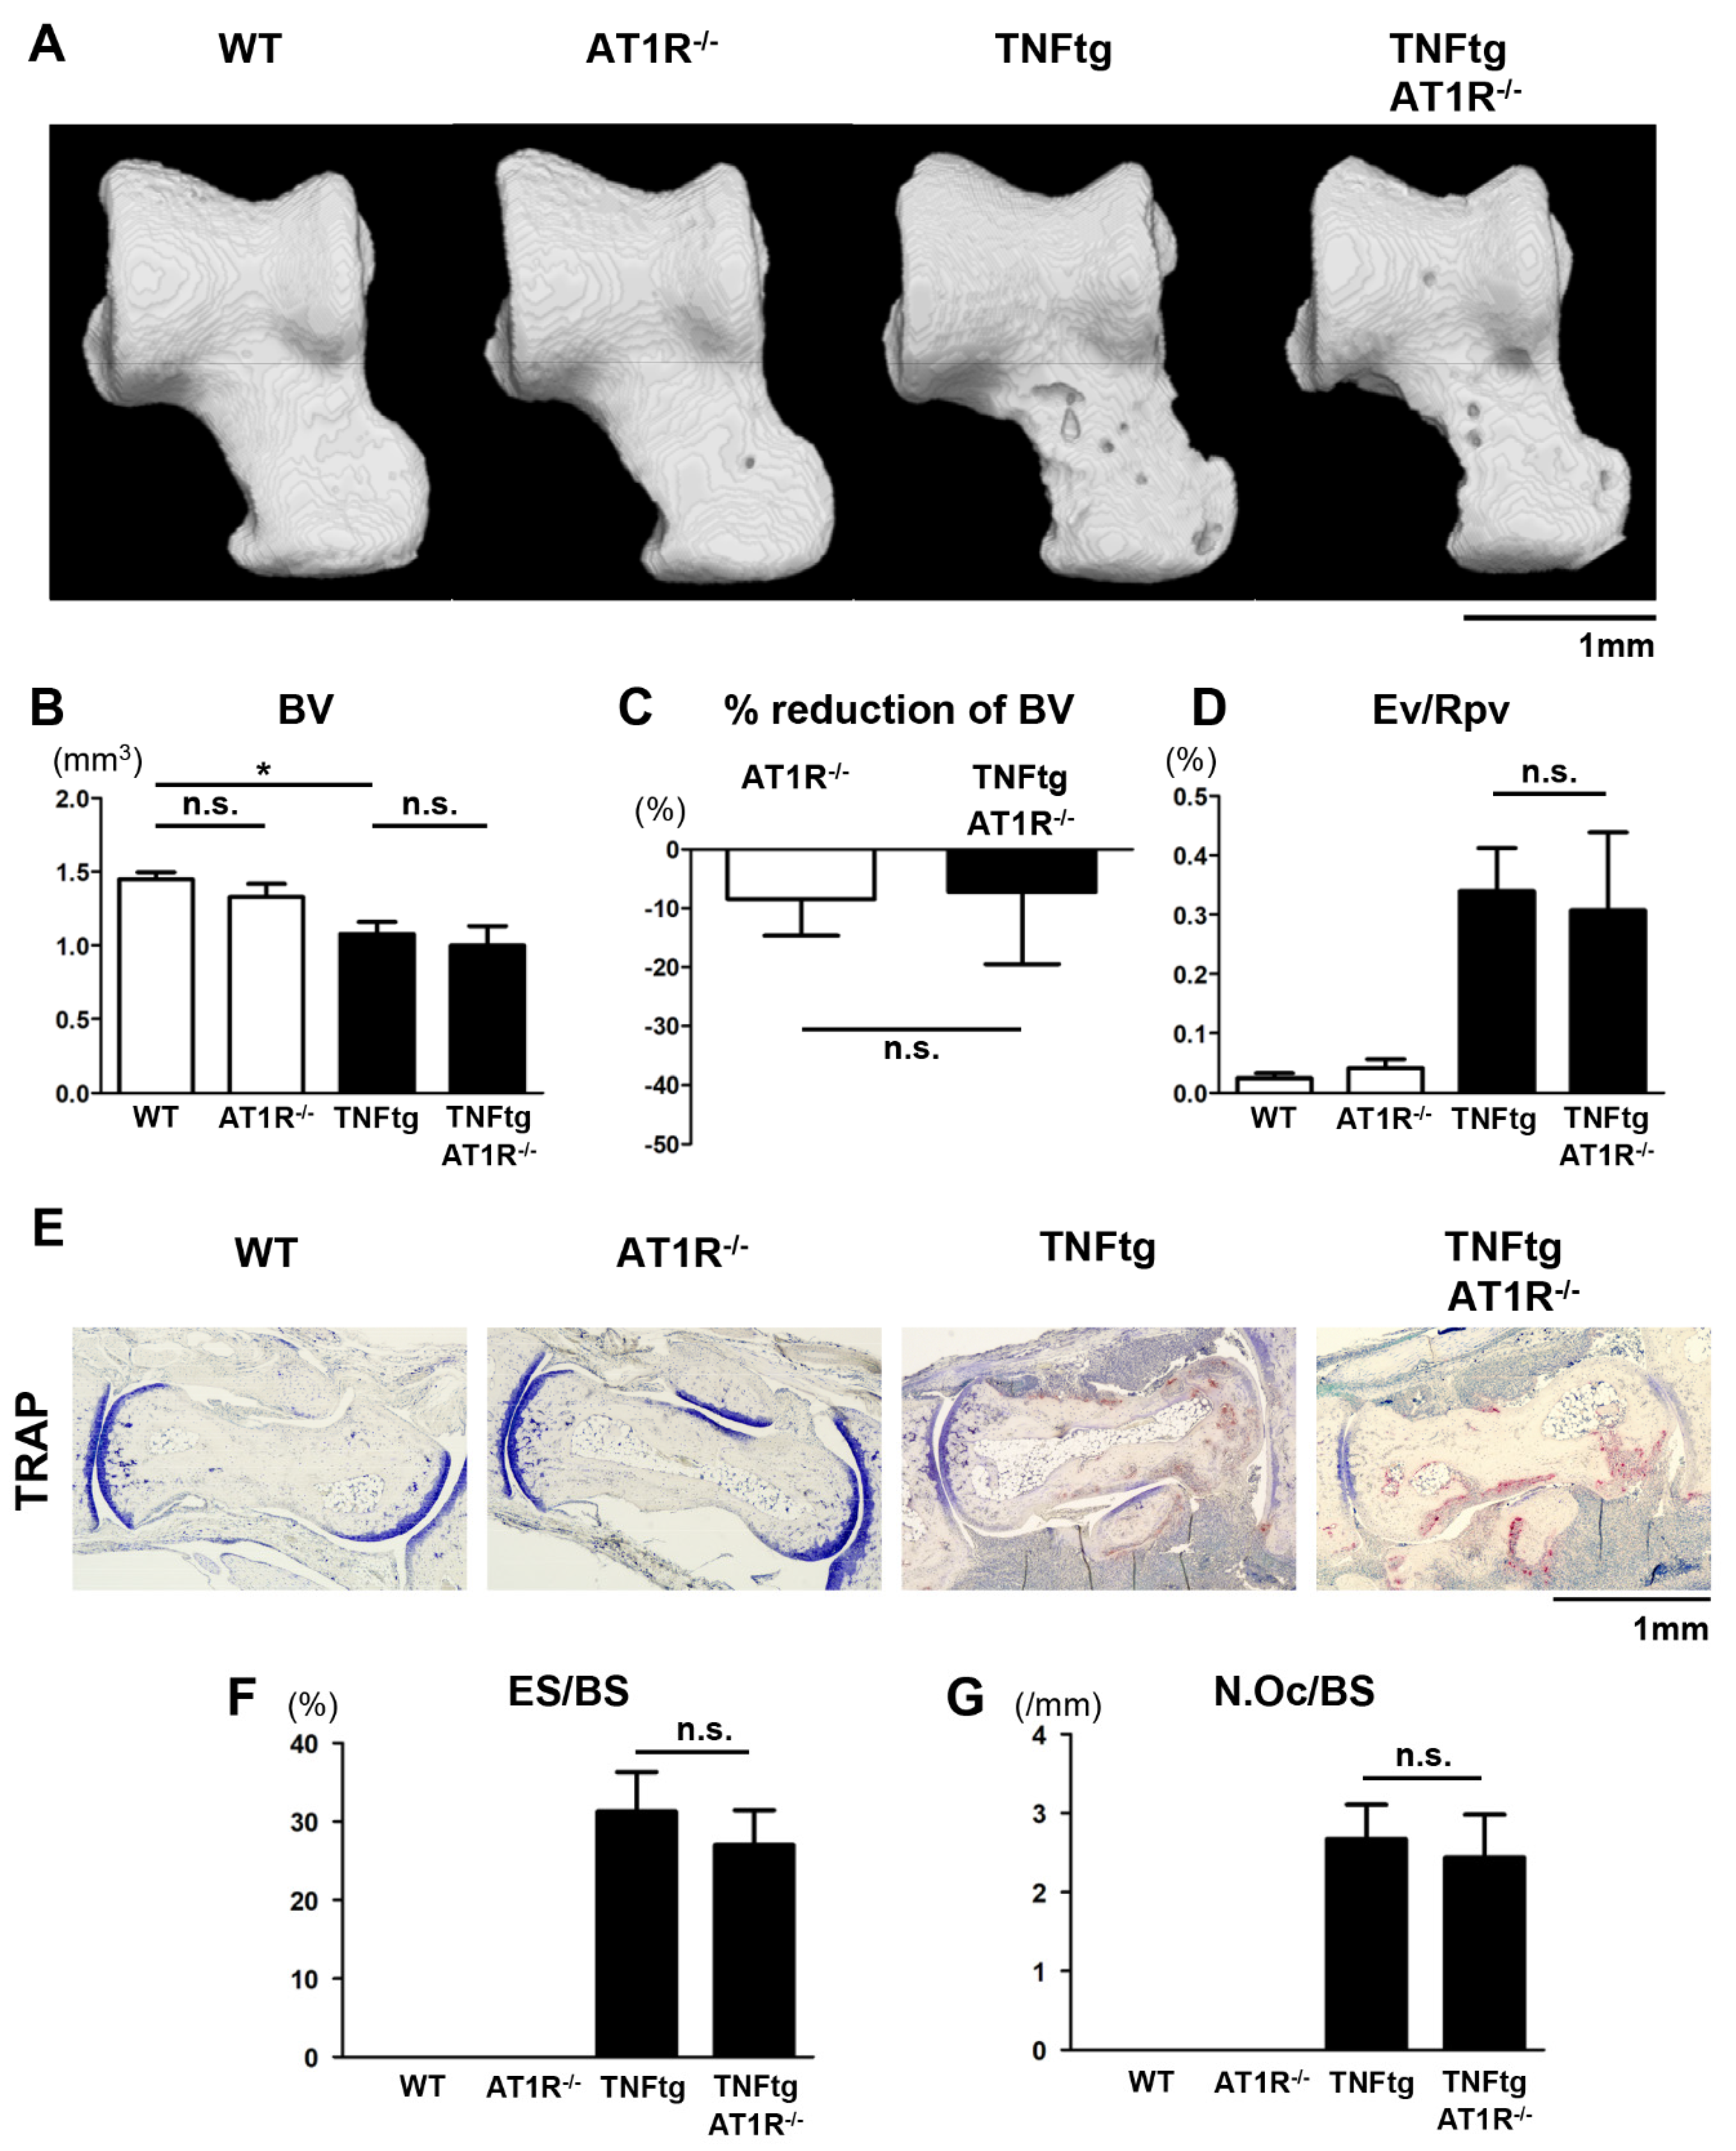
2.6. Influence of AT1R Depletion on Bone Erosion in TNFtg Mice
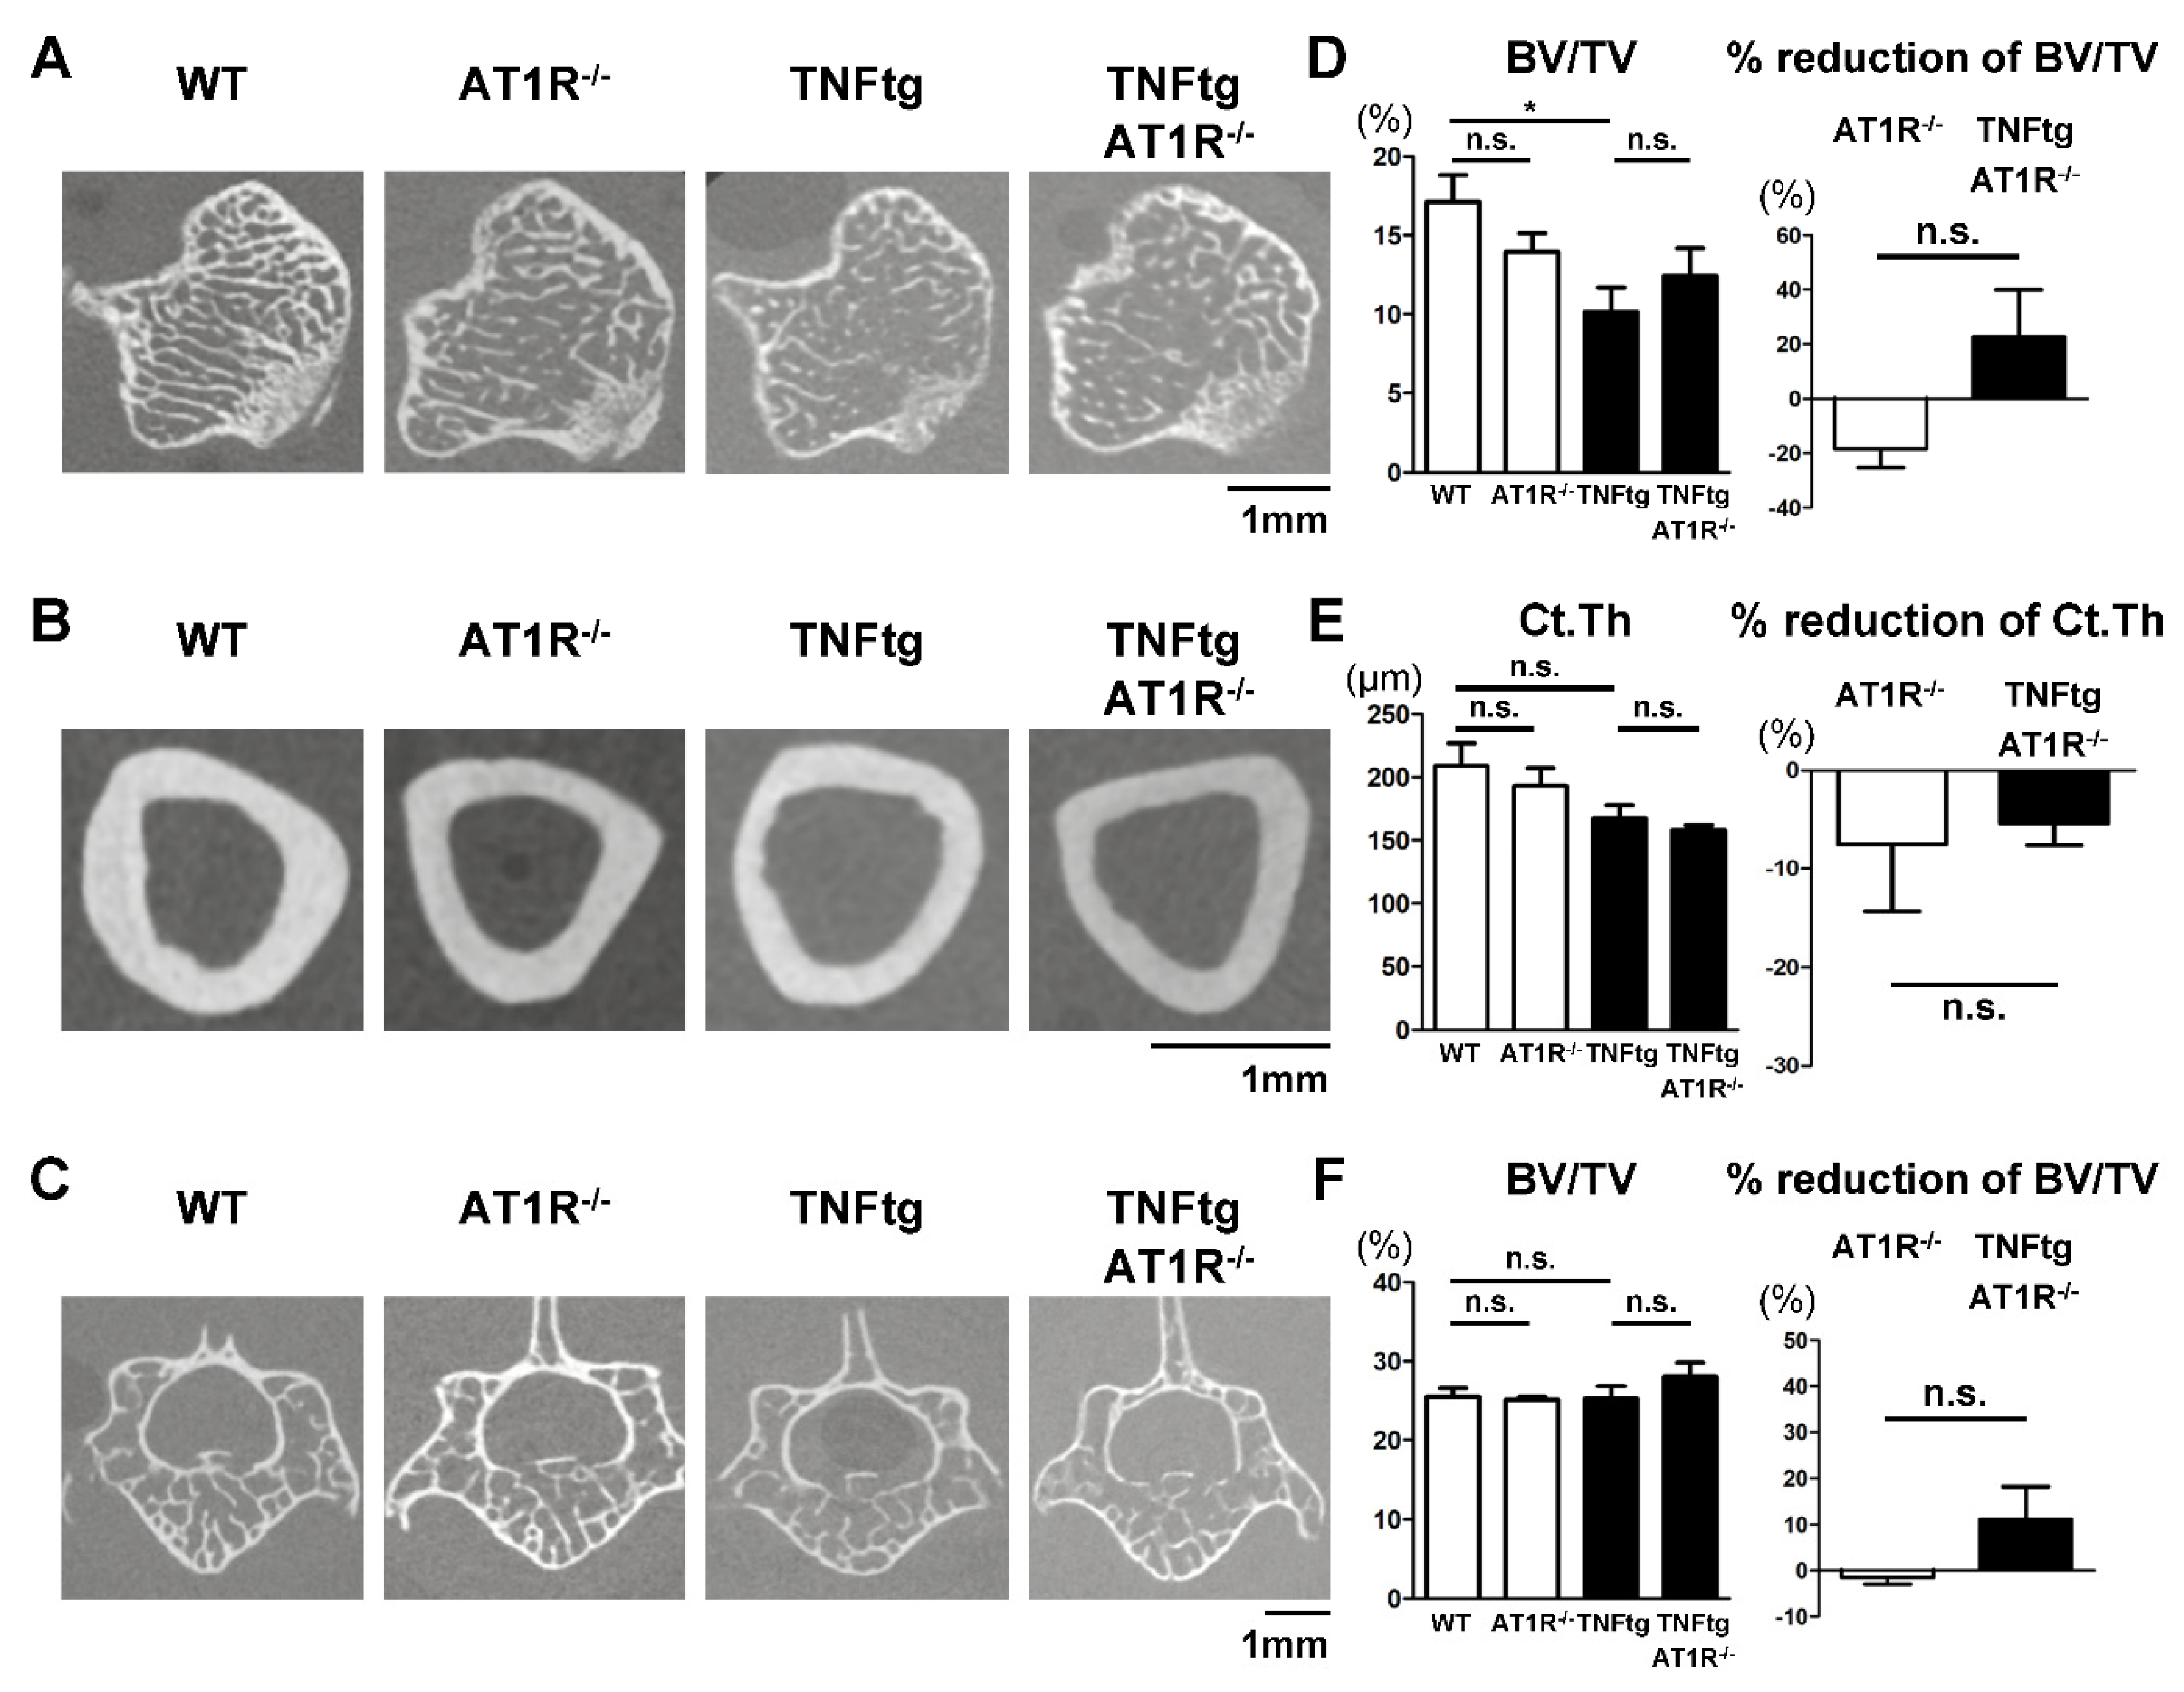
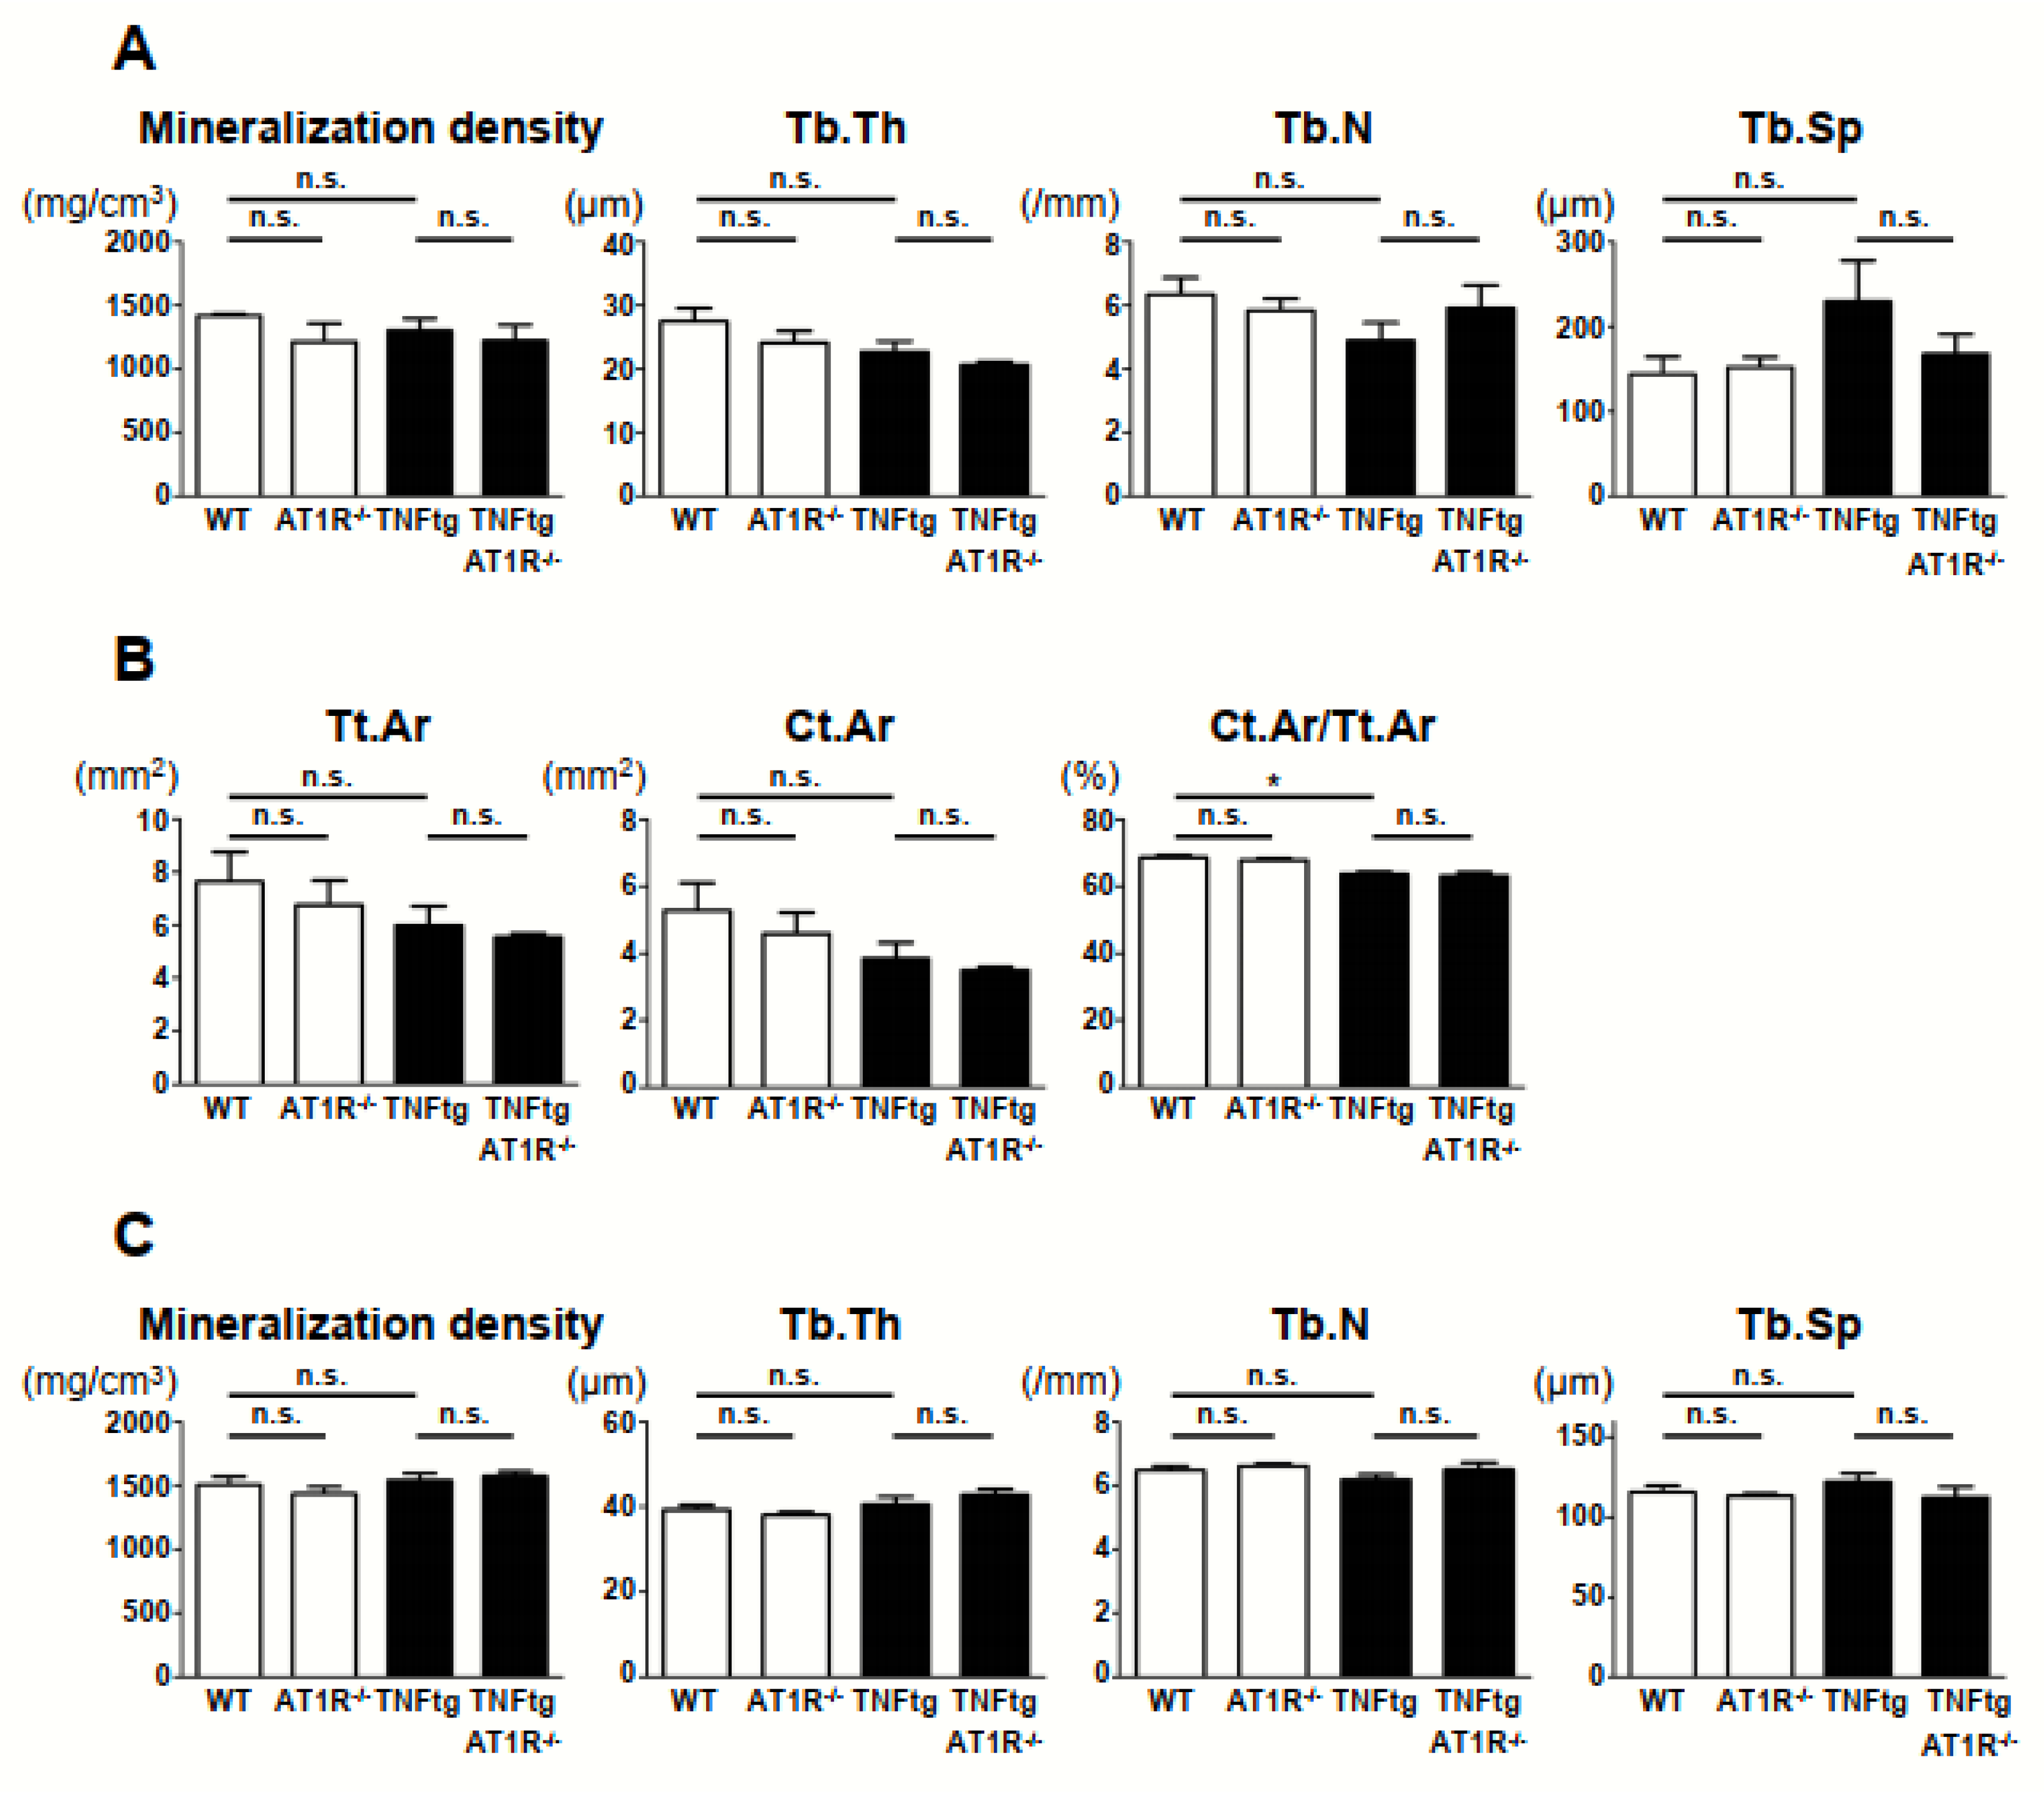
2.7. Effect of AT1R Deficiency on Bone Properties of the Trabecular and Cortical Bones in TNFtg Mice
3. Discussion
4. Materials and Methods
4.1. Mice
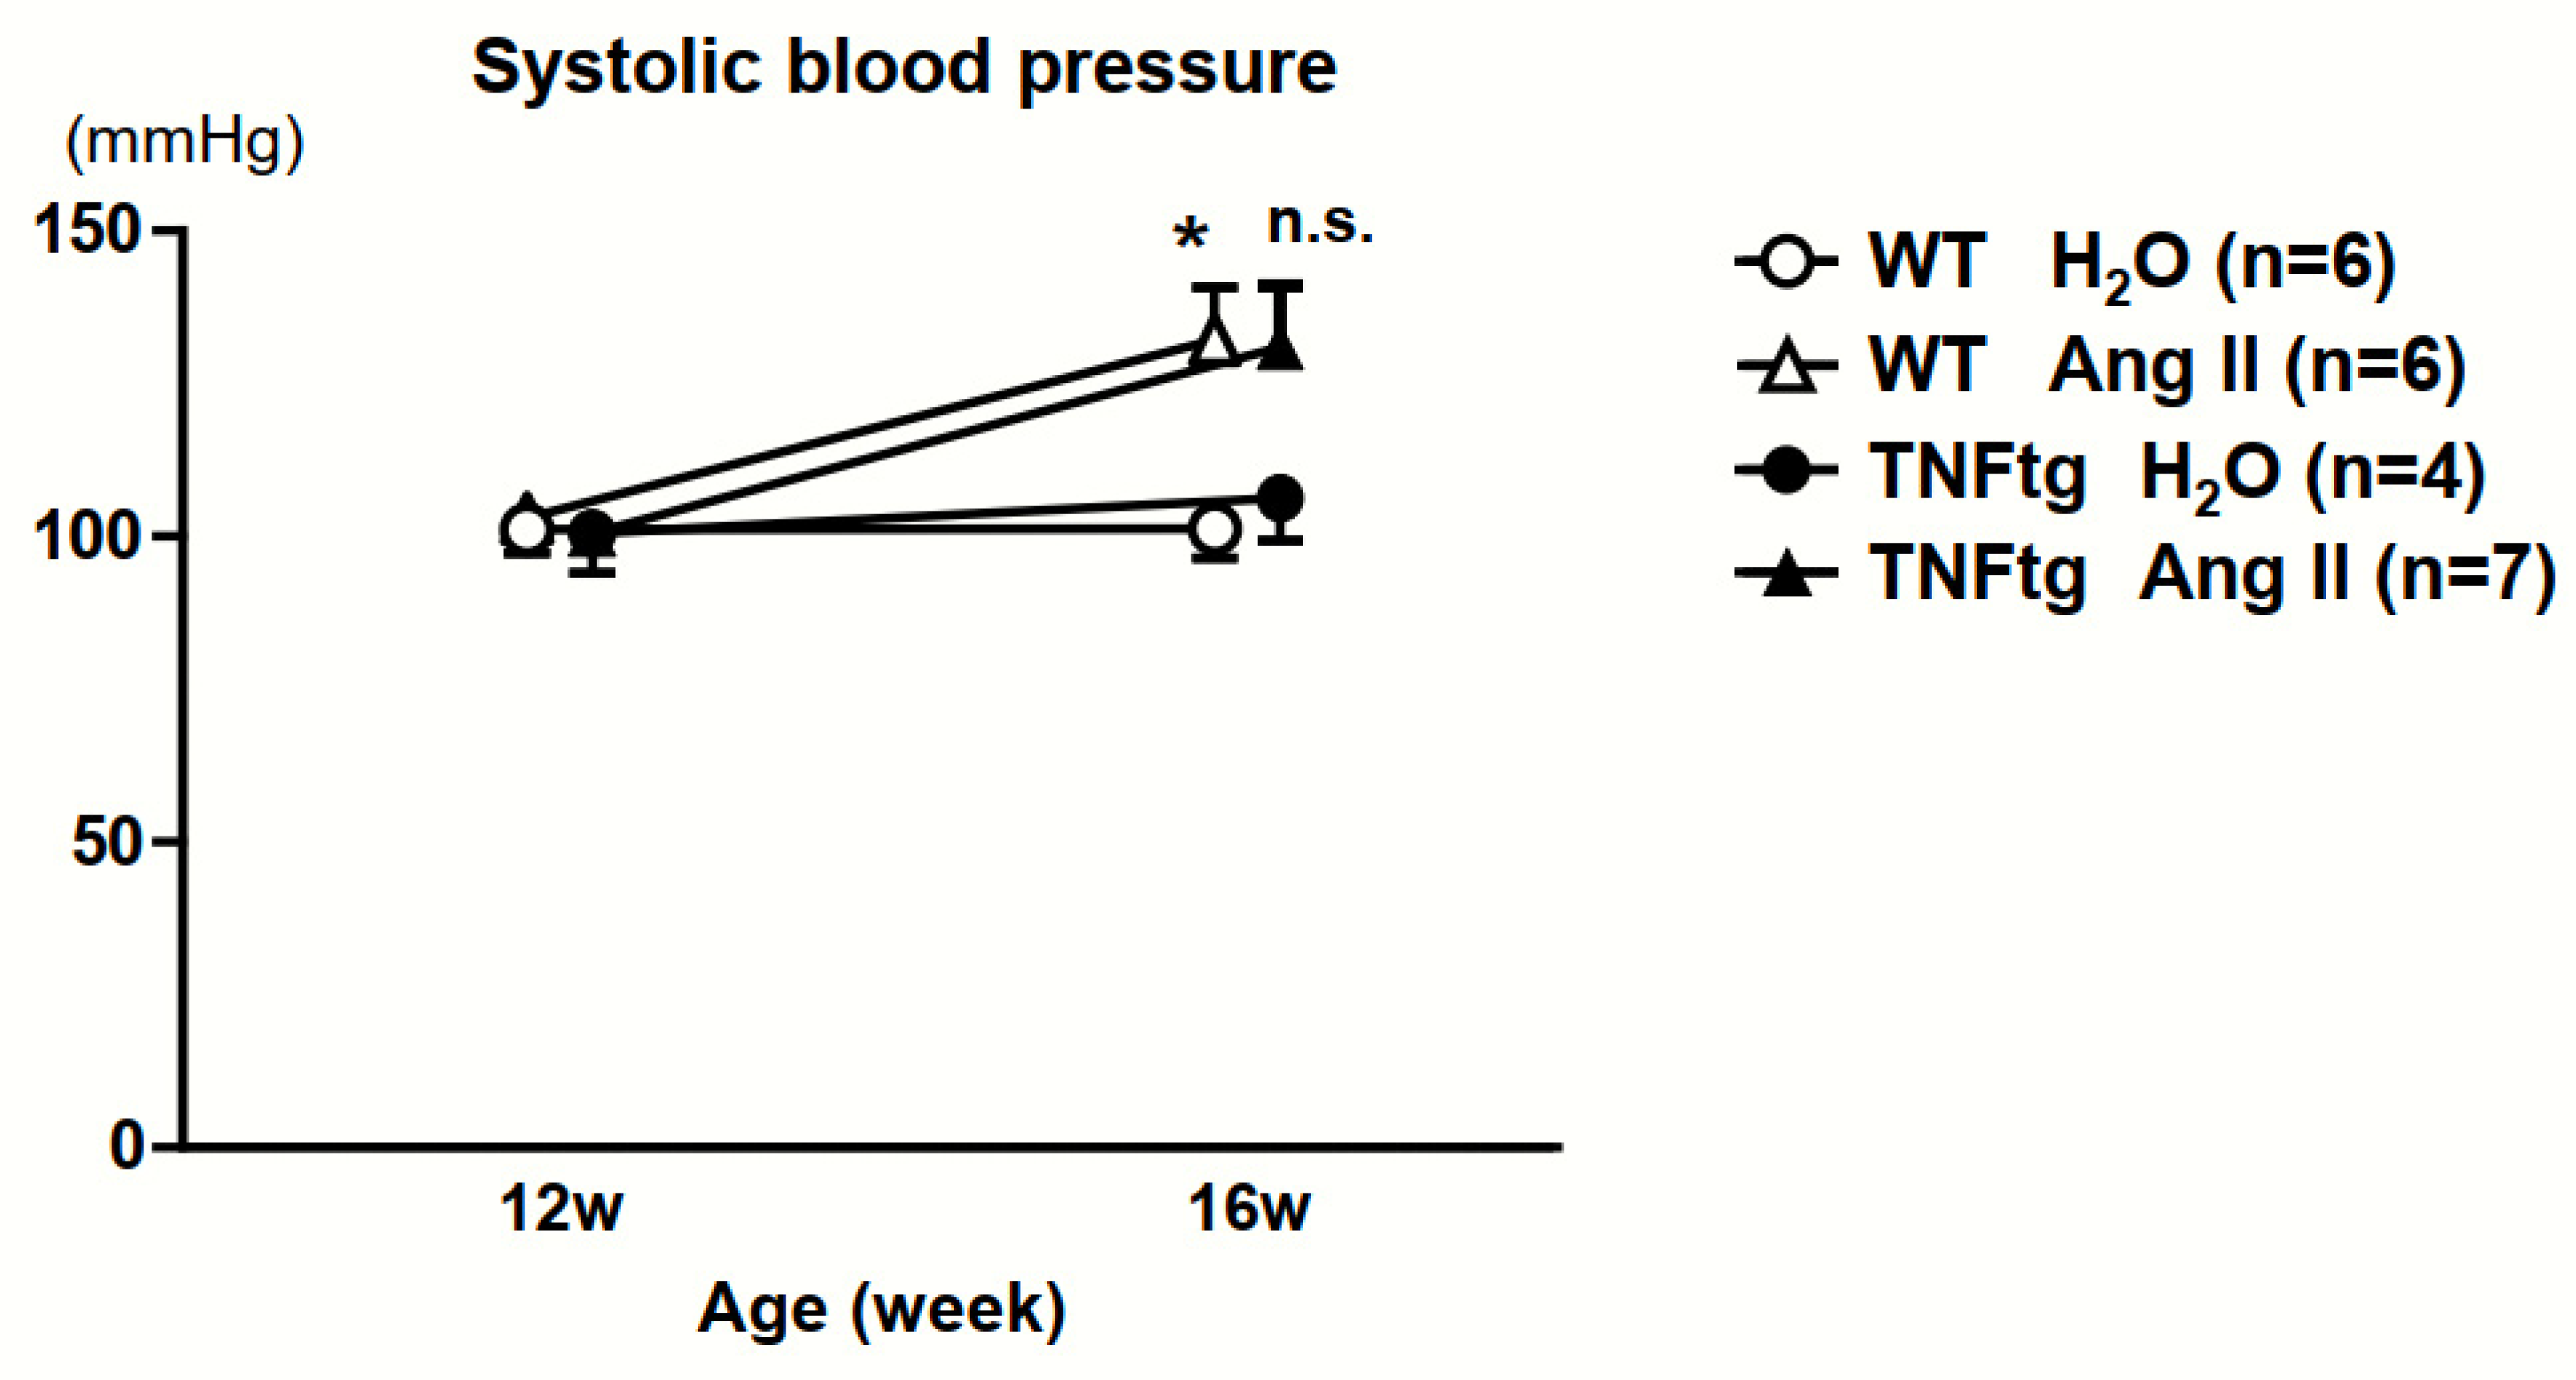
4.2. Ang II Infusion Model
4.3. Micro-Computed Tomography (CT) Analysis
4.4. Histological Analysis
4.5. Real-Time Quantitative Polymerase Chain Reaction (qPCR)
4.6. Statistical Analysis
4.7. Supplementary Methods
Supplementary Materials
Author Contributions
Funding
Acknowledgments
Conflicts of Interest
Abbreviations
| Ang II | Angiotensin II |
| TNF | Tumor necrosis factor |
| TNFtg | Tumor necrosis factor-transgenic |
| AT1R | Angiotensin II type 1 receptor |
| WT | Wild-type |
Appendix A


References
- Aletaha, D.; Smolen, J.S. Diagnosis and Management of Rheumatoid Arthritis: A Review. JAMA 2018, 320, 1360–1372. [Google Scholar] [CrossRef] [PubMed]
- Smolen, J.S.; Aletaha, D.; Barton, A.; Burmester, G.R.; Emery, P.; Firestein, G.S.; Kavanaugh, A.; McInnes, I.B.; Solomon, D.H.; Strand, V.; et al. Rheumatoid arthritis. Nat. Rev. Dis. Primers 2018, 4, 18001. [Google Scholar] [CrossRef] [PubMed]
- Turesson, C.; O’Fallon, W.M.; Crowson, C.S.; Gabriel, S.E.; Matteson, E.L. Extra-articular disease manifestations in rheumatoid arthritis: Incidence trends and risk factors over 46 years. Ann. Rheum. Dis. 2003, 62, 722–727. [Google Scholar] [CrossRef] [PubMed]
- Deal, C. Bone loss in rheumatoid arthritis: Systemic, periarticular, and focal. Curr. Rheumatol. Rep. 2012, 14, 231–237. [Google Scholar] [CrossRef] [PubMed]
- Bader, M. Tissue renin-angiotensin-aldosterone systems: Targets for pharmacological therapy. Annu. Rev. Pharm. Toxicol. 2010, 50, 439–465. [Google Scholar] [CrossRef] [PubMed]
- Tamargo, J.; Caballero, R.; Delpón, E. The Renin–Angiotensin System and Bone. Clin. Rev. Bone Miner. Metab. 2015, 13, 125–148. [Google Scholar] [CrossRef]
- Paul, M.; Poyan Mehr, A.; Kreutz, R. Physiology of local renin-angiotensin systems. Physiol. Rev. 2006, 86, 747–803. [Google Scholar] [CrossRef] [PubMed]
- Kagami, S. Involvement of glomerular renin-angiotensin system (RAS) activation in the development and progression of glomerular injury. Clin. Exp. Nephrol. 2012, 16, 214–220. [Google Scholar] [CrossRef] [PubMed][Green Version]
- Zhao, J.; Yang, H.; Chen, B.; Zhang, R. The skeletal renin-angiotensin system: A potential therapeutic target for the treatment of osteoarticular diseases. Int. Immunopharmacol. 2019, 72, 258–263. [Google Scholar] [CrossRef] [PubMed]
- Izu, Y.; Mizoguchi, F.; Kawamata, A.; Hayata, T.; Nakamoto, T.; Nakashima, K.; Inagami, T.; Ezura, Y.; Noda, M. Angiotensin II type 2 receptor blockade increases bone mass. J. Biol. Chem. 2009, 284, 4857–4864. [Google Scholar] [CrossRef] [PubMed]
- Shimizu, H.; Nakagami, H.; Osako, M.K.; Hanayama, R.; Kunugiza, Y.; Kizawa, T.; Tomita, T.; Yoshikawa, H.; Ogihara, T.; Morishita, R. Angiotensin II accelerates osteoporosis by activating osteoclasts. FASEB J. 2008, 22, 2465–2475. [Google Scholar] [CrossRef] [PubMed]
- Gu, S.S.; Zhang, Y.; Li, X.L.; Wu, S.Y.; Diao, T.Y.; Hai, R.; Deng, H.W. Involvement of the skeletal renin-angiotensin system in age-related osteoporosis of ageing mice. Biosci. Biotechnol. Biochem. 2012, 76, 1367–1371. [Google Scholar] [CrossRef] [PubMed]
- Yongtao, Z.; Kunzheng, W.; Jingjing, Z.; Hu, S.; Jianqiang, K.; Ruiyu, L.; Chunsheng, W. Glucocorticoids activate the local renin-angiotensin system in bone: Possible mechanism for glucocorticoid-induced osteoporosis. Endocrine 2014, 47, 598–608. [Google Scholar] [CrossRef] [PubMed]
- Price, A.; Lockhart, J.C.; Ferrell, W.R.; Gsell, W.; McLean, S.; Sturrock, R.D. Angiotensin II type 1 receptor as a novel therapeutic target in rheumatoid arthritis: In vivo analyses in rodent models of arthritis and ex vivo analyses in human inflammatory synovitis. Arthritis Rheum. 2007, 56, 441–447. [Google Scholar] [CrossRef] [PubMed]
- Pattacini, L.; Casali, B.; Boiardi, L.; Pipitone, N.; Albertazzi, L.; Salvarani, C. Angiotensin II protects fibroblast-like synoviocytes from apoptosis via the AT1-NF-kappaB pathway. Rheumatology 2007, 46, 1252–1257. [Google Scholar] [CrossRef] [PubMed]
- Kaneko, K.; Ito, M.; Fumoto, T.; Fukuhara, R.; Ishida, J.; Fukamizu, A.; Ikeda, K. Physiological function of the angiotensin AT1a receptor in bone remodeling. J. Bone Min. Res. 2011, 26, 2959–2966. [Google Scholar] [CrossRef] [PubMed]
- Asaba, Y.; Ito, M.; Fumoto, T.; Watanabe, K.; Fukuhara, R.; Takeshita, S.; Nimura, Y.; Ishida, J.; Fukamizu, A.; Ikeda, K. Activation of renin-angiotensin system induces osteoporosis independently of hypertension. J. Bone Min. Res. 2009, 24, 241–250. [Google Scholar] [CrossRef] [PubMed]
- Brewster, U.C.; Setaro, J.F.; Perazella, M.A. The renin-angiotensin-aldosterone system: Cardiorenal effects and implications for renal and cardiovascular disease states. Am. J. Med. Sci. 2003, 326, 15–24. [Google Scholar] [CrossRef] [PubMed]
- Siragy, H.M.; Carey, R.M. Role of the intrarenal renin-angiotensin-aldosterone system in chronic kidney disease. Am. J. Nephrol. 2010, 31, 541–550. [Google Scholar] [CrossRef] [PubMed]
- Schett, G.; Gravallese, E. Bone erosion in rheumatoid arthritis: Mechanisms, diagnosis and treatment. Nat. Rev. Rheumatol. 2012, 8, 656–664. [Google Scholar] [CrossRef] [PubMed]
- Terenzi, R.; Manetti, M.; Rosa, I.; Romano, E.; Galluccio, F.; Guiducci, S.; Ibba-Manneschi, L.; Matucci-Cerinic, M. Angiotensin II type 2 receptor (AT2R) as a novel modulator of inflammation in rheumatoid arthritis synovium. Sci. Rep. 2017, 7, 13293. [Google Scholar] [CrossRef] [PubMed]
- Sakuta, T.; Morita, Y.; Satoh, M.; Fox, D.A.; Kashihara, N. Involvement of the renin-angiotensin system in the development of vascular damage in a rat model of arthritis: Effect of angiotensin receptor blockers. Arthritis Rheum. 2010, 62, 1319–1328. [Google Scholar] [CrossRef] [PubMed]
- Hayward, M.D.; Jones, B.K.; Saparov, A.; Hain, H.S.; Trillat, A.C.; Bunzel, M.M.; Corona, A.; Li-Wang, B.; Strenkowski, B.; Giordano, C.; et al. An extensive phenotypic characterization of the hTNFalpha transgenic mice. BMC Physiol. 2007, 7, 13. [Google Scholar] [CrossRef] [PubMed]
- Ito, M.; Oliverio, M.I.; Mannon, P.J.; Best, C.F.; Maeda, N.; Smithies, O.; Coffman, T.M. Regulation of blood pressure by the type 1A angiotensin II receptor gene. Proc. Natl. Acad. Sci. USA 1995, 92, 3521–3525. [Google Scholar] [CrossRef] [PubMed]
- Umebayashi, R.; Uchida, H.A.; Kakio, Y.; Subramanian, V.; Daugherty, A.; Wada, J. Cilostazol Attenuates Angiotensin II-Induced Abdominal Aortic Aneurysms but Not Atherosclerosis in Apolipoprotein E-Deficient Mice. Arter. Thromb. Vasc. Biol. 2018, 38, 903–912. [Google Scholar] [CrossRef] [PubMed]
- Uchida, H.A.; Sugiyama, H.; Takiue, K.; Kikumoto, Y.; Inoue, T.; Makino, H. Development of angiotensin II-induced abdominal aortic aneurysms is independent of catalase in mice. J. Cardiovasc. Pharm. 2011, 58, 633–638. [Google Scholar] [CrossRef]
- Mukai, T.; Gallant, R.; Ishida, S.; Yoshitaka, T.; Kittaka, M.; Nishida, K.; Fox, D.A.; Morita, Y.; Ueki, Y. SH3BP2 gain-of-function mutation exacerbates inflammation and bone loss in a murine collagen-induced arthritis model. PLoS ONE 2014, 9, e105518. [Google Scholar] [CrossRef] [PubMed]
- Mukai, T.; Gallant, R.; Ishida, S.; Kittaka, M.; Yoshitaka, T.; Fox, D.A.; Morita, Y.; Nishida, K.; Rottapel, R.; Ueki, Y. Loss of SH3 domain-binding protein 2 function suppresses bone destruction in tumor necrosis factor-driven and collagen-induced arthritis in mice. Arthritis. Rheumatol. 2015, 67, 656–667. [Google Scholar] [CrossRef] [PubMed]
- Mukai, T.; Ishida, S.; Ishikawa, R.; Yoshitaka, T.; Kittaka, M.; Gallant, R.; Lin, Y.L.; Rottapel, R.; Brotto, M.; Reichenberger, E.J.; et al. SH3BP2 cherubism mutation potentiates TNF-alpha-induced osteoclastogenesis via NFATc1 and TNF-alpha-mediated inflammatory bone loss. J. Bone Min. Res. 2014, 29, 2618–2635. [Google Scholar] [CrossRef] [PubMed]
- Fujita, S.; Mukai, T.; Mito, T.; Kodama, S.; Nagasu, A.; Kittaka, M.; Sone, T.; Ueki, Y.; Morita, Y. Pharmacological inhibition of tankyrase induces bone loss in mice by increasing osteoclastogenesis. Bone 2018, 106, 156–166. [Google Scholar] [CrossRef]
- Bouxsein, M.L.; Boyd, S.K.; Christiansen, B.A.; Guldberg, R.E.; Jepsen, K.J.; Muller, R. Guidelines for assessment of bone microstructure in rodents using micro-computed tomography. J. Bone Min. Res. 2010, 25, 1468–1486. [Google Scholar] [CrossRef] [PubMed]
- Danks, L.; Komatsu, N.; Guerrini, M.M.; Sawa, S.; Armaka, M.; Kollias, G.; Nakashima, T.; Takayanagi, H. RANKL expressed on synovial fibroblasts is primarily responsible for bone erosions during joint inflammation. Ann. Rheum. Dis. 2016, 75, 1187–1195. [Google Scholar] [CrossRef] [PubMed]
- Fujii, Y.; Inoue, H.; Arai, Y.; Shimomura, S.; Nakagawa, S.; Kishida, T.; Tsuchida, S.; Kamada, Y.; Kaihara, K.; Shirai, T.; et al. Treadmill Running in Established Phase Arthritis Inhibits Joint Destruction in Rat Rheumatoid Arthritis Models. Int. J. Mol. Sci. 2019, 20, 5100. [Google Scholar] [CrossRef] [PubMed]
- Nagasu, A.; Mukai, T.; Iseki, M.; Kawahara, K.; Tsuji, S.; Nagasu, H.; Ueki, Y.; Ishihara, K.; Kashihara, N.; Morita, Y. Sh3bp2 Gain-Of-Function Mutation Ameliorates Lupus Phenotypes in B6.MRL-Fas(lpr) Mice. Cells 2019, 8, 402. [Google Scholar] [CrossRef] [PubMed]


© 2020 by the authors. Licensee MDPI, Basel, Switzerland. This article is an open access article distributed under the terms and conditions of the Creative Commons Attribution (CC BY) license (http://creativecommons.org/licenses/by/4.0/).
Share and Cite
Akagi, T.; Mukai, T.; Mito, T.; Kawahara, K.; Tsuji, S.; Fujita, S.; Uchida, H.A.; Morita, Y. Effect of Angiotensin II on Bone Erosion and Systemic Bone Loss in Mice with Tumor Necrosis Factor-Mediated Arthritis. Int. J. Mol. Sci. 2020, 21, 4145. https://doi.org/10.3390/ijms21114145
Akagi T, Mukai T, Mito T, Kawahara K, Tsuji S, Fujita S, Uchida HA, Morita Y. Effect of Angiotensin II on Bone Erosion and Systemic Bone Loss in Mice with Tumor Necrosis Factor-Mediated Arthritis. International Journal of Molecular Sciences. 2020; 21(11):4145. https://doi.org/10.3390/ijms21114145
Chicago/Turabian StyleAkagi, Takahiko, Tomoyuki Mukai, Takafumi Mito, Kyoko Kawahara, Shoko Tsuji, Shunichi Fujita, Haruhito A. Uchida, and Yoshitaka Morita. 2020. "Effect of Angiotensin II on Bone Erosion and Systemic Bone Loss in Mice with Tumor Necrosis Factor-Mediated Arthritis" International Journal of Molecular Sciences 21, no. 11: 4145. https://doi.org/10.3390/ijms21114145
APA StyleAkagi, T., Mukai, T., Mito, T., Kawahara, K., Tsuji, S., Fujita, S., Uchida, H. A., & Morita, Y. (2020). Effect of Angiotensin II on Bone Erosion and Systemic Bone Loss in Mice with Tumor Necrosis Factor-Mediated Arthritis. International Journal of Molecular Sciences, 21(11), 4145. https://doi.org/10.3390/ijms21114145