Iroquois Homeobox Protein 2 Identified as a Potential Biomarker for Parkinson’s Disease

 , , and
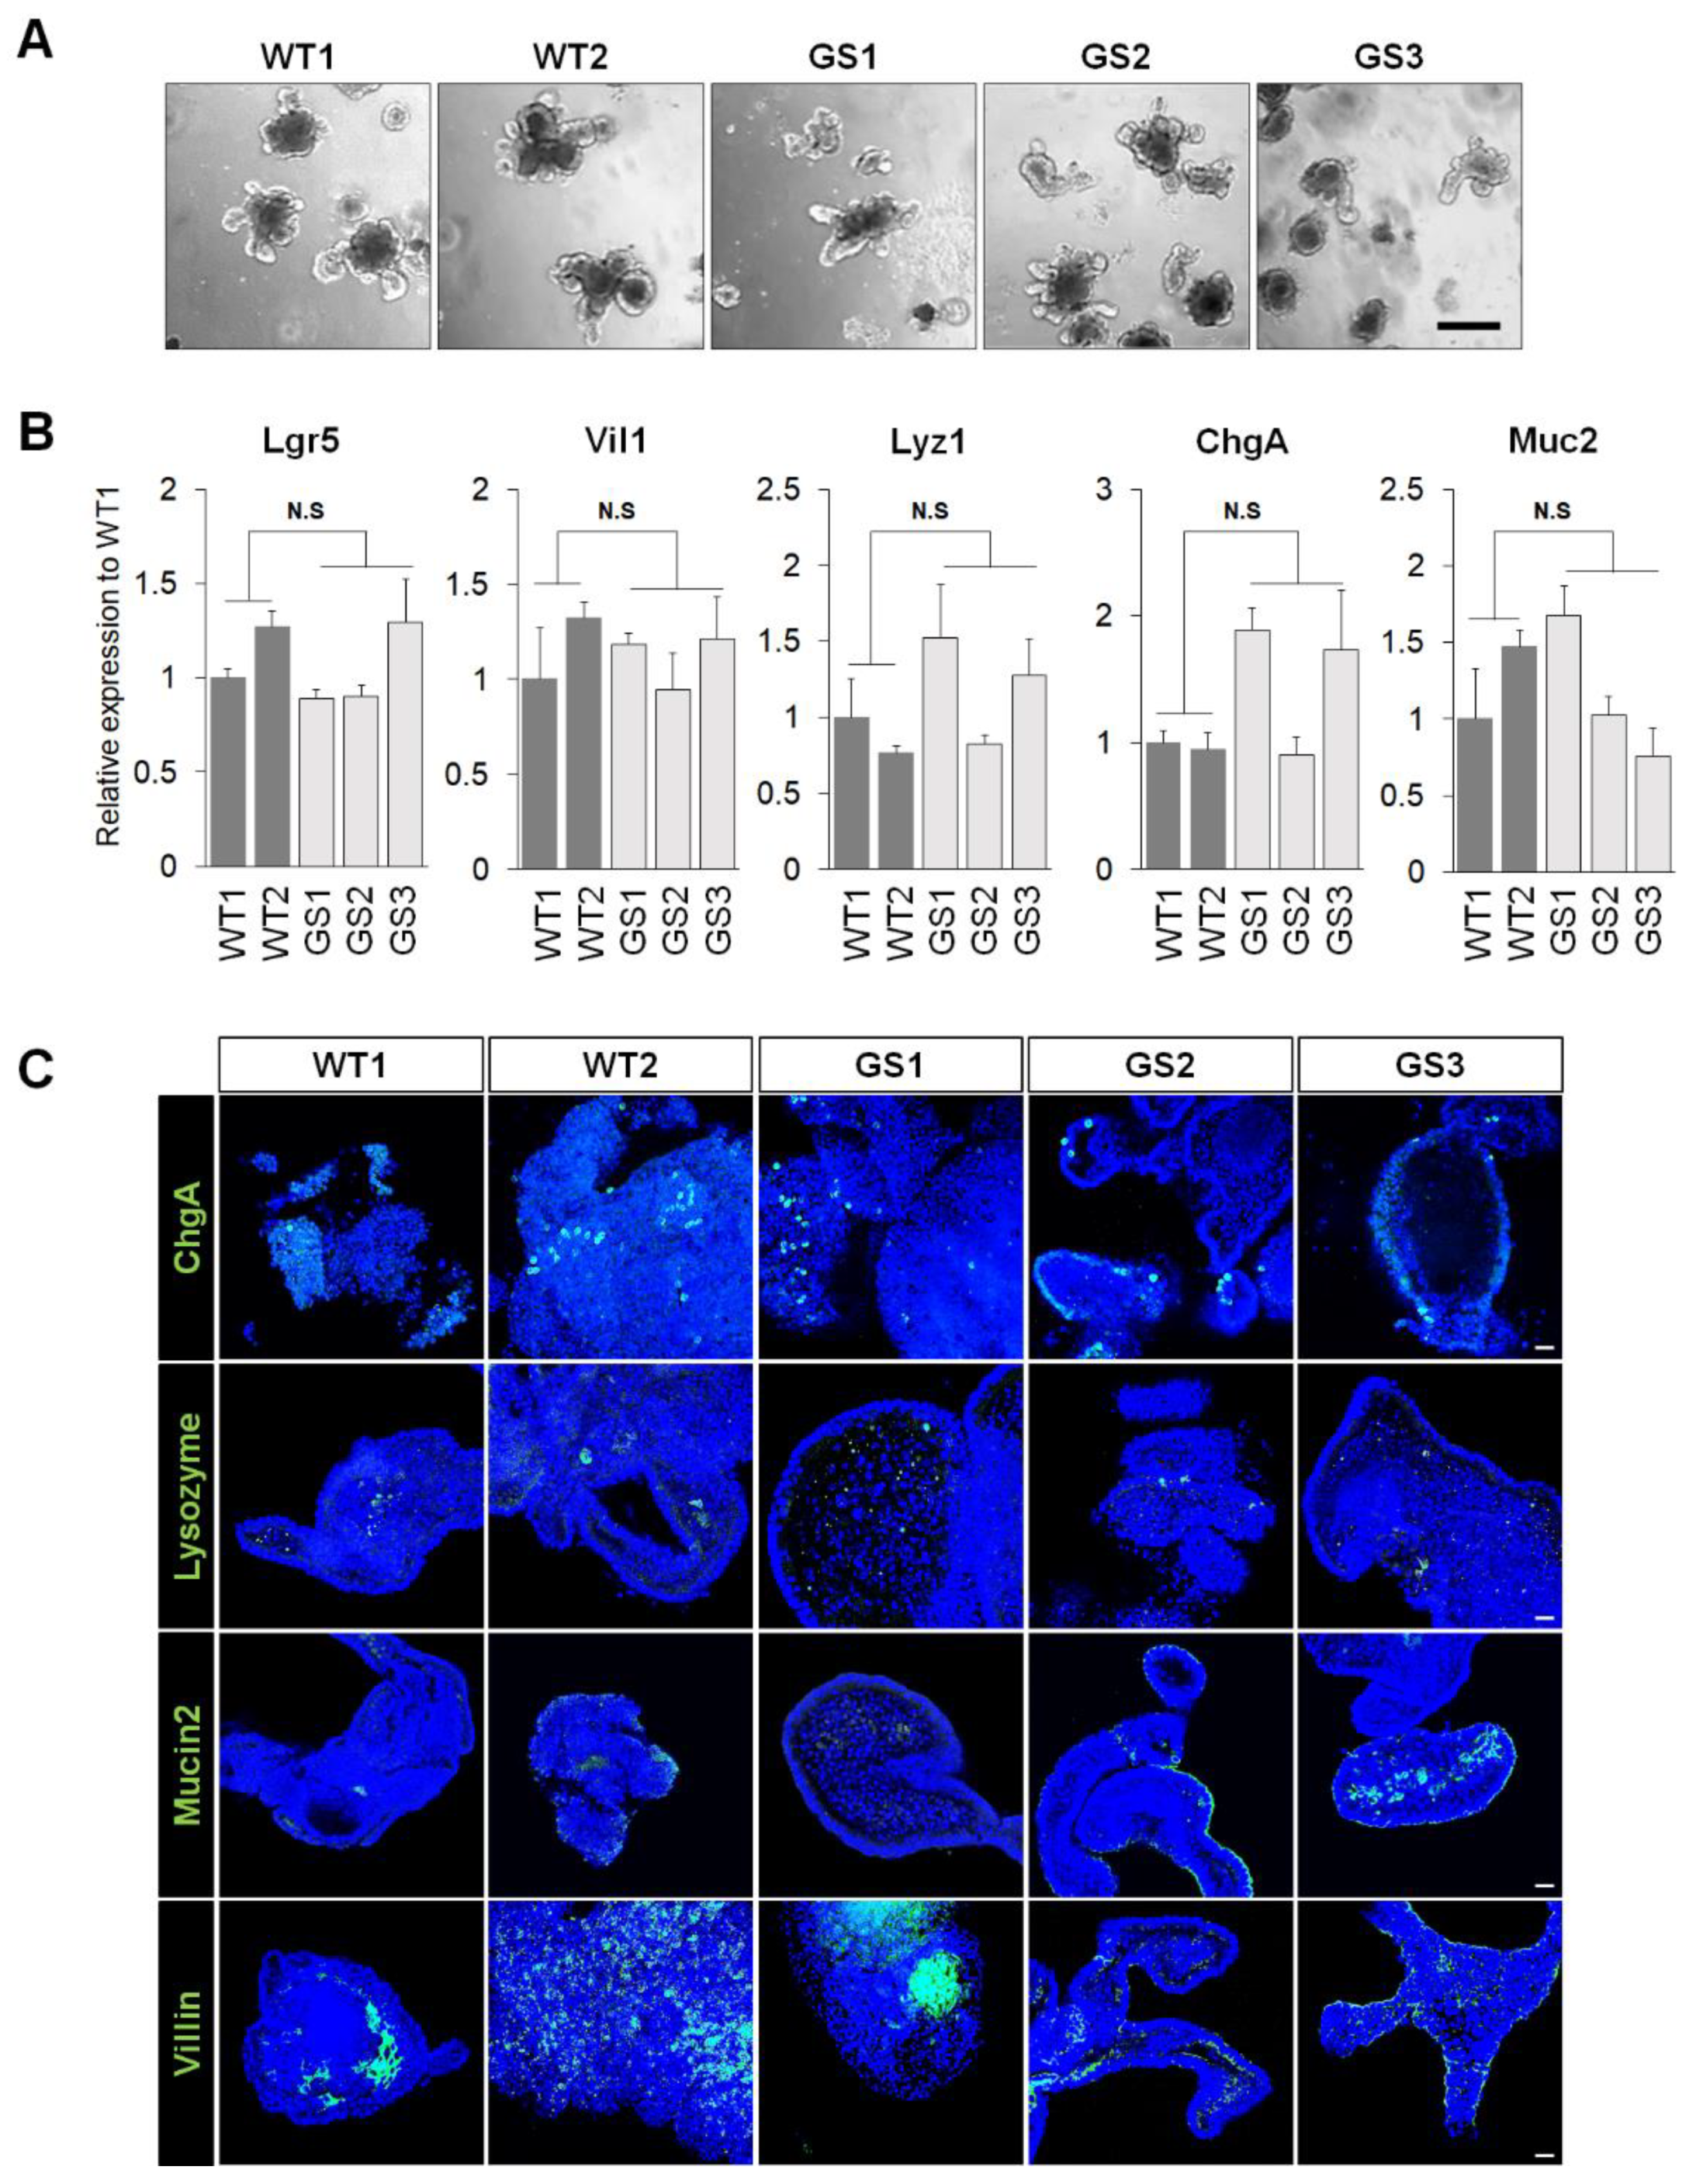
Abstract
1. Introduction
2. Results
2.1. Generation of Mouse Intestinal Organoids from Human LRRK2 G2019S Transgenic Mice and Littermate Controls
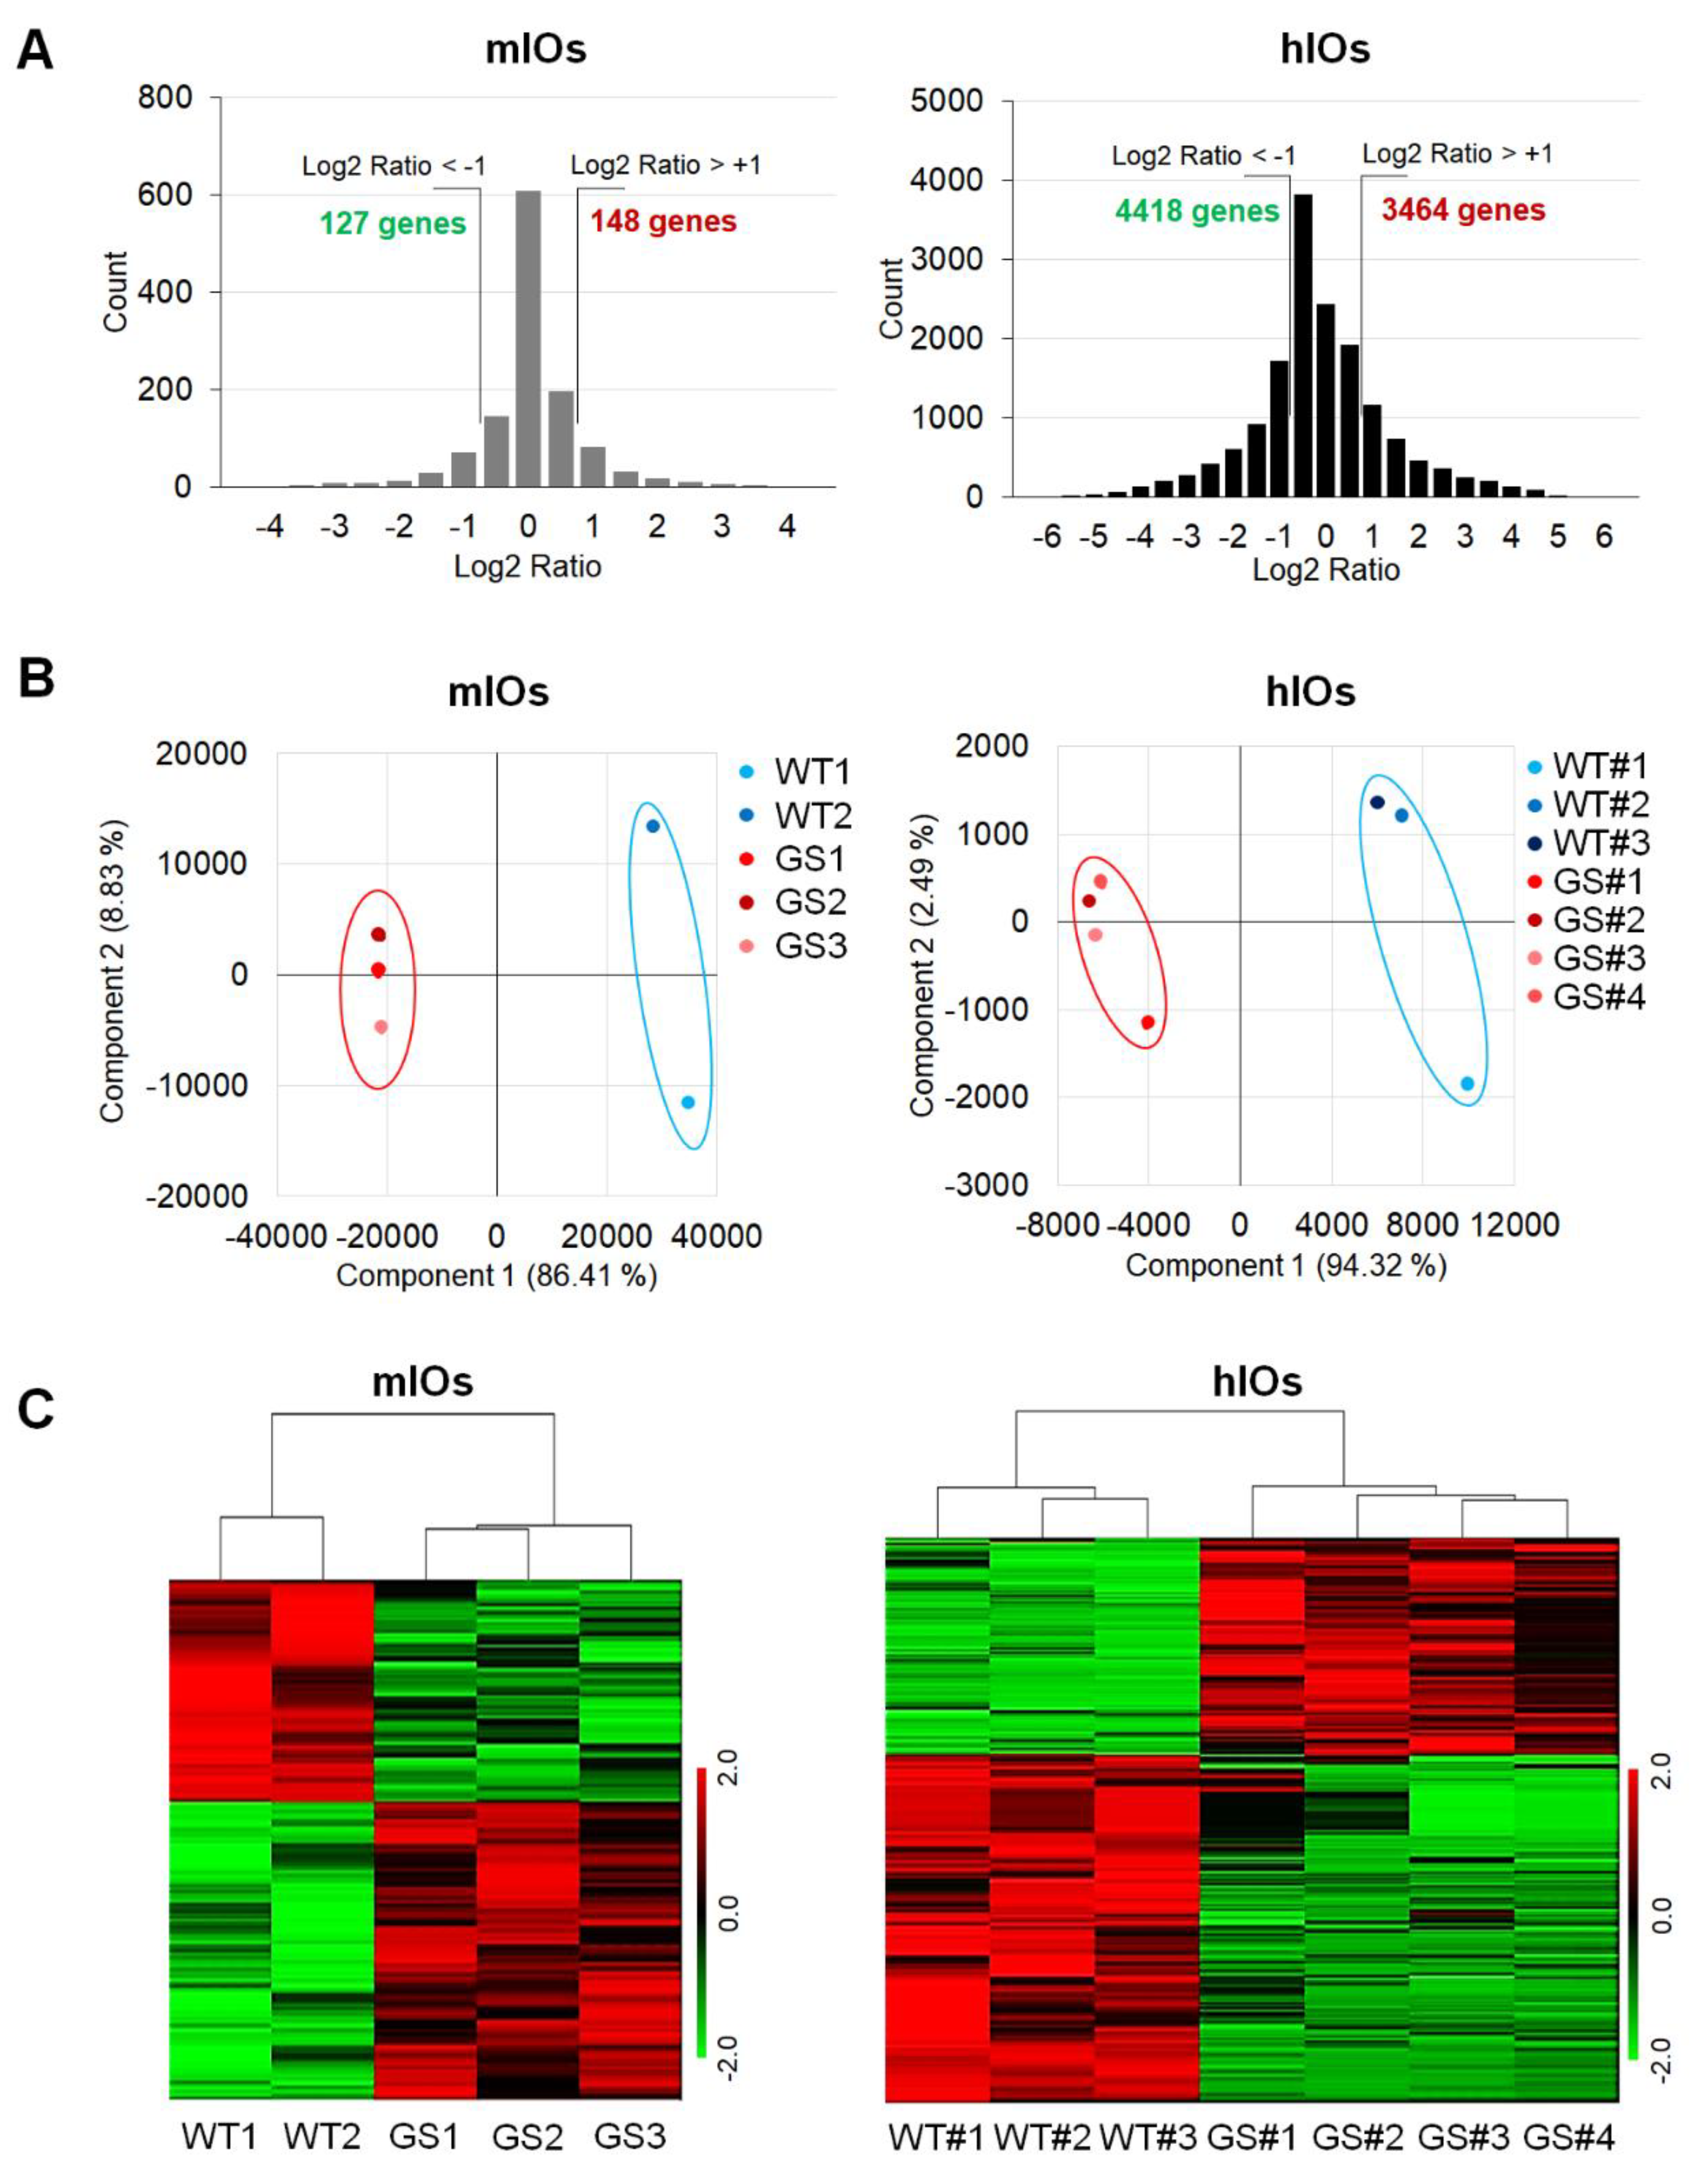
2.2. Comparative Transcriptome Analysis of Ex Vivo Cultured mIOs and In Vitro Differentiated hIOs
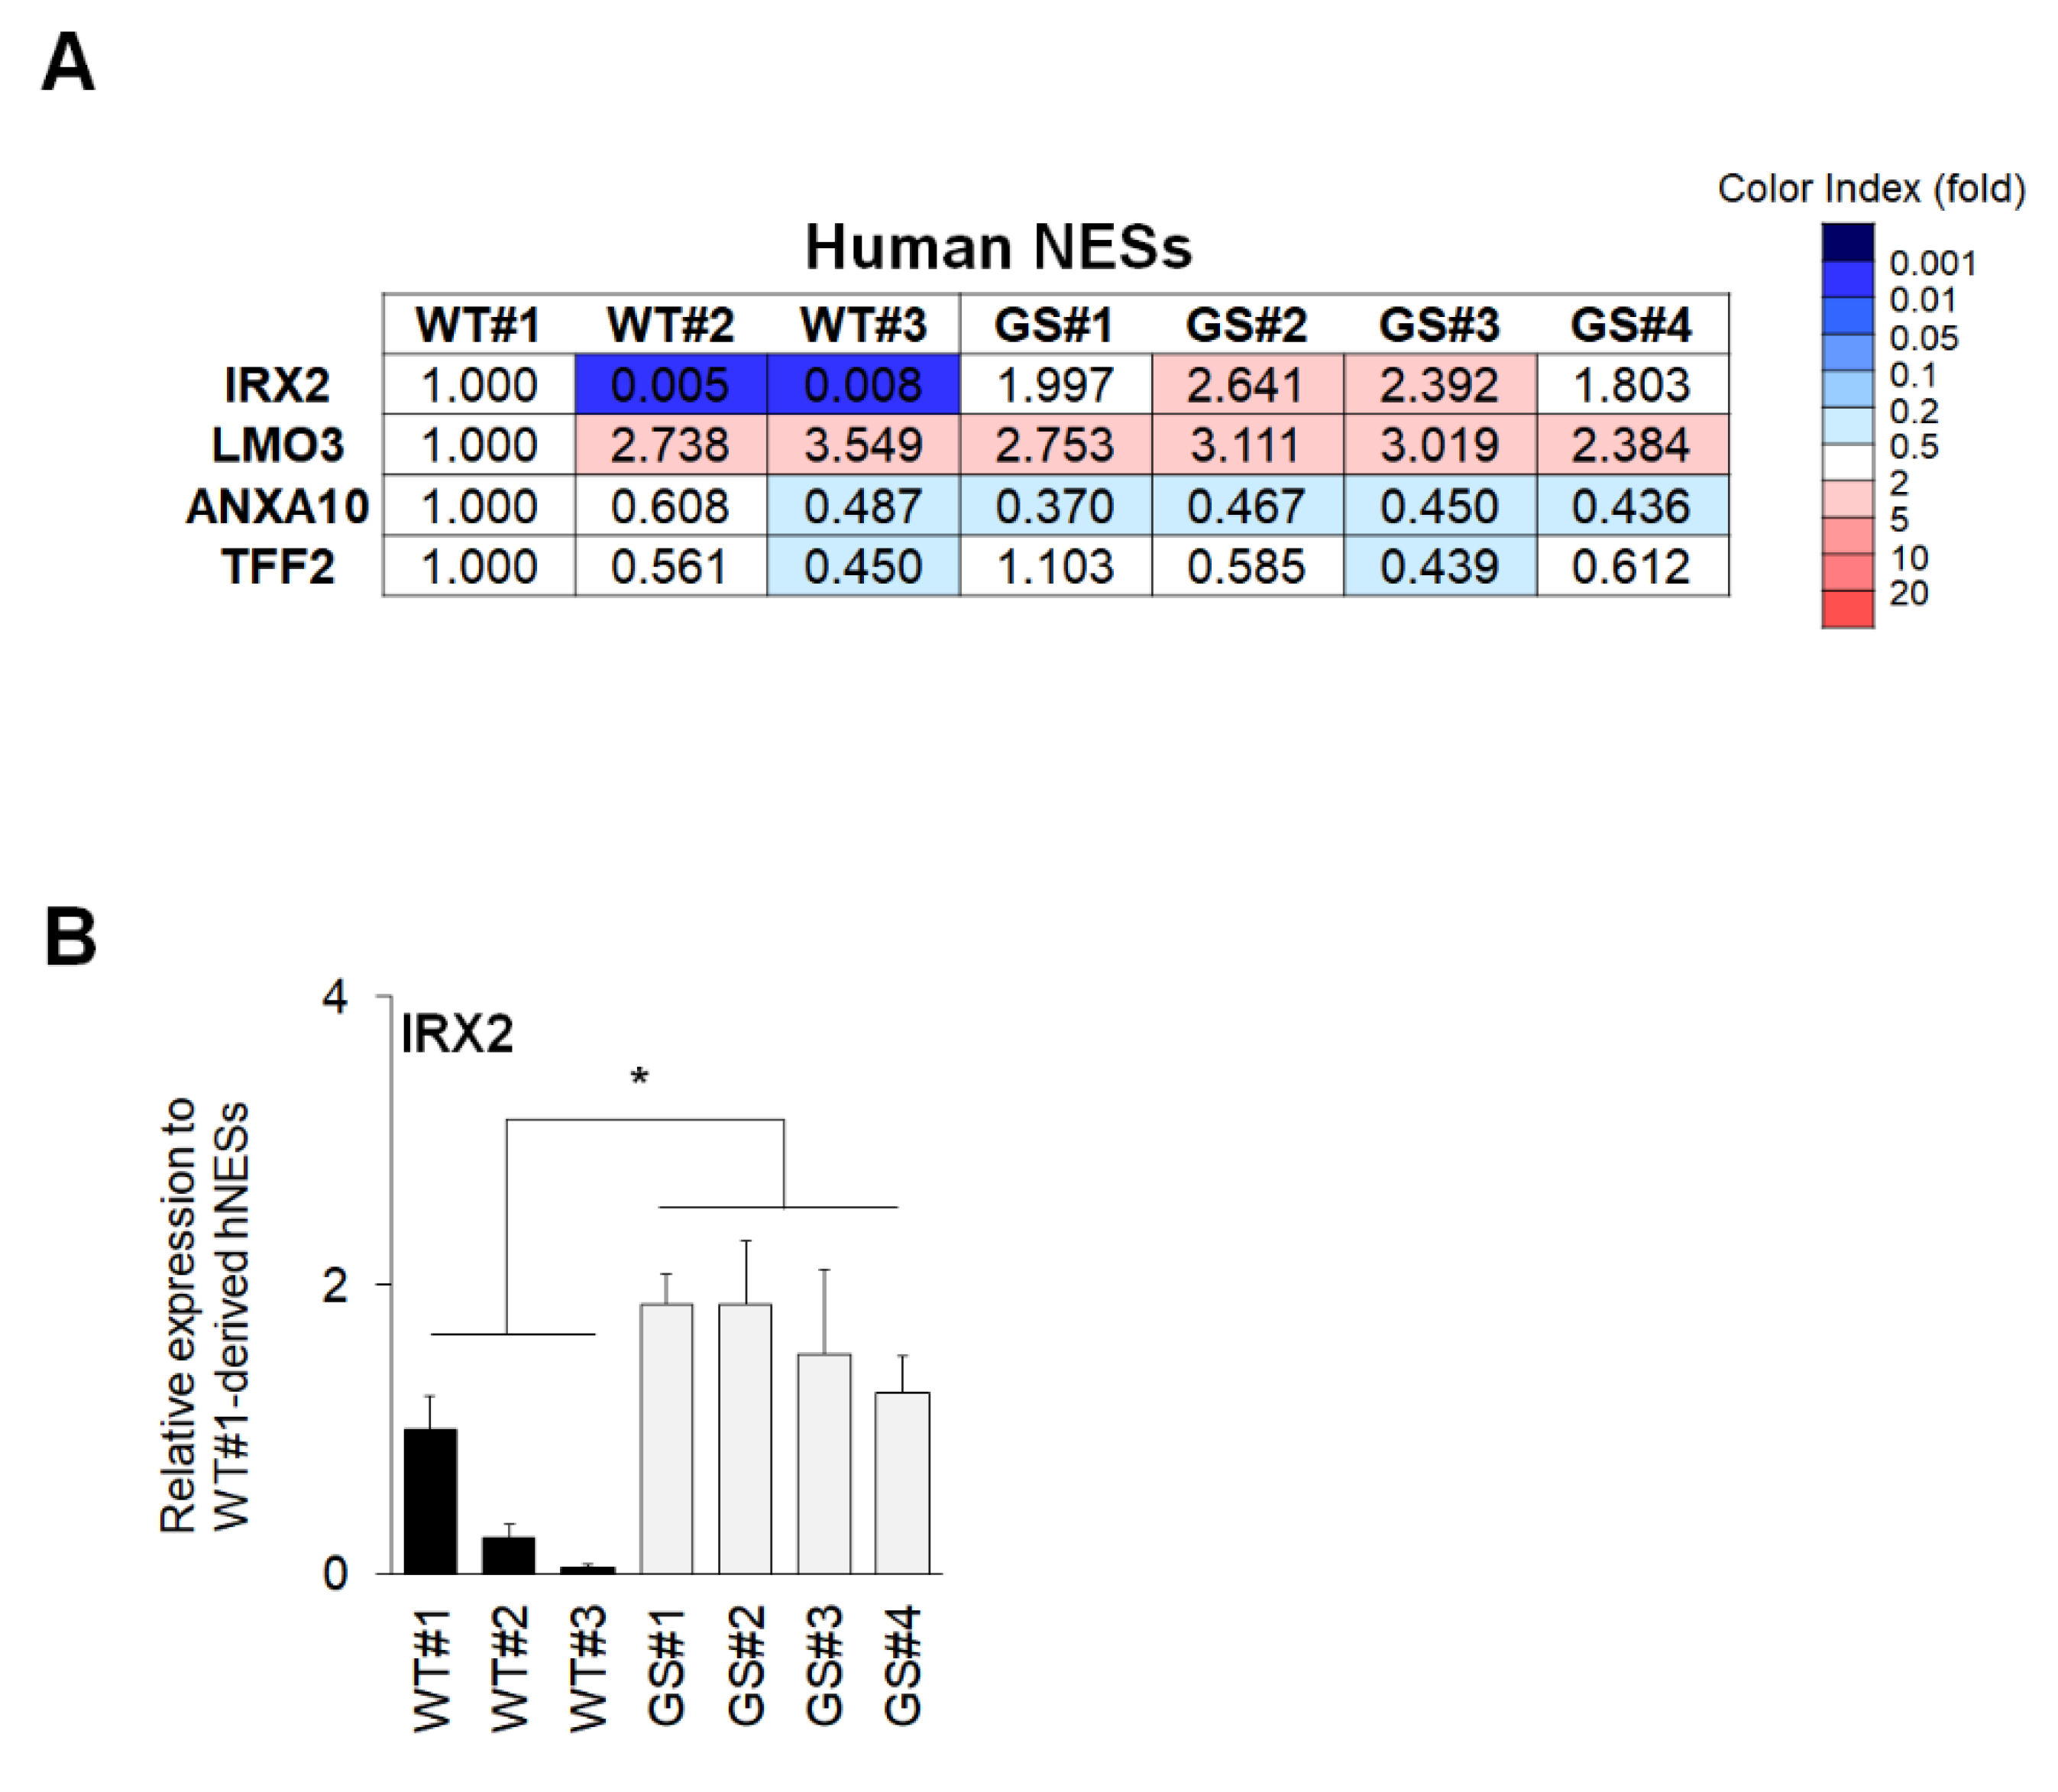
2.3. Identification and Validation of Common Factors between Two Types of Intestinal Organoids of PD
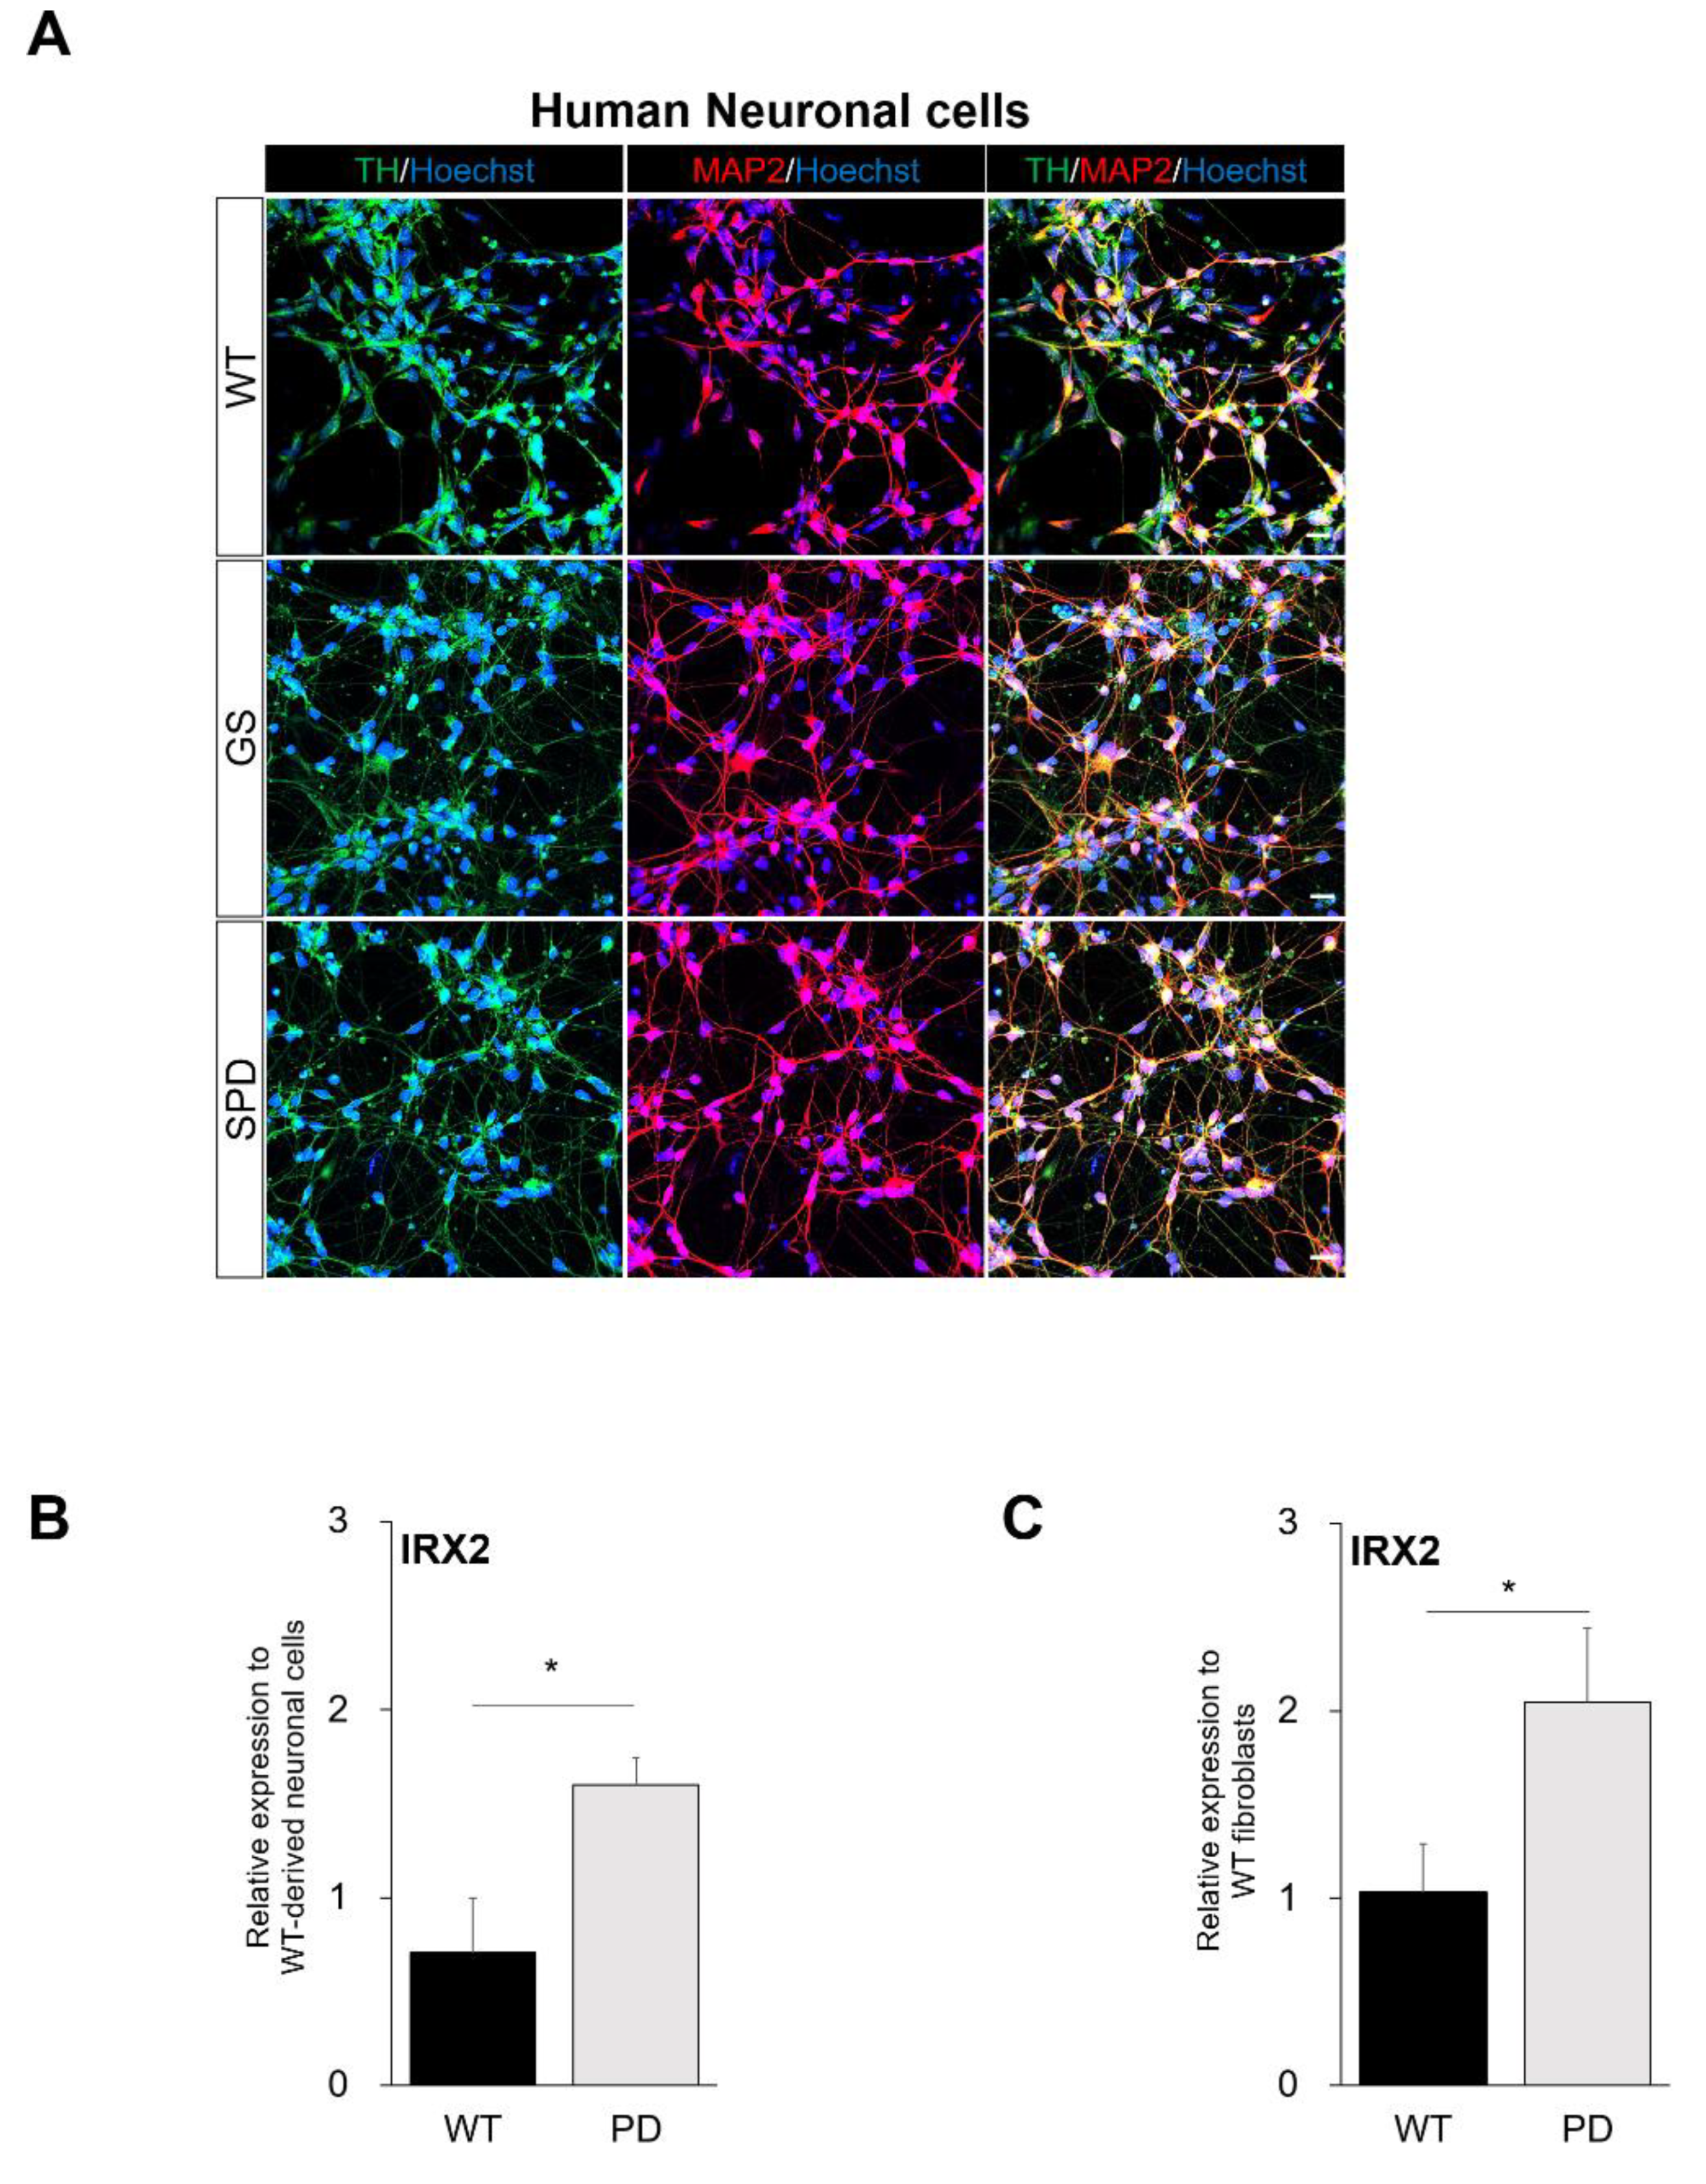
2.4. Confirmation of Commonly Regulated Factors in NESs and Neuronal Cells Containing Dopaminergic Neurons
3. Discussion
4. Materials and Methods
4.1. Animals
4.2. Generation of Mouse Small Intestinal Organoids
4.3. Quantitative Real-Time PCR (qRT-PCR)
4.4. Western Blot Analysis
4.5. Immunofluorescence of Mouse Small Intestinal Organoids and Human Neuronal Cells Containing Dopaminergic Neurons
4.6. Microarray and Transcriptome Analysis
4.7. Differentiation of Human-Induced Pluripotent Cells into Human Intestinal Organoids, Human Neuroectodermal Sphere, and Culture
4.8. Generation of Human Neuronal Cells Containing Dopaminergic Neurons
4.9. Statistical Analysis
5. Conclusions
Supplementary Materials
Author Contributions
Funding
Acknowledgments
Conflicts of Interest
Abbreviations
| 3D | three-dimensional |
| ANXA10 | AnnexinA10 |
| CD | Crohn’s disease |
| DEGs | Differentially expressed genes |
| G2019S | Gly2019Ser substitution |
| GBA | Glucocerebrosidase |
| GI | Gastrointestinal |
| GS mIOs | Human LRRK2 G2019S mutant mouse small intestinal organoids |
| GWAS | Genome-wide association studies |
| hIOs | Human intestinal organoids |
| hNESs | Human neuroectodermal spheres |
| IOs | Intestinal organoids |
| iPSCs | Induced pluripotent stem cells |
| IRX2 | Iroquois homeobox protein 2 |
| LMO3 | LIM domain only protein 3 |
| LRRK2 | Leucine-rich repeat kinase 2 |
| MAP2 | Microtubule-associated protein 2 |
| mIOs | Mouse small intestinal organoids |
| NESs | Neuroectodermal spheres |
| PD | Parkinson’s disease |
| PSC | Pluripotent stem cells |
| SN | Substantia nigra |
| SNCA | Alpha-synuclein |
| SNPs | Single nucleotide polymorphisms |
| TFF2 | Trefoil factor 2 |
| TG | Transgenic |
| TH | Tyrosine hydroxylase |
| TRAM | Transcriptome Mapper |
| UC | Ulcerative colitis |
| WT mIOs | Non-transgenic littermate mouse small intestinal organoids |
References
- Kalia, L.V.; Lang, A.E. Parkinson’s disease. Lancet 2015, 386, 896–912. [Google Scholar] [CrossRef]
- Poewe, W.; Seppi, K.; Tanner, C.M.; Halliday, G.M.; Brundin, P.; Volkmann, J.; Schrag, A.E.; Lang, A.E. Parkinson disease. Nat. Rev. Dis. Prim. 2017, 3, 1–21. [Google Scholar] [CrossRef] [PubMed]
- Nalls, M.A.; Pankratz, N.; Lill, C.M.; Do, C.B.; Hernandez, D.G.; Saad, M.; Destefano, A.L.; Kara, E.; Bras, J.; Sharma, M.; et al. Large-scale meta-analysis of genome-wide association data identifies six new risk loci for Parkinson’s disease. Nat. Genet. 2014, 46, 989–993. [Google Scholar] [CrossRef]
- Chang, D.; Nalls, M.A.; Hallgrímsdóttir, I.B.; Hunkapiller, J.; van der Brug, M.; Cai, F.; Kerchner, G.A.; Ayalon, G.; Bingol, B.; Sheng, M.; et al. A meta-analysis of genome-wide association studies identifies 17 new Parkinson’s disease risk loci. Nat. Genet. 2017, 49, 1511–1516. [Google Scholar] [CrossRef] [PubMed]
- Berg, D. In vivo detection of iron and neuromelanin by transcranial sonography - A new approach for early detection of substantia nigra damage. J. Neural Transm. 2006, 113, 775–780. [Google Scholar] [CrossRef] [PubMed]
- Goldman, J.G.; Postuma, R. Premotor and nonmotor features of Parkinson’s disease. Curr. Opin. Neurol. 2014, 27, 434–441. [Google Scholar] [CrossRef]
- Poewe, W. Non-motor symptoms in Parkinson’s disease. Eur. J. Neurol. 2008, 15, 14–20. [Google Scholar] [CrossRef]
- Chen, H.; Zhao, E.J.; Zhang, W.; Lu, Y.; Liu, R.; Huang, X.; Ciesielski-Jones, A.J.; Justice, M.A.; Cousins, D.S.; Peddada, S. Meta-analyses on prevalence of selected Parkinson’s nonmotor symptoms before and after diagnosis. Transl. Neurodegener. 2015, 4, 1. [Google Scholar] [CrossRef]
- Lin, C.H.; Lin, J.W.; Liu, Y.C.; Chang, C.H.; Wu, R.M. Risk of Parkinson’s disease following severe constipation: A nationwide population-based cohort study. Park. Relat. Disord. 2014, 20, 1371–1375. [Google Scholar] [CrossRef]
- Abbott, R.D. Frequency of bowel movements and future risk of Parkinson’s disease. Neurology 2001, 57, 456–462. [Google Scholar] [CrossRef]
- Hilton, D.; Stephens, M.; Kirk, L.; Edwards, P.; Potter, R.; Zajicek, J.; Broughton, E.; Hagan, H.; Carroll, C. Accumulation of α-synuclein in the bowel of patients in the pre-clinical phase of Parkinson’s disease. Acta Neuropathol. 2014, 127, 235–241. [Google Scholar] [CrossRef] [PubMed]
- Svensson, E.; Horváth-Puhó, E.; Thomsen, R.W.; Djurhuus, J.C.; Pedersen, L.; Borghammer, P.; Sørensen, H.T. Vagotomy and subsequent risk of Parkinson’s disease. Ann. Neurol. 2015, 78, 522–529. [Google Scholar] [CrossRef] [PubMed]
- Liu, B.; Fang, F.; Pedersen, N.L.; Tillander, A.; Ludvigsson, J.F.; Ekbom, A.; Svenningsson, P.; Chen, H.; Wirdefeldt, K. Vagotomy and Parkinson disease. Neurology 2017, 88, 1996–2002. [Google Scholar] [CrossRef] [PubMed]
- Cookson, M.R. The role of leucine-rich repeat kinase 2 (LRRK2) in Parkinson’s disease. Nat. Rev. Neurosci. 2010, 11, 791–797. [Google Scholar] [CrossRef]
- Di Maio, R.; Hoffman, E.K.; Rocha, E.M.; Keeney, M.T.; Sanders, L.H.; De Miranda, B.R.; Zharikov, A.; Van Laar, A.; Stepan, A.F.; Lanz, T.A.; et al. LRRK2 activation in idiopathic Parkinson’s disease. Sci. Transl. Med. 2018, 10, 1–13. [Google Scholar] [CrossRef]
- Hui, K.Y.; Fernandez-Hernandez, H.; Hu, J.; Schaffner, A.; Pankratz, N.; Hsu, N.Y.; Chuang, L.S.; Carmi, S.; Villaverde, N.; Li, X.; et al. Functional variants in the LRRK2 gene confer shared effects on risk for Crohn’s disease and Parkinson’s disease. Sci. Transl. Med. 2018, 10. [Google Scholar] [CrossRef]
- Son, M.Y.; Sim, H.; Son, Y.S.; Jung, K.B.; Lee, M.O.; Oh, J.H.; Chung, S.K.; Jung, C.R.; Kim, J. Distinctive genomic signature of neural and intestinal organoids from familial Parkinson’s disease patient-derived induced pluripotent stem cells. Neuropathol. Appl. Neurobiol. 2017, 43, 584–603. [Google Scholar] [CrossRef]
- Han, K.A.; Shin, W.H.; Jung, S.; Seol, W.; Seo, H.; Ko, C.M.; Chung, K.C. Leucine-rich repeat kinase 2 exacerbates neuronal cytotoxicity through phosphorylation of histone deacetylase 3 and histone deacetylation. Hum. Mol. Genet. 2017, 26, 1–18. [Google Scholar] [CrossRef]
- Holmqvist, S.; Chutna, O.; Bousset, L.; Aldrin-Kirk, P.; Li, W.; Björklund, T.; Wang, Z.Y.; Roybon, L.; Melki, R.; Li, J.Y. Direct evidence of Parkinson pathology spread from the gastrointestinal tract to the brain in rats. Acta Neuropathol. 2014, 128, 805–820. [Google Scholar] [CrossRef]
- Aasly, J.O.; Toft, M.; Fernandez-Mata, I.; Kachergus, J.; Hulihan, M.; White, L.R.; Farrer, M. Clinical features of LRRK2-associated Parkinson’s disease in Central Norway. Ann. Neurol. 2005, 57, 762–765. [Google Scholar] [CrossRef]
- Kay, D.M.; Zabetian, C.P.; Factor, S.A.; Nut, J.G.; Samii, A.; Griffith, A.; Brid, T.D.; Kramer, P.; Higgins, D.S.; Payami, H. Parkinson’s disease and LRRK2: Frequency of a common mutation in U.S. movement disorder clinics. Mov. Disord. 2006, 21, 519–523. [Google Scholar] [CrossRef] [PubMed]
- Goldwurm, S.; Zini, M.; Di Fonzo, A.; De Gaspari, D.; Siri, C.; Simons, E.J.; van Doeselaar, M.; Tesei, S.; Antonini, A.; Canesi, M.; et al. LRRK2 G2019S mutation and Parkinson’s disease: A clinical, neuropsychological and neuropsychiatric study in a large Italian sample. Park. Relat. Disord. 2006, 12, 410–419. [Google Scholar] [CrossRef] [PubMed]
- Adams, J.R.; Van Netten, H.; Schulzer, M.; Mak, E.; Mckenzie, J.; Strongosky, A.; Sossi, V.; Ruth, T.J.; Lee, C.S.; Farrer, M.; et al. PET in LRRK2 mutations: Comparison to sporadic Parkinson’s disease and evidence for presymptomatic compensation. Brain 2005, 128, 2777–2785. [Google Scholar] [CrossRef] [PubMed]
- Jackson, E.L.; Lu, H. Three-dimensional models for studying development and disease: Moving on from organisms to organs-on-a-chip and organoids. Integr. Biol. 2016, 8, 672–683. [Google Scholar] [CrossRef]
- Seok, J.; Warren, H.S.; Cuenca, A.G.; Mindrinos, M.N.; Baker, H.V.; Xu, W.; Richards, D.R.; Mcdonald-Smith, G.P.; Gao, H.; Hennessy, L.; et al. Genomic responses in mouse models poorly mimic human inflammatory diseases, and the Inflammation and Host Response to Injury, Large Scale Collaborative Research Program 4. Proc. Natl. Acad. Sci. USA 2013, 110, 3507–3512. [Google Scholar] [CrossRef] [PubMed]
- Potashkin, J.A.; Blume, S.R.; Runkle, N.K. Limitations of animal models of Parkinson’s disease. Parkinsons. Dis. 2011, 2011. [Google Scholar] [CrossRef]
- Xu, H.; Jiao, Y.; Qin, S.; Zhao, W.; Chu, Q.; Wu, K. Organoid technology in disease modelling, drug development, personalized treatment and regeneration medicine. Exp. Hematol. Oncol. 2018, 7, 1–12. [Google Scholar] [CrossRef]
- Horvath, P.; Aulner, N.; Bickle, M.; Davies, A.M.; Del Nery, E.; Ebner, D.; Montoya, M.C.; Östling, P.; Pietiäinen, V.; Price, L.S.; et al. Screening out irrelevant cell-based models of disease. Nat. Rev. Drug Discov. 2016, 15, 751–769. [Google Scholar] [CrossRef]
- Fatehullah, A.; Tan, S.H.; Barker, N. Organoids as an in vitro model of human development and disease. Nat. Cell Biol. 2016, 18, 246–254. [Google Scholar] [CrossRef]
- Waterston, R.H.; Lindblad-Toh, K.; Birney, E.; Rogers, J.; Abril, J.F.; Agarwal, P.; Agarwala, R.; Ainscough, R.; Alexandersson, M.; An, P.; et al. Initial sequencing and comparative analysis of the mouse genome. Nature 2002, 420, 520–562. [Google Scholar]
- Bichler, Z.; Lim, H.C.; Zeng, L.; Tan, E.K. Non-Motor and Motor Features in LRRK2 Transgenic Mice. PLoS ONE 2013, 8. [Google Scholar] [CrossRef] [PubMed]
- Maekawa, T.; Tsushima, H.; Kawakami, F.; Kawashima, R.; Kodo, M.; Imai, M.; Ichikawa, T. Leucine-rich repeat kinase 2 is associated with activation of the paraventricular nucleus of the hypothalamus and stress-related gastrointestinal dysmotility. Front. Neurosci. 2019, 13, 1–10. [Google Scholar] [CrossRef] [PubMed]
- Kim, S.; Kwon, S.H.; Kam, T.I.; Panicker, N.; Karuppagounder, S.S.; Lee, S.; Lee, J.H.; Kim, W.R.; Kook, M.; Foss, C.A.; et al. Transneuronal Propagation of Pathologic α-Synuclein from the Gut to the Brain Models Parkinson’s Disease. Neuron 2019, 103, 627–641.e7. [Google Scholar] [CrossRef] [PubMed]
- Matsumoto, K.; Nishihara, S.; Kamimura, M.; Shiraishi, T.; Otoguro, T.; Uehara, M.; Maeda, Y.; Ogura, K.; Lumsden, A.; Ogura, T. The prepattern transcription factor Irx2, a target of the FGF8/MAP kinase cascade, is involved in cerebellum formation. Nat. Neurosci. 2004, 7, 605–612. [Google Scholar] [CrossRef] [PubMed]
- Itoh, M.; Kudoh, T.; Dedekian, M.; Kim, C.H.; Chitnis, A.B. A role for iro1 and iro7 in the establishment of an anteposterior compartment of the ectoderm adjacent to the midbrain-hindbrain boundary. Development 2002, 129, 2317–2327. [Google Scholar] [PubMed]
- Agarwal, P.; Cheng, C.W.; Kabir, M.G.; Chan, T.Y.; Thanabalasingham, V.; Zhang, X.; Cohen, D.R.; Husain, M.; Cheng, S.H.; Bruneau, B.G.; et al. The Iroquois Homeobox Gene Irx2 Is Not Essential for Normal Development of the Heart and Midbrain-Hindbrain Boundary in Mice Me. Mol. Cell. Biol. 2003, 23, 8216–8225. [Google Scholar]
- De La Calle-Mustienes, E.; Feijóo, C.G.; Manzanares, M.; Tena, J.J.; Rodríguez-Seguel, E.; Letizia, A.; Allende, M.L.; Gómez-Skarmeta, J.L. A functional survey of the enhancer activity of conserved non-coding sequences from vertebrate Iroquois cluster gene deserts. Genome Res. 2005, 15, 1061–1072. [Google Scholar] [CrossRef]
- Bosse, A.; Zülch, A.; Becker, M.B.; Torres, M.; Gómez-Skarmeta, J.L.; Modolell, J.; Gruss, P. Identification of the vertebrate Iroquois homeobox gene family with overlapping expression during early development of the nervous system. Mech. Dev. 1997, 69, 169–181. [Google Scholar] [CrossRef]
- Coetzee, S.G.; Pierce, S.; Brundin, P.; Brundin, L.; Hazelett, D.J.; Coetzee, G.A. Enrichment of risk SNPs in regulatory regions implicate diverse tissues in Parkinson’s disease etiology. Sci. Rep. 2016, 6, 1–11. [Google Scholar] [CrossRef]
- Mariani, E.; Frabetti, F.; Tarozzi, A.; Pelleri, M.C.; Pizzetti, F.; Casadei, R. Meta-analysis of Parkinson’s disease transcriptome data using TRAM software: Whole substantia nigra tissue and single dopamine neuron differential gene expression. PLoS ONE 2016, 11, 1–21. [Google Scholar] [CrossRef]
- Steger, M.; Tonelli, F.; Ito, G.; Davies, P.; Trost, M.; Vetter, M.; Wachter, S.; Lorentzen, E.; Duddy, G.; Wilson, S.; et al. Phosphoproteomics reveals that Parkinson’s disease kinase LRRK2 regulates a subset of Rab GTPases: (A) Experimental setup of PS1. LRRK2-G2019SGSK mouse embryonic fibroblasts (MEFs, n = 5) were treated with DMSO or each of two structurally distinct LRRK2 inh. Elife 2016, 5, 1–28. [Google Scholar]
- Fedele, S.; Collo, G.; Behr, K.; Bischofberger, J.; Müller, S.; Kunath, T.; Christensen, K.; Gündner, A.L.; Graf, M.; Jagasia, R.; et al. Expansion of human midbrain floor plate progenitors from induced pluripotent stem cells increases dopaminergic neuron differentiation potential. Sci. Rep. 2017, 7, 1–11. [Google Scholar] [CrossRef] [PubMed]
- Liu, G.H.; Qu, J.; Suzuki, K.; Nivet, E.; Li, M.; Montserrat, N.; Yi, F.; Xu, X.; Ruiz, S.; Zhang, W.; et al. Progressive degeneration of human neural stem cells caused by pathogenic LRRK2. Nature 2012, 491, 603–607. [Google Scholar] [CrossRef] [PubMed]


© 2020 by the authors. Licensee MDPI, Basel, Switzerland. This article is an open access article distributed under the terms and conditions of the Creative Commons Attribution (CC BY) license (http://creativecommons.org/licenses/by/4.0/).
Share and Cite
Sim, H.; Lee, J.-E.; Yoo, H.M.; Cho, S.; Lee, H.; Baek, A.; Kim, J.; Seo, H.; Kweon, M.-N.; Kim, H.G.; et al. Iroquois Homeobox Protein 2 Identified as a Potential Biomarker for Parkinson’s Disease. Int. J. Mol. Sci. 2020, 21, 3455. https://doi.org/10.3390/ijms21103455
Sim H, Lee J-E, Yoo HM, Cho S, Lee H, Baek A, Kim J, Seo H, Kweon M-N, Kim HG, et al. Iroquois Homeobox Protein 2 Identified as a Potential Biomarker for Parkinson’s Disease. International Journal of Molecular Sciences. 2020; 21(10):3455. https://doi.org/10.3390/ijms21103455
Chicago/Turabian StyleSim, Hyuna, Joo-Eun Lee, Hee Min Yoo, Sunwha Cho, Hana Lee, Aruem Baek, Jisun Kim, Hyemyung Seo, Mi-Na Kweon, Hyung Gun Kim, and et al. 2020. "Iroquois Homeobox Protein 2 Identified as a Potential Biomarker for Parkinson’s Disease" International Journal of Molecular Sciences 21, no. 10: 3455. https://doi.org/10.3390/ijms21103455
APA StyleSim, H., Lee, J.-E., Yoo, H. M., Cho, S., Lee, H., Baek, A., Kim, J., Seo, H., Kweon, M.-N., Kim, H. G., Jeon, Y.-J., Son, M.-Y., & Kim, J. (2020). Iroquois Homeobox Protein 2 Identified as a Potential Biomarker for Parkinson’s Disease. International Journal of Molecular Sciences, 21(10), 3455. https://doi.org/10.3390/ijms21103455