Article

Methylation Density Pattern of KEAP1 Gene in Lung Cancer Cell Lines Detected by Quantitative Methylation Specific PCR and Pyrosequencing

by
Federico Pio Fabrizio
1,*,
Angelo Sparaneo
1,
Flavia Centra
1,
Domenico Trombetta
1,
Clelia Tiziana Storlazzi
2,
Paolo Graziano
3,
Evaristo Maiello
4,
Vito Michele Fazio
1,5 and
Lucia Anna Muscarella
1
1
Laboratory of Oncology, Fondazione IRCCS Casa Sollievo della Sofferenza, 71013 San Giovanni Rotondo, Italy
2
Department of Biology, University of Bari “Aldo Moro”, 70125 Bari, Italy
3
Unit of Pathology, Fondazione IRCCS Casa Sollievo della Sofferenza, 71013 San Giovanni Rotondo, Italy
4
Department of Onco-Haematology, Fondazione IRCCS Casa Sollievo della Sofferenza, 71013 San Giovanni Rotondo, Italy
5
Department of Medicine, Laboratory of Molecular Medicine and Biotechnology, University Campus Bio-Medico of Rome, 00128 Rome, Italy
*
Author to whom correspondence should be addressed.
Int. J. Mol. Sci. 2019, 20(11), 2697; https://doi.org/10.3390/ijms20112697
Submission received: 8 May 2019 / Revised: 29 May 2019 / Accepted: 29 May 2019 / Published: 31 May 2019
(This article belongs to the Special Issue Epigenetic Alterations in Age-Associated Diseases and Cancers)

Abstract

:
Background. The KEAP1/NRF2 pathway is the key regulator of antioxidants and cellular stress responses, and is implicated in neoplastic progression and resistance of tumors to treatment. KEAP1 silencing by promoter methylation is widely reported in solid tumors as part of the complex regulation of the KEAP1/NRF2 axis, but its prognostic role remains to be addressed in lung cancer. Methods. We performed a detailed methylation density map of 13 CpGs located into the KEAP1 promoter region by analyzing a set of 25 cell lines from different histologies of lung cancer. The methylation status was assessed using quantitative methylation specific PCR (QMSP) and pyrosequencing, and the performance of the two assays was compared. Results. Hypermethylation at the promoter region of the KEAP1 was detected in one third of cell lines and its effect on the modulation KEAP1 mRNA levels was also confirmed by in vitro 5-Azacytidine treatment on lung carcinoid, small lung cancer and adenocarcinoma cell lines. QMSP and pyrosequencing showed a high rate of concordant results, even if pyrosequencing revealed two different promoter CpGs sub-islands (P1a and P1b) with a different methylation density pattern. Conclusions. Our results confirm the effect of methylation on KEAP1 transcription control across multiple histologies of lung cancer and suggest pyrosequencing as the best approach to investigate the pattern of CpGs methylation in the promoter region of KEAP1. The validation of this approach on lung cancer patient cohorts is mandatory to clarify the prognostic value of the epigenetic deregulation of KEAP1 in lung tumors.

Graphical Abstract

1. Introduction

Cancer cells sustain ROS (Reactive Oxygen Species) production by suppressing the antioxidant-generation system for cellular defense, thereby promoting the effects of oxidative stress and leading to DNA damage and tumor growth [1,2,3]. The KEAP1/NRF2 pathway modulates detoxification processes in normal and neoplastic cells and participates in chemo- and radioresistance of solid tumors. In normal conditions, oxidative and electrophilic changes affect the nuclear factor-erythroid 2-related factor 2 (NRF2) activity by changing the physical interaction with its negative regulator, the Kelch-like ECH-associated protein 1 (KEAP1), thus favoring its ubiquitination and consequent degradation by the 26S proteasome [4,5,6]. In cancer cells, because of chemical modifications of KEAP1 cysteine residues, the inhibition of ubiquitin conjugation to NRF2 by the KEAP1-CUL3 complex leads to NRF2-KEAP1 impairment and results in the nuclear accumulation of the de novo synthesized NRF2 protein [7,8]. The NRF2 overexpression enhances the transcription of the target genes encoding phase II detoxification enzymes and antioxidant proteins [9] and confers chemo- and radio- resistance properties upon cancer cells which become capable of protecting themselves against the surrounding microenvironment and xenobiotics [6]. The KEAP1 gene spans 17.6 kb of genomic DNA and is located on chr 19:10, 596, 796-10, 614, 417 (GRCh37/hg19) with a minus strand orientation. Two alternatively spliced transcript variants encoding the same protein isoform were annotated for this gene. The first reference transcript (NM_203500) is located at chr19:10596796-10614054 (negative strand, 17259 bp), while the second is mapped (NM_012289) at chr19:10596796-10613481 (16686 bp). Both transcripts encode for a 624 aa protein (Ncbi ID: NP_987096, Uniprot ID: Q14145), [10]. In solid tumors, the accumulation of genetic and epigenetic modifications of KEAP1 and NFE2L2 has a critical impact on the regulation of gene expression at transcriptional and post-transcriptional levels [7]. The first report of the loss-of-function mutations of the human KEAP1 gene was related to NSCLCs with a frequency of 20–25% [11]; these data have been widely confirmed [12]. KEAP1 mutations commonly occur in the exonic regions that codify for double-glycine repeat/Kelch (DGR) domain that is required for the retention of NRF2 in the cytoplasm. KEAP1 point mutations were reported in multiple solid cancers with different incidences, such as gastric (11.1%), liver (2–8%), colorectal (7.8%), prostate (1.3%), gallbladder (30.7%), ovarian (37%), glioma (1.7%), head and neck (42%), clear renal cell carcinoma (4.7%) and large cell lung carcinoma (31%), [2,13,14,15,16,17,18,19,20,21,22]. Gain-of-function NFE2L2 mutations are generally mutually exclusive with KEAP1, and often fall into the Neh2 domain (DLG or ETGE motifs), which is the interactive site for KEAP1 binding. NFE2L2 point mutations were described in esophageal, skin, lung, papillary renal, head and neck and laryngeal carcinomas, and are associated with clinical and prognostic significance [19,21,23,24,25,26].
Aberrant methylation of CpG dinucleotides at the 5′ end of tumor suppressor genes is frequently linked to gene silencing. The KEAP1 regulatory region included a long CpG-rich island of ~1.2 kb in length (chr19:10613047-10614280) extending from the promoter region to intron 1 within the human hg19/GRCh37 genome sequence. Exonic CpG Island counts 60 CpGs on a total of 397 (chr19:10602281-10602878, hg19/GRCh37) and spans from P2 Region (-88+337) to P1 Region (-291-89), close to the KEAP1 transcription start site (TSS), [27,28]. In silico analysis demonstrated that functional hypermethylation of CpG-rich sites is mainly assembled within the P1 promoter region that contains 13 different CpGs. This region contains specific consensus protein binding sites, such as GC-box and E-box, as well as AP2-, Sp1-transcription factors, and Ets-binding motifs and their deregulation may play a decisive role in the modulation of KEAP1 expression [29]. KEAP1 deregulation by CpG hypermethylation appears complex upon investigation; it was studied in large tumor cohorts, but less is known about the details of CpG methylation density pattern [7,29]. Frequent promoter hypermethylation of the KEAP1 gene and its control role in down-regulation of gene expression was reported by our group in neoplastic tissues of patients affected by glioma, breast cancer (51%), primary NSCLC (47%), and in many cases, it was associated with a worse overall survival in patients [27,28,30,31]. Aberrant KEAP1 methylation was also reported in 53% of colorectal cancer, head and neck cancer tissues (29.3%) and prostate cancer cells as the main mechanism of epigenetic silencing of KEAP1 expression with clinical prognostic significance [19,32,33]. Finally, a high frequency of methylation 48.6% was described in clear cell renal carcinoma (ccRC), but a different contribution of CpGs mapped in the promoter region was assessed by The Cancer Genome Atlas (TCGA) data analysis (cg06911149, cg15204119,cg15676203, cg26500801, cg26988016) with a significant association with Overall Survival (OS), grading, staging and tumor dimension [27]. Despite the link between oxidative stress and KEAP1 has been widely clarified in NSCLC and KEAP1 mutations, representing one of the main features of these histologies [11,34], a clear association between epigenetic KEAP1 promoter hypermethylation has not yet been found in NSCLC, and molecular data regarding this deregulation mechanism in lung neuroendocrine tumors are limited [35]. The most frequent approach used to assess KEAP1 methylation is the quantitative methylation specific PCR (QMSP), [28] but DNA sequencing (i.e., pyrosequencing or bisulfite sequencing) could provide more complete information on the methylation status of the gene promoter in lung tumors.
To address this issue and clarify the role of KEAP1 promoter hypermethylation in lung tumors, we performed a detailed scanning of each single CpG within KEAP1 promoter of cell lines from different lung tumor histologies. We used two different methodological approaches of QMSP and pyrosequencing, and compared the obtained results. The impact of KEAP1 methylation on its transcriptional activity was also assessed by in vitro demethylating treatments in SCLC, carcinoid and NSCLC cells.

2. Results

2.1. KEAP1 Promoter Methylation Patterns among Different Lung Cancer Histologies

Methylation analysis of the KEAP1 promoter region was performed by two different detection methods: QMSP and pyrosequencing. Both methodologies were used to profile the same P1 promoter KEAP1 region containing 13 CpG sites (Figure 1) [7]. A total of 25 cell lines from different histologies of lung cancers were screened: SCLC, Atypical and Typical Carcinoid, ADC, SqCC and LCC. Two cell lines from normal lung tissues (MRC5 and BEAS-2B) were also analyzed to establish the cut-off value of methylation to use for QMSP and pyrosequencing data scoring.
For QMSP data evaluation, the cut-off level of methylation analysis established on normal cell lines was set at 0. KEAP1 methylation levels measured in the tumor cell lines ranged as follows: 0–228 (SCLC), 0–78.8 (Carcinoids), 0–492 (ADC, SqCC, LCC). Based on the cut-off level, a total of 5/12 (34%) of SCLC cell lines, (GLC8, H1963, H209, H69V), 1/2 (50%) of carcinoid cell lines (H720) was scored as hypermethylated (Table 1). Similarly, KEAP1 hypermethylation was observed in half of total cell lines analyzed with NSCLC histologies. Specifically, it was detected in 4/8 (50%) of ADCs (A549, H1573, H1395, H1581), 1/2 (50%) of SqCCs (HCC-15) and in the LCC cell line H460, (Figure 2).
The results from methylation analysis of KEAP1 promoter region by QMSP and pyrosequencing are shown in Table 1. A total of 4 out of 12 SCLC cell lines (34%) were positive for KEAP1 methylation, with mean values of 78.5% (H69V), 27.4% (H209), 39.5% (H1963) and 35.5% (GLC8). H720 carcinoid cells appeared methylated (67.8%), in contrast to the H727, which was under the analytical cut-off. In NSCLC cell lines, hypermethylation at the P1 promoter region was found in 4/8 (50%) of cell lines: A549, H1573, H1395 (ADC), HCC-15 (SqCC) and H460 (LCC), with the H1573 as the most methylated one (70.4%). These QMSP data seem to be almost comparable with those from pyrosequencing among different lung cancer histologies, and in many cases share the same distribution and density pattern for the 13 CpG sites. Universal Methylated Human DNA bisulfite-converted showed a reliability of about 96%, with high coverage in all CpG sites mapped into the promoter region examined, whereas the Universal Unmethylated Human DNA, used as negative control, showed a mean of methylation levels of 3% (Supplemental Figure S1). The mean cut-off of 26.43 for KEAP1 methylation by pyrosequencing was determined using the normal lung cell lines MRC5 and BEAS-2B as the mean of methylation values of the 13 CpG sites of the P1 region. The cut-off at single CpG sites was also calculated as indicated: 74.1% (PYRCpG1), 36.2% (PYRCpG2), 41.5% (PYRCpG3), 20.1% (PYRCpG4), 79.0% (PYRCpG5), 72.0% (PYRCpG6), 23.2% (PYRCpG7), 25.6% (PYRCpG8), 22.6% (PYRCpG9), 14.7% (PYRCpG10), 12.6% (PYRCpG11), 6.4% (PYRCpG12), 6.3% (PYRCpG13), (Supplemental Table S1A,B).

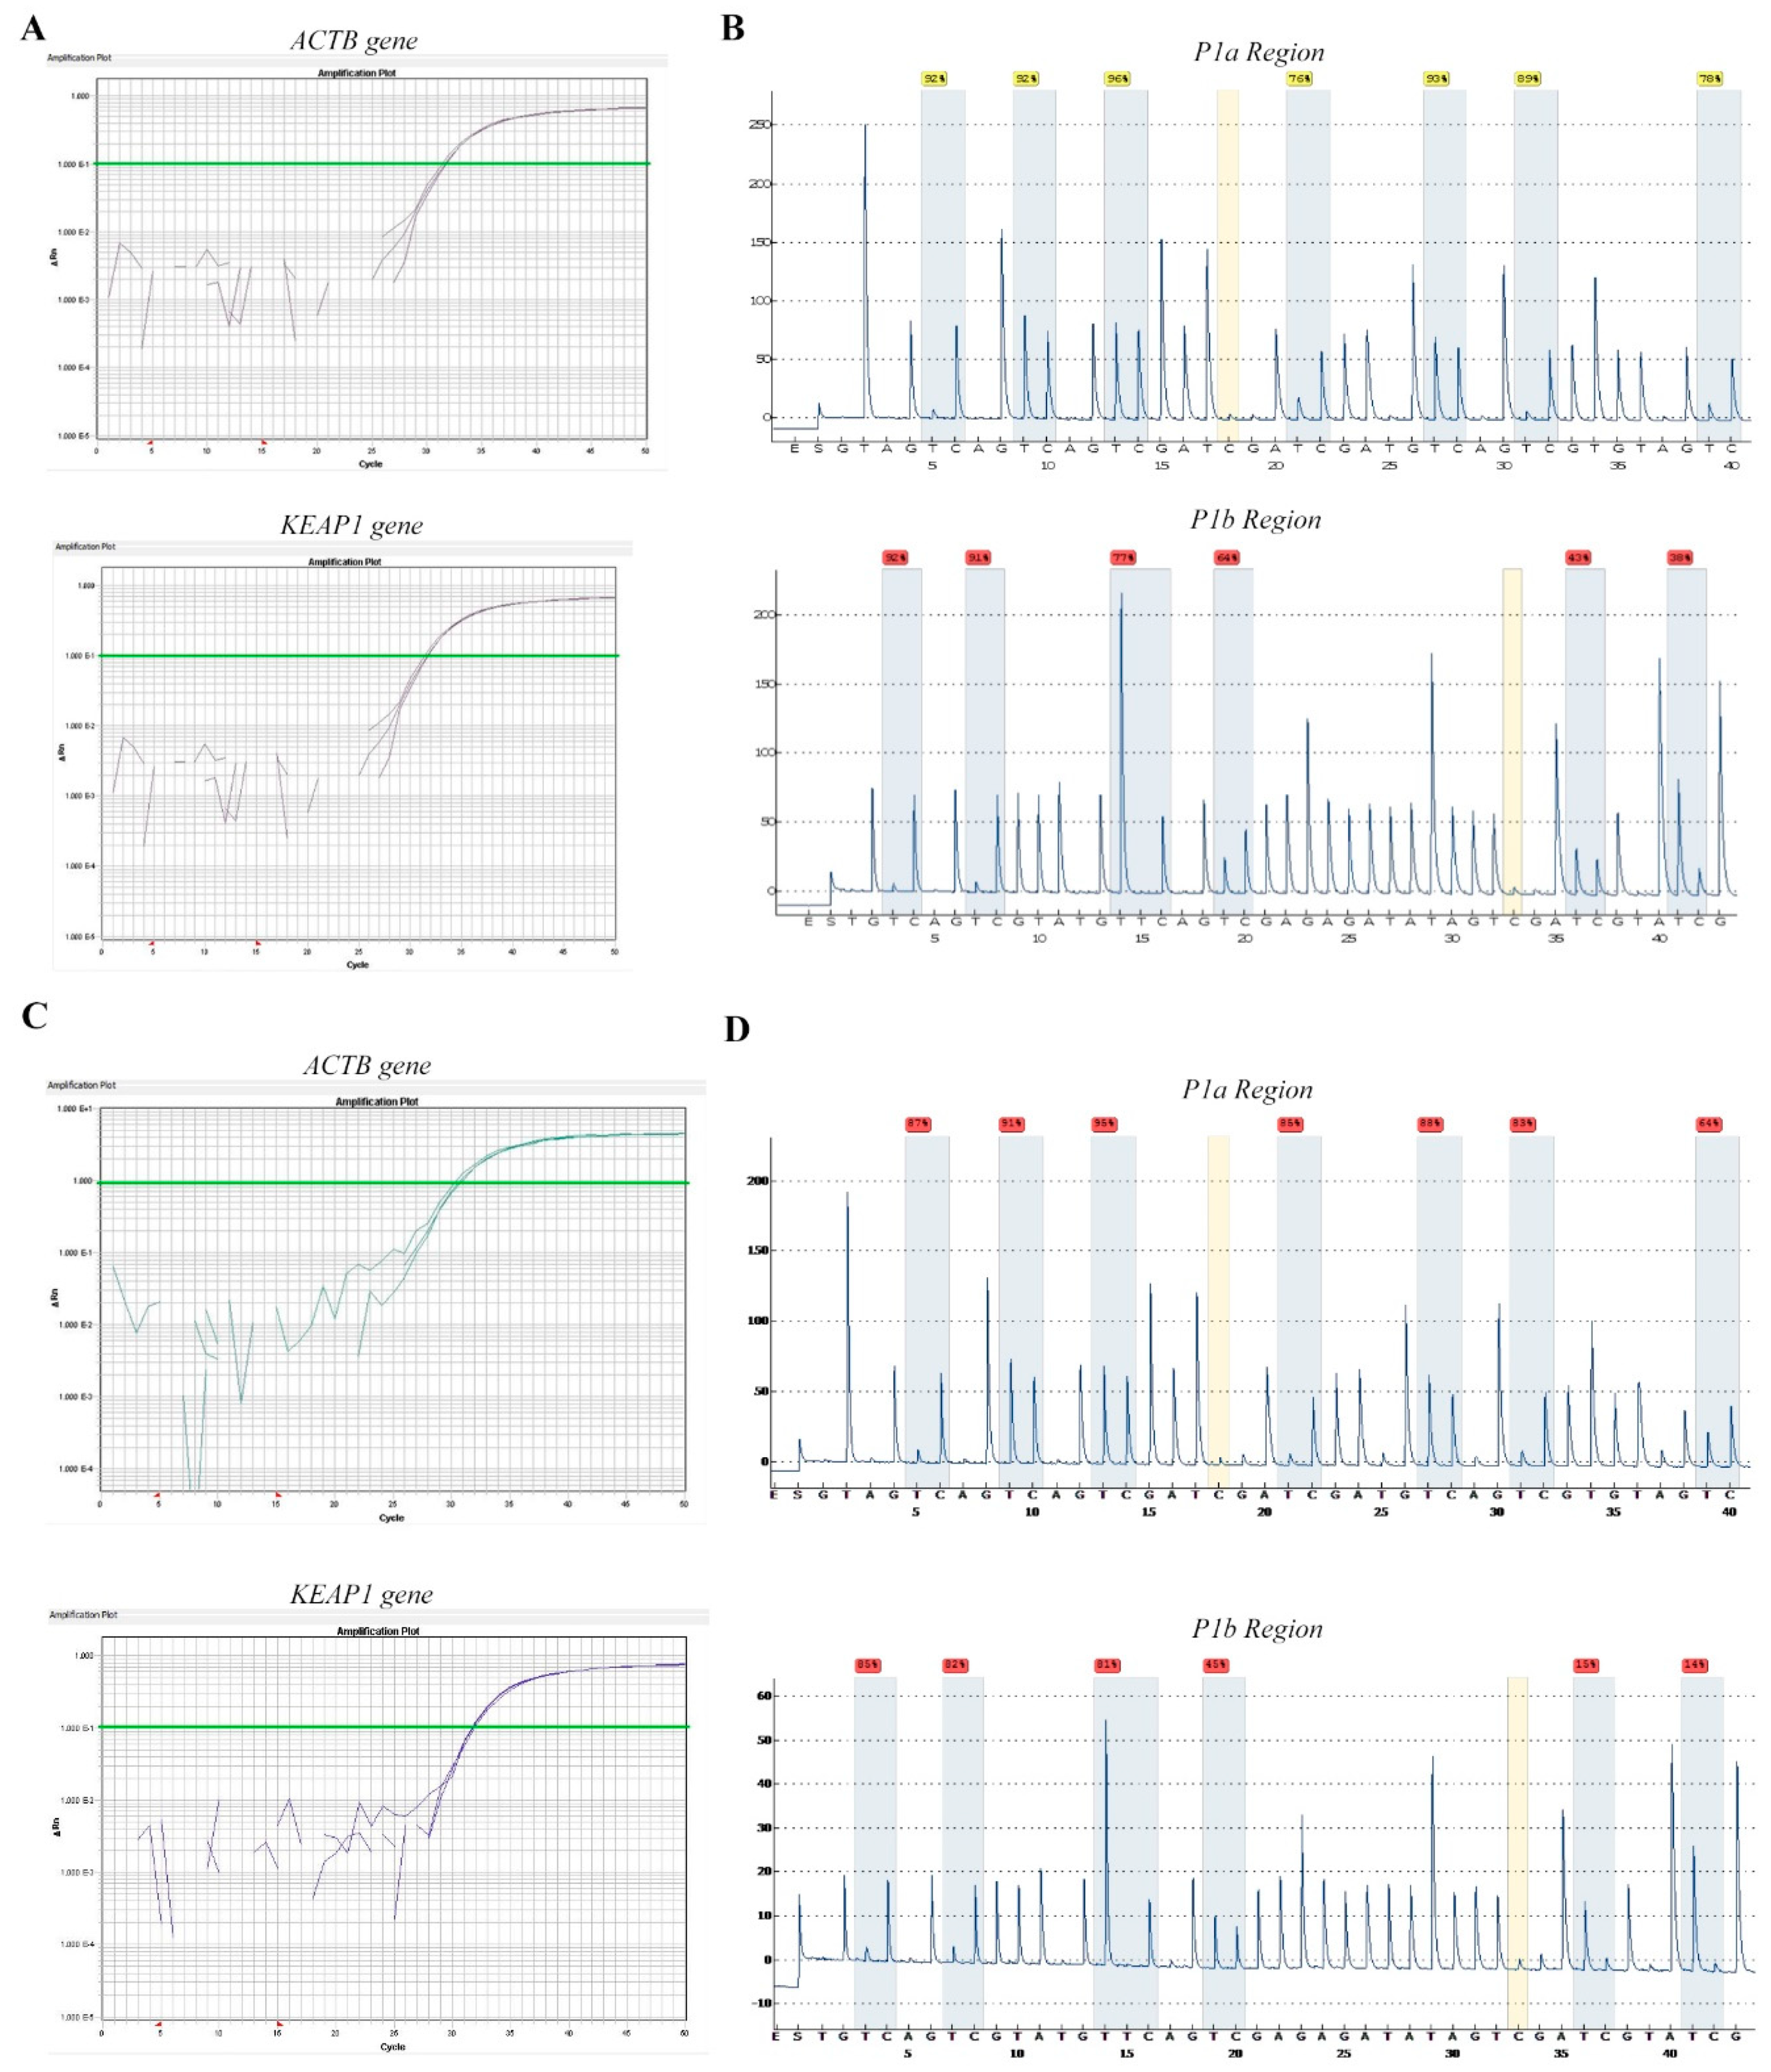
2.2. Technical Evaluation of Pyrosequencing

The two cell lines MRC5 and BEAS-2B were used to establish the intra- and inter-assay precision of pyrosequencing analysis to detect methylation at KEAP1 P1 promoter region. Both cell lines were found to be unmethylated by QMSP analysis. Each cell line was tested 3 times in five different runs on separate plates to assess the inter-assay precision, whereas to test the intra-assay precision, the same cell lines were replicated 3 times in a single run. The mean values of each experiment were used to calculate the inter-assay coefficient of variation (CV). The inter-assay CV ranges from 11.6% and 8.1% for MRC5 and BEAS-2B, respectively (Table 2A). The intra-assay CV was very similar between MRC5 (6.6%) and BEAS-2B (6.9%), (Table 2B). To define the precision of the technique to quantify the methylation status at each single CpG of P1 region, CV values for inter and intra-assay were also calculated for the methylation values of the 13 CpGs included into the pyrosequencing analysis, both for MRC5 and BEAS-2B cells (Table 3A,B).

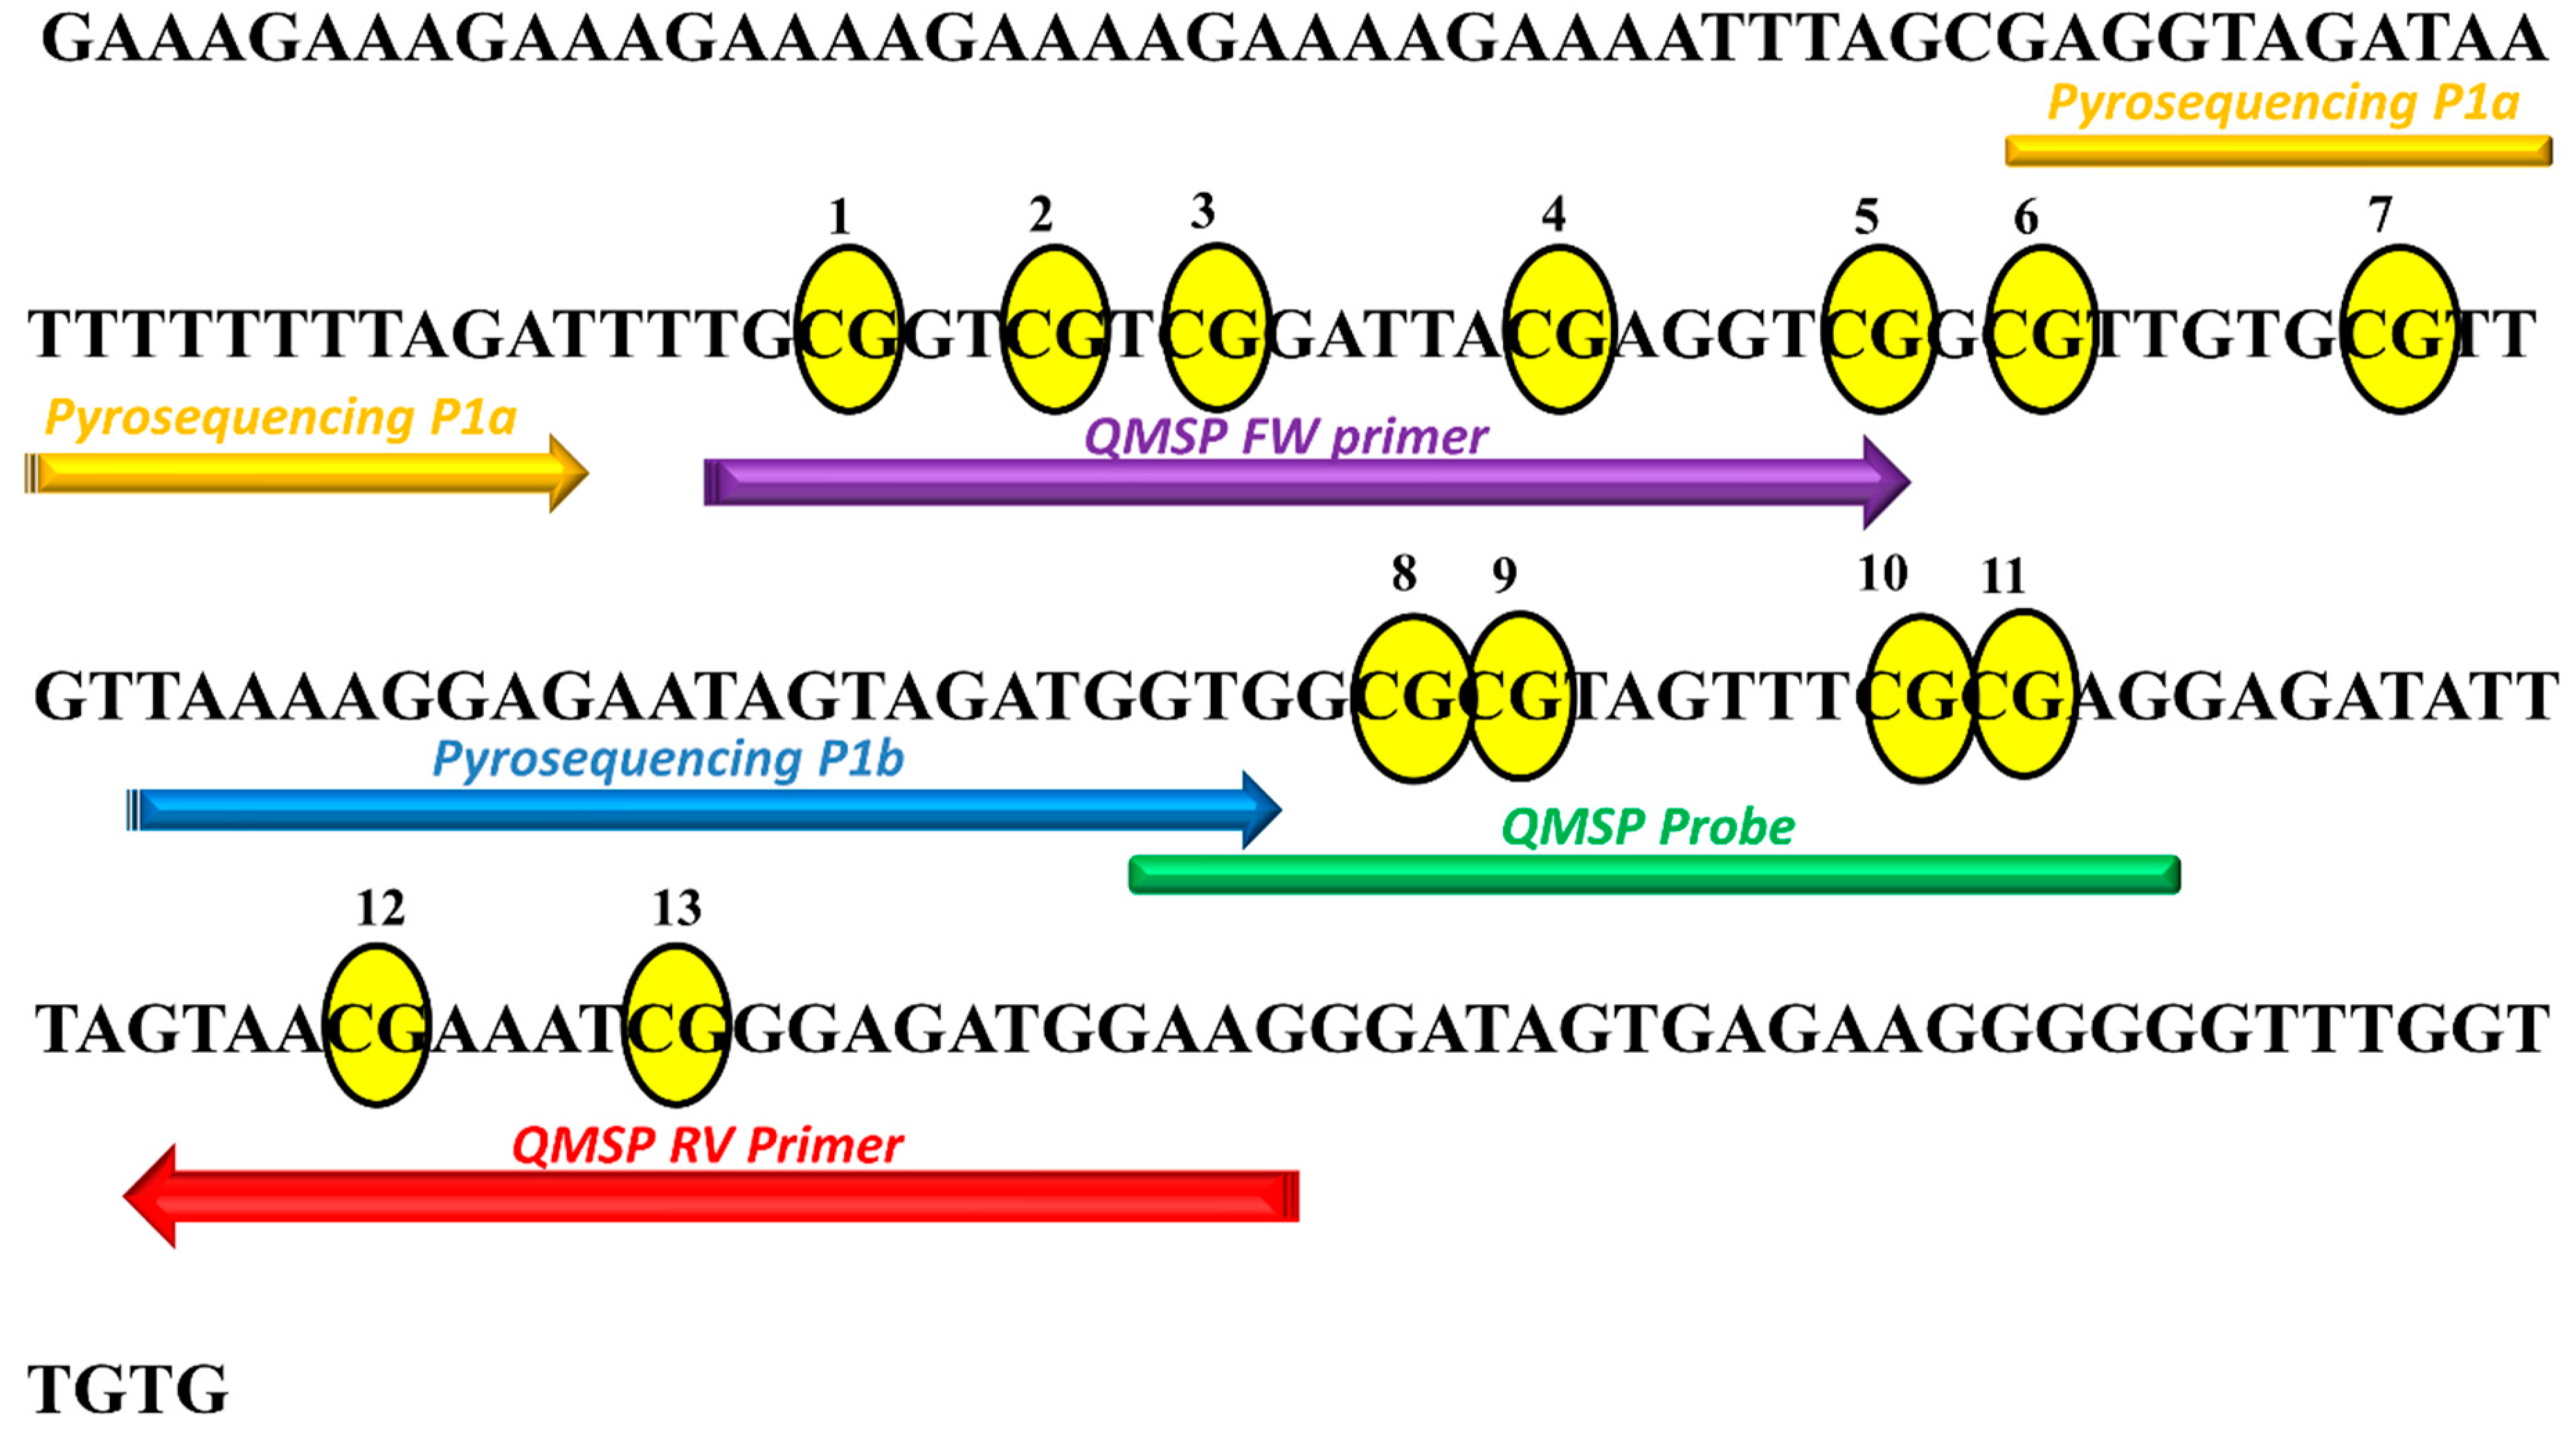
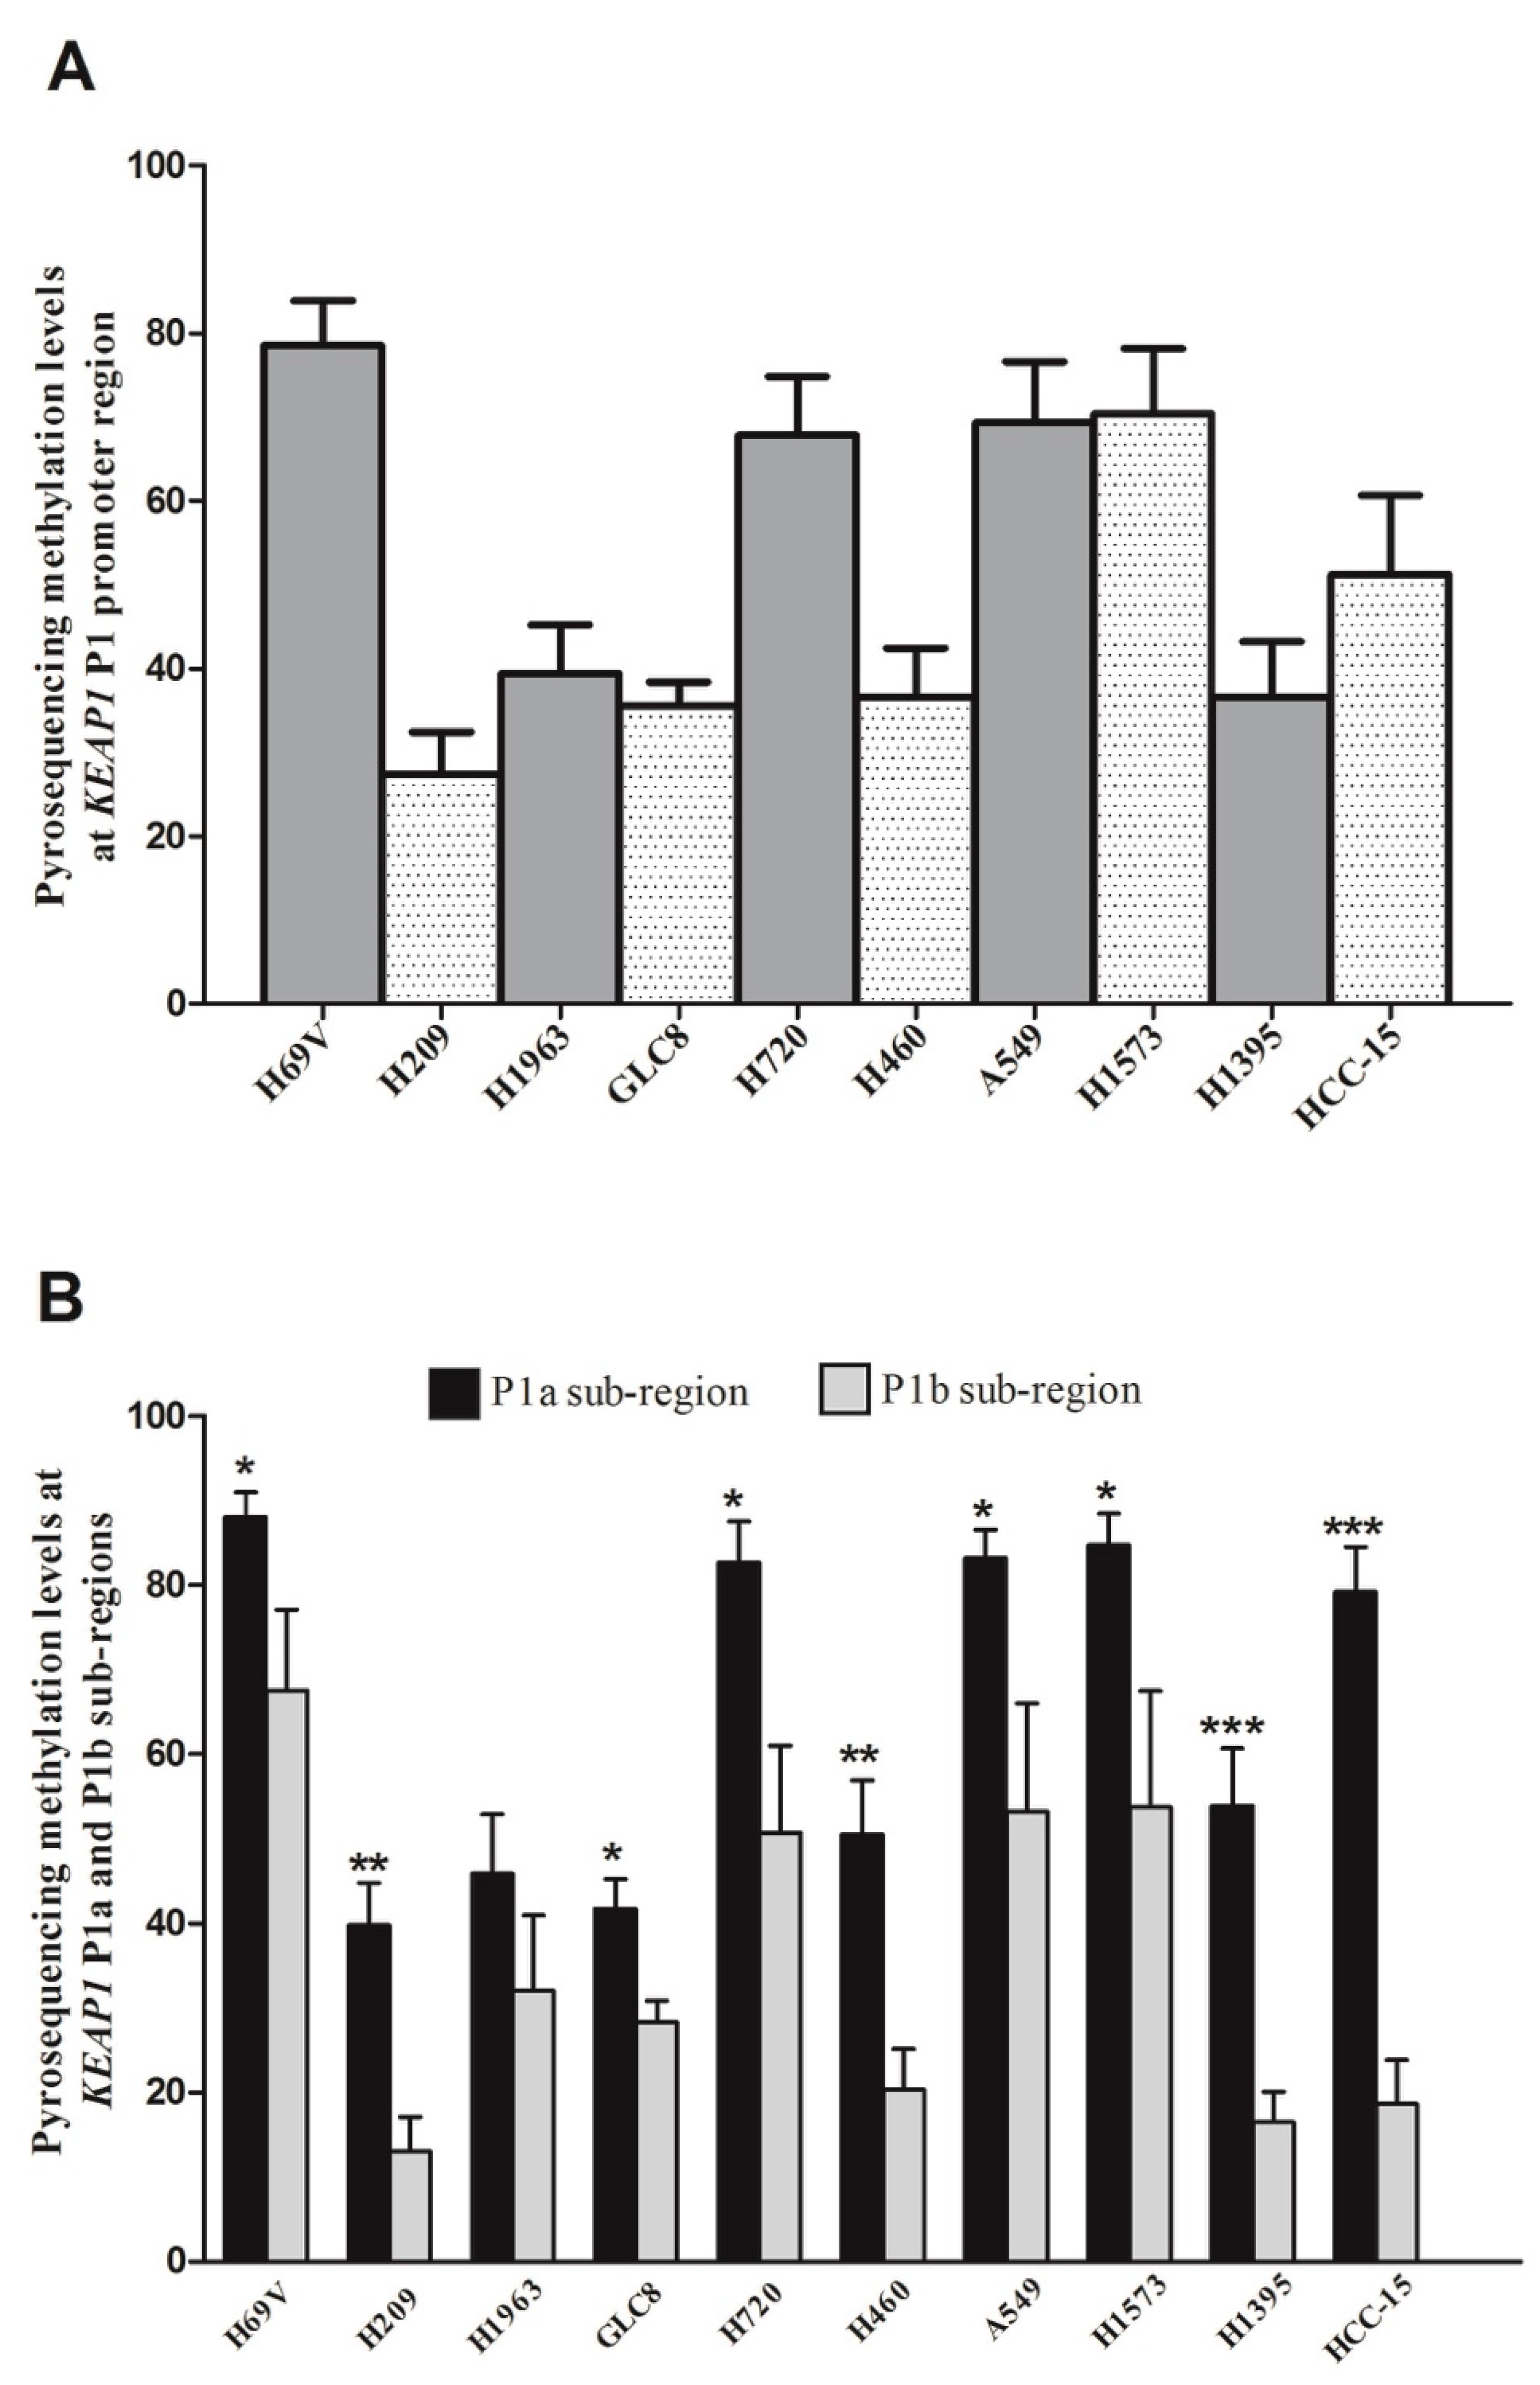
2.3. Pyrosequencing Analysis Reveals Two Distinct P1 Subregions at KEAP1 Promoter

Despite the high concordant results between QMSP and pyrosequencing, an interesting dual pattern of methylation at KEAP1 P1 promoter region was revealed by pyrosequencing. The KEAP1 region containing 1−7 CpGs (P1a sub-region) showed significant higher methylation levels than the promoter region which contains 8−13 CpGs (P1b sub-region), (Figure 3). In light of these results, the first seven single CpG sites appeared to be more methylated than the others, and could represent the critical sub-region closer to the transcription start site that exerts a stronger regulation impact on the KEAP1 promoter region and its transcript levels.

2.4. Somatic Alterations of KEAP1 Detected in Lung Cancer Cell Lines

Loss-of-function point mutations of the KEAP1 gene were identified in seven cell lines (Table 4). These missense mutations are known to have a pathogenic significance, except for the de novo nucleotidic c.269C > T and aminoacidic change p.A90V that remain to be characterized by functional studies. These genetic findings confirm the already published evidence that missense mutations impact the efficiency of KEAP1 stability and its ability to bind NRF2 transcription factor, thus contributing to KEAP1-mediated repression of NRF2 with its consequent nuclear accumulation [7]. By contrast, no mutation was found in the NFE2L2 gene. In general, the rarity of point mutations to KEAP1/NRF2 pathway deregulation were confirmed in SCLC cells, whereas the high frequency of missense mutations in the subset of NSCLC cells represent a molecular and distinctive hallmark [11,21].

2.5. The Restoration of KEAP1 Expression Via Its Promoter P1 Region Inversely Correlates with Demethylation by 5-aza-dC

A direct correlation of KEAP1 promoter methylation with mRNA levels was also confirmed by in vitro 5-aza-dC treatment for H69V, H1573 and H720 cells. The variation of KEAP1 mRNA levels and promoter methylation levels in H69V and H1573 (Figure 4A,C) cell lines before and during treatment with 5-aza-dC. By real-time quantitative PCR analysis, a progressive increase in the KEAP1 transcript abundance was observed after 48 h (p < 0.05; p < 0.001, for H69V and H1573 respectively) and 72 h (p < 0.01 only for H69V) and was shown to correlate with a decreased KEAP1 promoter methylation at 48 h (both with p < 0.001) and at 72 h (p < 0.01; p < 0.001, for H69V and H1573 respectively), (Figure 4B,D).

3. Discussion

The epigenetic control of KEAP1 expression by methylation has been widely reported in solid tumors, and represents in many contexts a multifaceted prognostic marker for disease outcome [7]. In glioma patients, the co-occurrent hypermethylation of KEAP1 and MGMT predicts a lower risk of progression for patients treated with radiotherapy and temozolomide [28]. In triple-negative breast cancer patients with KEAP1 methylation, a higher mortality risk was observed than in patients without triple-negative breast cancer. By contrast, the KEAP1 methylation was associated with a better progression free survival in patients treated with epirubicin/cyclophosfamide and docetaxel as sequential chemotherapy [30]. Aberrant KEAP1 methylation was also reported in colorectal cancer and head and neck cancer tissues, and was linked to the worst prognoses of these tumors [32,36]. In clear renal cell carcinoma (ccRCC), the TCGA data analysis suggested that epigenetic silencing by methylation is able to strongly predict patient survival [27].
Despite the well-documented impact of KEAP1 and NFE2L2 mutations in NSCLCs and LCNEC [34], the prognostic role of KEAP1 methylation in lung cancer has not yet been clarified. The selective inhibition of KEAP1 gene promoter methylation by genistein, observed in A549 cells, suggested a way in which KEAP1 demethylation could represent a marker of radio-sensitizing effects in lung cancer [37]. In lung cancer tissues, the presence of epigenetic abnormalities in the KEAP1 gene plus its point mutations/LOH matched with the prevalence of NRF2 nuclear accumulation in NSCLC tissues and was associated with an increased risk of lung cancer progression in surgically resected patients [31]. By contrast, in NSCLCs tissues, the KEAP1 methylation alone assessed by QMSP does not seem to be an independent prognostic marker of disease outcome.
Our work aimed first to assess the methylation pattern of KEAP1 promoter region in different histotypes of lung cancer cell lines by performing a QMSP vs pyrosequencing evaluation for the first time. KEAP1 hypermethylation was detected in 50% of NSCLC cell lines (both ADCs and SqCCs), in atypical carcinoids and described for the first time in 42% of SCLC cell lines. The latter result is not yet reported and was surprising, since it gives the first indication of epigenetic lesions of KEAP1 gene in the SCLC. Even if few important indications of KEAP1 genetic alterations in high grade neuroendocrine lung tumors (LCNEC) with adeno-like features came from two recent works [35,38], SCLC point mutations of KEAP1 and NFE2L2 genes remain a rare phenomenon, and the epigenetic modulation of KEAP1 expression has not yet been elucidated.
Highly variable levels of KEAP1 promoter methylation by QMSP were observed up to the cut-off level in all lung cell line, independently from the histology with no linear correlation between the QMSP and pyrosequencing values was observed (p = 0.19, for Pearson correlation). However, it should be noted that samples what were methylated above the QMSP and pyrosequencing cut-off were almost completely overlapping, and only in one case (H1581 cell line) was the result not concordant.
Currently, there is no consensus on the best technique for KEAP1 methylation assessment and how many and which CpG sites of KEAP1 promoters should be analyzed remains a controversial issue in a translational context [7]. There are several molecular diagnostic tools that can be used to assess the methylation status to influence single-nucleotide resolution information about the methylated areas of DNA after bisulfite treatment and translate these findings into clinical setting [39]. QMSP amplifies methylated DNA and quantifies a target methylation level relative to house-keeping genes (e.g., b-actin). Pyrosequencing, on the other hand, amplifies bisulfite converted genomic DNA using primers independent of methylation status, and quantifies the percentage of methylated CpGs with single base resolution. Both methods represent simple, fast, and cost-effective techniques that can be easily implemented into clinical practice; however, studying methylation of each CpG separately should unmaske putative differences of methylation pattern in lung cancer with different histologies that would explain the absence of correlation between QMSP levels and mean of CpG methylation of the same region of the same samples status by pyrosequencing.
Most interestingly, our analysis of the pattern and density of KEAP1 promoter methylation in lung cancer cell lines showed that the first seven single CpG sites (1–7, P1a region) appeared to be significantly more methylated than the last six CpG group (8–13, P1b region) of the P1 promoter region. Based on these results, a stronger effect and impact on KEAP1 expression level should be hypothesized by the CpG sites 1-7 located in the critical sub-region closer to the transcription start site (TSS) of gene (P1a). An intriguing possible explanation is that in the P1a region two putative binding sites for Sp1 and AP2 were mapped [29,40], two zinc finger transcription factors that contribute to the crucial transcriptional activity of this gene [41]. As a consequence, we supposed that the hypermethylation of the P1 KEAP1 promoter might lead to the loss of SP-1 and AP-2 binding via inhibiting its expression at the first two, 4th and 5th CpG sites in the analyzed lung cancer cells, respectively [29,40].
In this study we also confirmed that epigenetic silencing of KEAP1 by promoter methylation exerts a critical role in the modulation of KEAP1 transcription activity. An inverse correlation between KEAP1 mRNA levels and methylation levels was demonstrated by in vitro 5′-azacytidine treatment on carcinoid, SCLC and ADC cells, thus corroborating the general idea that consensus sequences of several transcription sites was marked in the epigenetic control of KEAP1.
This analysis opens the debate on how many and which CpG sites of the KEAP1 promoter should be analyzed to set a clinical cut-off in lung cancer affected patients. Further prospective analyses in lung cancer tissues are ongoing to define whether some specific CpG sites of KEAP1, either a combination of them even if not consecutive, might have a better predictive or prognostic role in lung cancer patients.

4. Material and Methods

4.1. Cell Lines

A set of 25 lung cell lines were used, histologically classified as follows: 12 SCLC cell lines (H69V, H209, H1184, N417, H2107, H1963, GLC1, GLC2, GLC8, GLC14, H510, H2141), 1 typical carcinoids cell line (H727), 1 atypical carcinoid cell line (H720), 8 ADC (H1581,H2126, A549, H1573, H2228, H1975, HCC4006, H1395), 2 SqCC cell lines (HCC-15, H520) and 1 LCC cell line (H460). GLC1, GLC2, GLC8, GLC14 cell lines were kindly provided by Dr. Clelia Tiziana Storlazzi (University of Bari, Italy). All the other cell lines were purchased from the American Type Culture Collection (ATCC, Manassas, Virginia, United States). The two normal lung fibroblast and epithelial MRC5, BEAS-2B cell lines were used as controls. Cells were cultured in RPMI 1640 medium supplemented with 10% or 20% fetal bovine serum (FBS), 100 U/mL penicillin and 100 U/mL streptomycin, and maintained at 37 °C in a 5% CO2 incubator. Cell culture reagents were purchased from Euroclone (Euroclone, Milan, Italy).

4.2. DNA and RNA Extraction from Cell Lines

Cells from 1 well of 12-multiwell were extracted by using the standard Phenol/chloroform procedure. DNA pellets were suspended in LOTE solution (3 mM Tris-HCl (pH 8.0)/0.2 mM EDTA, pH 8.0) and estimated by NanoDrop Spectrophotometer ND-1000 (Thermo Scientific, Carlsbad, CA, USA). RNA was extracted using Trizol reagent (Life Technologies) according to the manufacturer’s instructions. The RNA quality was measured by using 2100 Expert Analyzer (Agilent Technologies, Santa Clara, CA, USA) and RNA with RIN (RNA Integrity Number) ≥7.0 was processed. RNA concentrations were quantified by the Nanodrop spectrophotometer.

4.3. DNA Sodium Bisulfite Conversion and Quantitative Methylation Specific PCR (QMSP)

Bisulfite conversion and purification of DNA extracted from cell lines was performed by Epitect Bisulfite kit (QiagenSci, MD, USA) according to manufacturer’s instruction. Bisulfite-modified DNA was then used as template for QMSP analysis and calibration curves for both target and reference genes were constructed using serial dilutions (90–0.009 ng) of commercially available fully methylated DNA (CpGenome Universal Methylated DNA, Millipore, Chemicon, cat#S7821, Bedford, MA, USA). Amplification reactions were carried out in triplicate in 384-well plates and in a volume of 10 uL that contained 50 ng of bisulfite-modified DNA on an ABI PRISM 7900 Sequence detection system and were analyzed by SDS 2.4.1 software (Thermo Fisher Inc., Applied Biosystems Division). PCR primers were used in real-time PCR amplified the KEAP1 promoter region of 64bp and was just reported in several methylation studies of KEAP1: forward 5′- TGCGGTCGTCGGATTACGAGGTCG-3′, reverse 5′-CTTCCATCTCCCGATTTCGTTAC-3′ and probe FAM-GTGGCGCGTAGTTTCGCGAG-TAMRA. As reference gene, a primer/probe set specific for the unmethylated promoter region of the ACTB gene was used: forward 5′-TGGTGATGGAGGAGGTTTAGTAAGT-3′, reverse 5′-AACCAATAAAACCTACTCCTCCCTTAA-3′ and probe FAM-ACCACCACCCAACACACAATAACAAACACA-TAMRA [27,28]. Each plate included calibration curves for the ACTB and KEAP1 genes, DNA cell lines, a positive control CpGenome Universal Methylated DNA, and multiple water blanks. The QMSP standard curves of the KEAP1 and ACTB genes for the normalization of the input DNA were established with CpGenome Universal Methylated DNA. The relative level of methylated DNA was finally calculated as the ratio of KEAP1 to ACTB and then multiplied by 1000 for easier tabulation (average value of triplicates of KEAP1/average value of triplicates of ACTB × 1000).

4.4. Pyrosequencing

Pyrosequencing was performed on PyroMark Q24 (Qiagen, Hilden, Germany) and amplifications were carried using 50ng of bisulfite-treated genomic DNA out in 24-well plates according to the manufacturer instructions. Amplification primers used for the KEAP1 promoter region were previously described and are as follows: forward: 5′-GTTTGAGGTTAGGAGTTTAAGGTTG-3′, reverse: 5′-CACAACCAAACCCCCCTT-3′. The reverse primer contained biotin at the 5′ position [37]. These two assays were designed and run on this template using two sequencing primers: 5′-GAGGTAGATGATTTTTTTTAGAT-3′ (assay for CpGs 1-7) and TAAAAGGAGAATAGTAGATGGTG (assay for CpGs 8–13). For the pyrosequencing reaction, single-stranded DNA templates were immobilized on streptavidin-coated sepharose beads (Qiagen, Hilden, Germany) using the PSQ Vacuum Prep Tool and Vacuum Prep Worktable (Qiagen, Hilden, Germany), then incubated at 80 °C for 2′. In addition to the samples, each run included a non-template control (water), the unmethylated control and the methylated control. The dispensation order was (two dispensations added for each KEAP1 sequencing primers). The two dispensation orders were automatically generated by PyroMark Q24 Software 2.0.8 according to the provider recommendations were: GTAGTCAGTCAGTCGATCGATCGATGTCAGTCGTGTAGTC for the first KEAP1 sequencing primer flanking the 1-7 CpG sites (P1a region) and TGTCAGTCGTATGTTCAGTCGAGAGATATAGTCGATCGTATCG for the second KEAP1 sequencing primer flanking the 8-13 CpG sites (P1b region). The proportion of DNA methylation at each CpG site was automatically calculated by the abovementioned PyroMark Q24 Software and given as a percentage. The % methylated fraction (C/T ratio) was displayed in a small colored box just above each CpG site in the analyzed sequence [37]. For each CpG island tested, a mean result was calculated. For data analysis, the average percentages of all 13 CpGs (whole P1 region), 1-7 CpGs (P1a region) and 8-13 CpGs (P1b region) were determined as well as the results of each tested CpG.

4.5. Pyrosequencing Intra and Inter-Assay Analysis

To assess the intra-assay precision of pyrosequencing, two cell lines (MRC5 and BEAS-2B) were tested 3 times in a single run. To evaluate the inter-assay variation, the same cell lines were tested 5 times in 3 different runs. To obtain the mean and standard deviation values from each control, the coefficient of variation (CV) was used to assess the pyrosequencing performance by determining the ratio by the standard deviation and mean for both inter- and intra-assay.

4.6. Mutation Profiling of Cell Lines

Exon/intron gene structure were obtained from NCBI/Genbank databases and primers set used for genetic screening were designed in order to cover the entire region of the DGR domain of the KEAP1 (exons 4–6) and the exon 2 of NFE2LE gene [27]. PCR amplification of each fragment was performed by using Gene Amp PCR System 9700 thermal cycler (Applied Biosystem, Foster City, CA, USA). PCR products were purified using GFX PCR DNA and the Gel Band Purification Kit (GE Healthcare, Buckinghamshire, UK) and sequenced by using the Big Dye Terminator Ready Reaction mix v. 1.1 on an ABI 3100 sequence detection system with the Sequencing Analysis software v.3.7 (Applied Biosystems), [31].

4.7. Quantification of KEAP1 Expression by Real-Time Quantitative PCR Analysis

The StrataClonePCR Cloning Vector (Stratagene, Milan, Italy) was used to clone PCR fragments for KEAP1 and RPLPO genes which were amplified by TaqMan assays (KEAP1 Assay ID: Hs00202227_m1, Applied Biosystems and RPLPO Assay ID: 4326314E, Thermo Fisher). We constructed different standard curves for RPLPO and KEAP1 genes with different copy numbers of plasmids. SuperScript III First-Strand Synthesis (Thermo Fisher, Invitrogen Division, Carlsbad, CA, USA) was used to obtain cDNA synthesis from 1 μg of total RNA extracted from cell lines. Detection by real-time RT-PCR was performed with TaqMan Gene Expression Assays (Thermo Fisher, Life Technologies division). The reactions were run in triplicate on an ABI PRISM 7900HT Sequence Detection System (Thermo Fisher, Life Technologies Division). mRNA levels of KEAP1 were calculated by normalizing its calibration curves and its sample concentration versus RPLPO (endogenous gene). The relative sample amount that results in plasmid concentrations expressed as copy number of corresponding standard molecules was calculated according the following formula: Target/Housekeeping*1000.

4.8. In vitro 5-Aza-2′-deoxycytidine (5-aza-dC) Treatment

H69V, H1573 and H720 cell lines were seeded in a six-well dish. The 5-aza-2′-deoxycytidine, an inhibitor of DNA methyltransferase, was added in a concentration of 5 μM (Sigma-Aldrich, St. Louis, MO, USA) with fresh medium for 24 h, 48 h, and 72 h in each one of them. At each time points cells were harvested for DNA and RNA isolation to measure DNA methylation at KEAP1 promoter region by QMSP and KEAP1 transcription levels.

4.9. Statistical Analysis

Data are expressed as mean ± SEM of the number of in vitro experiments (n) indicated in the figure legends. In all the assays “n” is referred to the number of independent experiments performed on different cell preparations. For in vitro experiments, at least three to seven different wells were analyzed. All statistically significant differences were computed using a t-test, the significance level being set at * p < 0.05; ** p < 0.01; *** p < 0.001. All graphs shown, were performed by GraphPad Prism 5.

5. Conclusions

Our results confirm the effect of methylation on KEAP1 transcription control across multiple histologies of lung cancer. Since QMSP does not provide methylation frequency at individual CpG sites, we suggest pyrosequencing as the best approach to investigate the pattern of CpGs methylation in the promoter region of KEAP1. The validation of this approach on lung cancer patient cohorts is essential to clarify the prognostic value of the epigenetic deregulation of KEAP1 in lung tumors.

Supplementary Materials

Supplementary materials can be found at https://www.mdpi.com/1422-0067/20/11/2697/s1. Supplemental Figure S1. Representative KEAP1 promoter methylation pyrograms after DNA bisulfite conversion obtained with the first (1–7 CpGs, P1a region) and second reactions of primers (8–13 CpGs, P1b region) respectively. (A) Universal Methylated Human DNA; (B) Universal Unmethylated Human DNA. X axis shows the dispensation order; Percentages indicate the proportion of C (cytosine). Supplemental Table S1. (A) Pyrosequencing methylation levels at P1 KEAP1 promoter region in normal MRC5 and BEAS-2B cell lines. (B) Pyrosequencing methylation level of each single CpG site at P1 KEAP1 promoter region in normal MRC5 and BEAS-2B lung cell line.

Author Contributions

F.P.F. was responsible for the conception and design of this paper, analysis, interpretation of the data and drafting of the paper. A.S. contributed to the analysis, acquisition of molecular and histological data and statistical analysis. F.C. contributed to the analysis and acquisition of molecular data. D.T. contributed to the interpretation of data and to the revision of manuscript. P.G., E.M., C.T.S. and V.M.F. contributed to the revision of the paper. L.A.M. was responsible for the conception and design of this paper, interpretation of the data, the drafting and revision of the paper. All authors read and approved the final manuscript.

Funding

This work was supported by the Italian Ministry of Health (Ricerca Corrente RC1703LO41 and GR program 2010-2316264 to L.A.M.; RC1703AP30 to P.G.), the AIRC/MGAF grant 12983 (to L.A.M.), the AIRC IG 15413 to C.T.S., and by the “5x1000” voluntary contributions to IRCCS Casa Sollievo della Sofferenza.

Acknowledgments

We thank to Andreina Guarnieri for professional English editing of the manuscript.

Conflicts of Interest

The authors declare that they have no competing interests.

References

  1. Chio, C., II; Tuveson, D.A. ROS in Cancer: The Burning Question. Trends Mol. Med. 2017, 23, 411–429. [Google Scholar] [CrossRef] [PubMed] [Green Version]
  2. Kumari, S.; Badana, A.K.; Malla, R. Reactive Oxygen Species: A Key Constituent in Cancer Survival. Biomark Insights 2018, 13, 1177271918755391. [Google Scholar] [CrossRef] [PubMed]
  3. Reczek, C.R.; Chandel, N.S. ROS-dependent signal transduction. Curr. Opin. Cell Biol. 2015, 33, 8–13. [Google Scholar] [CrossRef] [PubMed]
  4. Cloer, E.W.; Goldfarb, D.; Schrank, T.P. Weissman BE, Major MB: NRF2 Activation in Cancer: From DNA to Protein. Cancer Res. 2019, 79, 889–898. [Google Scholar] [CrossRef] [PubMed]
  5. Hayes, J.D.; McMahon, M. NRF2 and KEAP1 mutations: Permanent activation of an adaptive response in cancer. Trends Biochem. Sci. 2009, 34, 176–188. [Google Scholar] [CrossRef] [PubMed]
  6. Menegon, S.; Columbano, A.; Giordano, S. The Dual Roles of NRF2 in Cancer. Trends Mol. Med. 2016, 22, 578–593. [Google Scholar] [CrossRef]
  7. Fabrizio, F.P.; Sparaneo, A.; Trombetta, D.; Muscarella, L.A. Epigenetic versus Genetic Deregulation of the KEAP1/NRF2 Axis in Solid Tumors: Focus on Methylation and Noncoding RNAs. Oxid. Med. Cell Longev. 2018, 2018, 2492063. [Google Scholar] [CrossRef] [PubMed]
  8. Sparaneo, A.; Fabrizio, F.P.; Muscarella, L.A. Nrf2 and Notch Signaling in Lung Cancer: Near the Crossroad. Oxid. Med. Cell Longev. 2016, 2016, 7316492. [Google Scholar] [CrossRef]
  9. Kaspar, J.W.; Niture, S.K.; Jaiswal, A.K. Nrf2:INrf2 (Keap1) signaling in oxidative stress. Free Radic. Biol. Med. 2009, 47, 1304–1309. [Google Scholar] [CrossRef] [Green Version]
  10. Dinkova-Kostova, A.T.; Holtzclaw, W.D.; Cole, R.N.; Itoh, K.; Wakabayashi, N.; Katoh, Y.; Yamamoto, M.; Talalay, P. Direct evidence that sulfhydryl groups of Keap1 are the sensors regulating induction of phase 2 enzymes that protect against carcinogens and oxidants. Proc. Natl. Acad. Sci. USA 2002, 99, 11908–11913. [Google Scholar] [CrossRef] [Green Version]
  11. Singh, A.; Misra, V.; Thimmulappa, R.K.; Lee, H.; Ames, S.; Hoque, M.O.; Herman, J.G.; Baylin, S.B.; Sidransky, D.; Gabrielson, E.; et al. Dysfunctional KEAP1-NRF2 interaction in non-small-cell lung cancer. PLoS Med. 2006, 3, e420. [Google Scholar] [CrossRef]
  12. Wu, S.; Lu, H.; Bai, Y. Nrf2 in cancers: A double-edged sword. Cancer Med. 2019. [Google Scholar] [CrossRef] [PubMed]
  13. Konstantinopoulos, P.A.; Spentzos, D.; Fountzilas, E.; Francoeur, N.; Sanisetty, S.; Grammatikos, A.P.; Hecht, J.L.; Cannistra, S.A. Keap1 mutations and Nrf2 pathway activation in epithelial ovarian cancer. Cancer Res. 2011, 71, 5081–5089. [Google Scholar] [CrossRef] [PubMed]
  14. Shibata, T.; Kokubu, A.; Gotoh, M.; Ojima, H.; Ohta, T.; Yamamoto, M.; Hirohashi, S. Genetic alteration of Keap1 confers constitutive Nrf2 activation and resistance to chemotherapy in gallbladder cancer. Gastroenterology 2008, 135, 1358–1368. [Google Scholar] [CrossRef] [PubMed]
  15. Yoo, N.J.; Kim, H.R.; Kim, Y.R.; An, C.H.; Lee, S.H. Somatic mutations of the KEAP1 gene in common solid cancers. Histopathology 2012, 60, 943–952. [Google Scholar] [CrossRef]
  16. Nioi, P.; Nguyen, T. A mutation of Keap1 found in breast cancer impairs its ability to repress Nrf2 activity. Biochem. Biophys Res. Commun. 2007, 362, 816–821. [Google Scholar] [CrossRef] [PubMed]
  17. Sjoblom, T.; Jones, S.; Wood, L.D.; Parsons, D.W.; Lin, J.; Barber, T.D.; Mandelker, D.; Leary, R.J.; Ptak, J.; Silliman, N.; et al. The consensus coding sequences of human breast and colorectal cancers. Science 2006, 314, 268–274. [Google Scholar] [CrossRef]
  18. Eichenmuller, M.; Trippel, F.; Kreuder, M.; Beck, A.; Schwarzmayr, T.; Haberle, B.; Cairo, S.; Leuschner, I.; von Schweinitz, D.; Strom, T.M.; et al. The genomic landscape of hepatoblastoma and their progenies with HCC-like features. J. Hepatol. 2014, 61, 1312–1320. [Google Scholar] [CrossRef] [PubMed]
  19. Martinez, V.D.; Vucic, E.A.; Thu, K.L.; Pikor, L.A.; Lam, S.; Lam, W.L. Disruption of KEAP1/CUL3/RBX1 E3-ubiquitin ligase complex components by multiple genetic mechanisms: Association with poor prognosis in head and neck cancer. Head. Neck. 2015, 37, 727–734. [Google Scholar] [CrossRef]
  20. Sato, Y.; Yoshizato, T.; Shiraishi, Y.; Maekawa, S.; Okuno, Y.; Kamura, T.; Shimamura, T.; Sato-Otsubo, A.; Nagae, G.; Suzuki, H.; et al. Integrated molecular analysis of clear-cell renal cell carcinoma. Nat. Genet. 2013, 45, 860–867. [Google Scholar] [CrossRef]
  21. George, J.; Lim, J.S.; Jang, S.J.; Cun, Y.; Ozretic, L.; Kong, G.; Leenders, F.; Lu, X.; Fernandez-Cuesta, L.; Bosco, G.; et al. Comprehensive genomic profiles of small cell lung cancer. Nature 2015, 524, 47–53. [Google Scholar] [CrossRef]
  22. Schulze, K.; Imbeaud, S.; Letouze, E.; Alexandrov, L.B.; Calderaro, J.; Rebouissou, S.; Couchy, G.; Meiller, C.; Shinde, J.; Soysouvanh, F.; et al. Exome sequencing of hepatocellular carcinomas identifies new mutational signatures and potential therapeutic targets. Nat. Genet. 2015, 47, 505–511. [Google Scholar] [CrossRef]
  23. Kim, Y.R.; Oh, J.E.; Kim, M.S.; Kang, M.R.; Park, S.W.; Han, J.Y.; Eom, H.S.; Yoo, N.J.; Lee, S.H. Oncogenic NRF2 mutations in squamous cell carcinomas of oesophagus and skin. J. Pathol. 2010, 220, 446–451. [Google Scholar] [CrossRef]
  24. Sasaki, H.; Shitara, M.; Yokota, K.; Hikosaka, Y.; Moriyama, S.; Yano, M.; Fujii, Y. Increased NRF2 gene (NFE2L2) copy number correlates with mutations in lung squamous cell carcinomas. Mol. Med. Rep. 2012, 6, 391–394. [Google Scholar] [CrossRef] [Green Version]
  25. Goldstein, L.D.; Lee, J.; Gnad, F.; Klijn, C.; Schaub, A.; Reeder, J.; Daemen, A.; Bakalarski, C.E.; Holcomb, T.; Shames, D.S.; et al. Recurrent Loss of NFE2L2 Exon 2 Is a Mechanism for Nrf2 Pathway Activation in Human Cancers. Cell Rep. 2016, 16, 2605–2617. [Google Scholar] [CrossRef] [Green Version]
  26. Ooi, A.; Dykema, K.; Ansari, A.; Petillo, D.; Snider, J.; Kahnoski, R.; Anema, J.; Craig, D.; Carpten, J.; The, B.T.; et al. CUL3 and NRF2 mutations confer an NRF2 activation phenotype in a sporadic form of papillary renal cell carcinoma. Cancer Res. 2013, 73, 2044–2051. [Google Scholar] [CrossRef]
  27. Fabrizio, F.P.; Costantini, M.; Copetti, M.; la Torre, A.; Sparaneo, A.; Fontana, A.; Poeta, L.; Gallucci, M.; Sentinelli, S.; Graziano, P.; et al. Keap1/Nrf2 pathway in kidney cancer: Frequent methylation of KEAP1 gene promoter in clear renal cell carcinoma. Oncotarget 2017, 8, 11187–11198. [Google Scholar] [CrossRef]
  28. Muscarella, L.A.; Barbano, R.; D’Angelo, V.; Copetti, M.; Coco, M.; Balsamo, T.; la Torre, A.; Notarangelo, A.; Troiano, M.; Parisi, S.; et al. Regulation of KEAP1 expression by promoter methylation in malignant gliomas and association with patient’s outcome. Epigenetics 2011, 6, 317–325. [Google Scholar] [CrossRef]
  29. Wang, R.; An, J.; Ji, F.; Jiao, H.; Sun, H.; Zhou, D. Hypermethylation of the Keap1 gene in human lung cancer cell lines and lung cancer tissues. Biochem. Biophys. Res. Commun. 2008, 373, 151–154. [Google Scholar] [CrossRef]
  30. Barbano, R.; Muscarella, L.A.; Pasculli, B.; Valori, V.M.; Fontana, A.; Coco, M.; la Torre, A.; Balsamo, T.; Poeta, M.L.; Marangi, G.F.; et al. Aberrant Keap1 methylation in breast cancer and association with clinicopathological features. Epigenetics 2013, 8, 105–112. [Google Scholar] [CrossRef]
  31. Muscarella, L.A.; Parrella, P.; D’Alessandro, V.; la Torre, A.; Barbano, R.; Fontana, A.; Tancredi, A.; Guarnieri, V.; Balsamo, T.; Coco, M.; et al. Frequent epigenetics inactivation of KEAP1 gene in non-small cell lung cancer. Epigenetics 2011, 6, 710–719. [Google Scholar] [CrossRef] [Green Version]
  32. Hanada, N.; Takahata, T.; Zhou, Q.; Ye, X.; Sun, R.; Itoh, J.; Ishiguro, A.; Kijima, H.; Mimura, J.; Itoh, K.; et al. Methylation of the KEAP1 gene promoter region in human colorectal cancer. BMC Cancer 2012, 12, 66. [Google Scholar] [CrossRef]
  33. Zhang, P.; Singh, A.; Yegnasubramanian, S.; Esopi, D.; Kombairaju, P.; Bodas, M.; Wu, H.; Bova, S.G.; Biswal, S. Loss of Kelch-like ECH-associated protein 1 function in prostate cancer cells causes chemoresistance and radioresistance and promotes tumor growth. Mol. Cancer Ther. 2010, 9, 336–346. [Google Scholar] [CrossRef]
  34. Frank, R.; Scheffler, M.; Merkelbach-Bruse, S.; Ihle, M.A.; Kron, A.; Rauer, M.; Ueckeroth, F.; Konig, K.; Michels, S.; Fischer, R.; et al. Clinical and Pathological Characteristics of KEAP1- and NFE2L2-Mutated Non-Small Cell Lung Carcinoma (NSCLC). Clin. Cancer Res. 2018, 24, 3087–3096. [Google Scholar] [CrossRef]
  35. Derks, J.L.; Leblay, N.; Thunnissen, E.; van Suylen, R.J.; den Bakker, M.; Groen, H.J.M.; Smit, E.F.; Damhuis, R.; van den Broek, E.C.; Charbrier, A.; et al. Molecular Subtypes of Pulmonary Large-cell Neuroendocrine Carcinoma Predict Chemotherapy Treatment Outcome. Clin. Cancer Res. 2018, 24, 33–42. [Google Scholar] [CrossRef]
  36. Namani, A.; Matiur Rahaman, M.; Chen, M.; Tang, X. Gene-expression signature regulated by the KEAP1-NRF2-CUL3 axis is associated with a poor prognosis in head and neck squamous cell cancer. BMC Cancer 2018, 18, 46. [Google Scholar] [CrossRef]
  37. Liu, X.; Sun, C.; Liu, B.; Jin, X.; Li, P.; Zheng, X.; Zhao, T.; Li, F.; Li, Q. Genistein mediates the selective radiosensitizing effect in NSCLC A549 cells via inhibiting methylation of the keap1 gene promoter region. Oncotarget 2016, 7, 27267–27279. [Google Scholar] [CrossRef]
  38. Rekhtman, N.; Pietanza, M.C.; Hellmann, M.D.; Naidoo, J.; Arora, A.; Won, H.; Halpenny, D.F.; Wang, H.; Tian, S.K.; Litvak, A.M.; et al. Next-Generation Sequencing of Pulmonary Large Cell Neuroendocrine Carcinoma Reveals Small Cell Carcinoma-like and Non-Small Cell Carcinoma-like Subsets. Clin. Cancer Res. 2016, 22, 3618–3629. [Google Scholar] [CrossRef]
  39. Tost, J. Current and Emerging Technologies for the Analysis of the Genome-Wide and Locus-Specific DNA Methylation Patterns. Adv. Exp. Med. Biol. 2016, 945, 343–430. [Google Scholar]
  40. Guo, D.; Wu, B.; Yan, J.; Li, X.; Sun, H.; Zhou, D. A possible gene silencing mechanism: Hypermethylation of the Keap1 promoter abrogates binding of the transcription factor Sp1 in lung cancer cells. Biochem. Biophys. Res. Commun. 2012, 428, 80–85. [Google Scholar] [CrossRef]
  41. Lania, L.; Majello, B.; De Luca, P. Transcriptional regulation by the Sp family proteins. Int. J. Biochem. Cell Biol. 1997, 29, 1313–1323. [Google Scholar] [CrossRef]
Figure 1. Sequence of KEAP1 P1 promoter region (-291 -89 bp from the TSS, transcription starting site) scanned by QMSP and pyrosequencing. CpGs are marked as yellow circles and numbers are given to the CpGs from 5′ to 3′ of positive strand of the KEAP1 gene. The primers used for QMSP and pyrosequencing analysis are indicated.
Ijms 20 02697 g001
Figure 2. Amplification panels by QMSP and pyrograms of KEAP1 hypermethylated H69V and H1573 cells. Amplification curves (Ct values versus ΔRn) of ACTB and KEAP1 genes were reported for (A) H69V and (C) H1573. Representative KEAP1 promoter pyrograms after DNA bisulfite conversion obtained with the first (P1a region) and second (P1b region) reactions of primers (1–7 and 8–13 CpG sites, respectively) were reported for (B) H69V and (D) H1573 cell lines.
Ijms 20 02697 g002
Figure 3. (A) Histograms showing the methylation levels detected by pyrosequencing at KEAP1 P1 promoter region in positive lung cancer cell lines. (B) Pyrosequencing methylation levels at P1a and P1b sub-regions of KEAP1 promoter in methylated lung cancer cell lines. p value was set at * p < 0.05; ** p < 0.01; *** p < 0.001, t-test.
Ijms 20 02697 g003
Figure 4. Changes in KEAP1 mRNA transcript levels in the (A) H69V, (C) H1573 cell lines by RT-PCR before (CTRL) and after treatment with 5 μM of 5-aza-dC at 24 h, 48 h, 72 h. Error bars indicate the standard deviation of three different experiments. Changes in KEAP1 promoter methylation levels in the (B) H69V, (D) H1573 cell lines by QMSP before (CTRL) and after treatment with 5 μM of 5-aza-dC at 24 h, 48 h, 72 h. Error bars indicate the standard deviation of three different experiments. * p < 0.05, ** p < 0.01, *** p < 0.001.
Ijms 20 02697 g004
Table 1. KEAP1 P1 promoter methylation levels assessed by QMSP and pyrosequencing.
Lung Cancer CellsHistologyQMSPCpG1CpG2CpG3CpG4CpG5CpG6CpG7CpG8CpG9CpG10CpG11CpG12CpG13Pyrosequencing (Mean % ± SD) *P1 Region Mean (%) ± SD **P1a Region Mean (%) ± SD **P1b Region Mean (%) ± SD **
H69V SCLC1389292967693897892917764433878.5 ± 19.379 ± 2088 ± 868 ± 23
H209 SCLC4.85547542340372221281574327.4 ± 18.027 ± 1340 ± 1313 ± 10
H1184 SCLC01491347568982226.9 ± 3.97 ± 58 ± 45 ± 3
N417 SCLC021191971115101212631210.6 ± 6.711 ± 615 ± 56 ± 5
H2107 SCLC0202424618101078831210.8 ± 8.011 ± 516 ± 75 ± 3
H1963 SCLC1561576813464036565144287639.5 ± 20.639 ± 3246 ± 1932 ± 22
GLC1 SCLC02125245121091915831211.8 ± 8.312 ± 815 ± 88 ± 7
GLC2 SCLC02624214101381713952211.8 ± 8.112 ± 815 ± 98 ± 6
GLC8 SCLC2285446533138373334353226212235.5 ± 10.436 ± 2842 ± 928 ± 6
GLC14 SCLC02215175101089952128.8 ± 6.29 ± 512 ± 65 ± 4
H510 SCLC084713332341013.1 ± 2.33 ± 24 ± 22 ± 1
H2141 SCLC017121447966762227.2 ± 4.77 ± 410 ± 54 ± 2
H720 AC78.89288966189846877746542153167.8 ± 25.068 ± 5183 ± 1351 ± 25
H727TC021142171111877113259.8 ± 6.010 ± 613 ± 66 ± 3
H460 LCC6665647228504133233233942136.5 ± 21.237 ± 2050 ± 1720 ± 12
H2126 ADC06858651529271820171653821.4 ± 14.427 ± 1240 ± 2312 ± 7
A549 ADC4928888957387817087846943181826.8 ± 22.469 ± 5383 ± 953 ± 31
H1573 ADC1238791958588836485828145151469.3 ± 26.370 ± 5485 ± 1054 ± 34
H2228 ADC04347371319241613251293670.4 ± 28.021 ± 1128 ± 1411 ± 8
H1975 ADC01610146101844922420.5 ± 14.17 ± 49 ± 54 ± 3
HCC4006 ADC0403548112417156192342206.9 ± 4.720 ± 1227 ± 1412 ± 9
H1395 ADC17727468365636352426231151020.3 ± 13.937 ± 1754 ± 1817 ± 9
H1581 ADC30443638122631530271682336.6 ± 23.921 ± 1427 ± 1414 ± 12
HCC-15 SqCC1285879454897867253824751351.2 ± 33.951 ± 1979 ± 1419 ± 13
H520 SqCC04534411225231414181452819.6 ± 13.420 ± 1028 ± 1310 ± 6
QMSP, quantitative methylation specific PCR; SD, standard deviation. P1a sub-region from 1 to 7 CpGs; P1b sub-region from 8 to 13 CpGs. SCLC, small cell lung cancer; AC, atypical carcinoid; TC, typical carcinoid; LCC, large cell carcinoma; ADC, adenocarcinoma; SqCC, Squamous Cell Carcinoma. * methylation levels were reported as mean ± SD of methylation levels of total 13 CpGs mapped at the KEAP1 P1 promoter region. ** methylation levels by pyrosequencing for P1, P1a and P1b were reported as mean ± SD of methylation levels of single CpG mapped at each specific region. The value of methylation of each CpG site is reported and is expressed as a percentage (%).
Table 2. (A) Inter-assay precision for KEAP1 P1 promoter methylation analysis by pyrosequencing. (whole P1 region). (B) Intra-assay precision for KEAP1 P1 promoter methylation analysis by pyrosequencing (whole P1 region).
(A)
Normal Cell LinesRN1 Mean ± SDRN2 Mean ± SDRN3 Mean ± SDRN4 Mean ± SDRN5 Mean ± SDALL RPs Mean ± SDSDCV%
MRC519.8 ± 12.416 ± 10.420.2 ± 12.322.3 ± 9.619.7 ± 11.919.6 ± 1.21.26.1
BEAS-2B24.8 ± 21.624.8 ± 18.223.2 ± 19.520.3 ± 17.522.5 ± 20.823.1 ± 1.71.77.4
(B)
Normal Cell LinesRP1 Mean ± SDRP2 Mean ± SDRP3 Mean ± SDALL RPs Mean ± SDSDCV%
MRC520.2 ± 12.322.3 ± 9.619.7 ± 11.920.7 ± 1.41.46.8
BEAS-2B23.2 ± 19.520.3 ± 17.522.5 ± 20.822 ± 1.71.77.7
(A) CV, coefficient of variation; SD, standard deviation; RN, run. To test inter-assay precision of pyrosequencing, two cell lines (MRC5 and BEAS-2B) were tested in 5 different runs (RNs). Values of methylation were reported as means of methylation levels of all 13 CpGs. Each value is expressed as a percentage (%). (B) CV, coefficient of variation; SD, standard deviation; RP, repetition. To test intra-assay precision of pyrosequencing, two cell lines (MRC5 and BEAS-2B) were tested 3× in the same run (RPs). Methylation level was reported as the mean of methylation levels of 13 CpGs. Each value is expressed as a percentage (%).
Table 3. (A) Inter-assay precision for KEAP1 P1 promoter methylation analysis by pyrosequencing (single CpG). (B) Intra-assay precision for KEAP1 P1 promoter methylation analysis by pyrosequencing (single CpG).
(A)
CpGMRC5 (Mean ± SD)BEAS-2B (Mean ± SD)CV %
137 ± 3.756.4 ± 6.12.6
234.6 ± 4.332.8 ± 4.70.6
339.2 ± 5.240.4 ± 3.12.6
417 ± 1.413.6 ± 2.12.2
522 ± 5.751.8 ± 5.70.1
623.8 ± 4.049 ± 2.22.4
717.8 ± 1.620.6 ± 4.26.6
817.6 ± 5.88.8 ± 1.117.7
916.4 ± 2.79.6 ±1.92.9
1011.2 ± 2.97.4 ± 4.48.2
118.8 ± 2.04.6 ± 1.54.0
124.6 ± 3.02.6 ± 1.521.3
134.8 ± 2.53.2 ± 2.72.4
(B)
CpGMRC5 (Mean ± SD)BEAS-2B (Mean ± SD)CV %
137.3 ± 2.554.3 ± 7.55.4
236.7 ± 1.229.7 ± 1.20.0
340.0 ± 1.740.0 ± 4.43.3
417.0 ± 2.012.3 ± 0.64.8
524.7 ± 1.249.3 ± 4.74.8
625.3 ± 1.550.0 ± 2.00.6
717.3 ±2.118.3 ± 3.84.8
820.7 ± 5.58.3 ± 1.215.0
917.7 ± 1.59.0 ± 2.01.8
1012.3 ± 2.36.7 ± 4.09.1
119.3 ± 2.54.3 ± 2.13.2
125.7 ± 3.82.0 ± 1.036.3
135.7 ± 3.12.0 ± 0.039.8
(A) CV, coefficient of variation; SD, standard deviation. To test inter-assay precision of pyrosequencing, two cell lines (MRC5 and BEAS-2B) were tested in 5 different runs. Each value is expressed as a percentage (%). (B) CV, coefficient of variation; SD, standard deviation. To test intra-assay precision of pyrosequencing, two cell lines (MRC5 and BEAS-2B) were tested 3× in the same run (RPs). Each value is expressed as a percentage (%).
Table 4. Genetic alterations of KEAP1 gene identified in lung cell lines.
Cell LineHistologyGene Protein DomainNucleotidic ChangeAmino Acid Change
H1184SCLCKEAP1KELCH2c.1090G > Tp.G364C
H460LCCKEAP1IVRc.706G > Cp.D236H
H2126ADCKEAP1IVRc.814C > Tp.R272C
A549ADCKEAP1KELCH1c.997G > Tp.G333C
H1573ADCKEAP1KELCH3c.1238G > Tp.L413R
H2228ADCKEAP1BTBc.269C > Tp.A90V
H1395ADCKEAP1KELCH1c.1048G > Ap.G350S
SCLC, small cell lung cancer; LCC, large cell carcinoma; ADC, adenocarcinoma. BTB, Broad complex, tramtrack and bric-a-brac; IVR, the intervening linker domain; KELCH1-2-3, Kelch-repeat domains.

