
De Novo Transcriptome Analysis of Differential Functional Gene Expression in Largemouth Bass (Micropterus salmoides) after Challenge with Nocardia seriolae


Abstract
:
1. Introduction
2. Results
2.1. Transcriptome Sequence Assembly
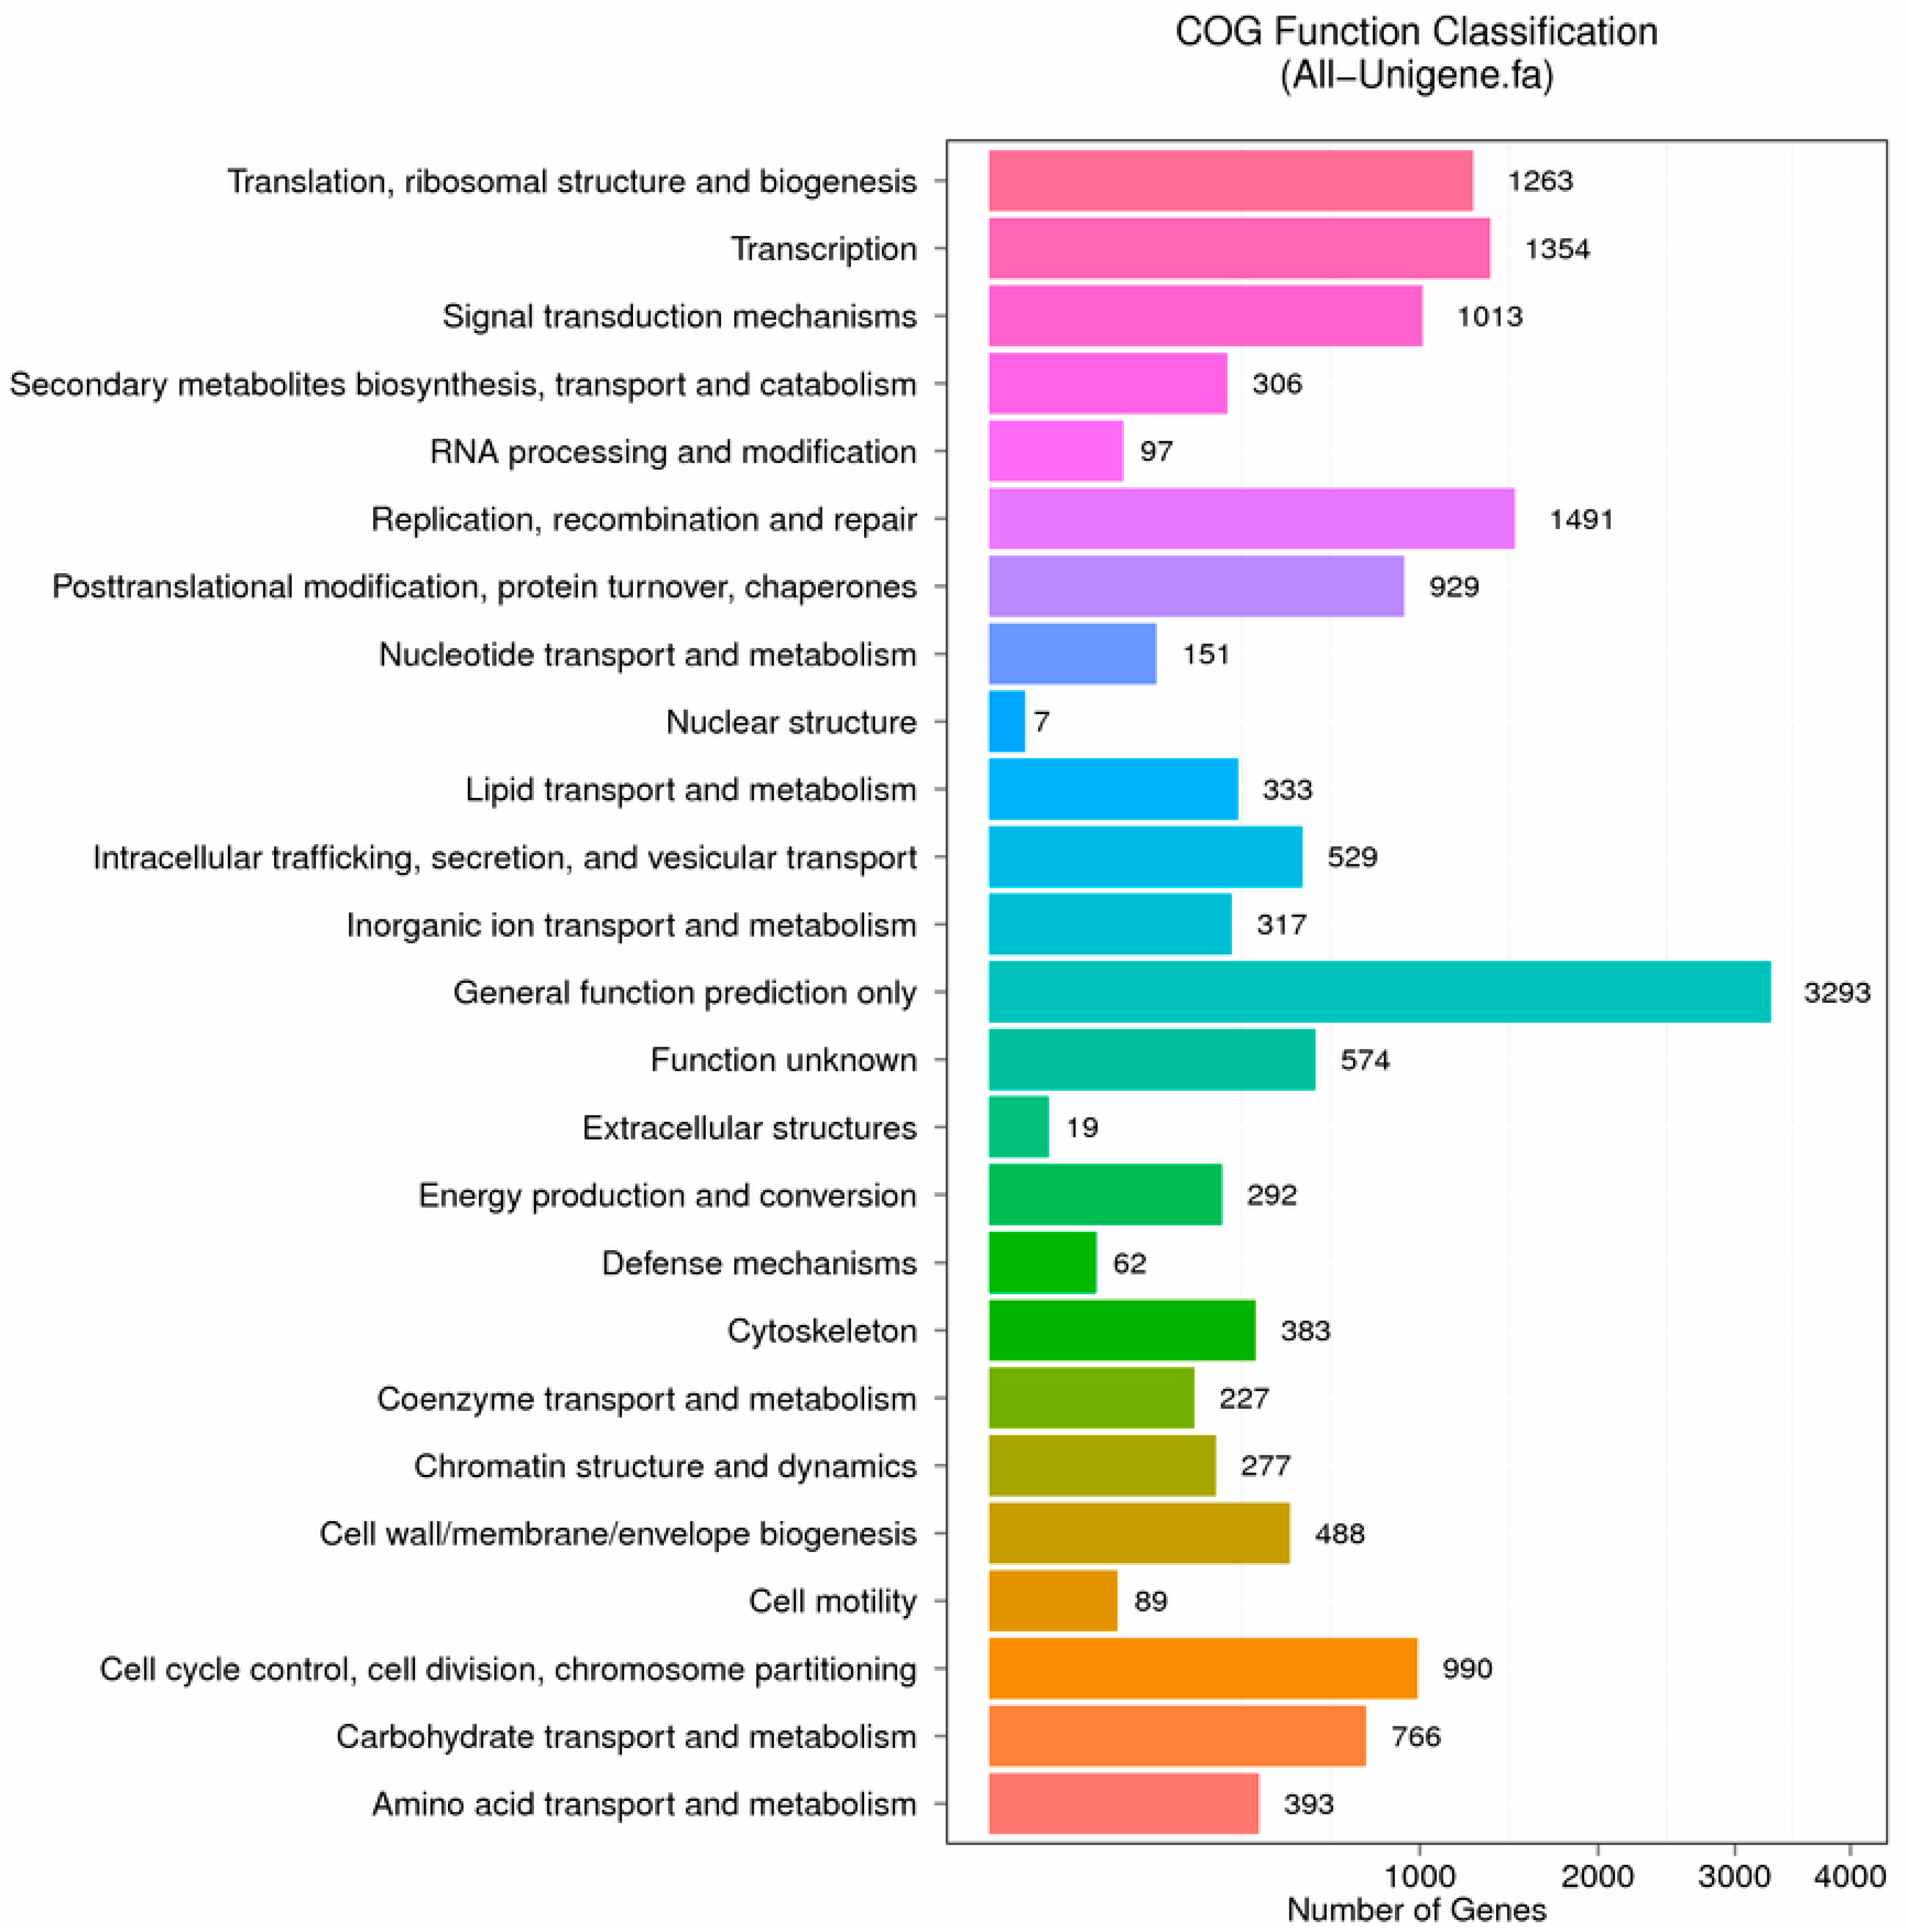
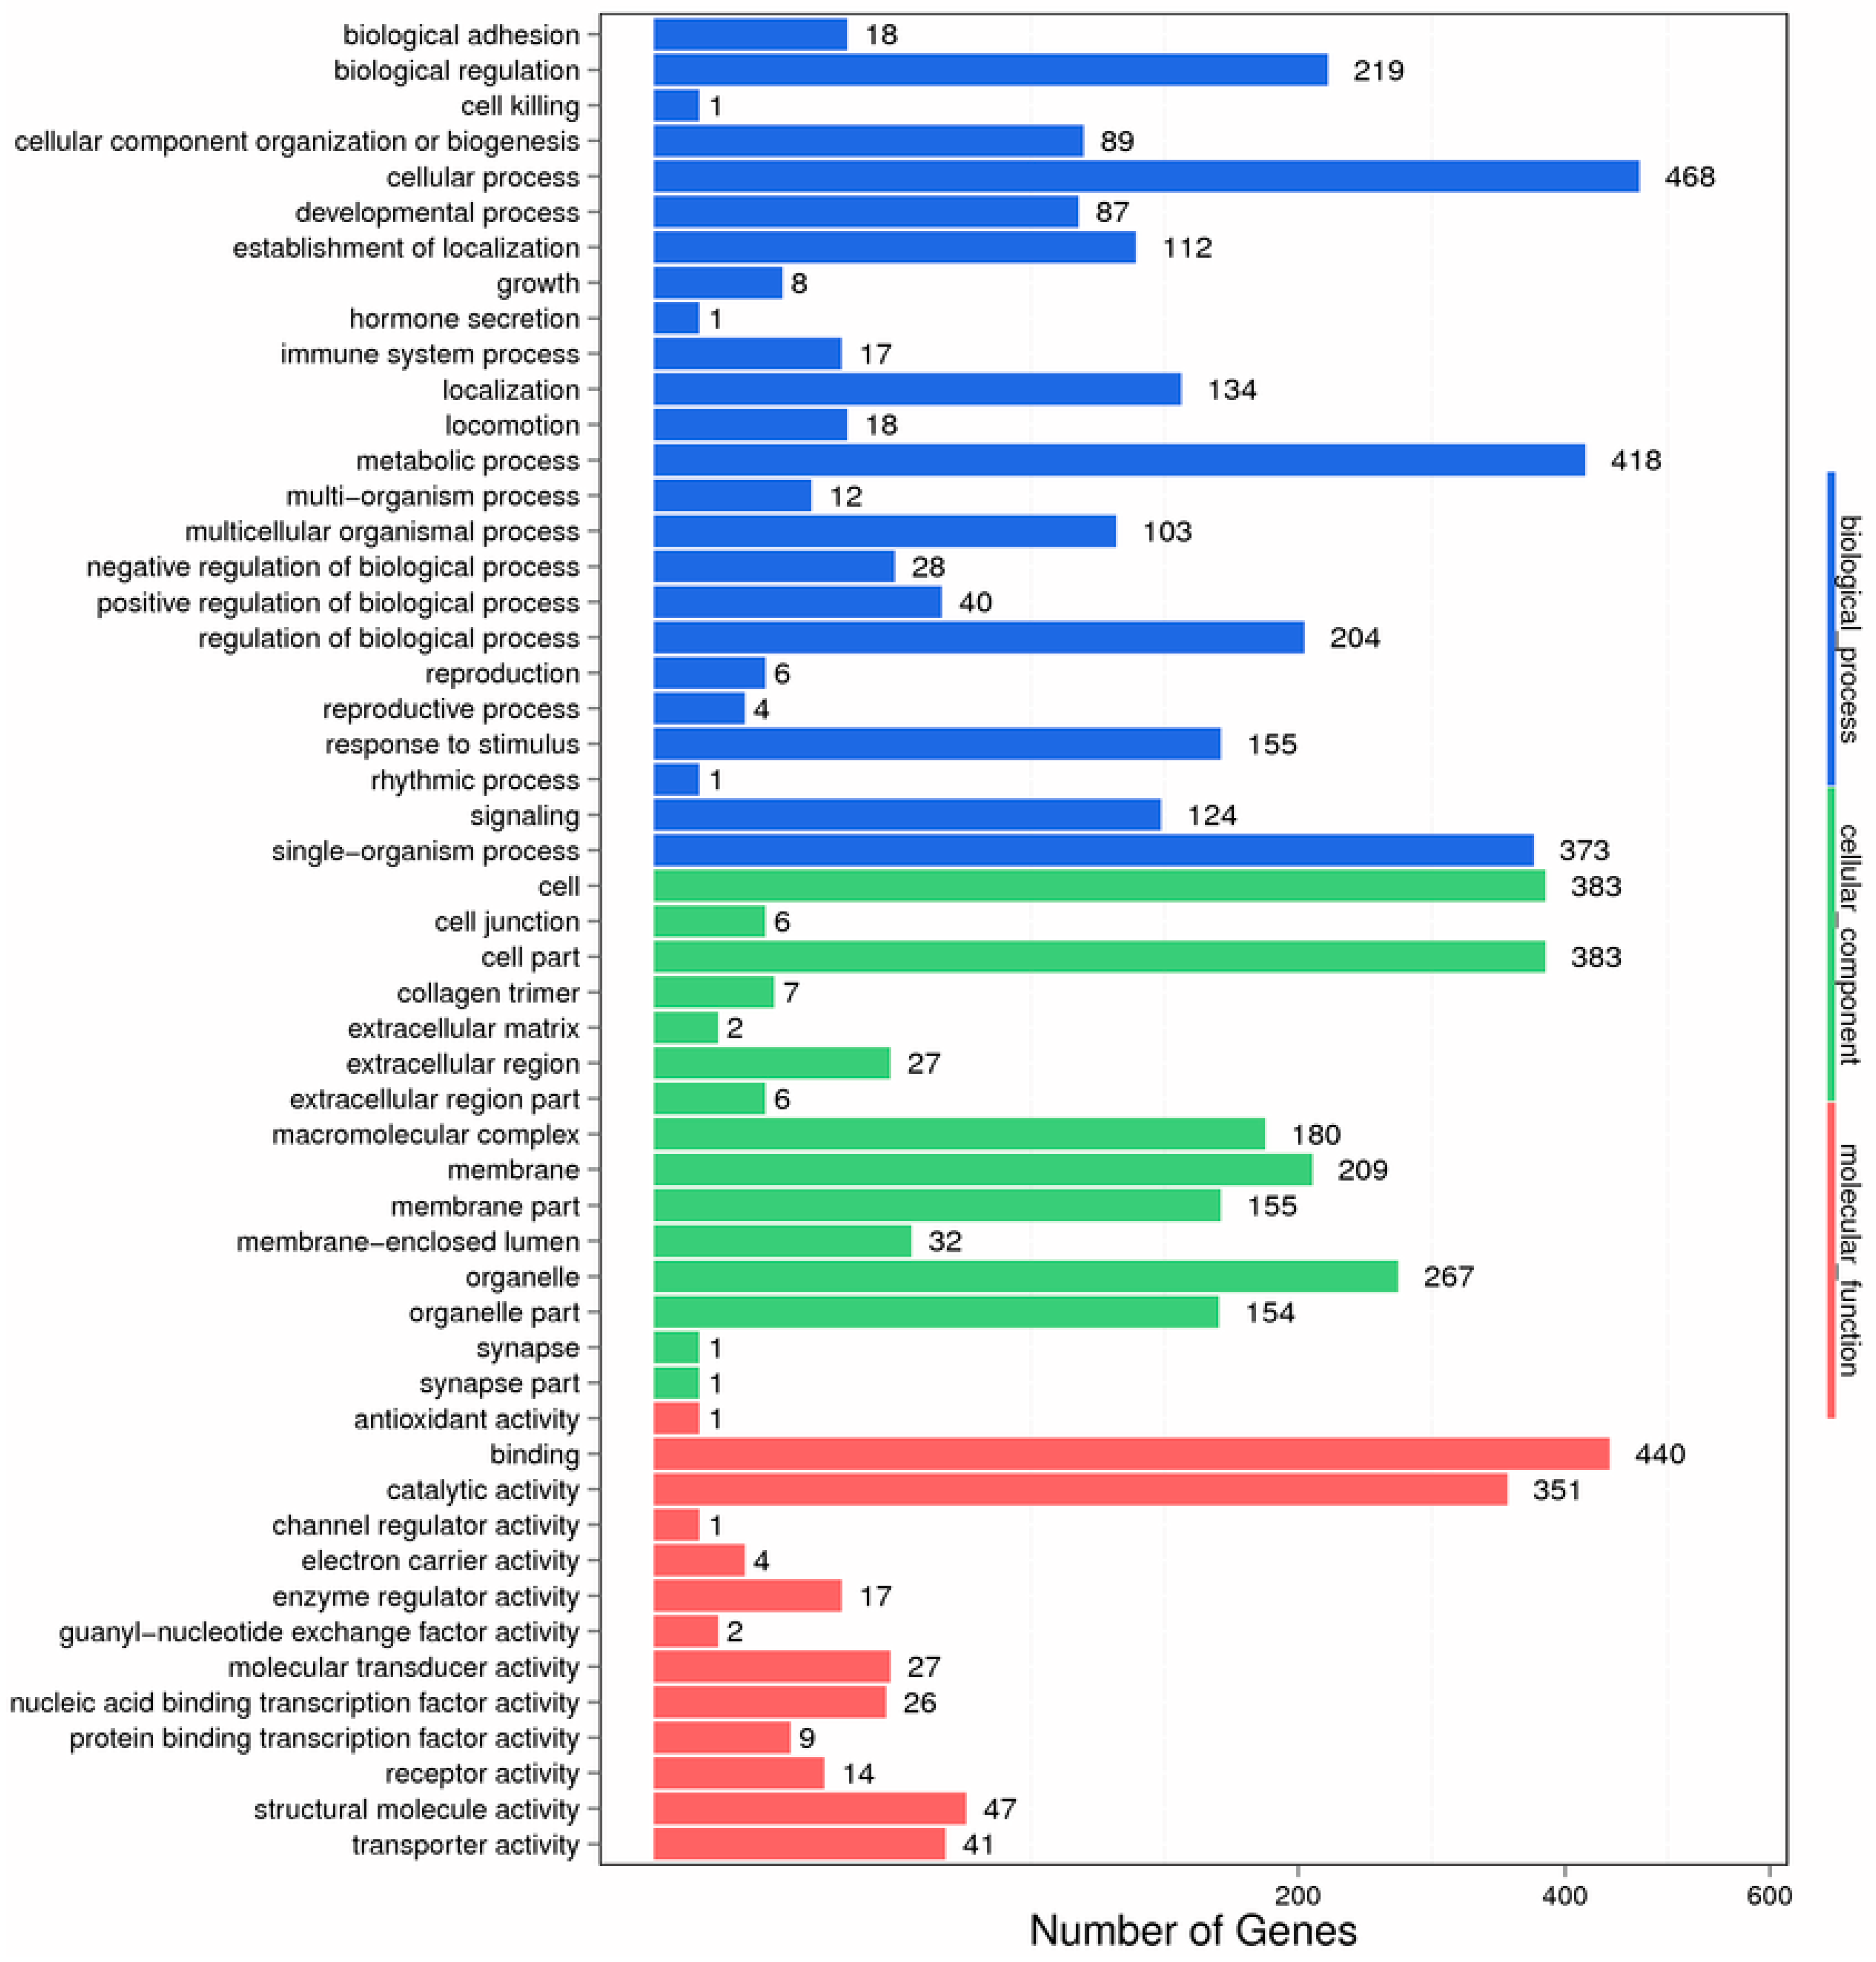
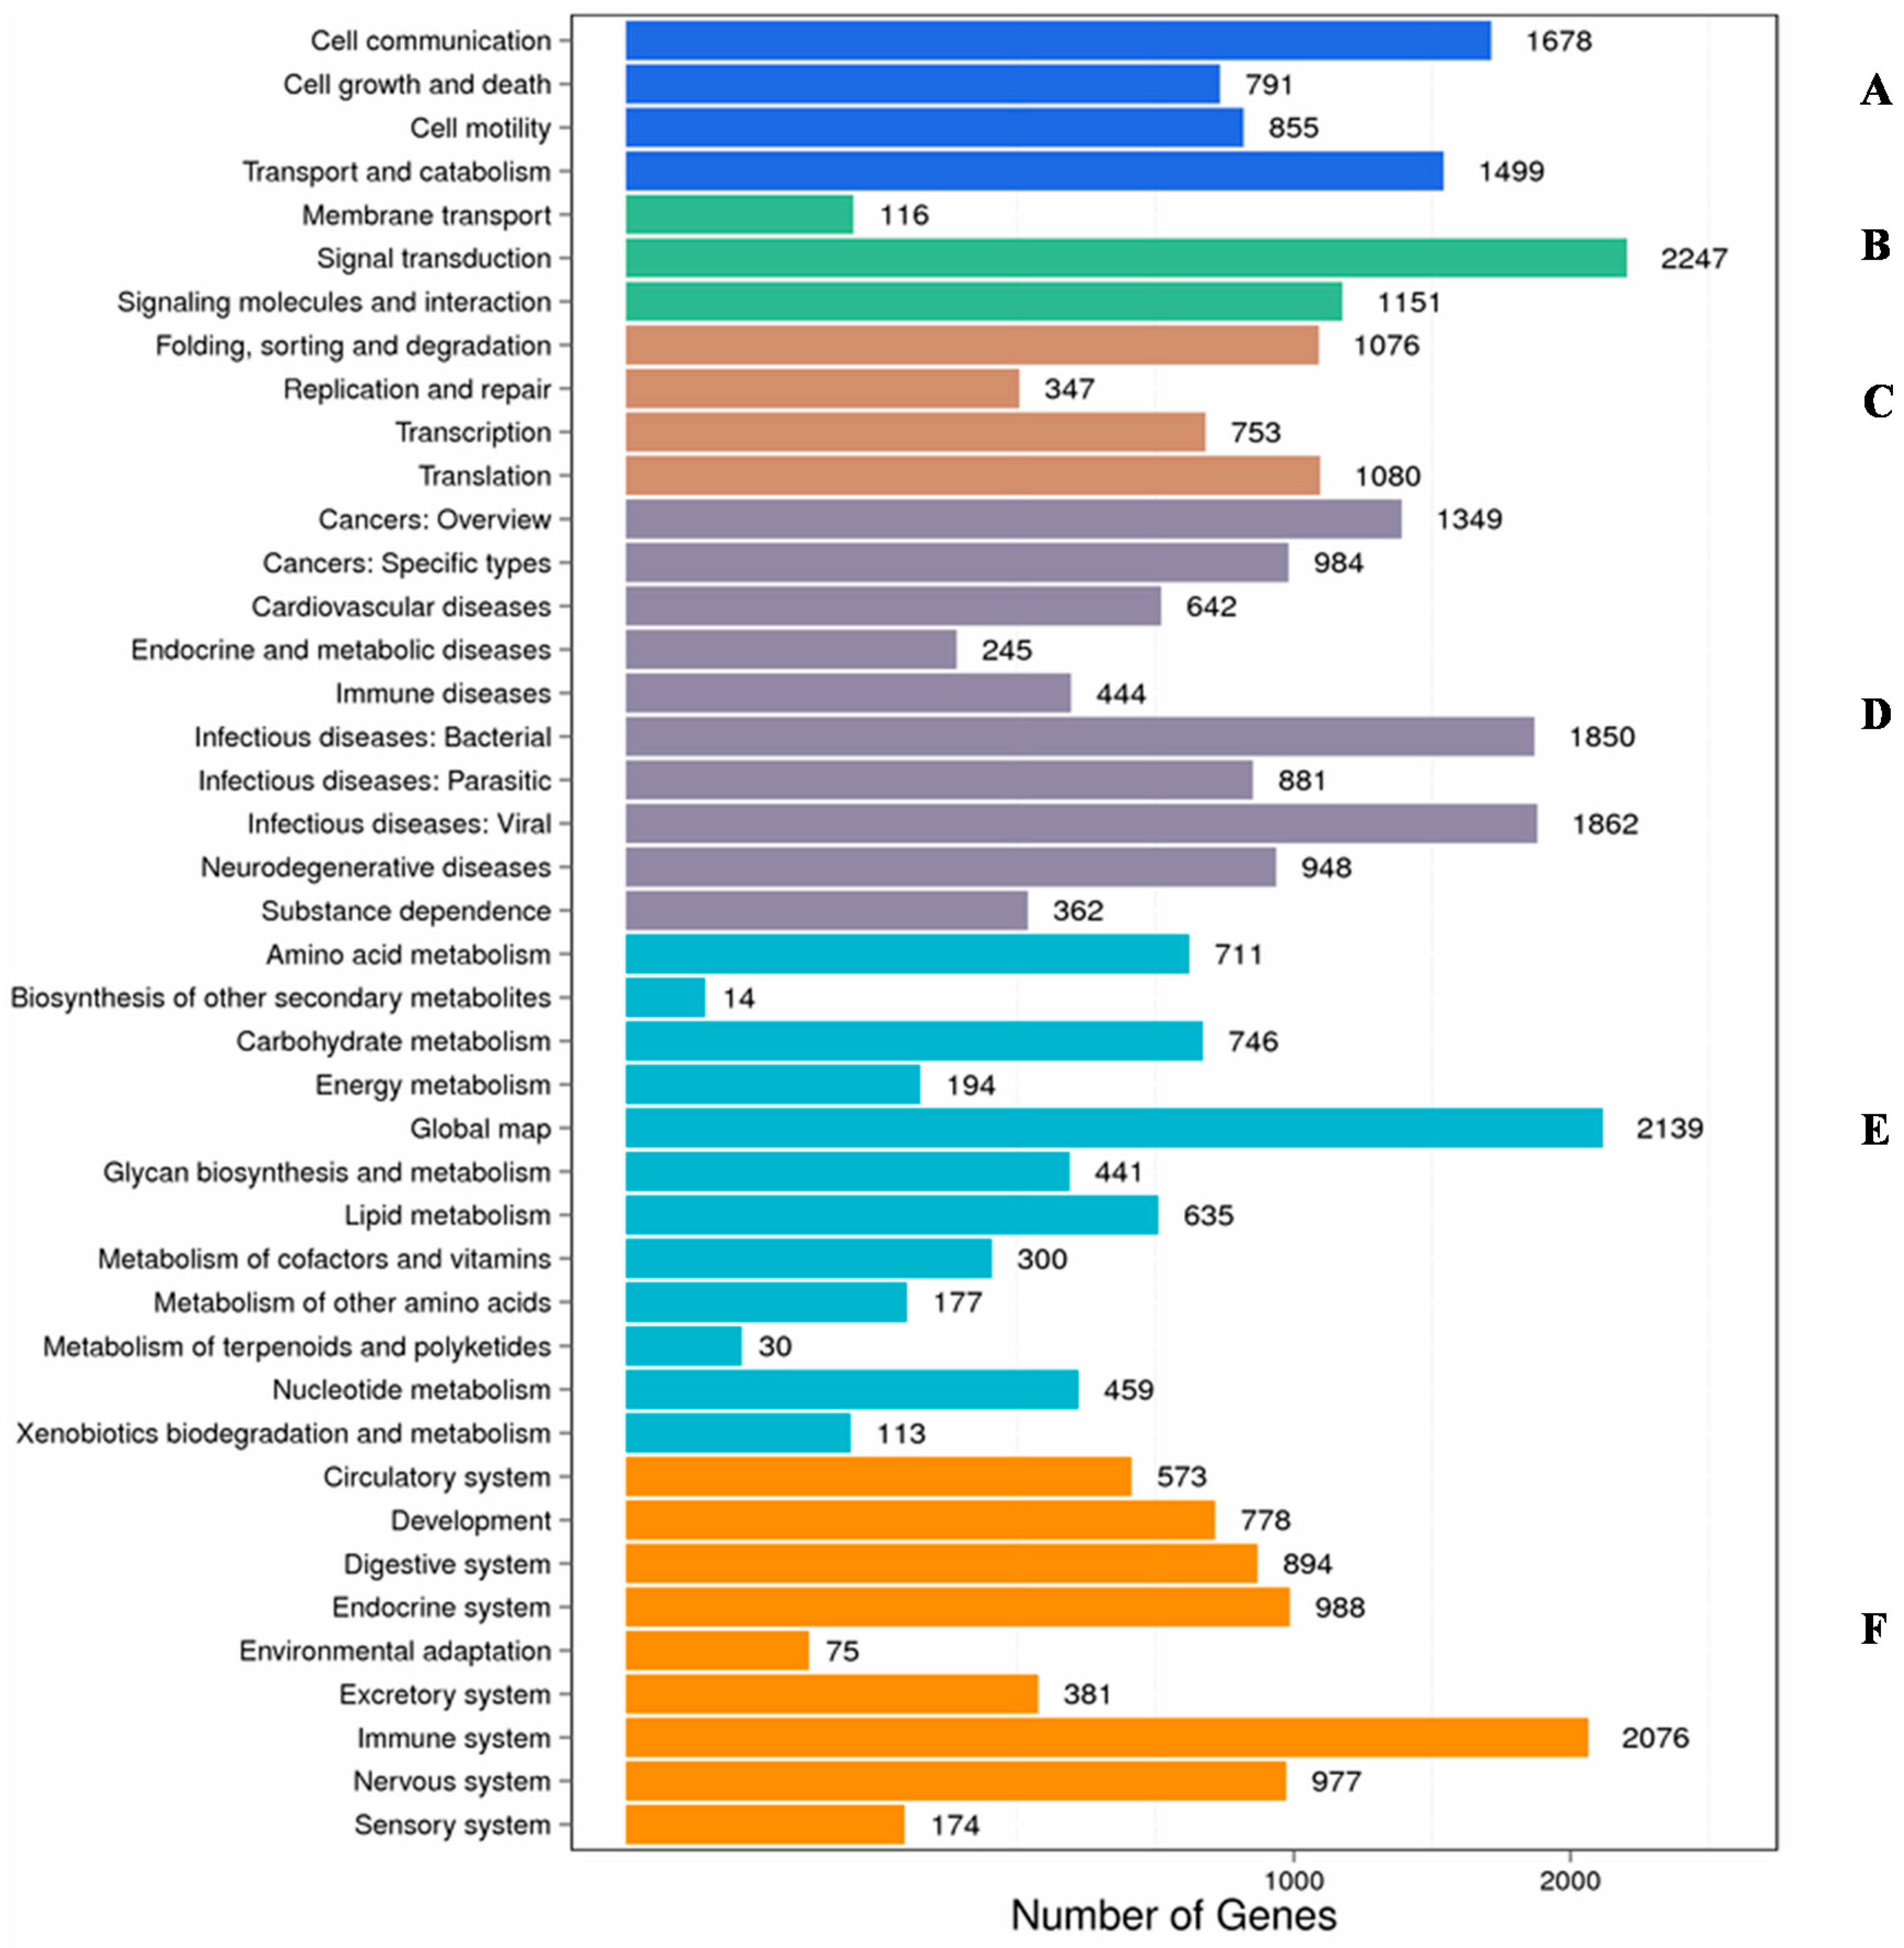
2.2. Functional Classification
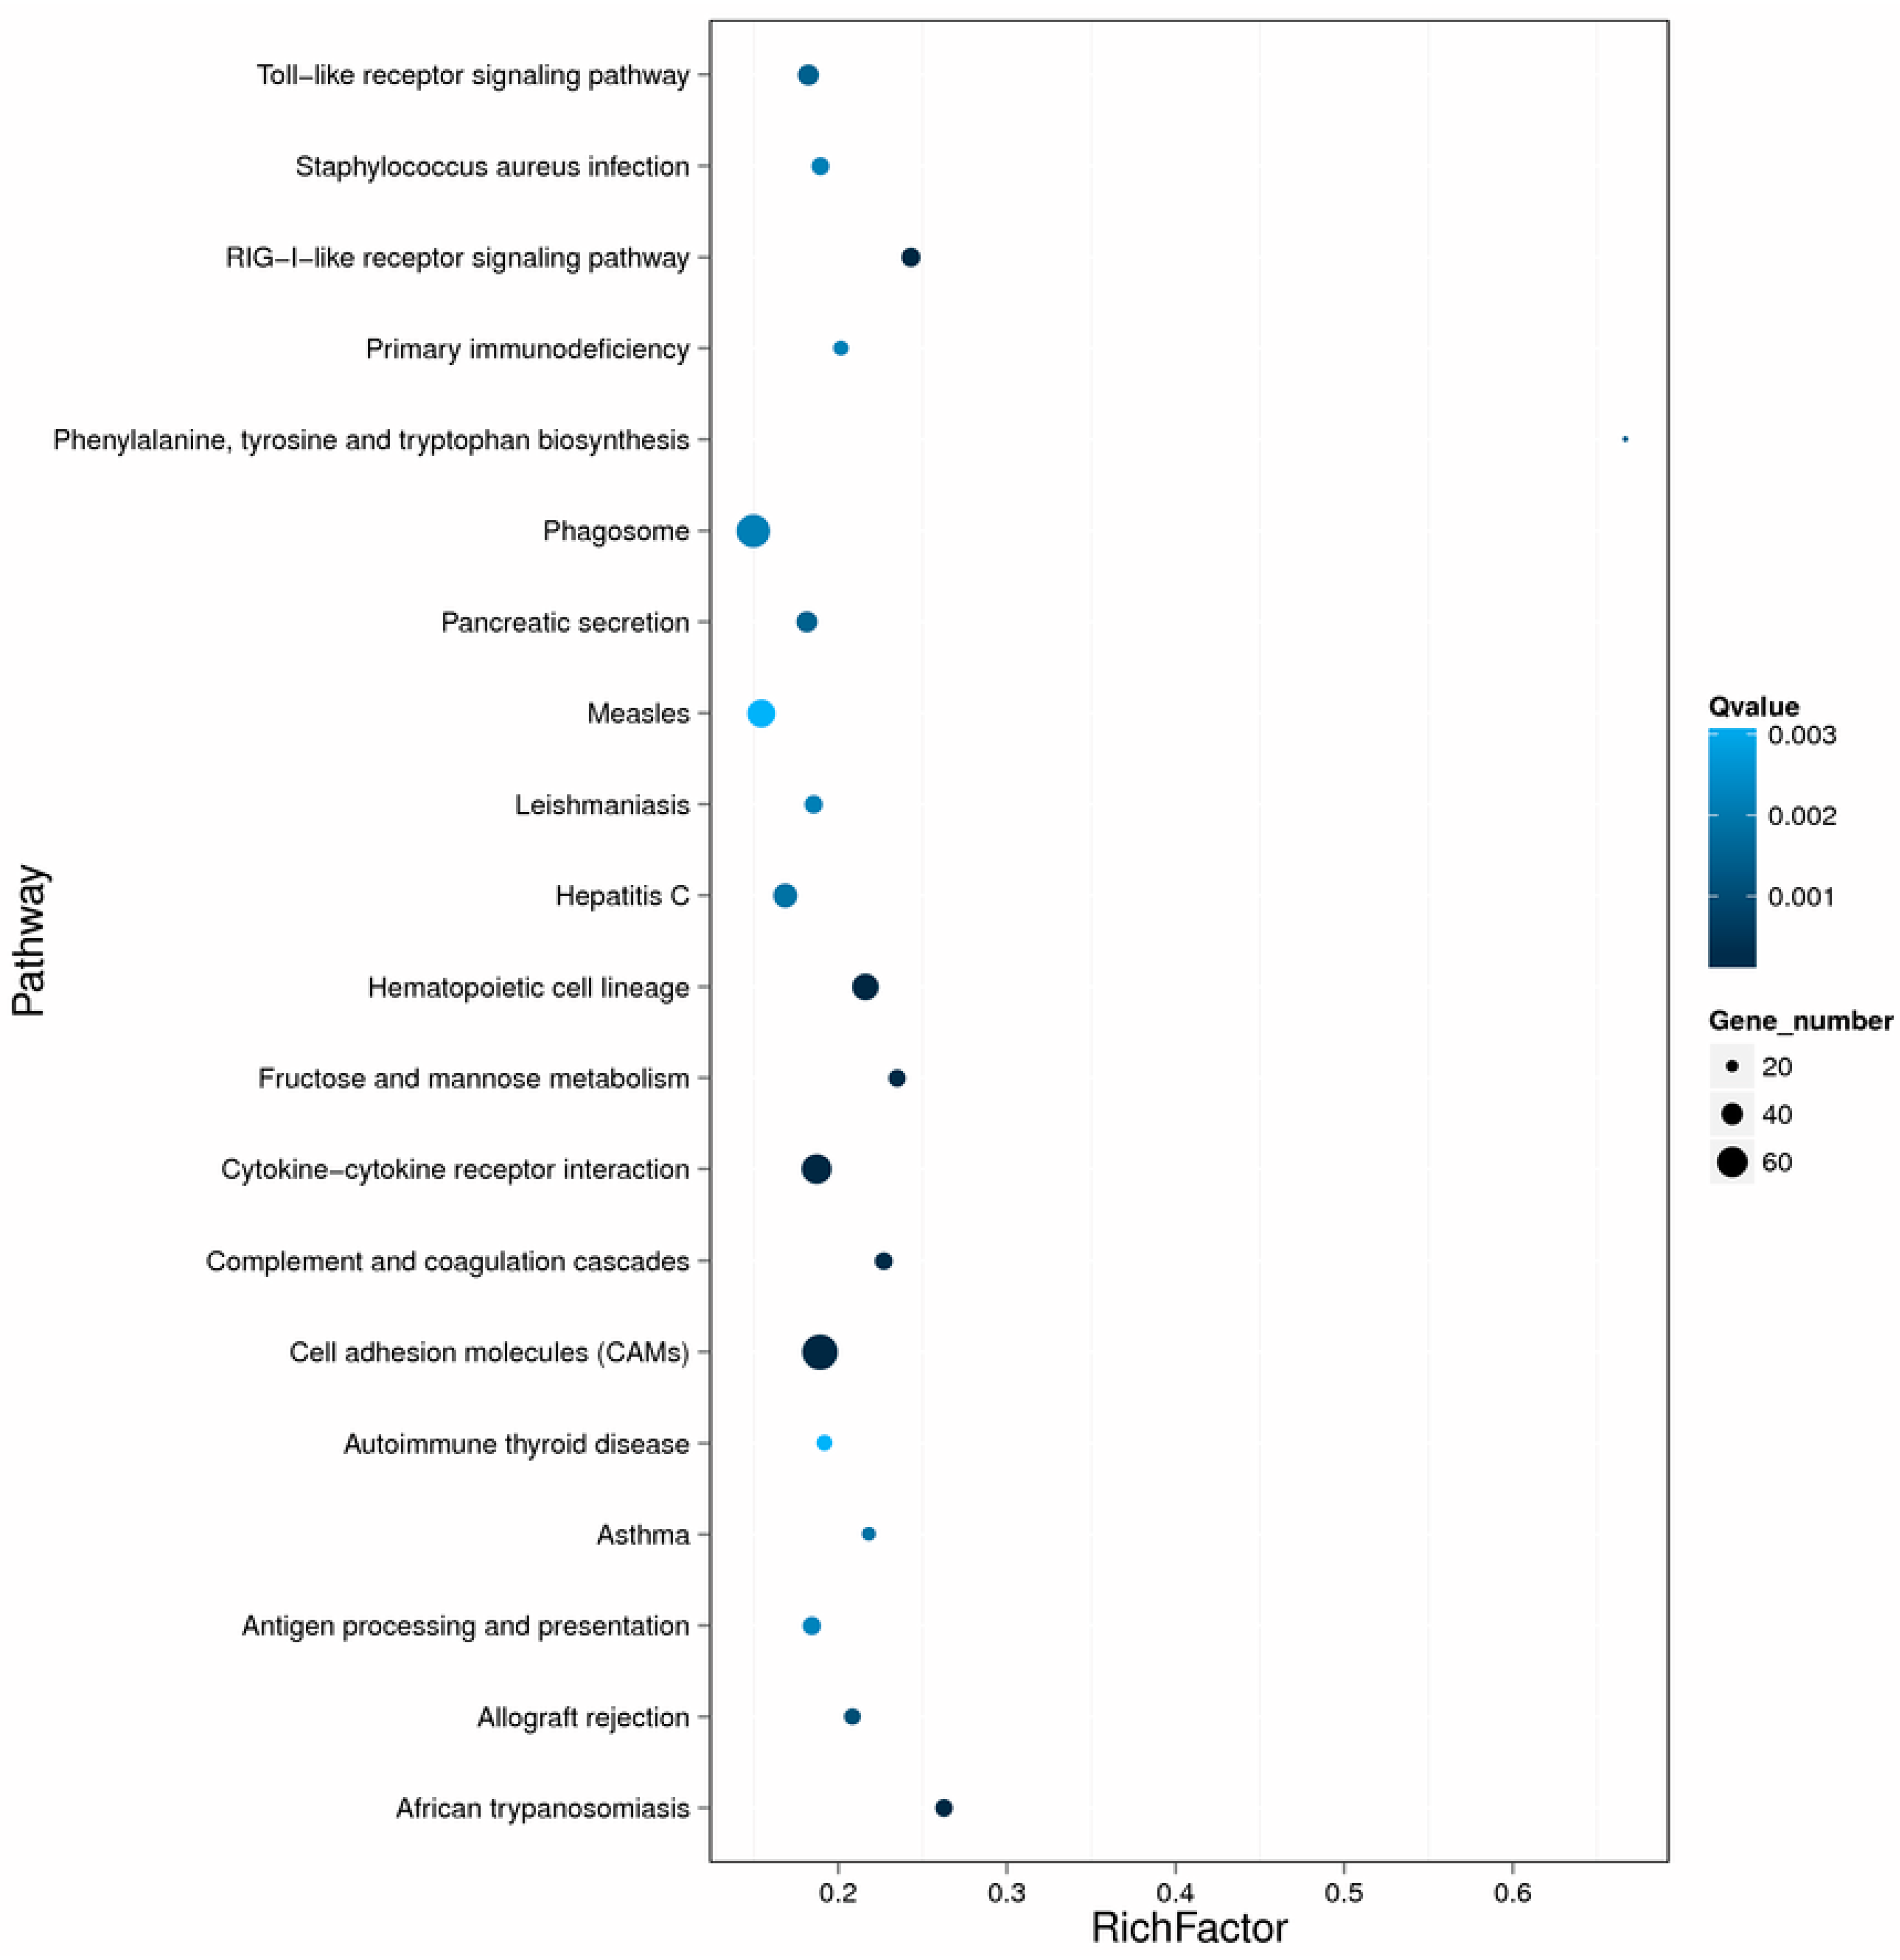
2.3. Differentially Expressed Genes after Nocardia seriolae Challenge
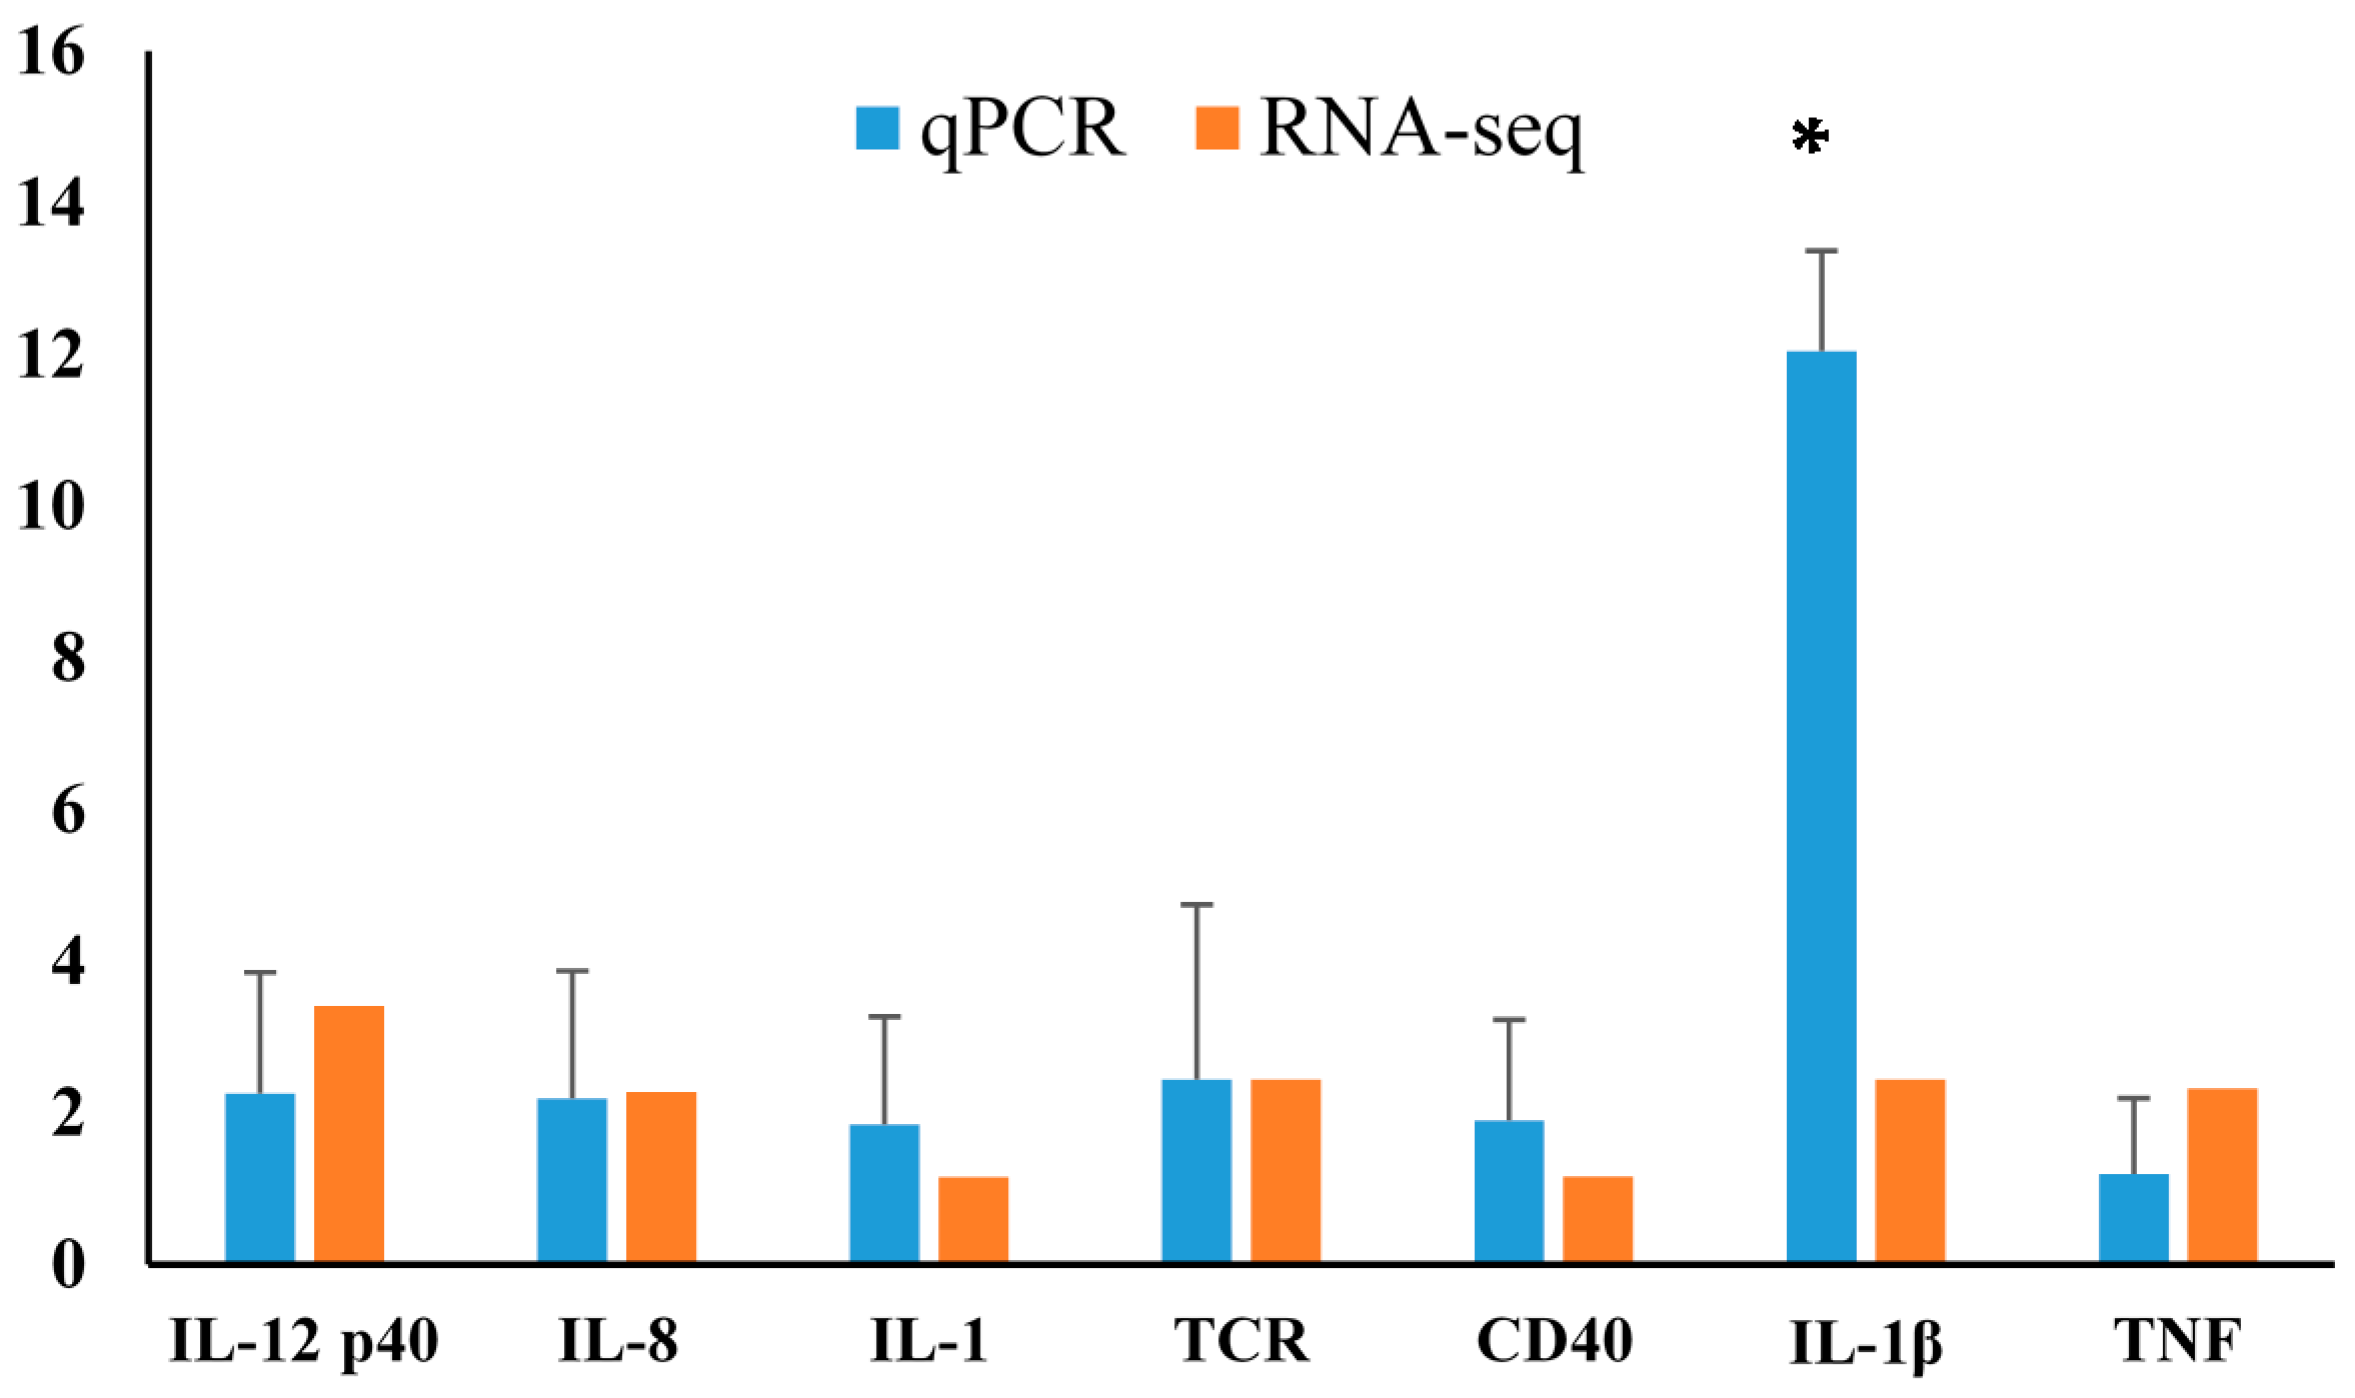
2.4. Differentially Expressed Gene Validation Using Real-Time PCR
3. Discussion
4. Materials and Methods
4.1. Animal Maintenance
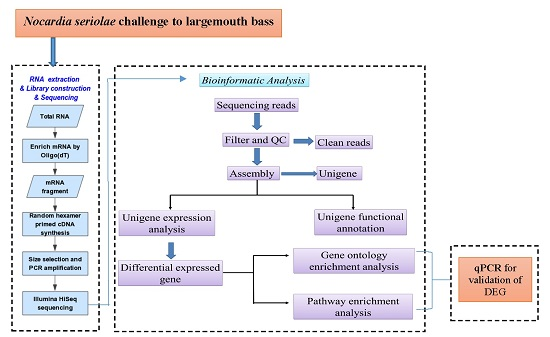
4.2. Isolation, Cultivation, and Challenge with Nocardia seriolae
4.3. Total RNA Extraction, Preparation of cDNA Library, and Sequencing
4.4. Filtering of Sequencing Reads
4.5. De Novo Transcriptome Assembly
4.6. Functional Unigene Annotation and Classification
4.7. Differentially Expressed Genes
4.8. Real-Time Polymerase Chain Reaction
4.9. Statistical Analyses
5. Conclusions
Supplementary Materials
Acknowledgments
Author Contributions
Conflicts of Interest
Abbreviations
| DGE | digital gene expression |
| Tgicl | is a pipeline for analysis of large Expressed Sequence Tags (EST) |
| NR | NCBI non-redundant protein |
| NT | NCBI nucleotide |
| COG | Clusters of Orthologous Groups |
| KEGG | Kyoto Encyclopedia of Genes and Genomes |
| ORF | open reading frame |
| KO | KEGG Orthology |
| CDS | coding region of protein |
| INDEL | insertion and deletion |
| HISAT | is a fast and sensitive spliced alignment program for mapping RNA-Seq reads |
| GATK | The Genome Analysis Toolkit |
| FPKM | fragments per kilobase of transcripts per million fragments mapped |
| RESM | is a software package for estimating gene and isoform expression levels from RNA-Seq data |
| FDR | False discovery rate |
| NLR | NOD-like receptors |
| TLR | Toll-like receptors |
| PAMP | Pathogen-associated molecular patterns |
| PRR | Pattern-recognition receptors |
| CLR | C-type lectin receptors |
| SRA | NCBI Sequence Read Archive |
| SSR | Simple Sequence Repeat |
| SNP | single nucleotide polymorphism |
References
- Camp, K.L.; Wolters, W.R.; Rice, C.D. Survivability and immune responses after challenge with Edwardsiella ictaluri in susceptible and resistant families of channel catfish, Ictalurus punctatus. Fish Shellfish Immunol. 2000, 10, 475–487. [Google Scholar] [CrossRef] [PubMed]
- Ellis, A.E. Innate host defense mechanisms of fish against viruses and bacteria. Dev. Comp. Immunol. 2001, 25, 827–839. [Google Scholar] [CrossRef]
- Gomez, G.D.; Balcazar, J.L. A review on the interactions between gut microbiota and innate immunity of fish. FEMS Immunol. Med. Microbiol. 2008, 52, 145–154. [Google Scholar] [CrossRef] [PubMed]
- Hegedus, Z.; Zakrzewska, A.; Agoston, V.C.; Ordas, A.; Racz, P.; Mink, M.; Spaink, H.P.; Meijer, A.H. Deep sequencing of the zebrafish transcriptome response to mycobacterium infection. Mol. Immunol. 2009, 46, 2918–2930. [Google Scholar] [CrossRef] [PubMed]
- Stockhammer, O.W.; Zakrzewska, A.; Hegedus, Z.; Spaink, H.P.; Meijer, A.H. Transcriptome profiling and functional analyses of the zebrafish embryonic innate immune response to Salmonella infection. J. Immunol. 2009, 182, 5641–5653. [Google Scholar] [CrossRef] [PubMed]
- Wang, Z.; Gerstein, M.; Snyder, M. RNA-Seq: A revolutionary tool for transcriptomics. Nat. Rev. Genet. 2009, 10, 57–63. [Google Scholar] [CrossRef] [PubMed]
- Anisimov, S.V. Serial Analysis of Gene Expression (SAGE): 13 years of application in research. Curr. Pharm. Biotechnol. 2008, 9, 338–350. [Google Scholar] [CrossRef] [PubMed]
- Dumrongphol, Y.; Hirota, T.; Kondo, H.; Aoki, T.; Hirono, I. Identification of novel genes in Japanese flounder (Paralichthys olivaceus) head kidney up-regulated after vaccination with Streptococcus iniae formalin-killed cells. Fish Shellfish Immunol. 2009, 26, 197–200. [Google Scholar] [CrossRef] [PubMed]
- Aoki, T.; Hirono, I.; Kondo, H.; Hikima, J.I.; Jung, T.S. Microarray technology is an effective tool for identifying genes related to the aquacultural improvement of Japanese flounder, Paralichthys olivaceus. Comp. Biochem. Phys. 2011, 6, 39–43. [Google Scholar] [CrossRef] [PubMed]
- Kariya, T.; Kubota, S.; Nakamura, Y.; Kira, K. Nocardial infection in cultured yellowtails (Seriola quinqueradiata and S. purpurascens) I. Bacteriological study. Fish. Pathol. 1968, 3, 16–23. (In Japanese) [Google Scholar] [CrossRef]
- Chen, S.C.; Lee, J.L.; Lai, C.C.; Gu, Y.W.; Wang, C.T.; Chang, H.Y.; Tsai, K.H. Nocardiosis in sea bass, Lateolabrax japonicus, in Taiwan. J. Fish. Dis. 2000, 23, 299–307. [Google Scholar] [CrossRef]
- Wang, G.L.; Yuan, S.P.; Jin, S. Nocardiosis in large yellow croaker, Larimichthys crocea (Richardson). J. Fish. Dis. 2005, 28, 339–345. [Google Scholar] [CrossRef] [PubMed]
- Kudo, T.; Hatai, K.; Seino, A. Nocardia seriolae sp. nov. Causing nocardiosis of cultured fish. Int. J. Syst. Bacteriol. 1988, 38, 173–178. [Google Scholar] [CrossRef]
- Huang, S.L.; Lai, K.C.; Su, S.C.; Shei, M.C.; Chen, S.N. Isolation and characterization of the pathogenic bacterium, Nocardia seriolae, from female broodstock of striped mullet (Mugil cephalus). J. Fish. Res. 2004, 12, 61–69. [Google Scholar]
- Wang, P.C.; Chen, S.D.; Tsai, M.A.; Weng, Y.J.; Chu, S.Y.; Chern, R.S.; Chen, S.C. Nocardia seriolae infection in the three striped tigerfish, Terapon jarbua (Forsskal). J. Fish. Dis. 2009, 32, 301–310. [Google Scholar] [CrossRef] [PubMed]
- Wang, G.L.; Xu, Y.J.; Jin, S.; Zhu, J.L.; Yuan, S.P. Nocardiosis in snakehead, Ophiocephalus argus Cantor. Aquaculture 2007, 271, 54–60. [Google Scholar] [CrossRef]
- Lü, A.J.; Hu, X.C.; Wang, Y.; Zhu, A.H.; Shen, L.L.; Tian, J.; Feng, Z.Z.; Feng, Z.J. Skin immune response in the zebrafish, Danio rerio (Hamilton), to Aeromonas hydrophila infection: A transcriptional profiling approach. J. Fish. Dis. 2015, 38, 137–150. [Google Scholar] [CrossRef] [PubMed]
- Zhang, X.; Wang, S.; Chen, S.; Chen, Y.; Liu, Y.; Shao, C.; Wang, Q.; Lu, Y.; Gong, G.; Ding, S.; et al. Transcriptome analysis revealed changes of multiple genes involved in immunity in Cynoglossus semilaevis during Vibrio anguillarum infection. Fish. Shellfish Immunol. 2015, 43, 209–218. [Google Scholar] [CrossRef] [PubMed]
- Huang, Y.; Huang, X.; Yan, Y.; Cai, J.; Ouyang, Z.; Cui, H.; Wang, P.; Qin, Q. Transcriptome analysis of orange-spotted grouper (Epinephelus coioides) spleen in response to Singapore grouper iridiovirus. BMC Genom. 2011, 12, 556. [Google Scholar] [CrossRef] [PubMed]
- Tran, N.T.; Gao, Z.X.; Zhao, H.H.; Yi, S.K.; Chen, B.X.; Zhao, Y.H.; Lin, L.; Liu, X.Q.; Wang, W.M. Transcriptome analysis and microsatellite discovery in the blunt snout bream (Megalobrama amblycephala) after challenge with Aeromonas hydrophila. Fish Shellfish Immunol. 2015, 45, 72–82. [Google Scholar] [CrossRef] [PubMed]
- Cárdenas, L.; Sánchez, R.; Gomez, D.; Fuenzalida, G.; Gallardo-Escárate, C.; Tanguy, A. Transcriptome analysis in Concholepas concholepas (Gastropoda, Muricidae): Mining and characterization of new genomic and molecular markers. Mar. Genom. 2011, 4, 197–205. [Google Scholar] [CrossRef] [PubMed]
- Chen, J.; Li, C.; Huang, R.; Du, F.; Liao, L.; Zhu, Z.; Wang, Y. Transcriptome analysis of head kidney in grass carp and discovery of immune-related genes. BMC Vet. Res. 2012, 8, 108. [Google Scholar] [CrossRef] [PubMed]
- Cui, J.; Wang, H.; Liu, S.; Qiu, X.; Jiang, Z.; Wang, X. Transcriptome analysis of the gill of Takifugu rubripes using Illumina sequencing for discovery of SNPs. Comp. Biochem. Phys. Part D: Genom. Proteom. 2014, 10, 44–51. [Google Scholar] [CrossRef] [PubMed]
- Wang, P.; Wang, J.; Su, Y.Q.; Mao, Y.; Zhang, J.S.; Wu, C.W.; Ke, Q.Z.; Han, K.H.; Zheng, W.Q.; Xu, N.D. Transcriptome analysis of the Larimichthys crocea liver in response to Cryptocaryon Irritans. Fish Shellfish Immunol. 2016, 48, 1–11. [Google Scholar] [CrossRef] [PubMed]
- Zhang, R.; Zhang, L.; Ye, X.; Tian, Y.Y.; Sun, C.F.; Lu, M.X.; Bai, J.J. Transcriptome profiling and digital gene expression analysis of Nile tilapia (Oreochromis niloticus) infected by Streptococcus agalactiae. Mol. Biol. Rep. 2013, 40, 5657–5668. [Google Scholar] [CrossRef] [PubMed]
- Zhu, J.; Li, C.; Ao, Q.; Tan, Y.; Luo, Y.; Guo, Y.; Lan, G.; Jiang, H.; Gan, X. Transcriptomic profiling revealed the signatures of acute immune response in tilapia (Oreochromis niloticus) following Streptococcus iniae challenge. Fish Shellfish Immunol. 2015, 46, 346–353. [Google Scholar] [CrossRef] [PubMed]
- Mu, Y.; Ding, F.; Cui, P.; Ao, J.; Hu, S.; Chen, X. Transcriptome and expression profiling analysis revealed changes of multiple signaling pathways involved in immunity in the large yellow croaker during Aeromonas hydrophila infection. BMC Genom. 2010, 11, 506. [Google Scholar] [CrossRef] [PubMed]
- Yu, S.; Mu, Y.; Ao, J.; Chen, X. Peroxiredoxin IV regulates pro-inflammatory responses in large yellow croaker (Pseudosciaena. crocea) and protects against bacterial challenge. J. Proteome Res. 2010, 9, 1424–1436. [Google Scholar] [CrossRef] [PubMed]
- Ao, J.; Mu, Y.; Xiang, L.X.; Fan, D.D.; Feng, M.; Zhang, S.; Shi, Q.; Zhu, L.Y.; Li, T.; Ding, Y.; et al. Genome Sequencing of the Perciform Fish Larimichthys crocea Provides Insights into Molecular and Genetic Mechanisms of Stress Adaptation. PLoS Genet. 2015, 11, e1005118. [Google Scholar] [CrossRef] [PubMed]
- Kinoshita, S.; Wang, N.; Inoue, H.; Maeyama, K.; Okamoto, K.; Nagai, K.; Kondo, H.; Hirono, I.; Asakawa, S.; Watabe, S. Deep sequencing of ESTs from nacreous and prismatic layer producing tissues and a screen for novel shell formation-related genes in the pearl oyster. PLoS ONE 2011, 6, e21238. [Google Scholar] [CrossRef] [PubMed]
- Zhao, X.; Wang, Q.; Jiao, Y.; Huang, R.; Deng, Y.; Wanh, H.; Du, X. Identification of genes potentially related to biomineralization and immunity by transcriptome analysis of pearl sac in pearl oyster Pinctada martensii. Mar. Biotechnol. 2012, 14, 730–739. [Google Scholar] [CrossRef] [PubMed]
- Zhao, Q.Y.; Wang, Y.; Kong, Y.M.; Luo, D.; Li, X.; Hao, P. Optimizing de novo transcriptome assembly from short-read RNA-Seq data: A comparative study. BMC Bioinform. 2011, 12, S2. [Google Scholar] [CrossRef] [PubMed]
- Vijay, N.; Poelstra, J.W.; Künstner, A.; Wolf, J.B.W. Challenges and strategies in transcriptome assembly and differential gene expression quantification. A comprehensive in-silico assessment of RNA-Seq experiments. Mol. Ecol. 2013, 22, 620–634. [Google Scholar] [CrossRef] [PubMed]
- Zhang, L.; Li, L.; Zhu, Y.; Zhang, G.; Guo, X. Transcriptome analysis reveals a rich gene set related to innate immunity in the eastern oyster (Crassostrea virginica). Mar. Biotechnol. 2014, 16, 17–33. [Google Scholar] [CrossRef] [PubMed]
- Wang, A.; Wang, Y.; Gu, Z.; Li, S.; Shi, Y.; Guo, X. Development of expressed sequence tags from the pearl oyster, Pinctada martensii dunker. Mar. Biotechnol. 2011, 13, 275–283. [Google Scholar] [CrossRef] [PubMed]
- Meyer, E.; Aglyamova, G.V.; Wang, S.; Buchanan-carter, J.; Abrego, D.; Colbourne, J.K.; Willis, B.L.; Matz, M.V. Sequencing and de novo analysis of a coral larval transcriptome using 454 GSFlx. BMC Genom. 2009, 10, 219. [Google Scholar] [CrossRef] [PubMed]
- Chu, S.L.; Weng, C.F.; Hsiao, C.D.; Hwang, P.P.; Chen, Y.C.; Ho, J.M.; Lee, S.J. Profile analysis of expressed sequence tags derived from the ovary of tilapia, Oreochromis mossambicus. Aquaculture 2006, 251, 537–548. [Google Scholar] [CrossRef]
- Dong, B.; Xiang, J.H. Discovery of genes involved in defense/immunity functions in a haemocytes cDNA library from Fenneropenaeus chinensis by ESTs annotation. Aquaculture 2007, 272, 208–215. [Google Scholar] [CrossRef]
- Novaes, E.; Drost, D.R.; Farmerie, W.G.; Pappas, G.J.; Grattapaglia, D.; Sederoff, R.R.; Kirst, M. High-throughput gene and SNP discovery in Eucalyptus grandis, an uncharacterized genome. BMC Genom. 2008, 9, 312. [Google Scholar] [CrossRef] [PubMed]
- Floege, J.; Luscher, B.; Muller-Newen, G. Cytokines and inflammation. Eur. J. Cell Biol. 2012, 91, 427. [Google Scholar] [CrossRef] [PubMed]
- Banyer, J.L.; Hamilton, N.H.R.; Ramshaw, I.A.; Ramsay, A.J. Cytokines in innate and adaptive immunity. Rev. Immunogenet. 2000, 2, 359–373. [Google Scholar] [PubMed]
- Covello, J.M.; Bird, S.; Morrison, R.N.; Battaglene, S.C.; Secombes, C.J.; Nowak, B.F. Cloning and expression analysis of three striped trumpeter (Latris lineata) pro-inflammatory cytokines, TNF-α, IL-1β and IL-8, in response to infection by the ectoparasitic, Chondracanthus goldsmidi. Fish Shellfish Immunol. 2009, 26, 773–786. [Google Scholar] [CrossRef] [PubMed]
- Laing, K.J.; Secombes, C.J. Chemokines. Dev. Comp. Immunol. 2004, 28, 443–460. [Google Scholar] [CrossRef] [PubMed]
- Kawai, T.; Akira, S. The roles of TLRs, RLRs and NLRs in pathogen recognition. Int. Immunol. 2009, 21, 317–337. [Google Scholar] [CrossRef] [PubMed]
- Geijtenbeek, T.B.; Gringhuis, S.I. Signalling through C-type lectin receptors: Shaping immune responses. Nat. Rev. 2009, 9, 465–479. [Google Scholar] [CrossRef] [PubMed]
- Mogensen, T.H. Pathogen recognition and inflammatory signaling in innate immune defenses. Clin. Microbiol. Rev. 2009, 22, 240–273. [Google Scholar] [CrossRef] [PubMed]
- Tanekhy, M.; Matsuda, S.; Itano, T.; Kawakami, H.; Kono, T.; Sakai, M. Expression of cytokine genes in head kidney and spleen cells of Japanese flounder (Paralichthys olivaceus) infected with Nocardia seriolae. Vet. Immunol. Immunopathol. 2010, 134, 178–183. [Google Scholar] [CrossRef] [PubMed]
- Hessle, C.C.; Andersson, B.; Wold, A.E. Gram-positive and Gram-negative bacteria elicit different patterns of pro-inflammatory cytokines in human monocytes. Cytokine 2005, 30, 311–318. [Google Scholar] [CrossRef] [PubMed]
- Haan, C.; Is’harc, H.; Hermanns, H.M.; Schmitz-Van De Leur, H.; Kerr, I.M.; Heinrich, P.C.; Grötzinger, J.; Behrmann, I. Mapping of a region within the N terminus of JAK1 involved in cytokine receptor interaction. J. Biol. Chem. 2001, 276, 37451–37458. [Google Scholar] [CrossRef] [PubMed]
- Flex, E.; Petrangeli, V.; Stella, L.; Chiaretti, S.; Hornakova, T.; Knoops, L.; Ariola, C.; Fodale, V.; Clappier, E.; Paoloni, F.; et al. Somatically acquired JAK1 mutations in adult acute lymphoblastic leukemia. J. Exp. Med. 2008, 205, 751–758. [Google Scholar] [CrossRef] [PubMed]
- Schindler, C.; Plumlee, C. Interferons pen the JAK-STAT pathway. Semin. Cell Dev. Biol. 2008, 19, 311–318. [Google Scholar] [CrossRef] [PubMed]
- Shuai, K.; Liu, B. Regulation of JAK-STAT signalling in the immune system. Nat. Rev. Immunol. 2003, 3, 900–911. [Google Scholar] [CrossRef] [PubMed]
- Shimahara, Y.; Huang, Y.F.; Tsai, M.A.; Wang, P.C.; Yoshida, T.; Lee, J.L.; Chen, S.C. Genotypic and phonotypic analysis of fish pathogen, Nocardia seriolae, isolated in Taiwan. Aquaculture 2009, 294, 165–171. [Google Scholar] [CrossRef]
- Cock, P.; Fields, C.J.; Goto, N.; Heuer, M.L.; Rice, P.M. The Sanger FASTQ file format for sequences with quality scores, and the Solexa/Illumina FASTQ variants. Nucleic Acids Res. 2010, 38, 1767–1771. [Google Scholar] [CrossRef] [PubMed]
- Haas, B.J.; Papanicolaou, A.; Yassour, M.; Grabherr, M.; Blood, P.D.; Bowden, J.; Couger, M.B.; Eccles, D.; Li, B.; Lieber, M.; et al. De novo transcript sequence reconstruction from RNA-Seq using the Trinity platform for reference generation and analysis. Nat. Protoc. 2013, 8, 1494–1512. [Google Scholar] [CrossRef] [PubMed]
- NCBI. Available online: http://www.ncbi.nlm.nih.gov/ (accessed on 22 December 2015).
- Gene Ontology Consortium. Available online: http://www.geneontology.org/ (accessed on 27 December 2015).
- COG. Available online: http://www.ncbi.nlm.nih.gov/COG/ (accessed on 27 December 2015).
- Kyoto Encyclopedia of Genes and Genomes. Available online: http://www.genome.jp/kegg/ (accessed on 28 December 2015).
- Camacho, C.; Coulouris, G.; Avagyan, V.; Ma, N.; Papadopoulos, J.; Bealer, K.; Madden, T.L. BLAST+: Architecture and applications. BMC Bioinform. 2009, 10, 421. [Google Scholar] [CrossRef] [PubMed]
- Iseli, C.; Jongeneel, C.V.; Bucher, P. ESTScan: A program for detecting, evaluating, and reconstructing potential coding regions in EST sequences. In Proceedings of the International Conference on Intelligent Systems for Molecular Biology, San Diego, CA, USA, 23 August 1999; pp. 138–148.
- Bowtie. Available online: http://bowtie-bio.sourceforge.net (accessed on 28 December 2015).
- Langmead, B.; Salzberg, S.L. Fast gapped-read alignment with Bowtie 2. Nat. Methods 2012, 9, 357–359. [Google Scholar] [CrossRef] [PubMed]
- Li, B.; Dewey, C.N. RSEM: Accurate transcript quantification from RNA-Seq data with or without a reference genome. BMC Bioinform. 2011, 12, 323. [Google Scholar] [CrossRef] [PubMed]
- Livak, K.J.; Schmittgen, T.D. Analysis of relative gene expression data using real time quantitative PCR and the 2−∆∆Ct method. Methods 2001, 25, 402–408. [Google Scholar] [CrossRef] [PubMed]


| Name | Description | Fold Change | Change |
|---|---|---|---|
| RIG I like receptor | |||
| trim25 | Tripartite motif-containing protein 25 | 1.32 | Up |
| dhx58 | ATP-dependent RNA helicase dhx58 | 3.41 | Up |
| ddx3x | ATP-dependent RNA helicase ddx3x | 6.28 | Up |
| ikbke | Inhibitor of nuclear factor κ-B kinase subunit epsilon | 2.54 | Up |
| ikbkg | Inhibitor of nuclear factor κ-B kinase subunit γ | 2.87 | Up |
| irf3 | Interferon regulatory factor 3 | 2.50 | Up |
| irf7 | Interferon regulatory factor 7 | 1.10 | Up |
| casp8 | Caspase 8 | 1.35 | Up |
| casp10 | Caspase 10 | 1.08 | Up |
| ikkβ | Inhibitor of nuclear factor κ-b kinase subunit β | −1.62 | Down |
| traf6 | TNF receptor-associated factor 6 | 3.11 | Up |
| p38 | p38 MAP kinase | −8.64 | Down |
| il-8 | Interleukin-8 | 2.27 | Up |
| ip-10 | Chemokine (c-x-c motif) 10 | 2.32 | Up |
| tnf-α | Tumor necrosis factor superfamily, member 2 | 2.32 | Up |
| il-12 | Interleukin-12a | 3.41 | Up |
| lbp | Lipopolysaccharide-binding protein | 2.94 | Up |
| casp8 | Caspase 8 | 1.35 | Up |
| rip1 | Receptor-interacting serine/threonine-protein kinase 1 | 1.31 | Up |
| ctsk | Cathepsin K | −11.52 | Down |
| tlr-3 | Toll-like receptor 3 | 1.16 | Up |
| ifnar1 | Interferon receptor 1 | 1.67 | Up |
| stat1 | Signal transducer and activator of transcription 1 | 2.38 | Up |
| il1b | Interleukin 1, β | 2.44 | Up |
| rantes | Chemokine (c-c motif) 5 | 2.03 | Up |
| cd40 | Tumor necrosis factor receptor superfamily, member 5 | 1.15 | Up |
| cd86 | cd86 antigen | −1.22 | Down |
| Cytokine-cytokine receptor interaction | |||
| cxcl7 | Platelet basic protein | −1.51 | Down |
| cxcl10 | Chemokine (c-x-c motif) 10 | 2.27 | Up |
| cxcl13 | Chemokine (c-x-c motif) 13 | 2.27 | Up |
| cxcl14 | Chemokine (c-x-c motif) 14 | −2.59 | Down |
| il8rb | Interleukin 8 receptor, β | −1.16 | Down |
| il8ra | interleukin 8 receptor, α | −1.16 | Down |
| cxcr3 | Chemokine (c-x-c receptor) type 3 | 1.13 | Up |
| xcr1 | Chemokine xc receptor 1 | 3.82 | Up |
| ccl20 | Chemokine (c-c motif) 20 | 5.16 | Up |
| ccl25 | Chemokine (c-c motif) 25 | −1.17 | Down |
| ccl19 | Chemokine (c-c motif) 19 | 5.16 | Up |
| ccl21 | Chemokine (c-c motif) 21 | −1.17 | Down |
| ccl5 | Chemokine (c-c motif) 5 | 2.03 | Up |
| ccr3 | Chemokine (c-c receptor) type 3 | 3.82 | Up |
| il6r | Interleukin 6 receptor | −2.11 | Down |
| il11ra | Interleukin 11 receptor α | 4.20 | Up |
| csfr | Colony-stimulating factor receptor (granulocyte) | 1.76 | Up |
| il13ra1 | Interleukin 13 receptor, α-1 | 2.91 | Up |
| il12rb2 | Interleukin 12 receptor, β-2 | 1.76 | Up |
| il23r | Interleukin 23, receptor | 1.76 | Up |
| csf2ra | Granulocyte-macrophage colony-stimulating factor receptor α | 2.91 | Up |
| il1ra | Interleukin 1 receptor, α | 1.15 | Up |
| il21r | Interleukin 21, receptor | −2.67 | Down |
| epor | Erythropoietin receptor | −1.85 | Down |
| ghr | Growth hormone receptor | −9.49 | Down |
| mpl | Thrombopoietin receptor | −1.26 | Down |
| flt1 | FMS-like tyrosine kinase 1 | 1.18 | Up |
| met | Proto-oncogene tyrosine-protein kinase met | −2.17 | Down |
| egf | Epidermal growth factor | −1.07 | Down |
| egfr | Epidermal growth factor receptor | −1.64 | Down |
| csf1r | Macrophage colony-stimulating factor 1 receptor | 1.80 | Up |
| ifnar1 | Interferon receptor, 1 | 1.67 | Up |
| ifnar2 | Interferon receptor, 2 | 1.52 | Up |
| il10ra | Interleukin 10 receptor, α | 4.20 | Up |
| il10rb | Interleukin 10 receptor, β | −1.50 | Down |
| tnfsf11b | Tumor necrosis factor receptor superfamily, member 11B | 1.80 | Up |
| tnfsf12 | Tumor necrosis factor ligand superfamily, member 12 | −1.10 | Down |
| Tnfb | Tumor necrosis factor b (TNF superfamily, member 2) | 2.33 | Up |
| tnfsf14 | Tumor necrosis factor (receptor) superfamily, member 14 | 1.20 | Up |
| tnfsf6b | Tumor necrosis factor (receptor) superfamily, member 6b | 1.80 | Up |
| faslg | Tumor necrosis factor (ligand) superfamily, member 6 | 1.13 | Up |
| cd40 | Tumor necrosis factor (receptor) superfamily, member 5 | 1.15 | Up |
| tnfsf13b | Tumor necrosis factor (ligand) superfamily, member 13B | −1.19 | Down |
| tgfbr2 | TGF-β receptor type-2 | −2.10 | Down |
| Antigen processing and presentation | |||
| psme1 | Proteasome activator subunit 1 | 1.57 | Up |
| hsp70 | Heat shock 70 kDa protein | 4.01 | Up |
| hsp90 | Molecular chaperone HtpG | 2.00 | Up |
| tap1/2 | ATP-binding cassette, subfamily b (MDR/TAP), member 2 | 2.72 | Up |
| tapbp | Tap binding protein (tapasin) | 2.46 | Up |
| pdia3 | Protein disulfide isomerase family a, member 3 | 10.67 | Up |
| mhci | Major histocompatibility complex, class I | 5.19 | Up |
| b2m | β-2-microglobulin | 1.25 | Up |
| mhcii | Major histocompatibility complex, class II | 1.99 | Up |
| ciita | Class II, major histocompatibility complex, transactivator | 1.74 | Up |
| tcr-α | T cell receptor α chain v region | −9.97 | Down |
| Natural Killer Cell Mediated Cytotoxity | |||
| cd48 | cd48 antigen | 2.29 | Up |
| trailr | Tumor necrosis factor (receptor) superfamily, member 10 | −1.02 | Down |
| prf1 | Perforin 1 | 9.91 | Up |
| grb | Granzyme B | −1.74 | Down |
| igg | Immunoglobulin heavy chain g | 5.30 | Up |
| fcγr3 | Low affinity immunoglobulin γ Fc region receptor III | 1.59 | Up |
| fasl | Tumor necrosis factor (ligand) superfamily, member 6 | 1.13 | Up |
| shp-2 | Tyrosine-protein phosphatase non-receptor type 11 | 9.78 | Up |
| dap-12 | Tyro protein tyrosine kinase binding protein | −2.26 | Down |
| vav1 | Guanine nucleotide exchange factor vav | 1.24 | Up |
| 3bp2 | sh3-domain binding protein 2 | 9.78 | Up |
| slp-76 | Lymphocyte cytosolic protein 2 | −3.12 | Down |
| shc1 | SHC-transforming protein 1 | 9.78 | Up |
| can | Serine/threonine-protein phosphatase 2B catalytic subunit | 1.58 | Up |
| pkc | Classical protein kinase c α type | 1.0 | Up |
| Name | Sequence | Target Gene | Application |
|---|---|---|---|
| LMBIL-12 F1Q | TCTTCCATCCTTGTGGTCTTCC | IL-12p40 | qPCR |
| LMBIL-12 R1Q | CAGTTCCAGGTCAAAGTGGTC | ||
| LMBIL-8 F1Q | GAGCCATTTTTCCTGGTGACT | IL-8 | |
| LMBIL-8 R1Q | TCCTCATTGGTGCTGAAAGATC | ||
| LMBIL-1 F1Q | CAAGATGCCTAAGGGACTGGA | IL-1 | |
| LMBIL-1 R1Q | AGGTGAACTTTGCGGTTCTC | ||
| LMBTCR F1Q | ATCATCTTTGGAAGTGGAACC | TCR | |
| LMBTCR R1Q | GATGTTGAAGACGACGGTCTT | ||
| LMBCD40 F1Q | TACAAGTGAAACATGGGGCAAC | CD40 | |
| LMBCD40 R1Q | TGATGAAGAGTCCACCTTACCG | ||
| LMBβ-Actin375F | CCACCACAGCCGAGAGGGAA | β-actin | |
| LMBβ-Actin375R | TCATGGTGGATGGGGCCAGG | ||
| LMBIL-1βF | TTGCCATAGAGAGGTTTA | IL-1β | |
| LMBIL-1βR | ACACTATATGCTCTTCCA | ||
| LMBTNFα-F | CTAGTGAAGAACCAGATTGT | TNF-α | |
| LMBTNFα-R | AGGAGACTCTGAACGATG |
© 2016 by the authors; licensee MDPI, Basel, Switzerland. This article is an open access article distributed under the terms and conditions of the Creative Commons Attribution (CC-BY) license (http://creativecommons.org/licenses/by/4.0/).
Share and Cite
Byadgi, O.; Chen, C.-W.; Wang, P.-C.; Tsai, M.-A.; Chen, S.-C. De Novo Transcriptome Analysis of Differential Functional Gene Expression in Largemouth Bass (Micropterus salmoides) after Challenge with Nocardia seriolae. Int. J. Mol. Sci. 2016, 17, 1315. https://doi.org/10.3390/ijms17081315
Byadgi O, Chen C-W, Wang P-C, Tsai M-A, Chen S-C. De Novo Transcriptome Analysis of Differential Functional Gene Expression in Largemouth Bass (Micropterus salmoides) after Challenge with Nocardia seriolae. International Journal of Molecular Sciences. 2016; 17(8):1315. https://doi.org/10.3390/ijms17081315
Chicago/Turabian StyleByadgi, Omkar, Chi-Wen Chen, Pei-Chyi Wang, Ming-An Tsai, and Shih-Chu Chen. 2016. "De Novo Transcriptome Analysis of Differential Functional Gene Expression in Largemouth Bass (Micropterus salmoides) after Challenge with Nocardia seriolae" International Journal of Molecular Sciences 17, no. 8: 1315. https://doi.org/10.3390/ijms17081315
APA StyleByadgi, O., Chen, C.-W., Wang, P.-C., Tsai, M.-A., & Chen, S.-C. (2016). De Novo Transcriptome Analysis of Differential Functional Gene Expression in Largemouth Bass (Micropterus salmoides) after Challenge with Nocardia seriolae. International Journal of Molecular Sciences, 17(8), 1315. https://doi.org/10.3390/ijms17081315