
Membrane Affinity of Platensimycin and Its Dialkylamine Analogs

Abstract
:
1. Introduction

2. Results
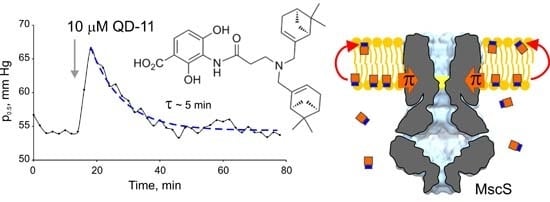
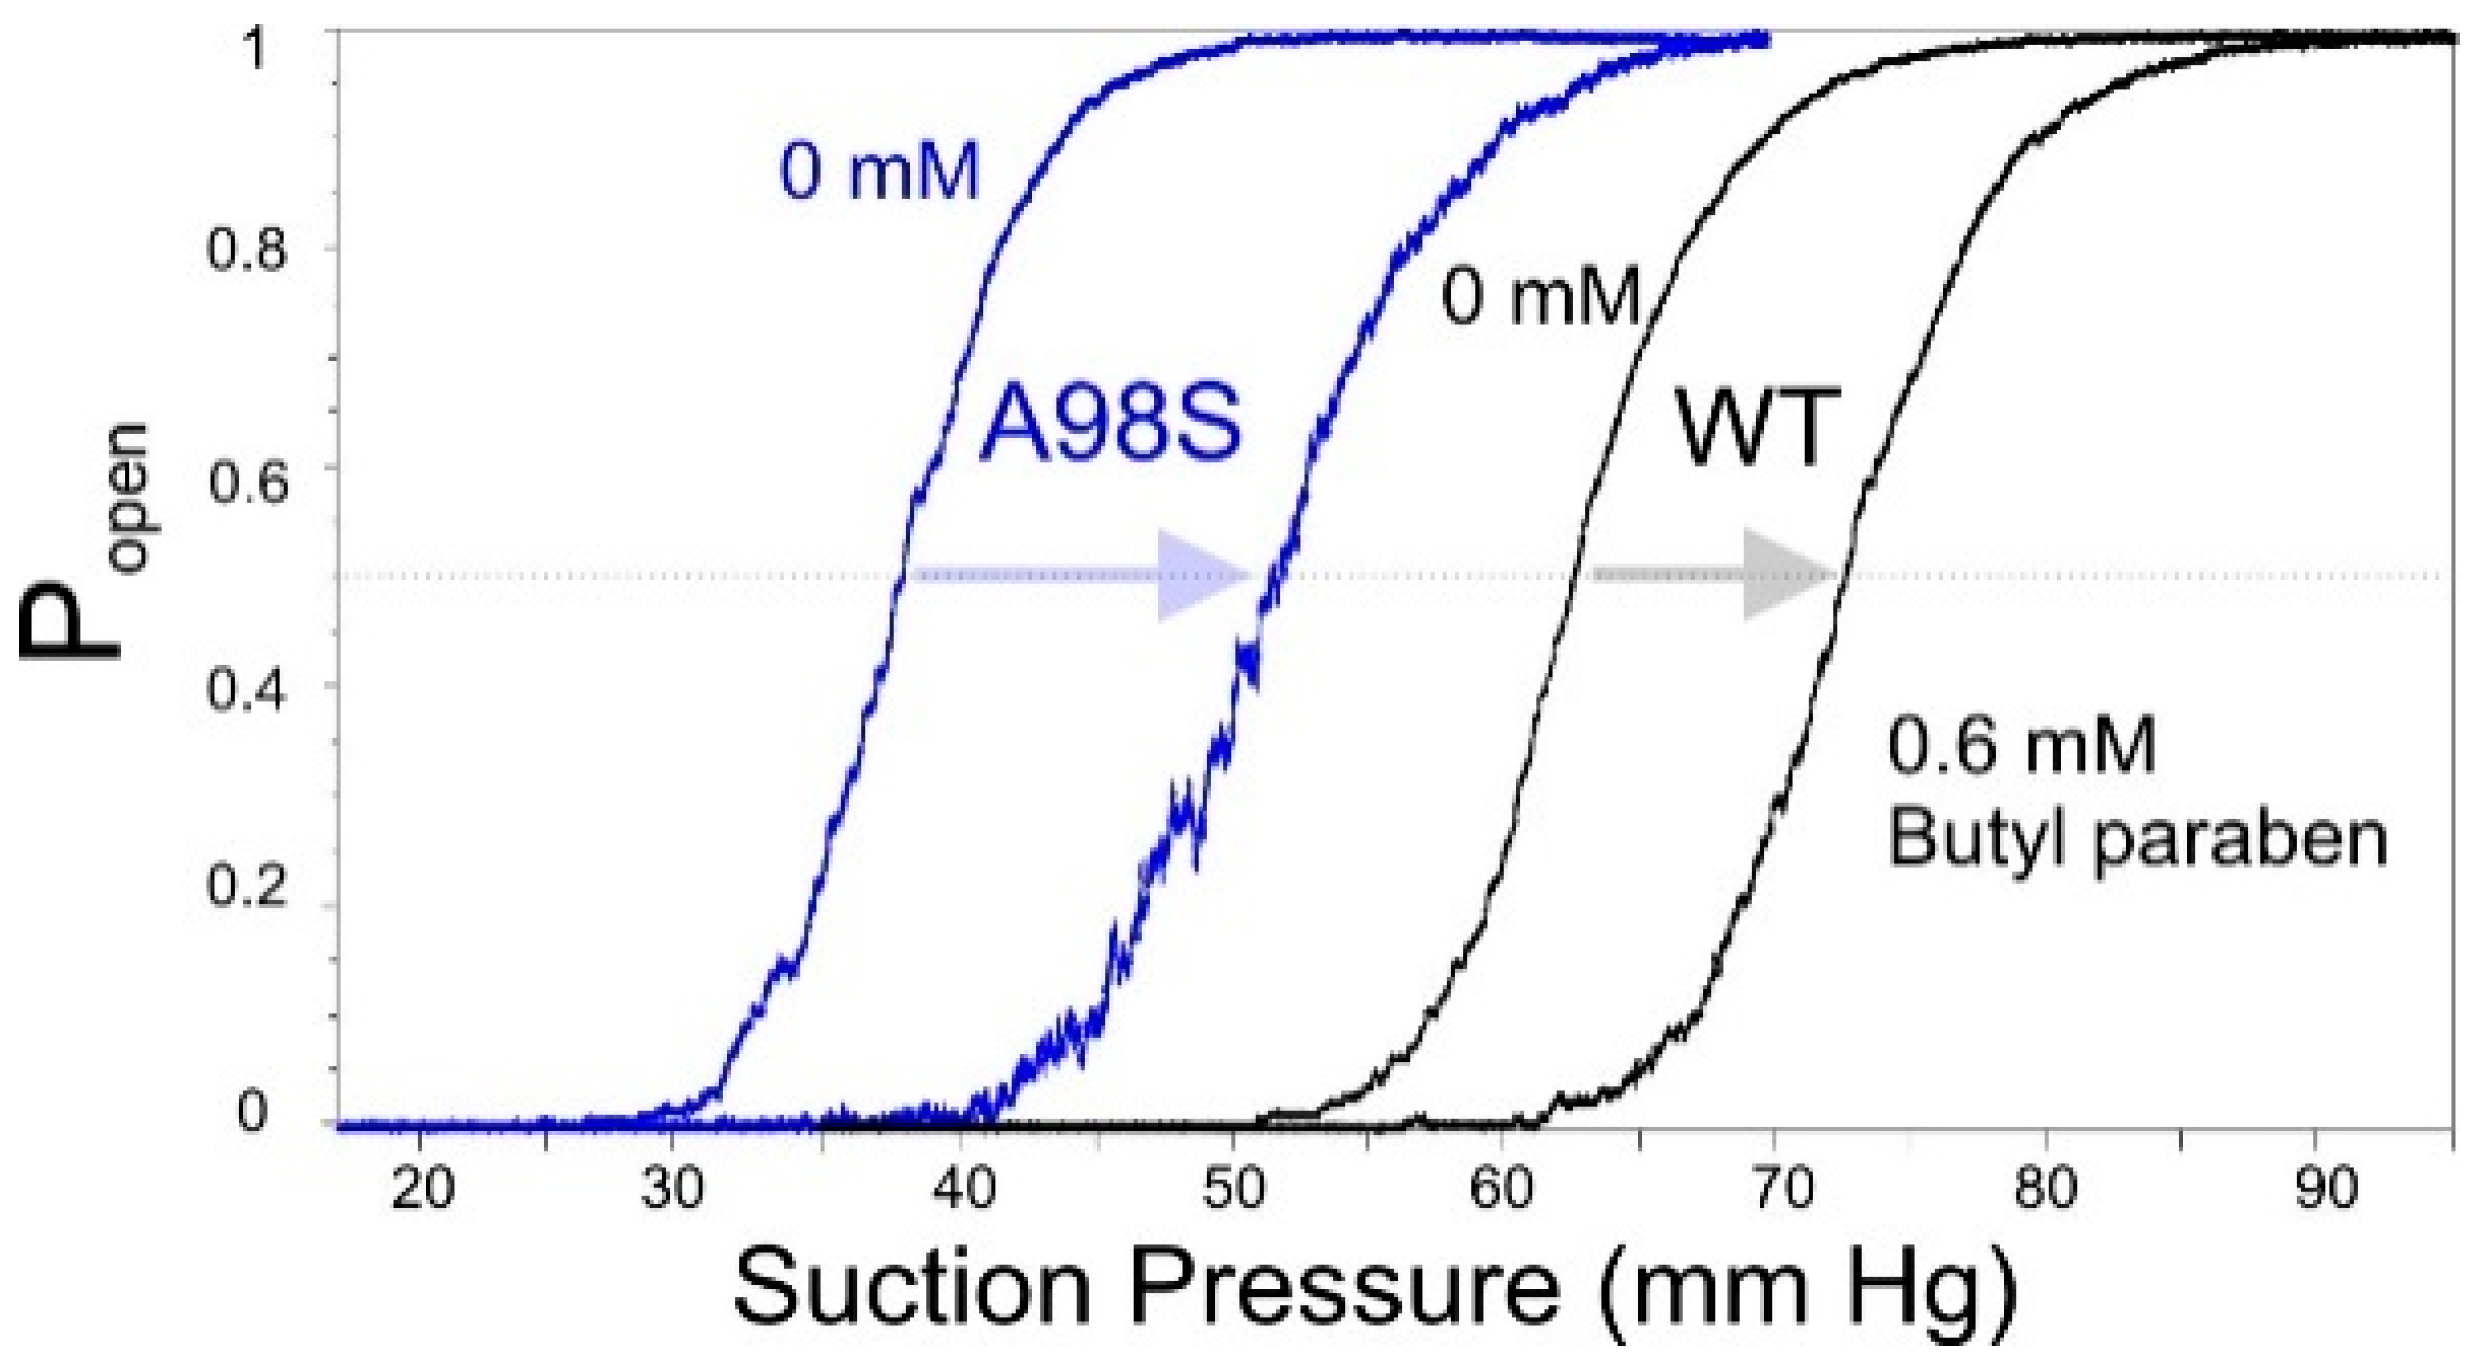
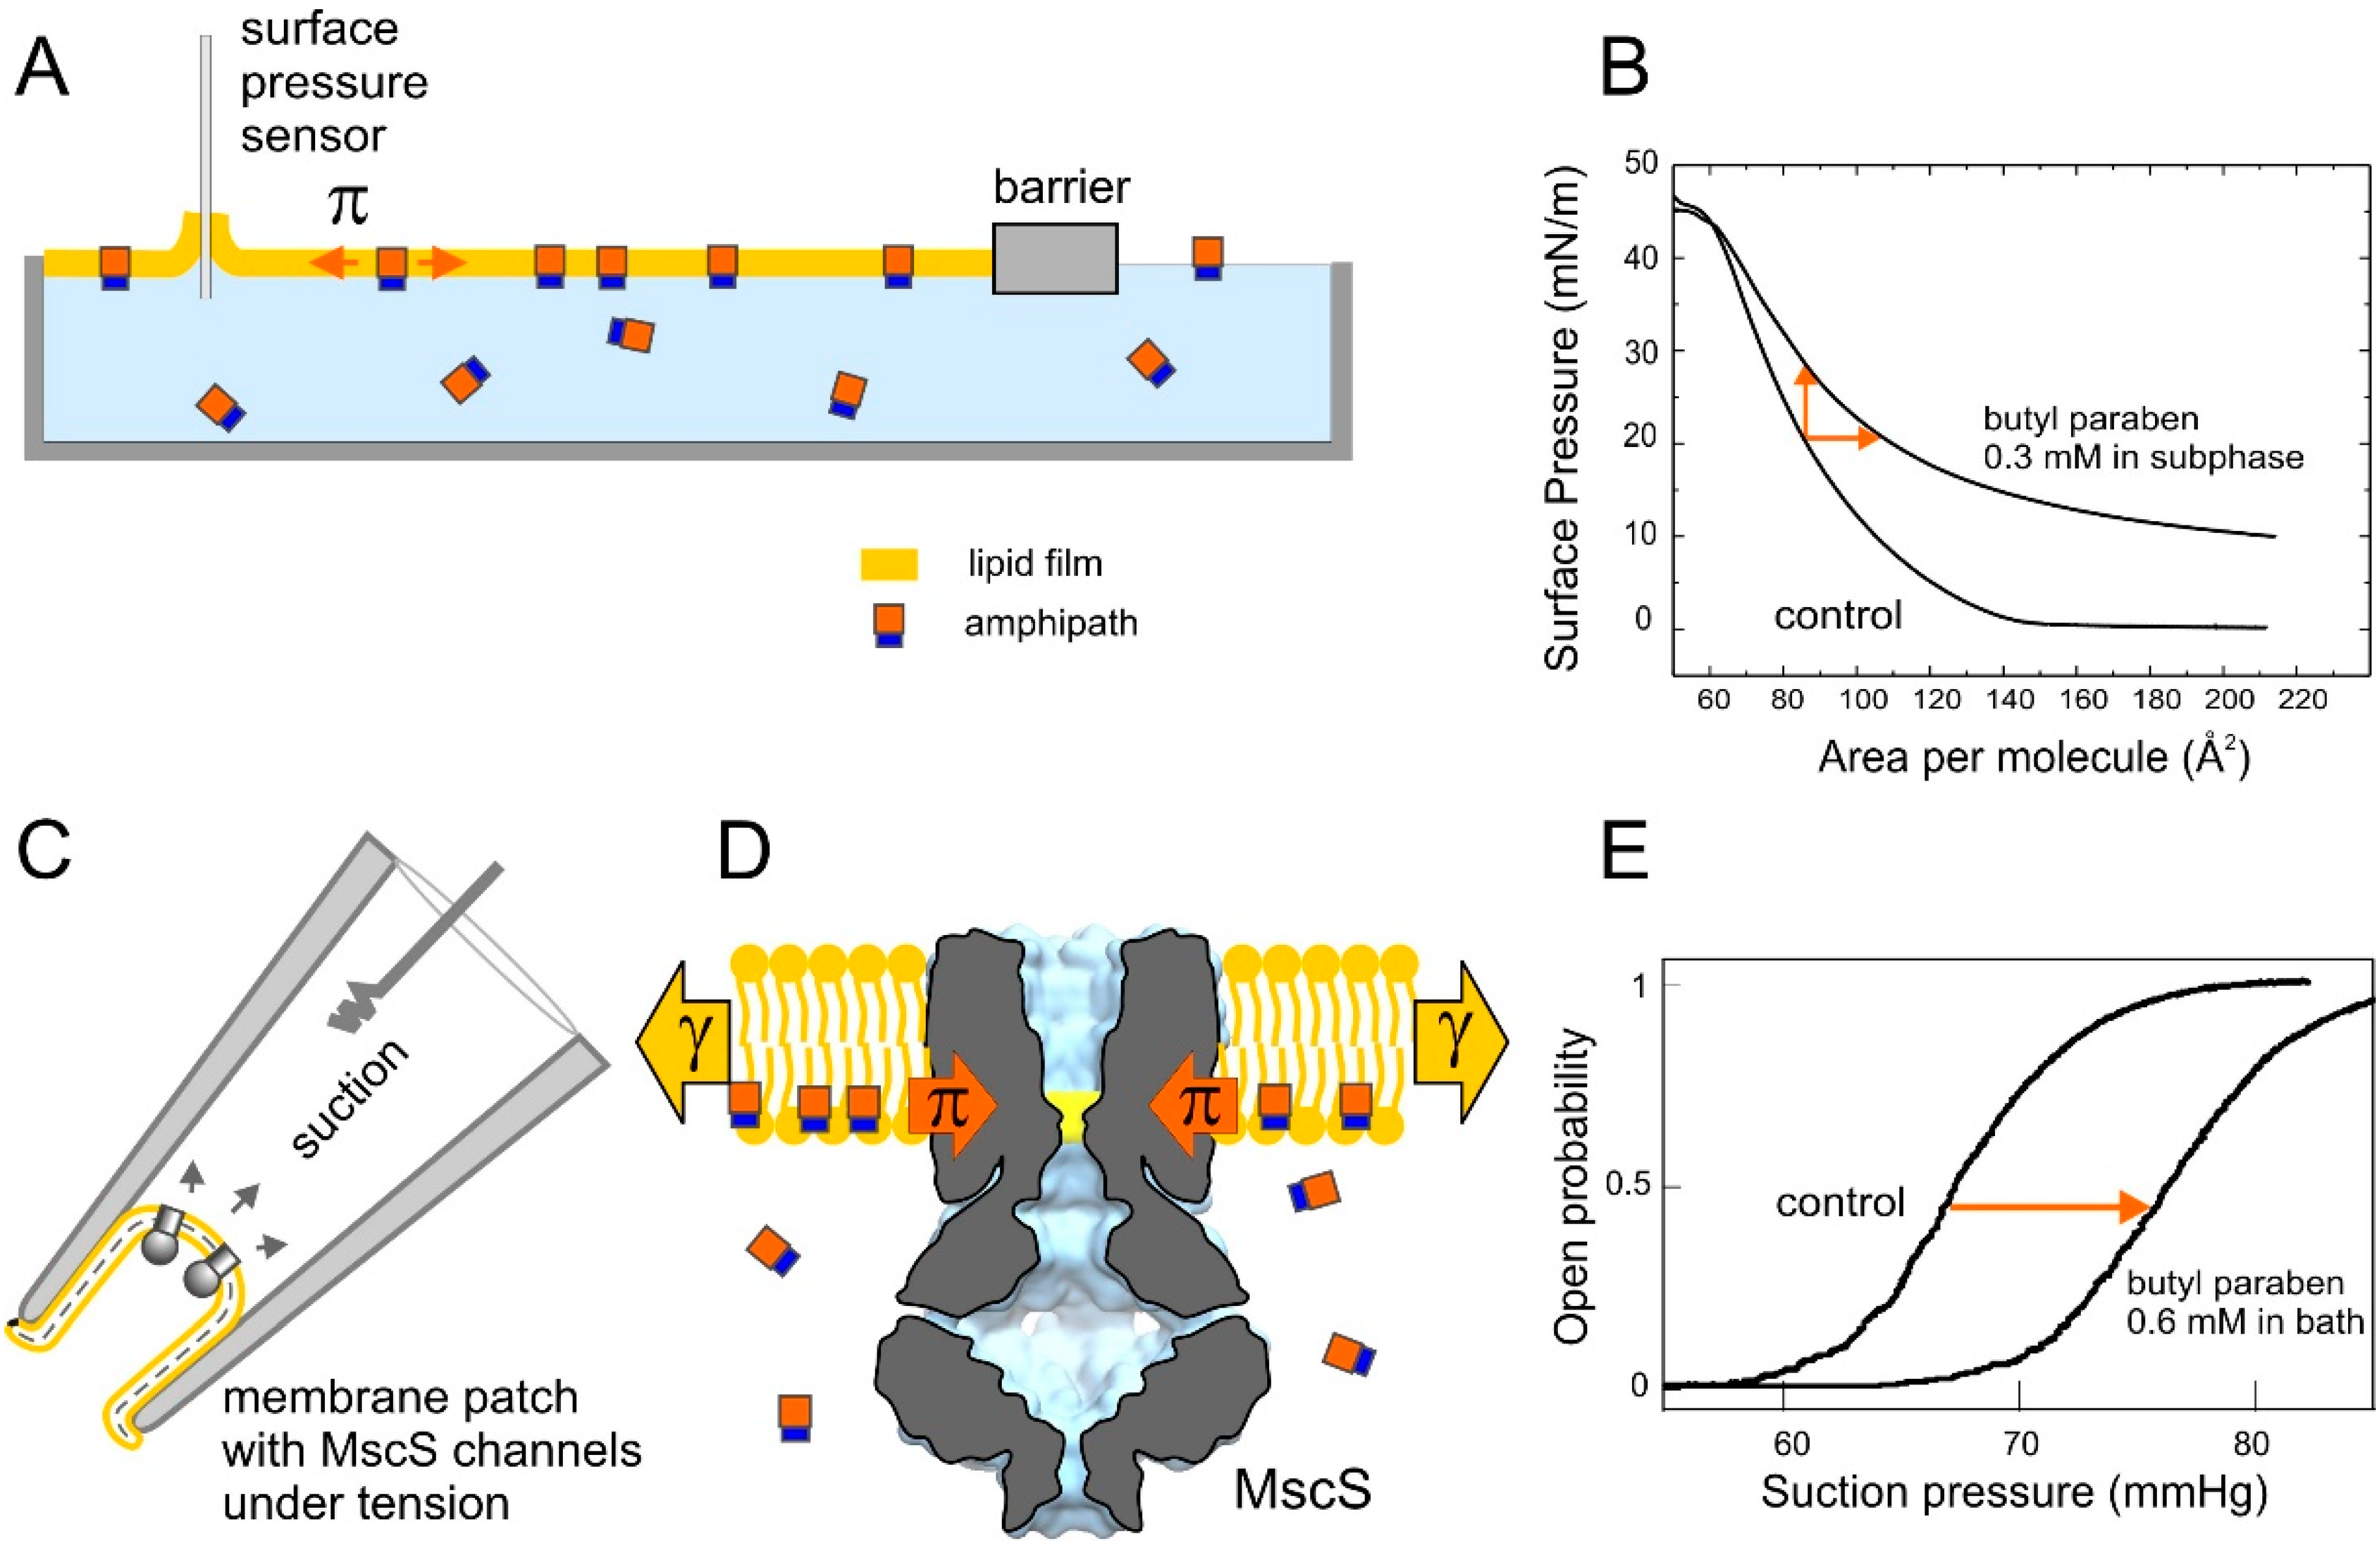
2.1. Optimizing MscS as a Lateral Pressure Sensing Device
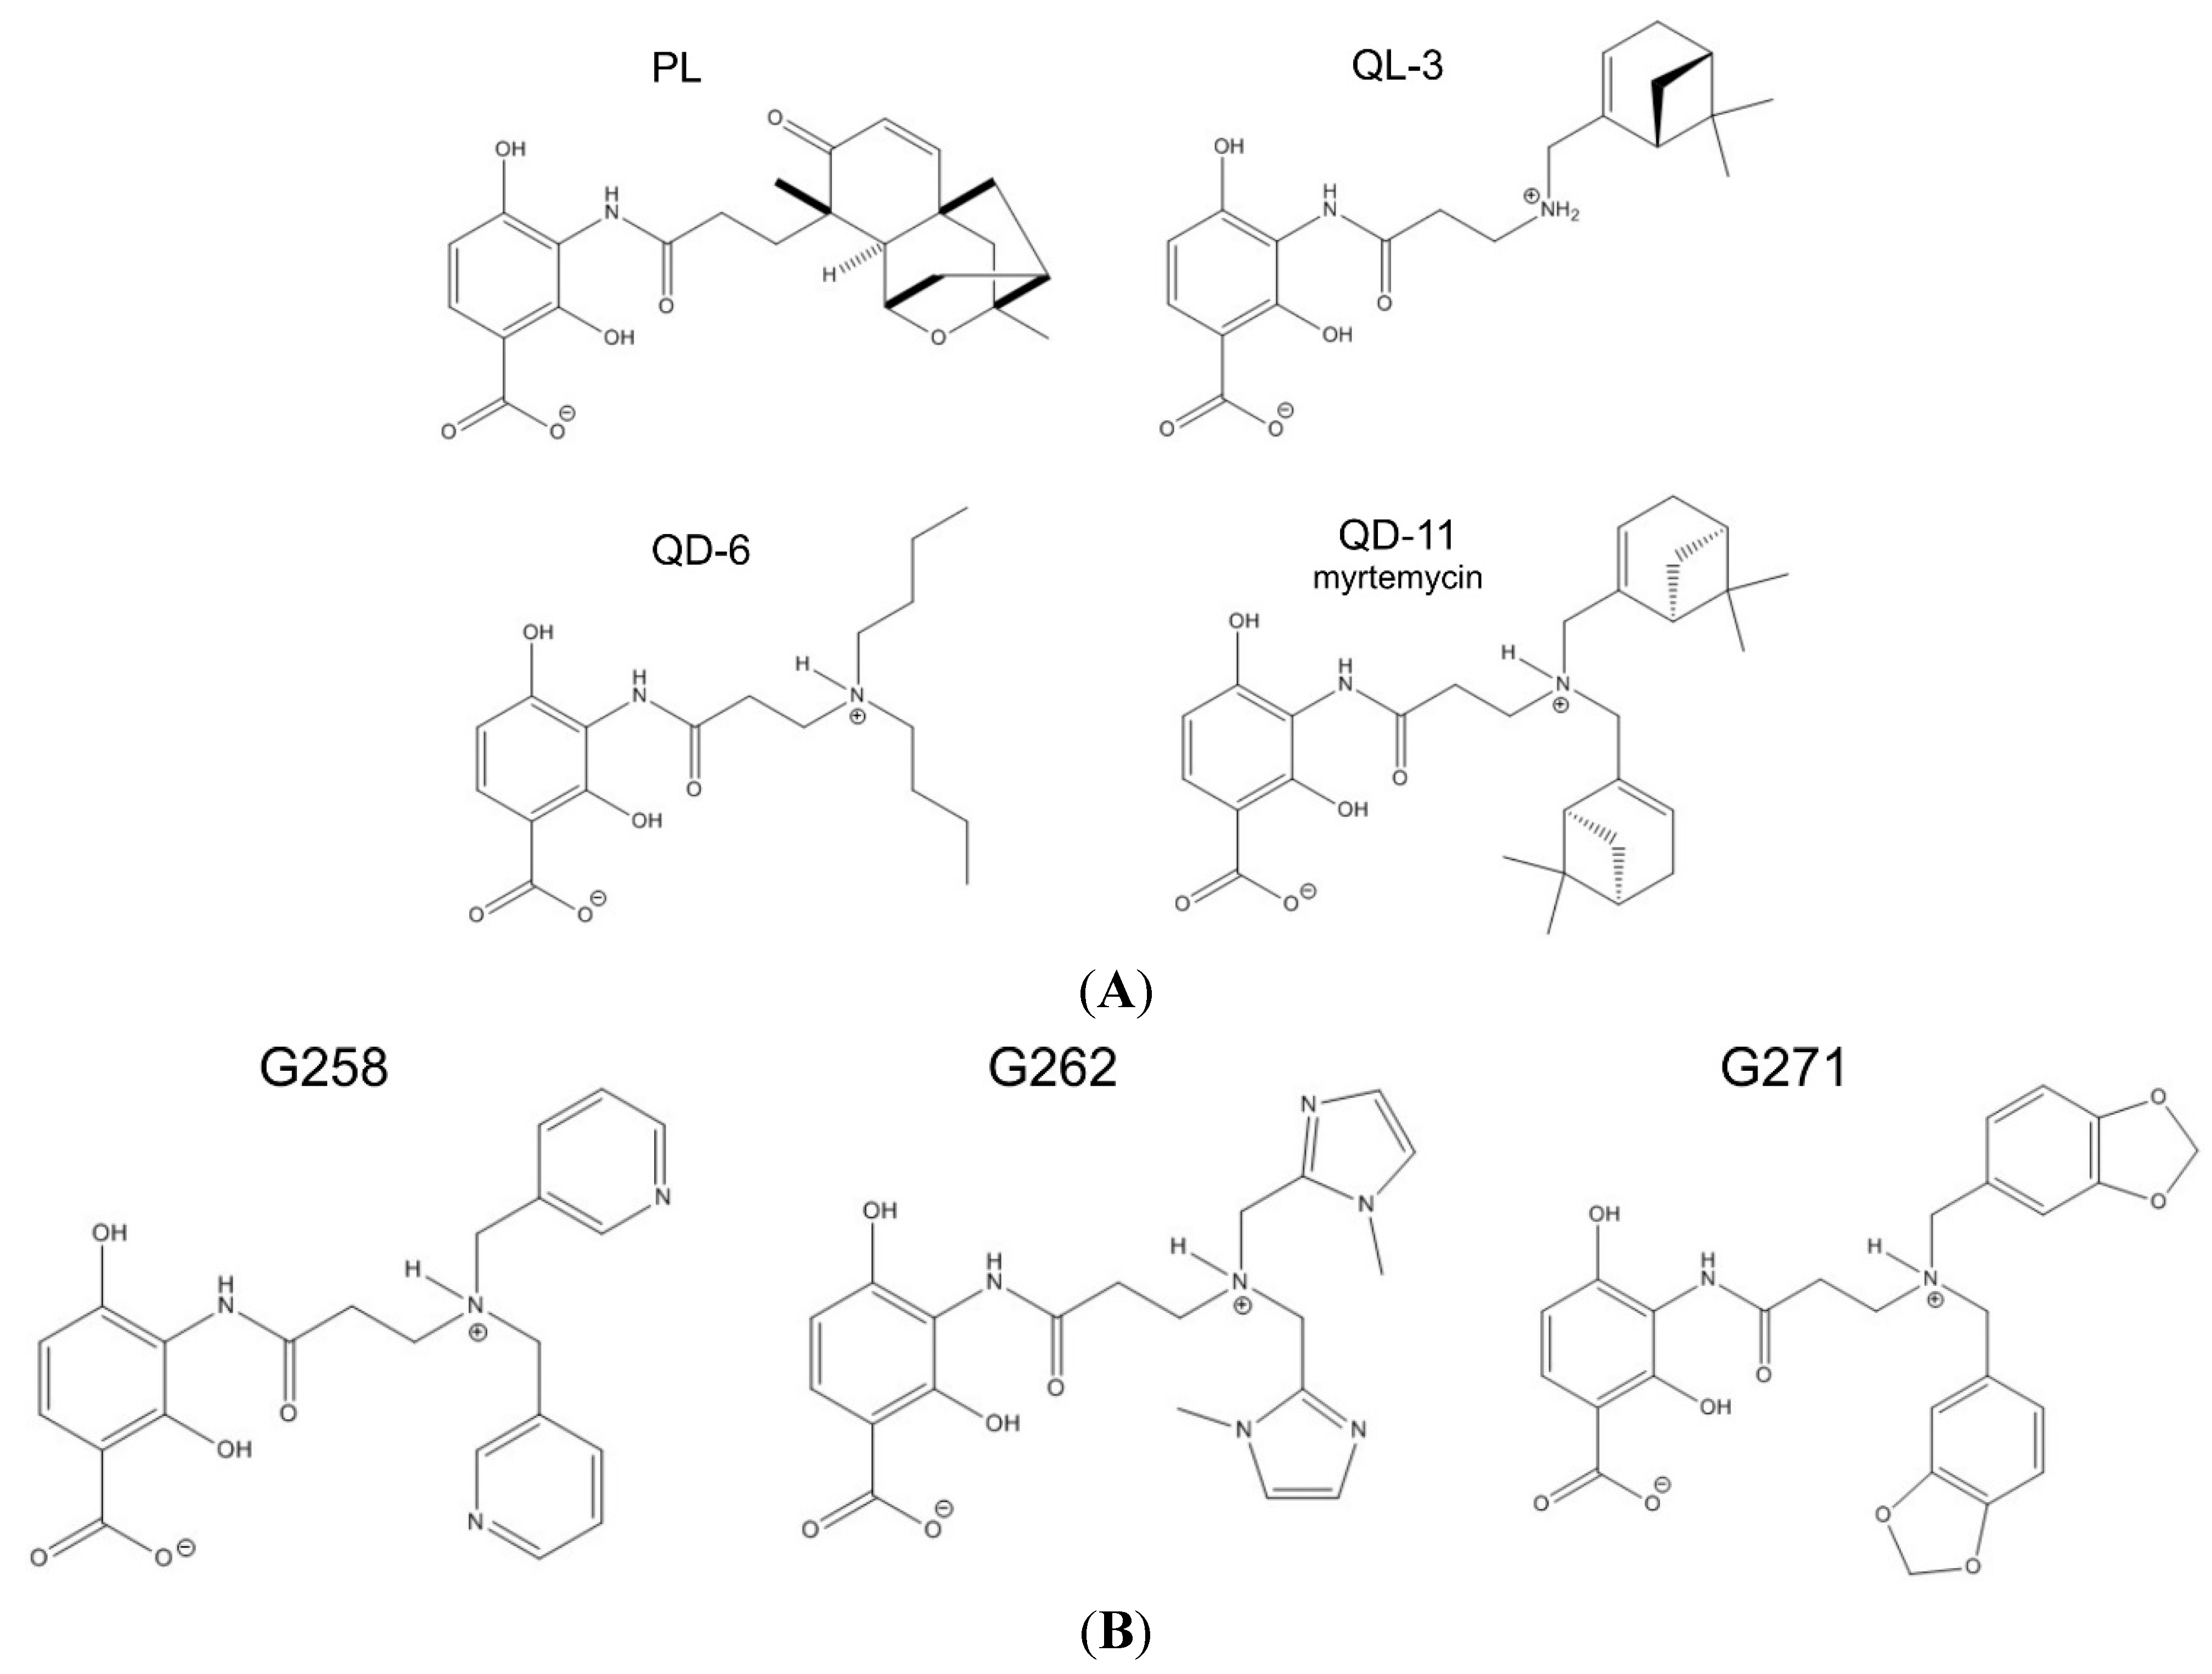
2.2. Synthetic Analogs of Platensimycin, Their Biological Activity and Predicted Affinities to FabF

| Drug Activity Parameter | PL | QL-03 | QD-06 | QD-11 | G258 | G262 | G271 |
|---|---|---|---|---|---|---|---|
| Computed affinity (kcal/mol) | 9.1 | n/a | n/a | 9.1 | 8.0 | 7.7 | 8.9 |
| MIC for B. subtilis (µg/mL) | 2 | >256 | 128 | 4 | >512 | >512 | >512 |
2.3. Computational Assessment of Polarity and Membrane Partitioning
| 1 | 2 | 3 | 4 | 5 | 6 | 7 | 8 | 9 | 10 |
|---|---|---|---|---|---|---|---|---|---|
| Compound | Polar/Total Area, Å2 | ALOGPS log KOW * | Molinspiration log KOW * | Chemicalize logD | log KAW (tens.) | log Klip @ 20 mN/m, Measured | log Klip @ 35 mN/m, Corrected | Effective Molec. Area, Å2 | log Kmem (patch-clamp) |
| QD-11 | 110/440, 25% | 7.44 | 6.07 | 4.09 | 6.1 | 6.7 | 6.2 | 31 | 5.7 |
| G271 | 159/439, 36% | 4.11 | 3.40 | 1.62 | 4.5 | 6.1 | 5.8 | 18 | 6.1 |
| QD-06 | 110/366, 30% | 3.52 | 3.70 | 1.81 | 4.1 | 5.0 | 4.5 | 30 | 5.5 |
| QL-03 | 119/353, 34% | 3.79 | 2.85 | 0.99 | 5.0 | 5.6 | 5.2 | 28 | 6.1 |
| PL | 133/373, 36% | 3.32 | 2.84 | 0.02 | 4.6 | 6.6 | 6.1 | 31 | 5.0 |
| G258 | 136/374, 36% | 0.89 | 1.15 | −0.18 | 4.2 | 5.9 | 5.6 | 18 | 5.6 |
| G262 | 141/387, 36% | 0.59 | 0.46 | −0.18 | 4.2 | 5.9 | 5.6 | 17 | 5.6 |

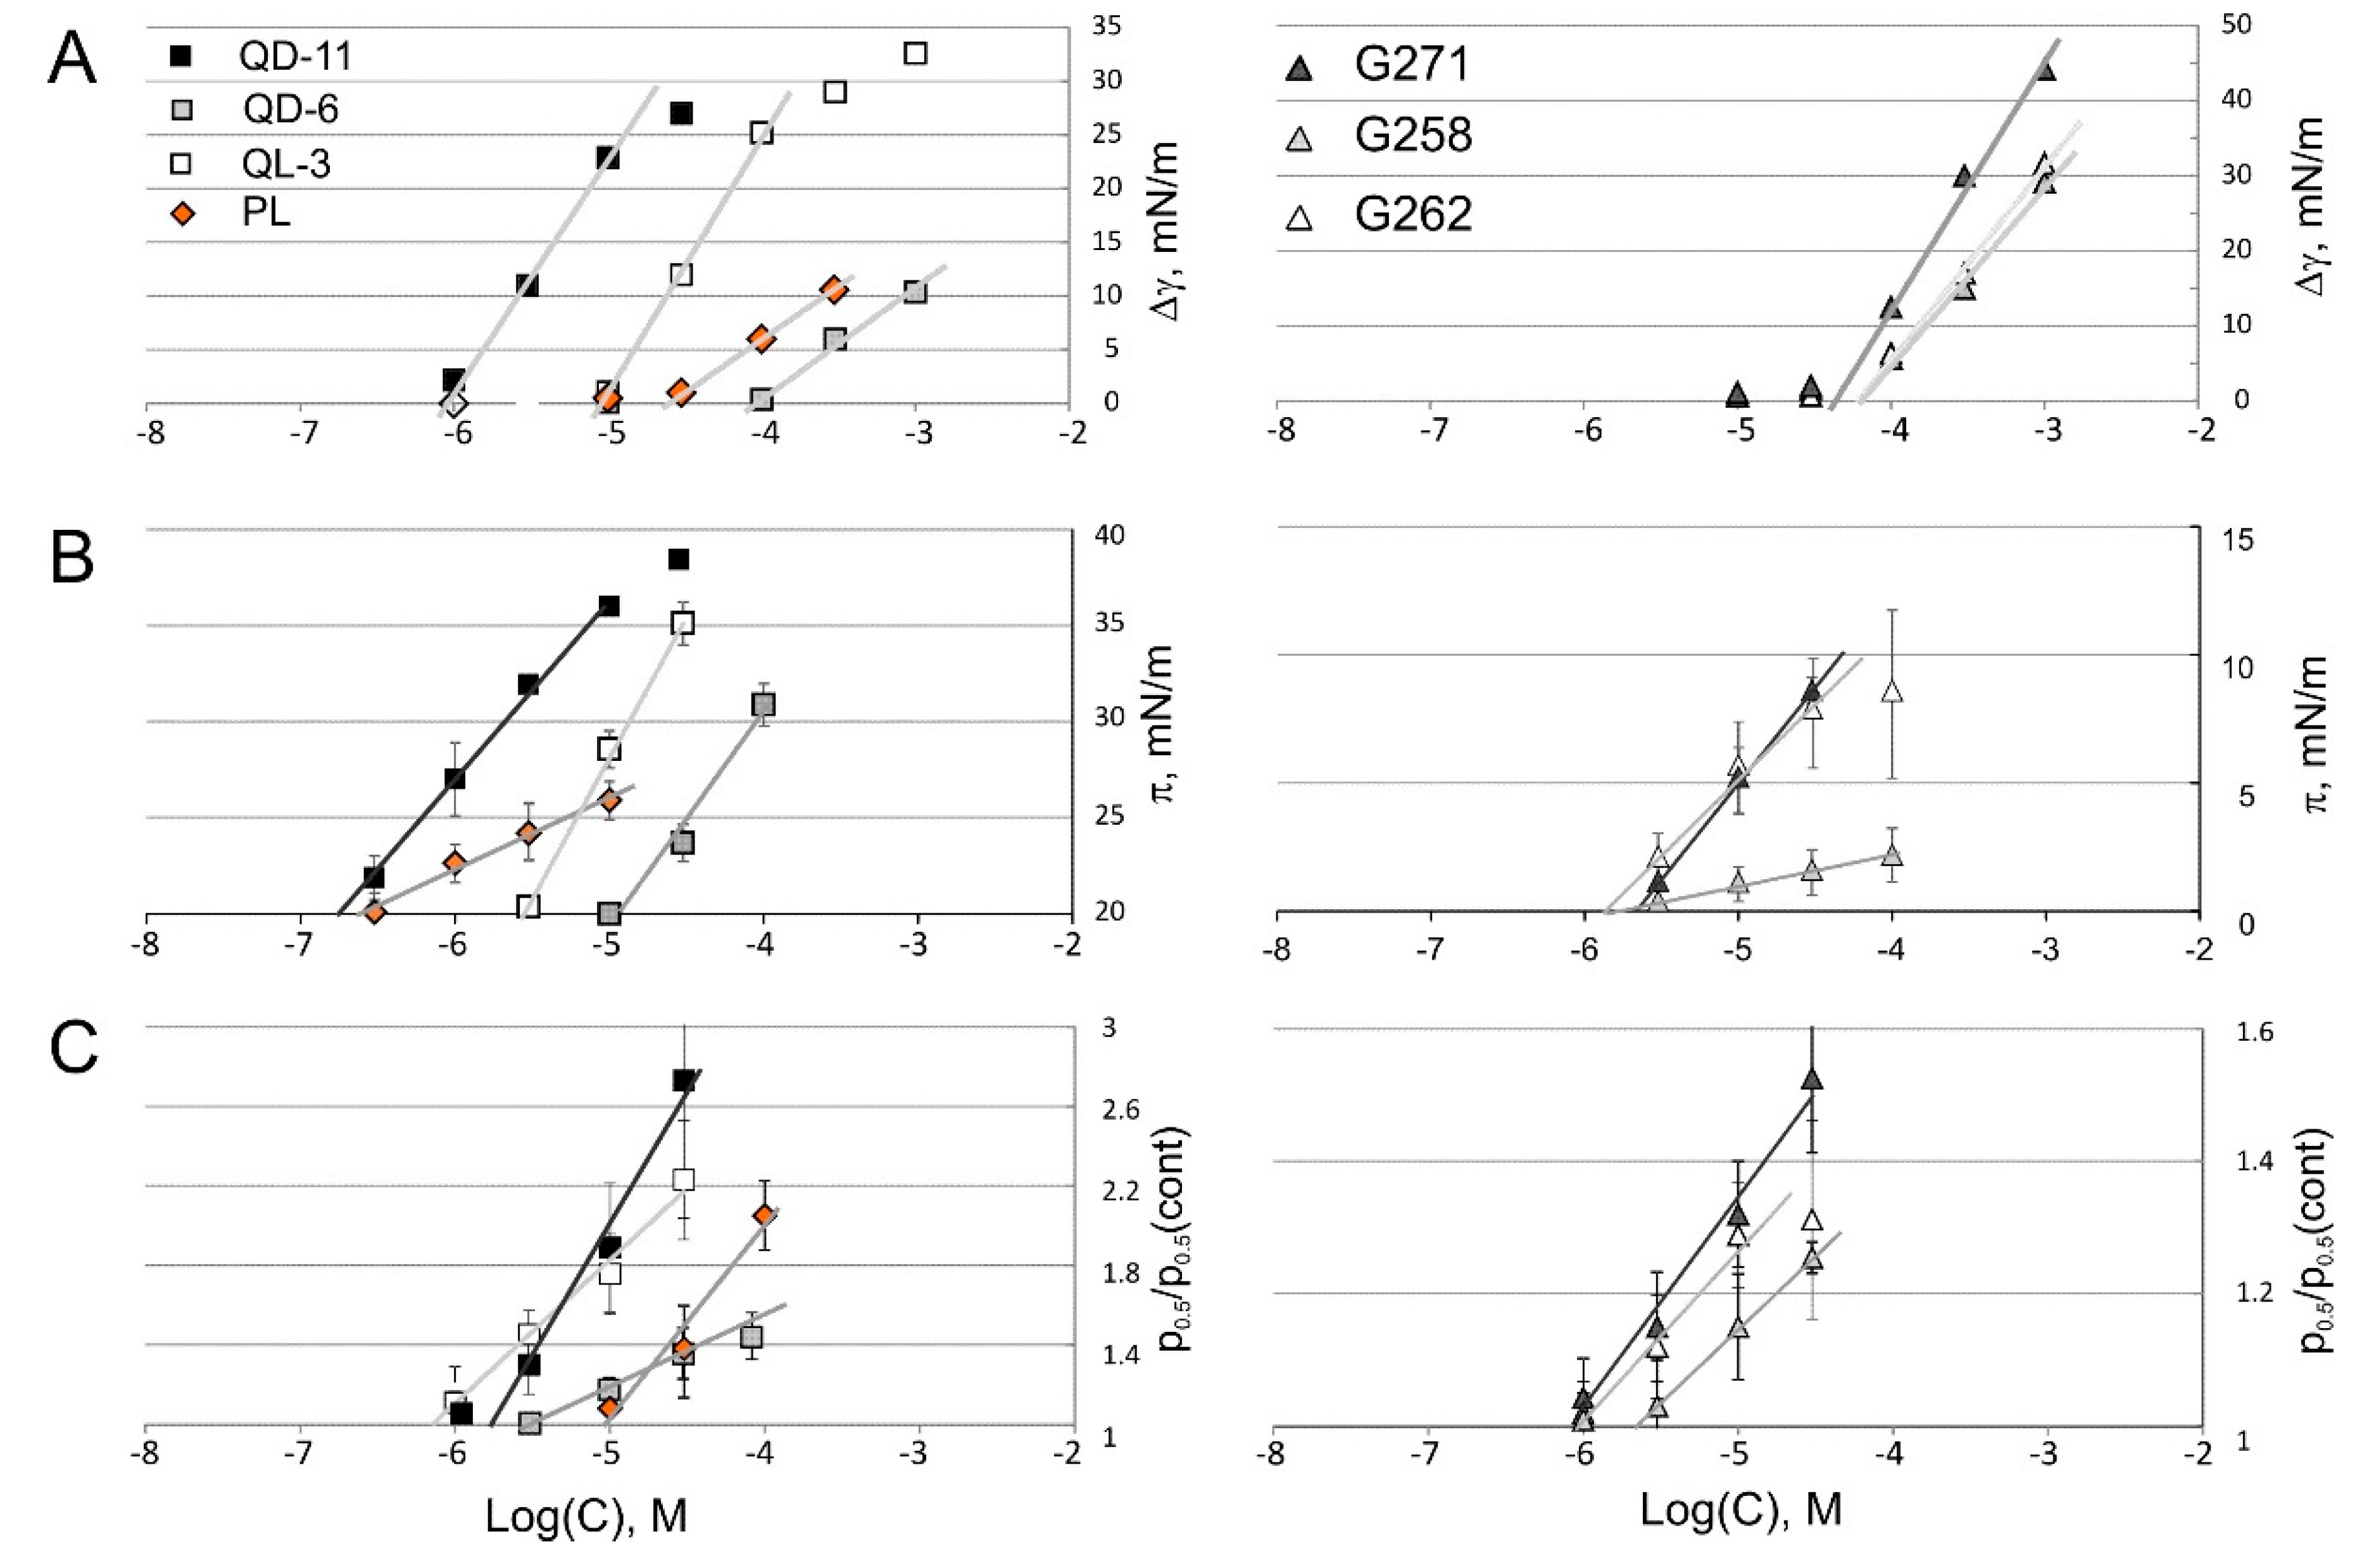
2.4. Tensiometry
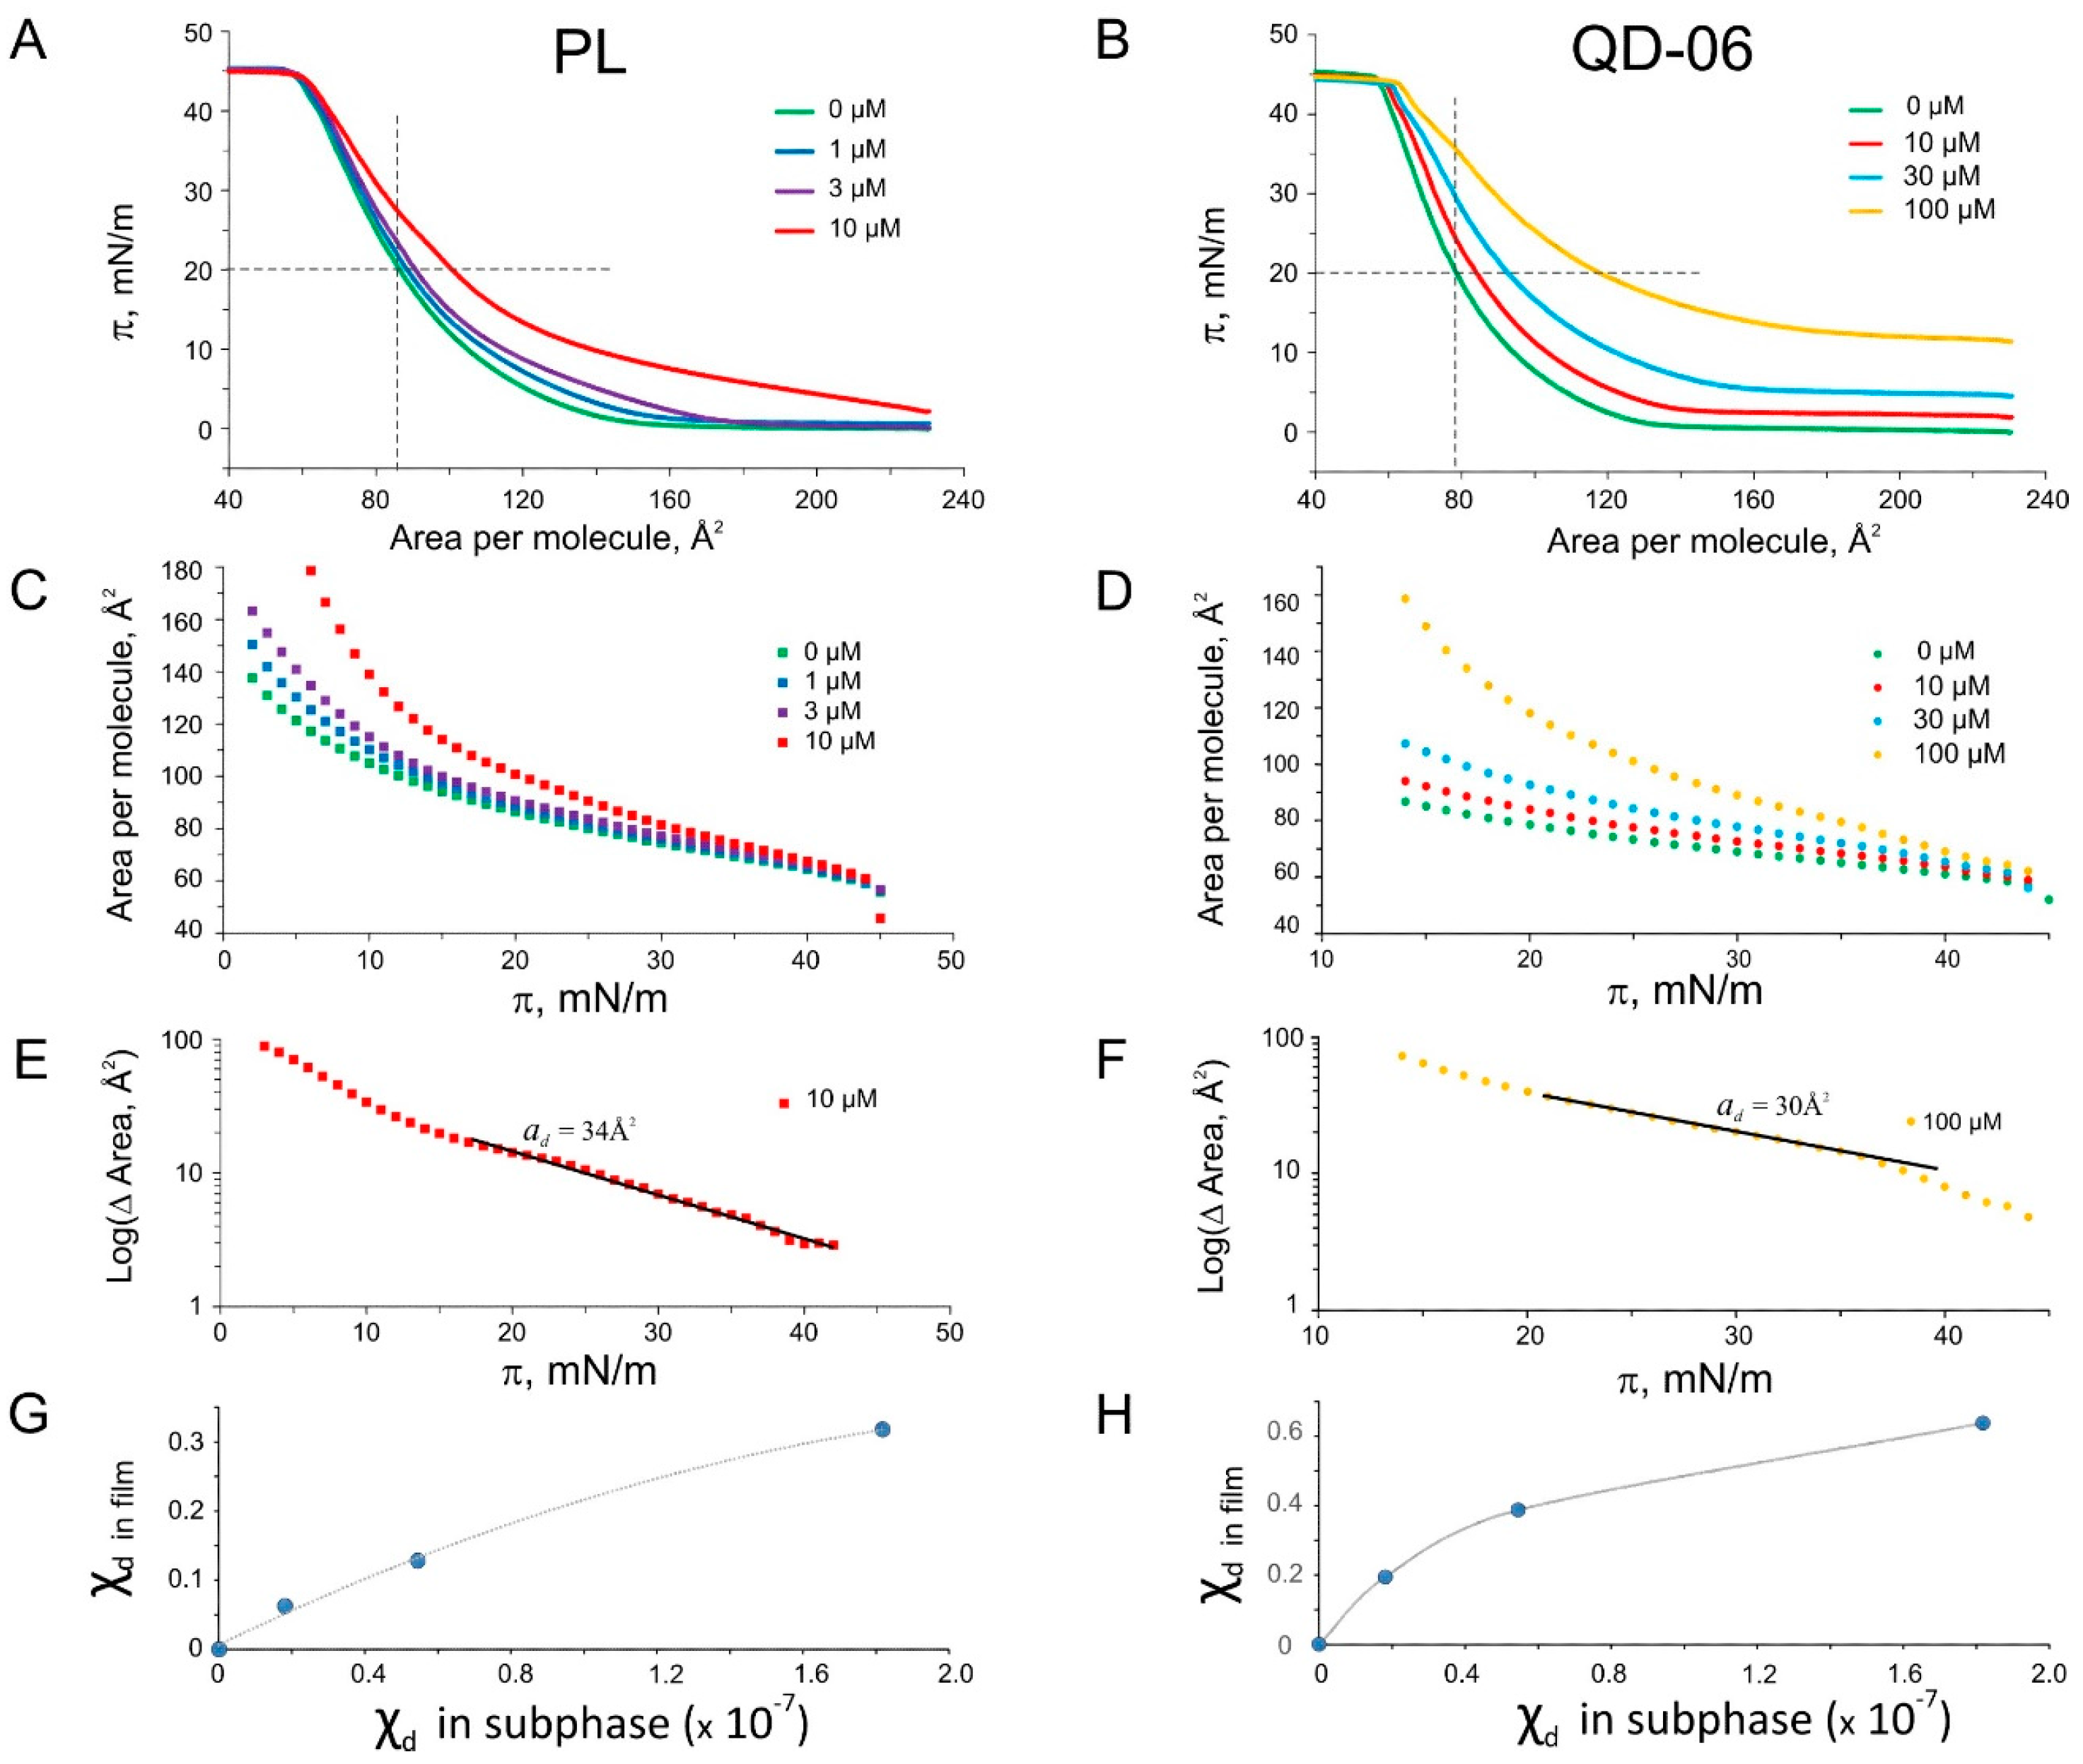
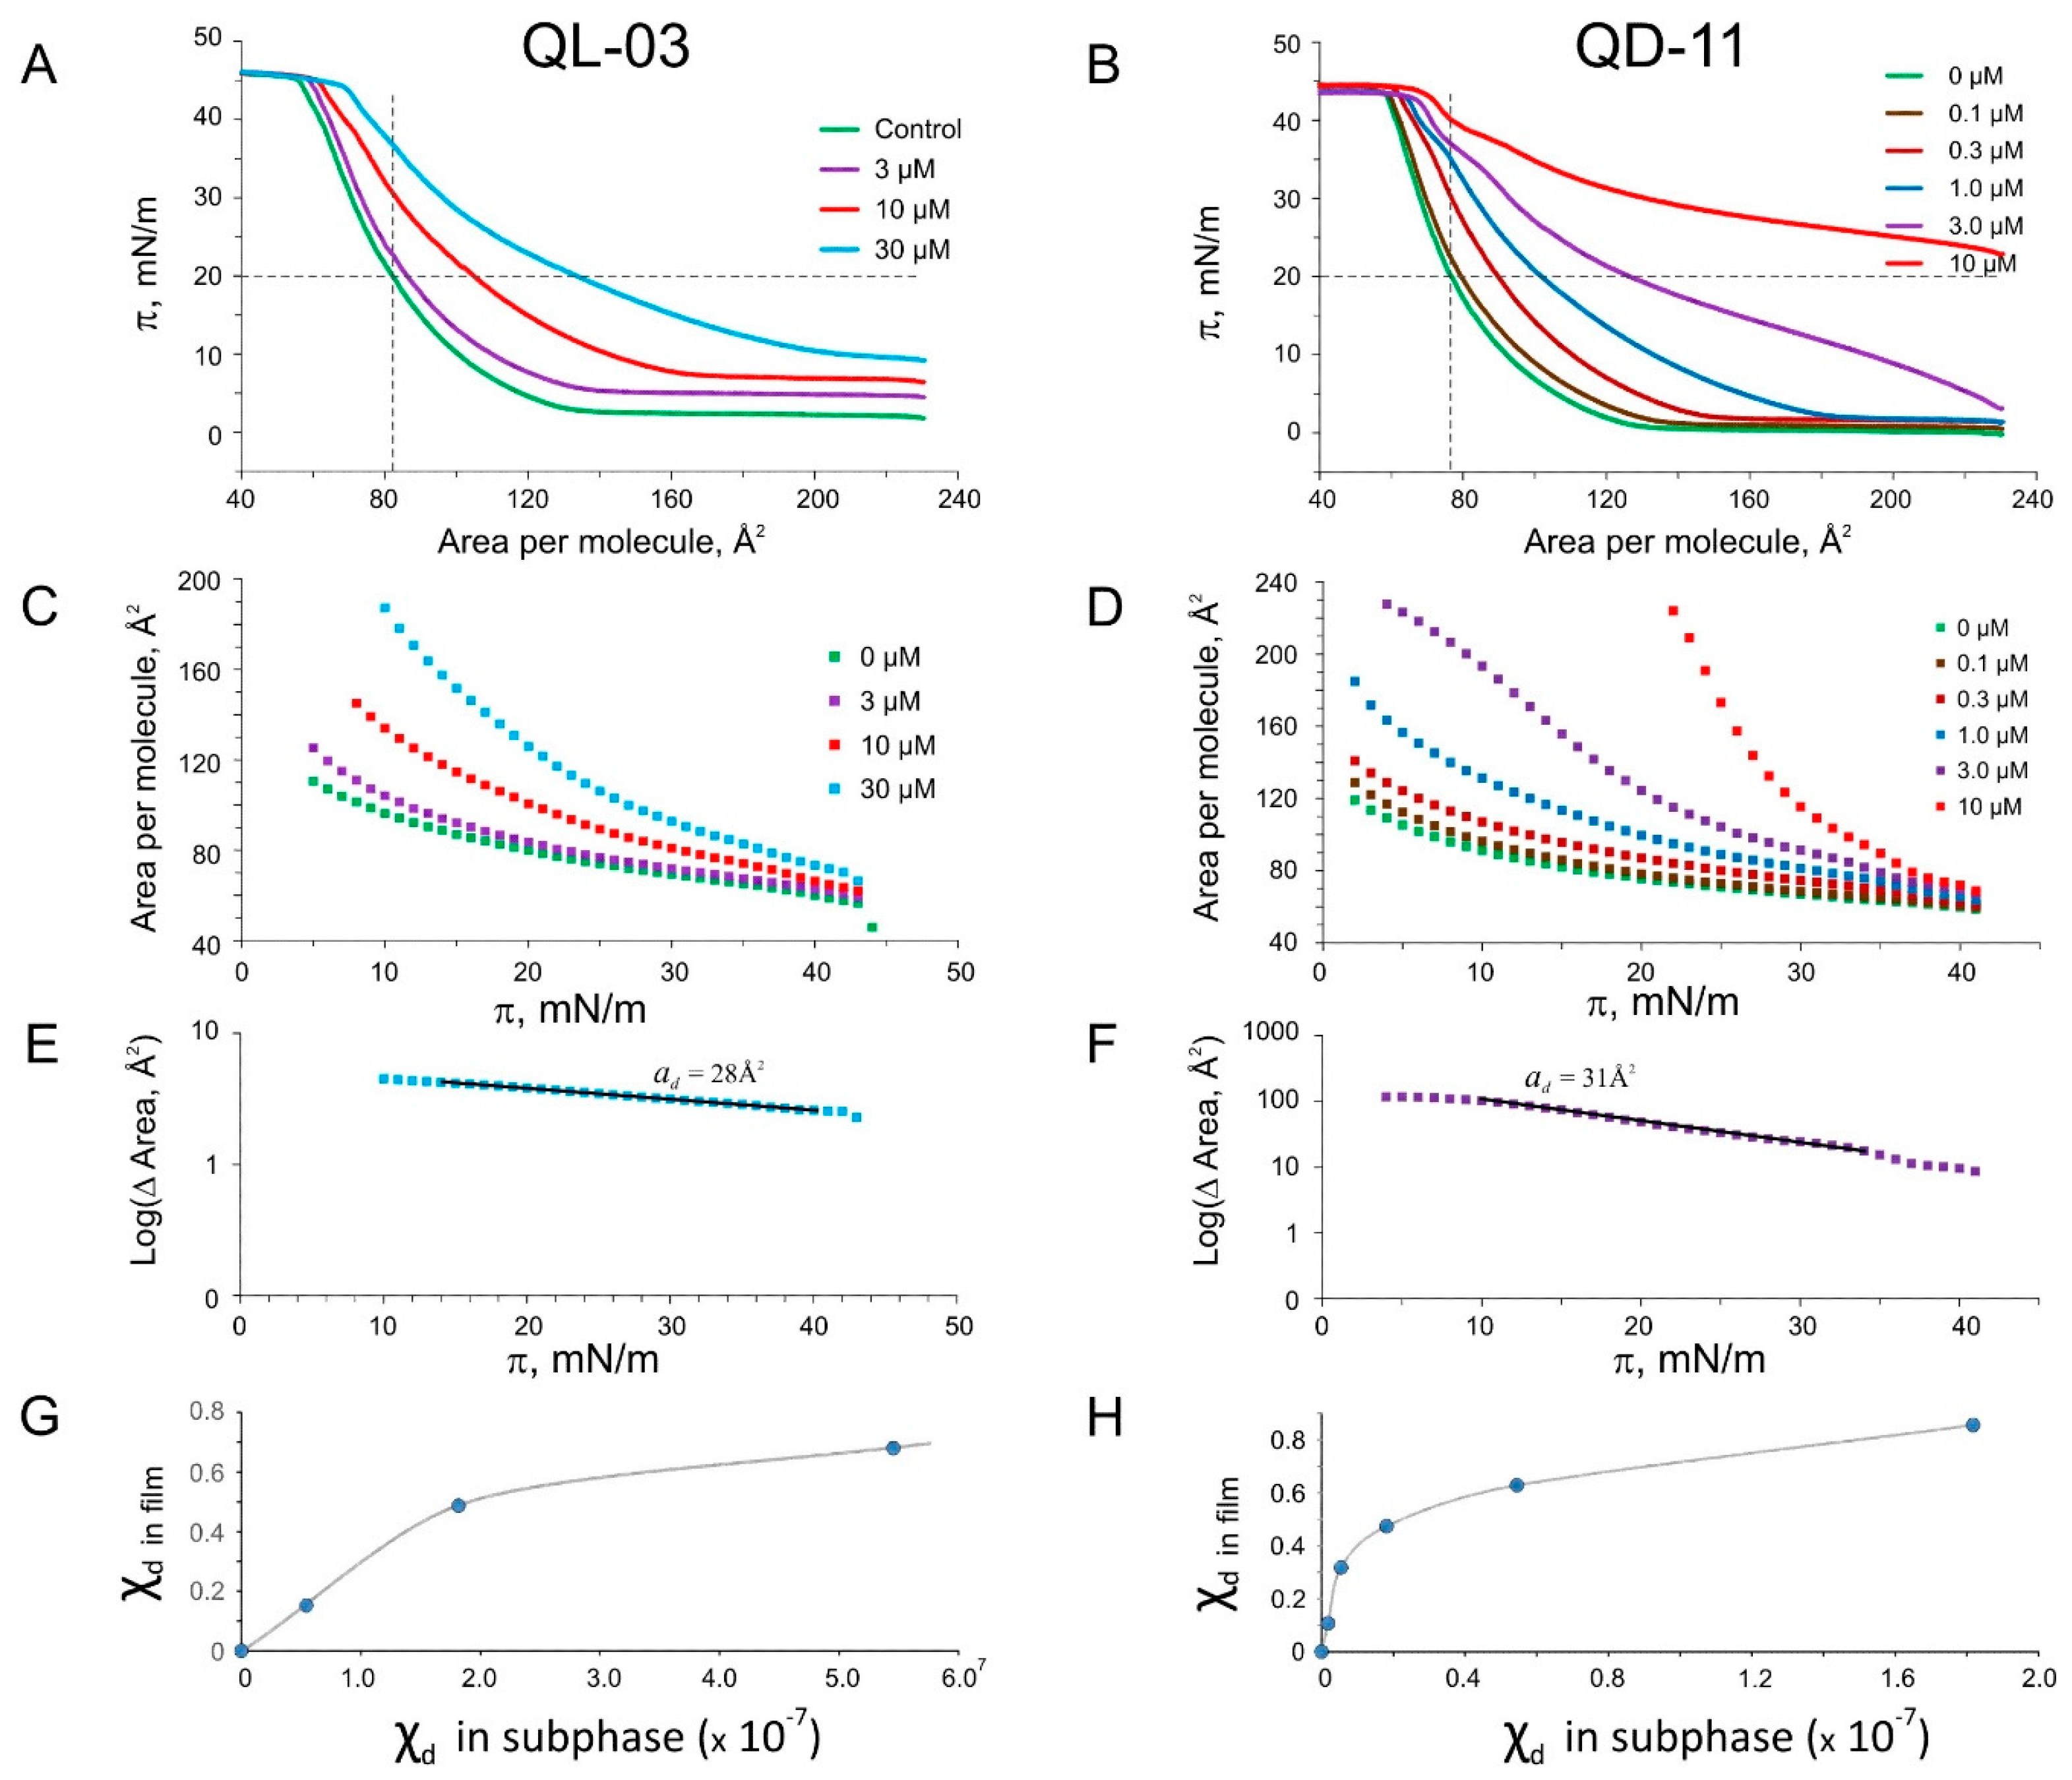
2.5. Langmuir Monolayer Experiments

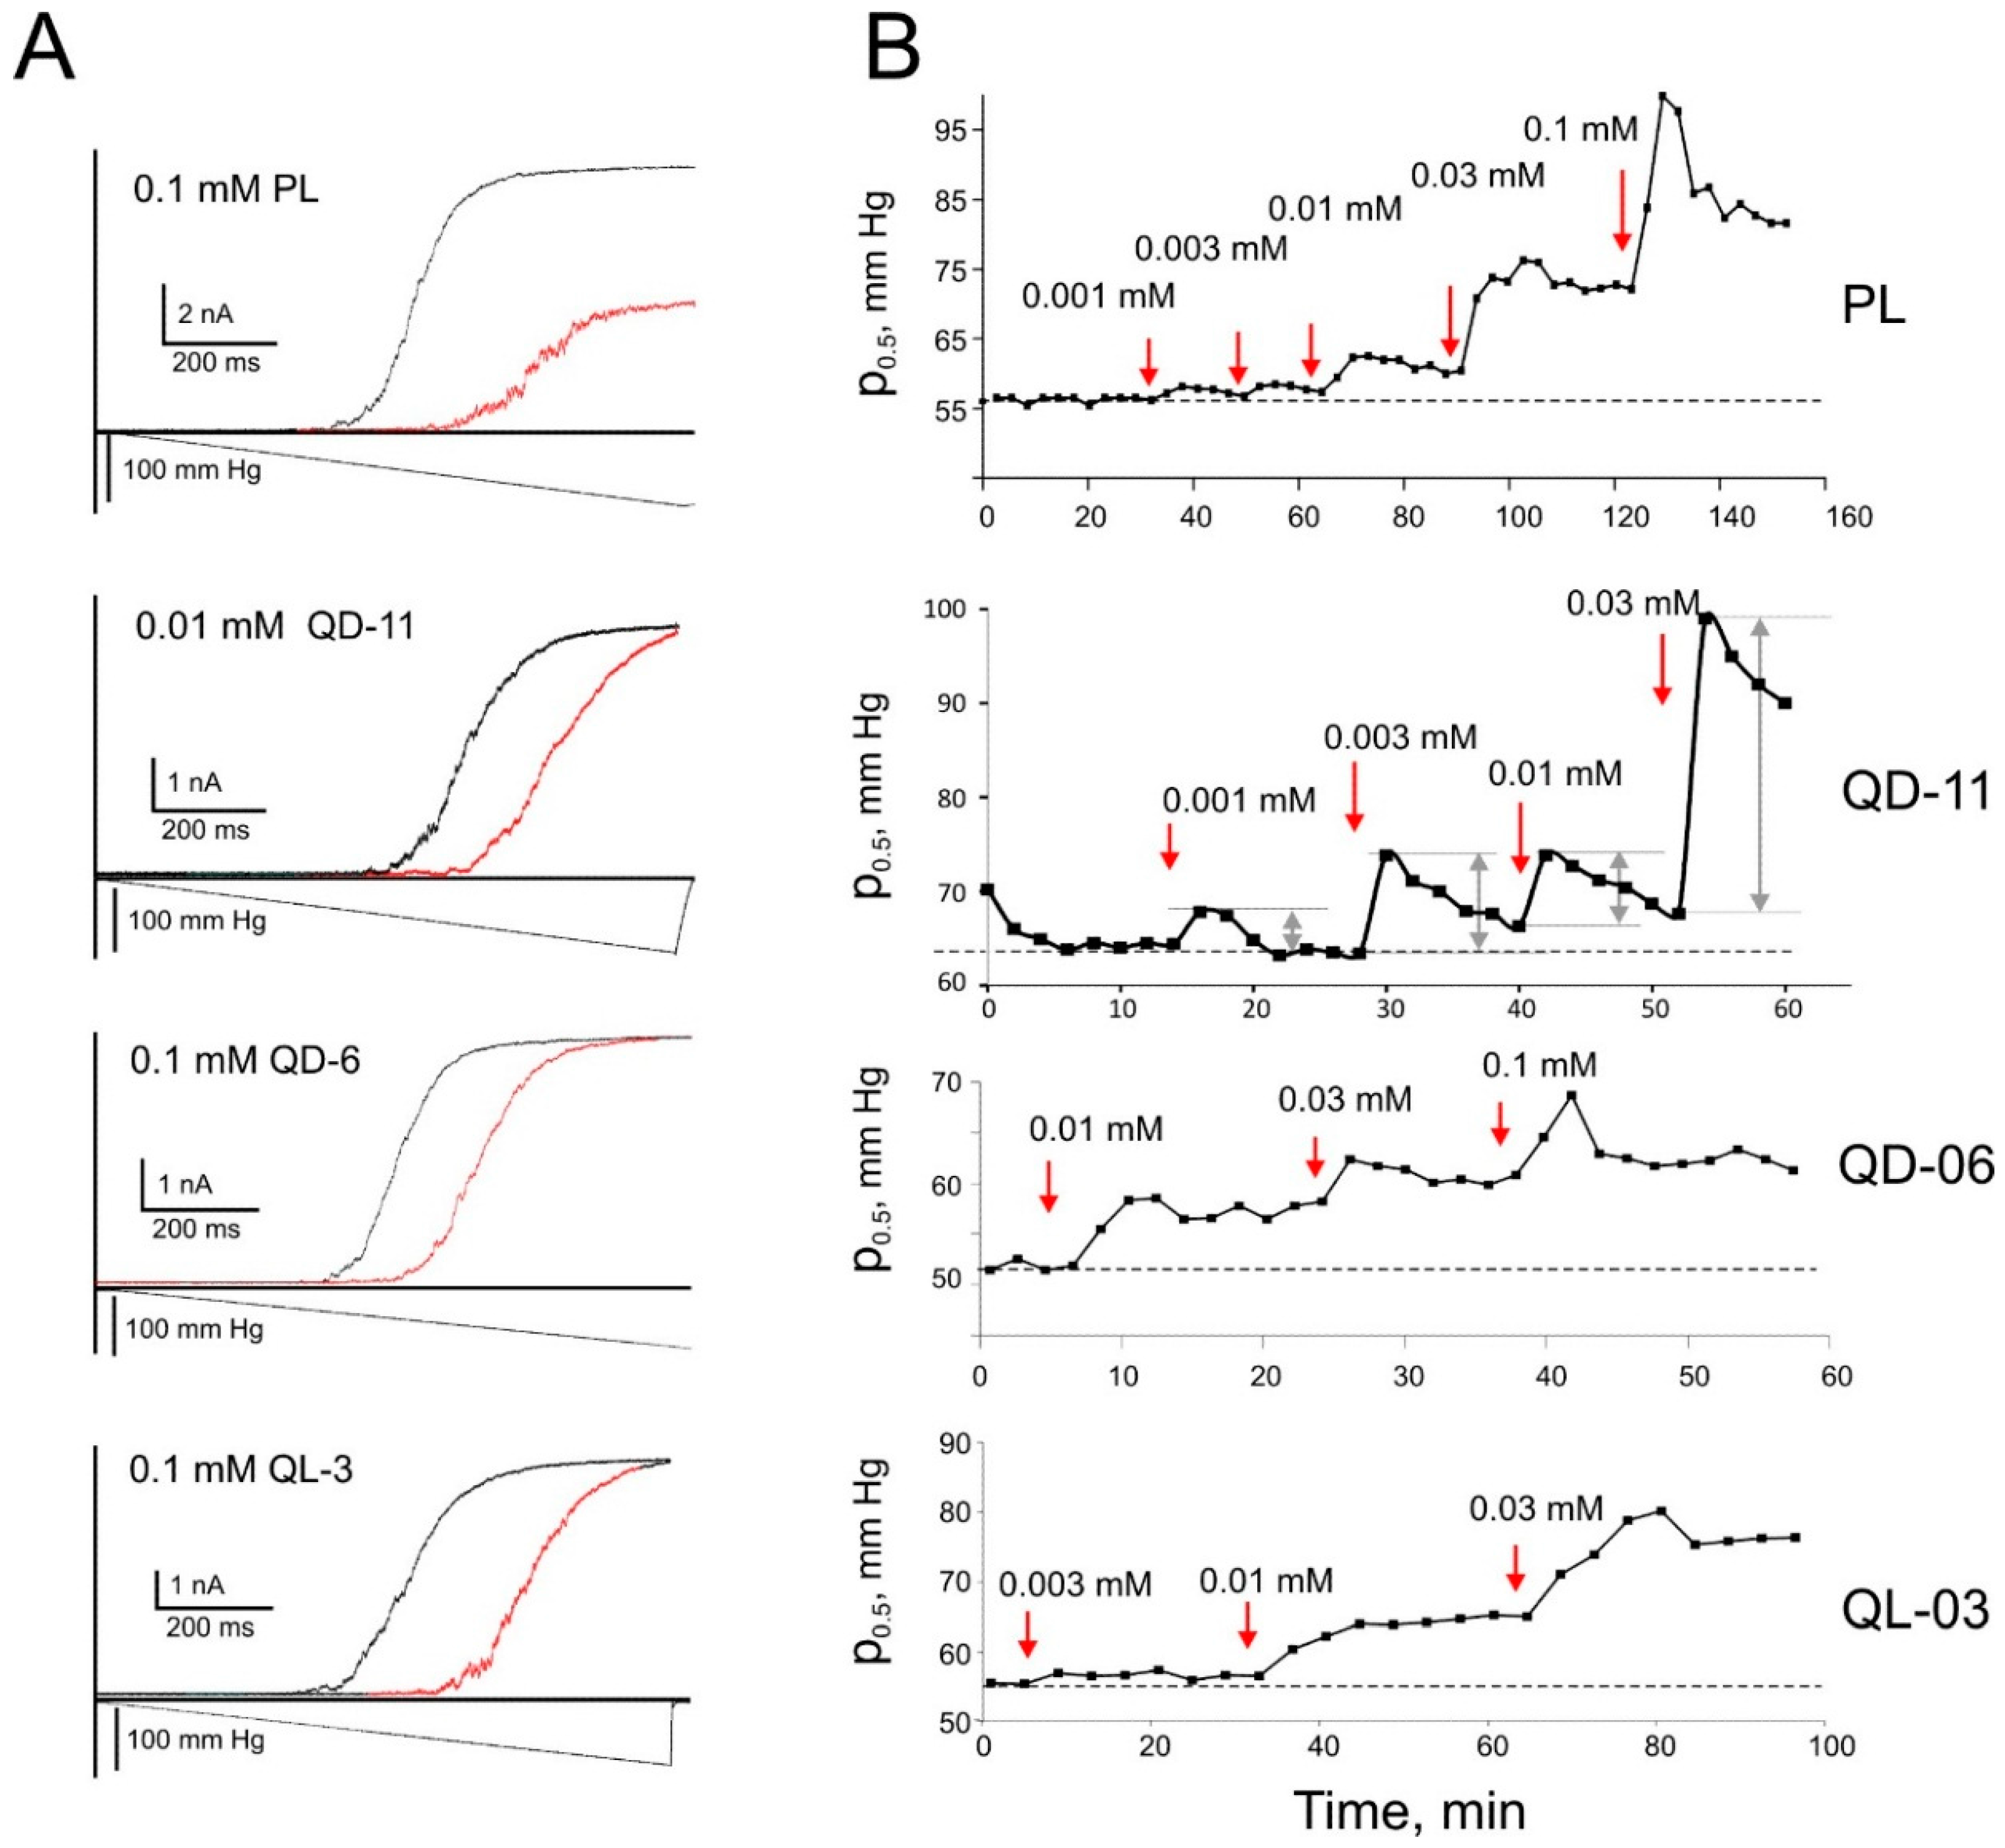
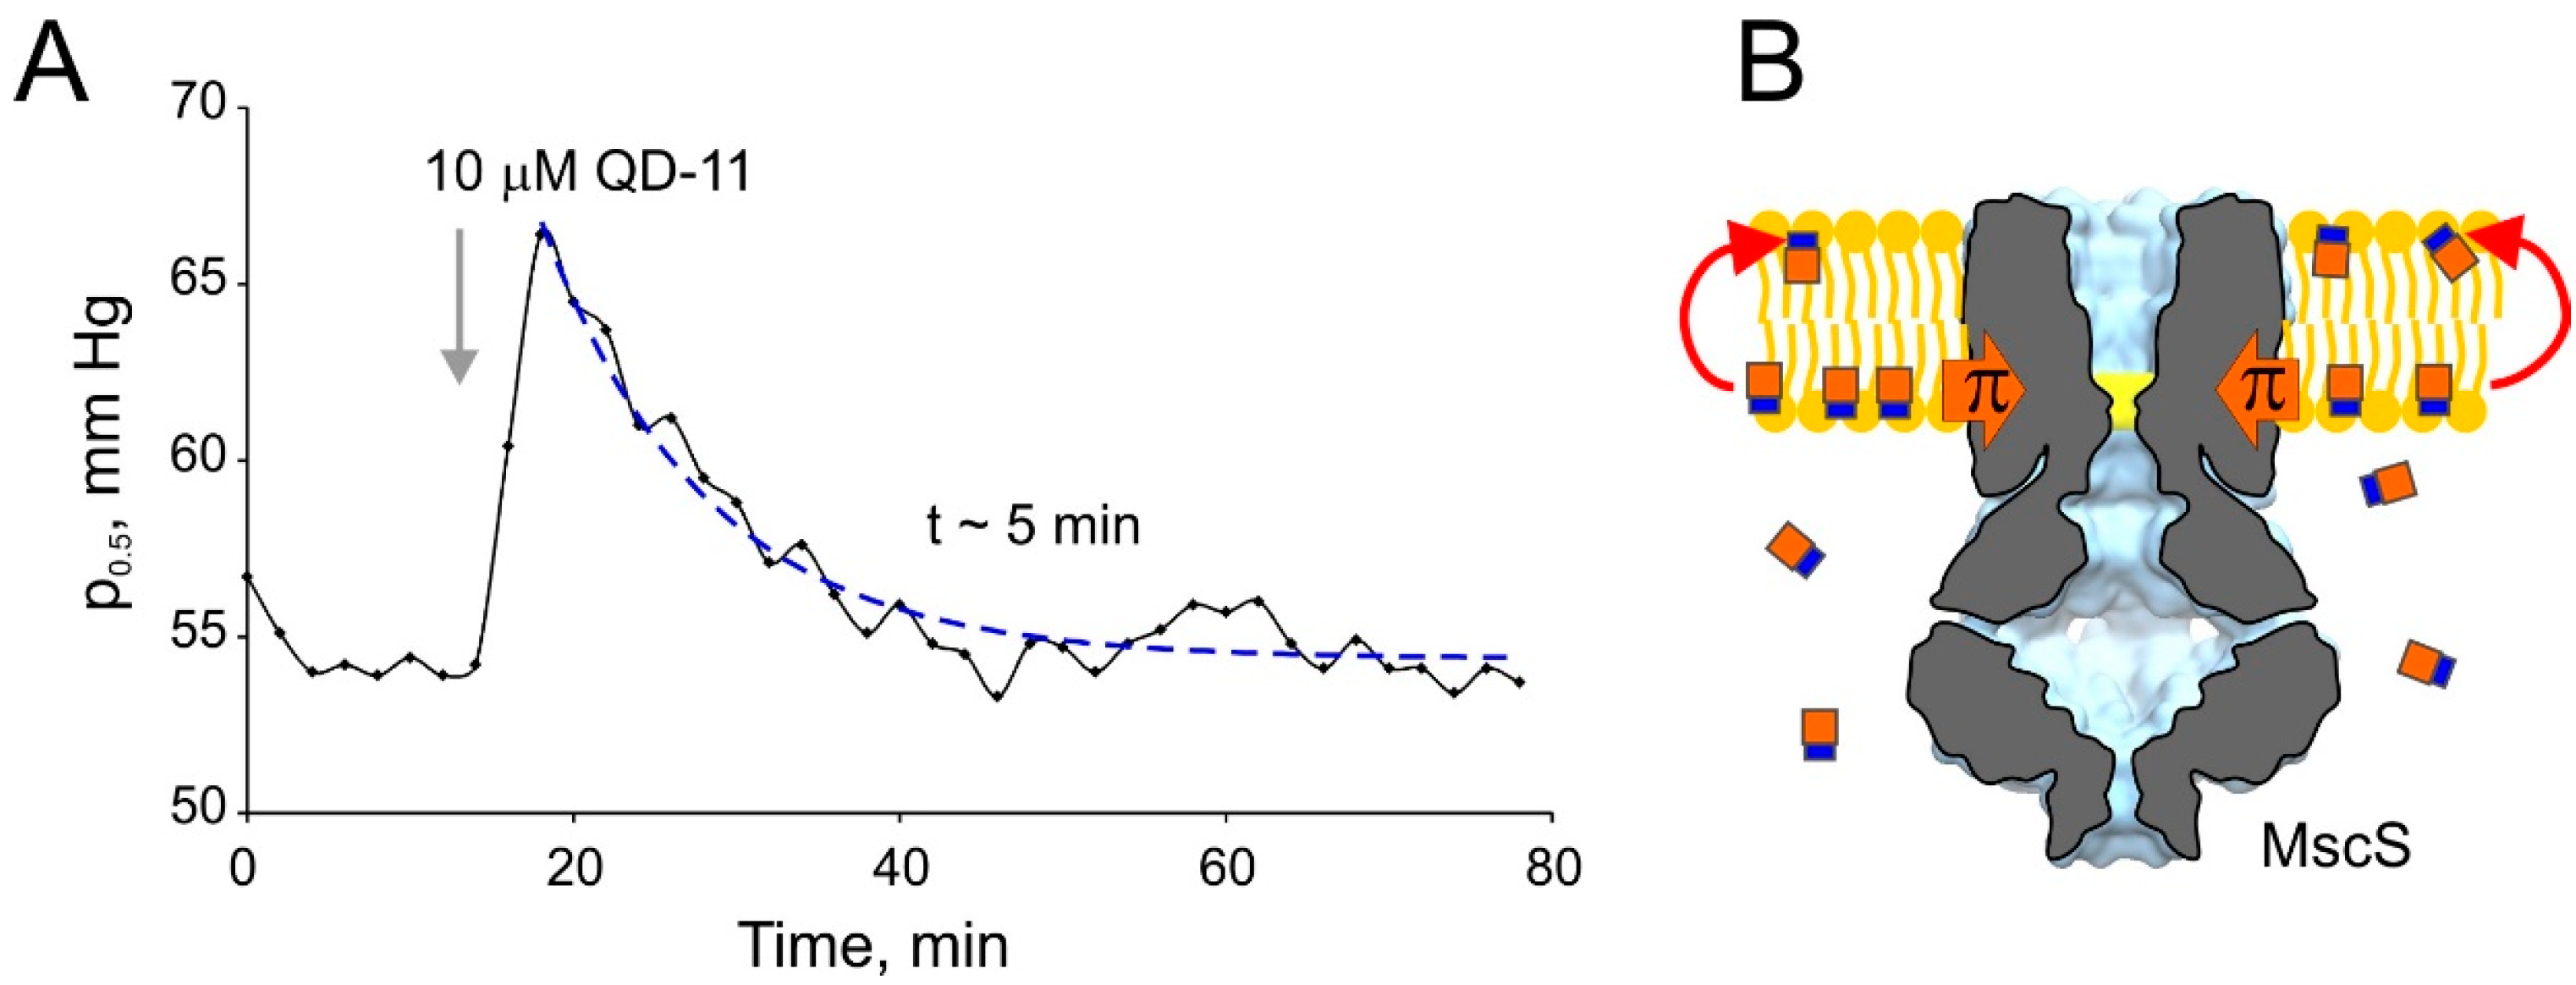
2.6. Patch-Clamp Investigation of Drug Insertion into the Bacterial Cytoplasmic Membrane
3. Discussion
4. Experimental Section
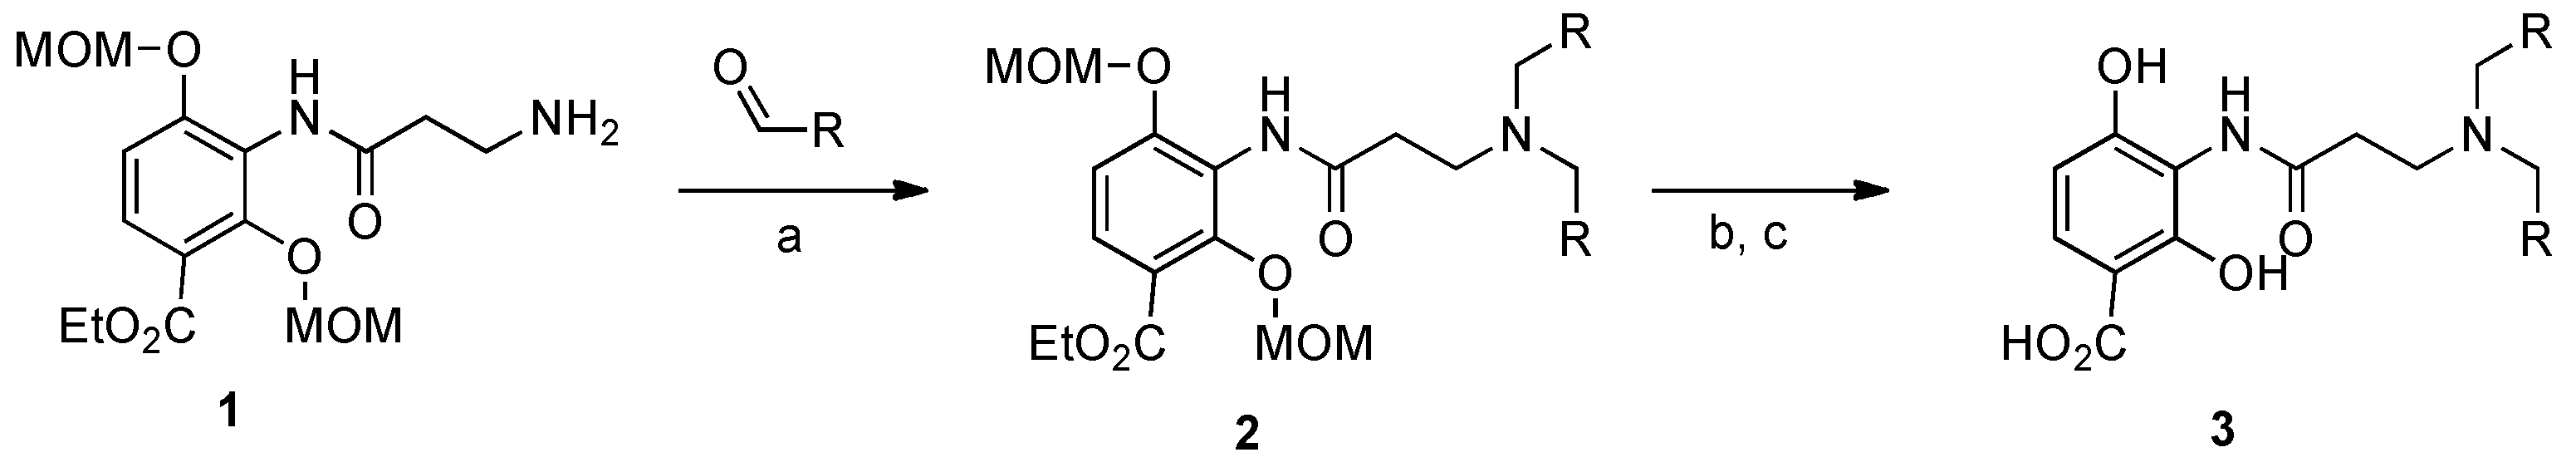
4.1. Synthesis of Platensimycin Analogs

4.2. Computations of Polarity and Partial Charges
4.3. Tensiometry and Langmuir Monolayer Experiments
4.4. Strains, Spheroplast Preparation, and Electrophysiology
4.5. Interfacial Partitioning Data Analysis
5. Conclusions
Supplementary Materials
Acknowledgments
Author Contributions
Conflicts of Interest
References
- Lipinski, C.A.; Lombardo, F.; Dominy, B.W.; Feeney, P.J. Experimental and computational approaches to estimate solubility and permeability in drug discovery and development settings. Adv. Drug Deliv. Rev. 2001, 46, 3–26. [Google Scholar] [CrossRef]
- Sikkema, J.; de Bont, J.A.; Poolman, B. Interactions of cyclic hydrocarbons with biological membranes. J. Biol. Chem. 1994, 269, 8022–8028. [Google Scholar] [PubMed]
- Gulyaeva, N.; Zaslavsky, A.; Lechner, P.; Chlenov, M.; McConnell, O.; Chait, A.; Kipnis, V.; Zaslavsky, B. Relative hydrophobicity and lipophilicity of drugs measured by aqueous two-phase partitioning, octanol-buffer partitioning and HPLC. A simple model for predicting blood-brain distribution. Eur. J. Med. Chem. 2003, 38, 391–396. [Google Scholar] [CrossRef]
- Ambroggio, E.E.; Separovic, F.; Bowie, J.; Fidelio, G.D. Surface behaviour and peptide-lipid interactions of the antibiotic peptides, Maculatin and Citropin. Biochim. Biophys. Acta 2004, 1664, 31–37. [Google Scholar] [CrossRef] [PubMed]
- Suomalainen, P.; Johans, C.; Soderlund, T.; Kinnunen, P.K. Surface activity profiling of drugs applied to the prediction of blood-brain barrier permeability. J. Med. Chem. 2004, 47, 1783–1788. [Google Scholar] [CrossRef] [PubMed]
- Di, L.; Kerns, E.H.; Fan, K.; McConnell, O.J.; Carter, G.T. High throughput artificial membrane permeability assay for blood-brain barrier. Eur. J. Med. Chem. 2003, 38, 223–232. [Google Scholar] [CrossRef]
- Hansen, A.H.; Sorensen, K.T.; Mathieu, R.; Serer, A.; Duelund, L.; Khandelia, H.; Hansen, P.L.; Simonsen, A.C. Propofol modulates the lipid phase transition and localizes near the headgroup of membranes. Chem. Phys. Lipids 2013, 175–176, 84–91. [Google Scholar] [CrossRef] [PubMed]
- Steinkopf, S.; Hanekam, L.; Schaathun, M.; Budnjo, A.; Haug, B.E.; Nerdal, W. Interaction of local anaesthetic articaine enantiomers with brain lipids: A Langmuir monolayer study. Eur. J. Pharm. Sci. 2012, 47, 394–401. [Google Scholar] [CrossRef] [PubMed]
- Martinac, B.; Adler, J.; Kung, C. Mechanosensitive ion channels of E. coli activated by amphipaths. Nature 1990, 348, 261–263. [Google Scholar] [CrossRef] [PubMed]
- Sheetz, M.P.; Singer, S.J. Biological membranes as bilayer couples. A molecular mechanism of drug-erythrocyte interactions. Proc. Natl. Acad. Sci. USA 1974, 71, 4457–4461. [Google Scholar] [CrossRef] [PubMed]
- Markin, V.S.; Martinac, B. Mechanosensitive ion channels as reporters of bilayer expansion. A theoretical model. Biophys. J. 1991, 60, 1120–1127. [Google Scholar] [CrossRef]
- Bass, R.B.; Strop, P.; Barclay, M.; Rees, D.C. Crystal structure of Escherichia coli MscS, a voltage-modulated and mechanosensitive channel. Science 2002, 298, 1582–1587. [Google Scholar] [CrossRef] [PubMed]
- Akitake, B.; Spelbrink, R.E.; Anishkin, A.; Killian, J.A.; de, K.B.; Sukharev, S. 2,2,2-Trifluoroethanol changes the transition kinetics and subunit interactions in the small bacterial mechanosensitive channel MscS. Biophys. J. 2007, 92, 2771–2784. [Google Scholar] [CrossRef] [PubMed]
- Kamaraju, K.; Sukharev, S. The membrane lateral pressure-perturbing capacity of parabens and their effects on the mechanosensitive channel directly correlate with hydrophobicity. Biochemistry 2008, 47, 10540–10550. [Google Scholar] [CrossRef] [PubMed]
- Kamaraju, K.; Smith, J.; Wang, J.; Roy, V.; Sintim, H.O.; Bentley, W.E.; Sukharev, S. Effects on membrane lateral pressure suggest permeation mechanisms for bacterial quorum signaling molecules. Biochemistry 2011, 50, 6983–6993. [Google Scholar] [CrossRef] [PubMed]
- Brown, A.K.; Taylor, R.C.; Bhatt, A.; Futterer, K.; Besra, G.S. Platensimycin activity against mycobacterial β-ketoacyl-ACP synthases. PLoS ONE 2009, 4, e6306. [Google Scholar] [CrossRef] [PubMed]
- Wang, J.; Soisson, S.M.; Young, K.; Shoop, W.; Kodali, S.; Galgoci, A.; Painter, R.; Parthasarathy, G.; Tang, Y.S.; Cummings, R.; et al. Platensimycin is a selective FabF inhibitor with potent antibiotic properties. Nature 2006, 441, 358–361. [Google Scholar] [CrossRef] [PubMed]
- Wright, H.T.; Reynolds, K.A. Antibacterial targets in fatty acid biosynthesis. Curr. Opin. Microbiol. 2007, 10, 447–453. [Google Scholar] [CrossRef] [PubMed]
- Wang, J.; Sintim, H.O. Dialkylamino-2,4-dihydroxybenzoic acids as easily synthesized analogues of platensimycin and platencin with comparable antibacterial properties. Chemistry 2011, 17, 3352–3357. [Google Scholar] [CrossRef] [PubMed]
- Belyy, V.; Kamaraju, K.; Akitake, B.; Anishkin, A.; Sukharev, S. Adaptive behavior of bacterial mechanosensitive channels is coupled to membrane mechanics. J. Gen. Physiol. 2010, 135, 641–652. [Google Scholar] [CrossRef] [PubMed]
- Kamaraju, K.; Belyy, V.; Rowe, I.; Anishkin, A.; Sukharev, S. The pathway and spatial scale for MscS inactivation. J. Gen. Physiol. 2011, 138, 49–57. [Google Scholar] [CrossRef] [PubMed]
- Trott, O.; Olson, A.J. AutoDock Vina: Improving the speed and accuracy of docking with a new scoring function, efficient optimization, and multithreading. J. Comput. Chem. 2010, 31, 455–461. [Google Scholar] [CrossRef] [PubMed]
- Tetko, I.V.; Poda, G.I. Application of ALOGPS 2.1 to predict log D distribution coefficient for Pfizer proprietary compounds. J. Med. Chem. 2004, 47, 5601–5604. [Google Scholar] [CrossRef] [PubMed]
- Molinspiration Home Page. Free Web Tools for Cheninformatics Community. Available online: http://www. molinspiration.com (acsessed on 20 May 2014).
- Swain, M. Chemicalize. Org. J. Chem. Inf. Model. 2012, 52, 613–615. [Google Scholar] [CrossRef]
- Demel, R.A.; van Deenen, L.L.M.; Pethica, B.A. Monolayer interactions of phospholipids and cholesterol. Biochim. Biophys. Acta (BBA) Biomembr. 1967, 135, 11–19. [Google Scholar] [CrossRef]
- Smaby, J.M.; Brockman, H.L.; Brown, R.E. Cholesterol’s interfacial interactions with sphingomyelins and phosphatidylcholines: Hydrocarbon chain structure determines the magnitude of condensation. Biochemistry 1994, 33, 9135–9142. [Google Scholar] [CrossRef] [PubMed]
- Baoukina, S.; Marrink, S.J.; Tieleman, D.P. Lateral pressure profiles in lipid monolayers. Faraday Discuss. 2010, 144, 393–409. [Google Scholar] [CrossRef] [PubMed]
- Seelig, A. Local anesthetics and pressure: A comparison of dibucaine binding to lipid monolayers and bilayers. Biochim. Biophys. Acta 1987, 899, 196–204. [Google Scholar] [CrossRef]
- Seelig, A. The use of monolayers for simple and quantitative analysis of lipid-drug interactions exemplified with dibucaine and substance P. Cell Biol. Int. Rep. 1990, 14, 369–380. [Google Scholar] [CrossRef]
- Seelig, A. Interaction of a substance P agonist and of substance P antagonists with lipid membranes. A thermodynamic analysis. Biochemistry 1992, 31, 2897–2904. [Google Scholar] [CrossRef] [PubMed]
- Anishkin, A.; Akitake, B.; Sukharev, S. Characterization of the resting MscS: Modeling and analysis of the closed bacterial mechanosensitive channel of small conductance. Biophys. J. 2008, 94, 1252–1266. [Google Scholar] [CrossRef] [PubMed]
- Thuren, T.; Virtanen, J.A.; Kinnunen, P.K. Estimation of the equilibrium lateral pressure in 1-palmitoyl-2-[6(pyren-1-yl)]hexanoyl-glycerophospholipid liposomes. Chem. Phys. Lipids 1986, 41, 329–334. [Google Scholar] [CrossRef]
- Chandler, D. Interfaces and the driving force of hydrophobic assembly. Nature 2005, 437, 640–647. [Google Scholar] [CrossRef] [PubMed]
- Wang, J.; Lee, V.; Sintim, H.O. Efforts towards the identification of simpler platensimycin analogues—The total synthesis of oxazinidinyl platensimycin. Chemistry 2009, 15, 2747–2750. [Google Scholar] [CrossRef] [PubMed]
- Frisch, M.J.; Schlegel, G.W.T.H.B.; Scuseria, G.E.; Robb, M.A.; Cheeseman, J.R.; Scalmani, G.; Barone, V.; Mennucci, B.; Nakatsuji, G.A.P.H.; Caricato, M.; et al. Gaussian 09, Revision A.02; Gaussian, Inc.: Wallingford, CT, USA, 2009. [Google Scholar]
- Levina, N.; Totemeyer, S.; Stokes, N.R.; Louis, P.; Jones, M.A.; Booth, I.R. Protection of Escherichia coli cells against extreme turgor by activation of MscS and MscL mechanosensitive channels: Identification of genes required for MscS activity. EMBO J. 1999, 18, 1730–1737. [Google Scholar] [CrossRef] [PubMed]
- Akitake, B.; Anishkin, A.; Sukharev, S. The “dashpot” mechanism of stretch-dependent gating in MscS. J. Gen. Physiol. 2005, 125, 143–154. [Google Scholar] [CrossRef] [PubMed]
- Martinac, B.; Buechner, M.; Delcour, A.H.; Adler, J.; Kung, C. Pressure-sensitive ion channel in Escherichia coli. Proc. Natl. Acad. Sci. USA 1987, 84, 2297–2301. [Google Scholar] [CrossRef] [PubMed]
- Yoshimura, K.; Batiza, A.; Kung, C. Chemically charging the pore constriction opens the mechanosensitive channel MscL. Biophys. J. 2001, 80, 2198–2206. [Google Scholar] [CrossRef]
- Gerebtzoff, G.; Li-Blatter, X.; Fischer, H.; Frentzel, A.; Seelig, A. Halogenation of drugs enhances membrane binding and permeation. Chembiochem. Eur. J. Chem. Biol. 2004, 5, 676–684. [Google Scholar] [CrossRef] [PubMed]
© 2015 by the authors; licensee MDPI, Basel, Switzerland. This article is an open access article distributed under the terms and conditions of the Creative Commons Attribution license (http://creativecommons.org/licenses/by/4.0/).
Share and Cite
Rowe, I.; Guo, M.; Yasmann, A.; Cember, A.; Sintim, H.O.; Sukharev, S. Membrane Affinity of Platensimycin and Its Dialkylamine Analogs. Int. J. Mol. Sci. 2015, 16, 17909-17932. https://doi.org/10.3390/ijms160817909
Rowe I, Guo M, Yasmann A, Cember A, Sintim HO, Sukharev S. Membrane Affinity of Platensimycin and Its Dialkylamine Analogs. International Journal of Molecular Sciences. 2015; 16(8):17909-17932. https://doi.org/10.3390/ijms160817909
Chicago/Turabian StyleRowe, Ian, Min Guo, Anthony Yasmann, Abigail Cember, Herman O. Sintim, and Sergei Sukharev. 2015. "Membrane Affinity of Platensimycin and Its Dialkylamine Analogs" International Journal of Molecular Sciences 16, no. 8: 17909-17932. https://doi.org/10.3390/ijms160817909
APA StyleRowe, I., Guo, M., Yasmann, A., Cember, A., Sintim, H. O., & Sukharev, S. (2015). Membrane Affinity of Platensimycin and Its Dialkylamine Analogs. International Journal of Molecular Sciences, 16(8), 17909-17932. https://doi.org/10.3390/ijms160817909