
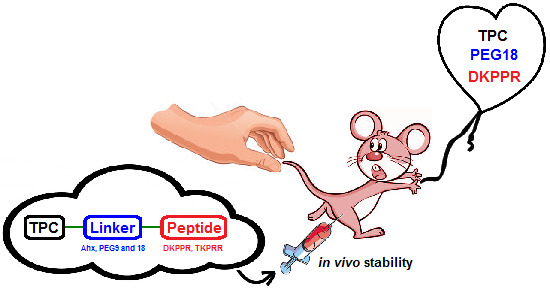
New Peptide-Conjugated Chlorin-Type Photosensitizer Targeting Neuropilin-1 for Anti-Vascular Targeted Photodynamic Therapy


 ,
,
Abstract
:
1. Introduction
2. Results
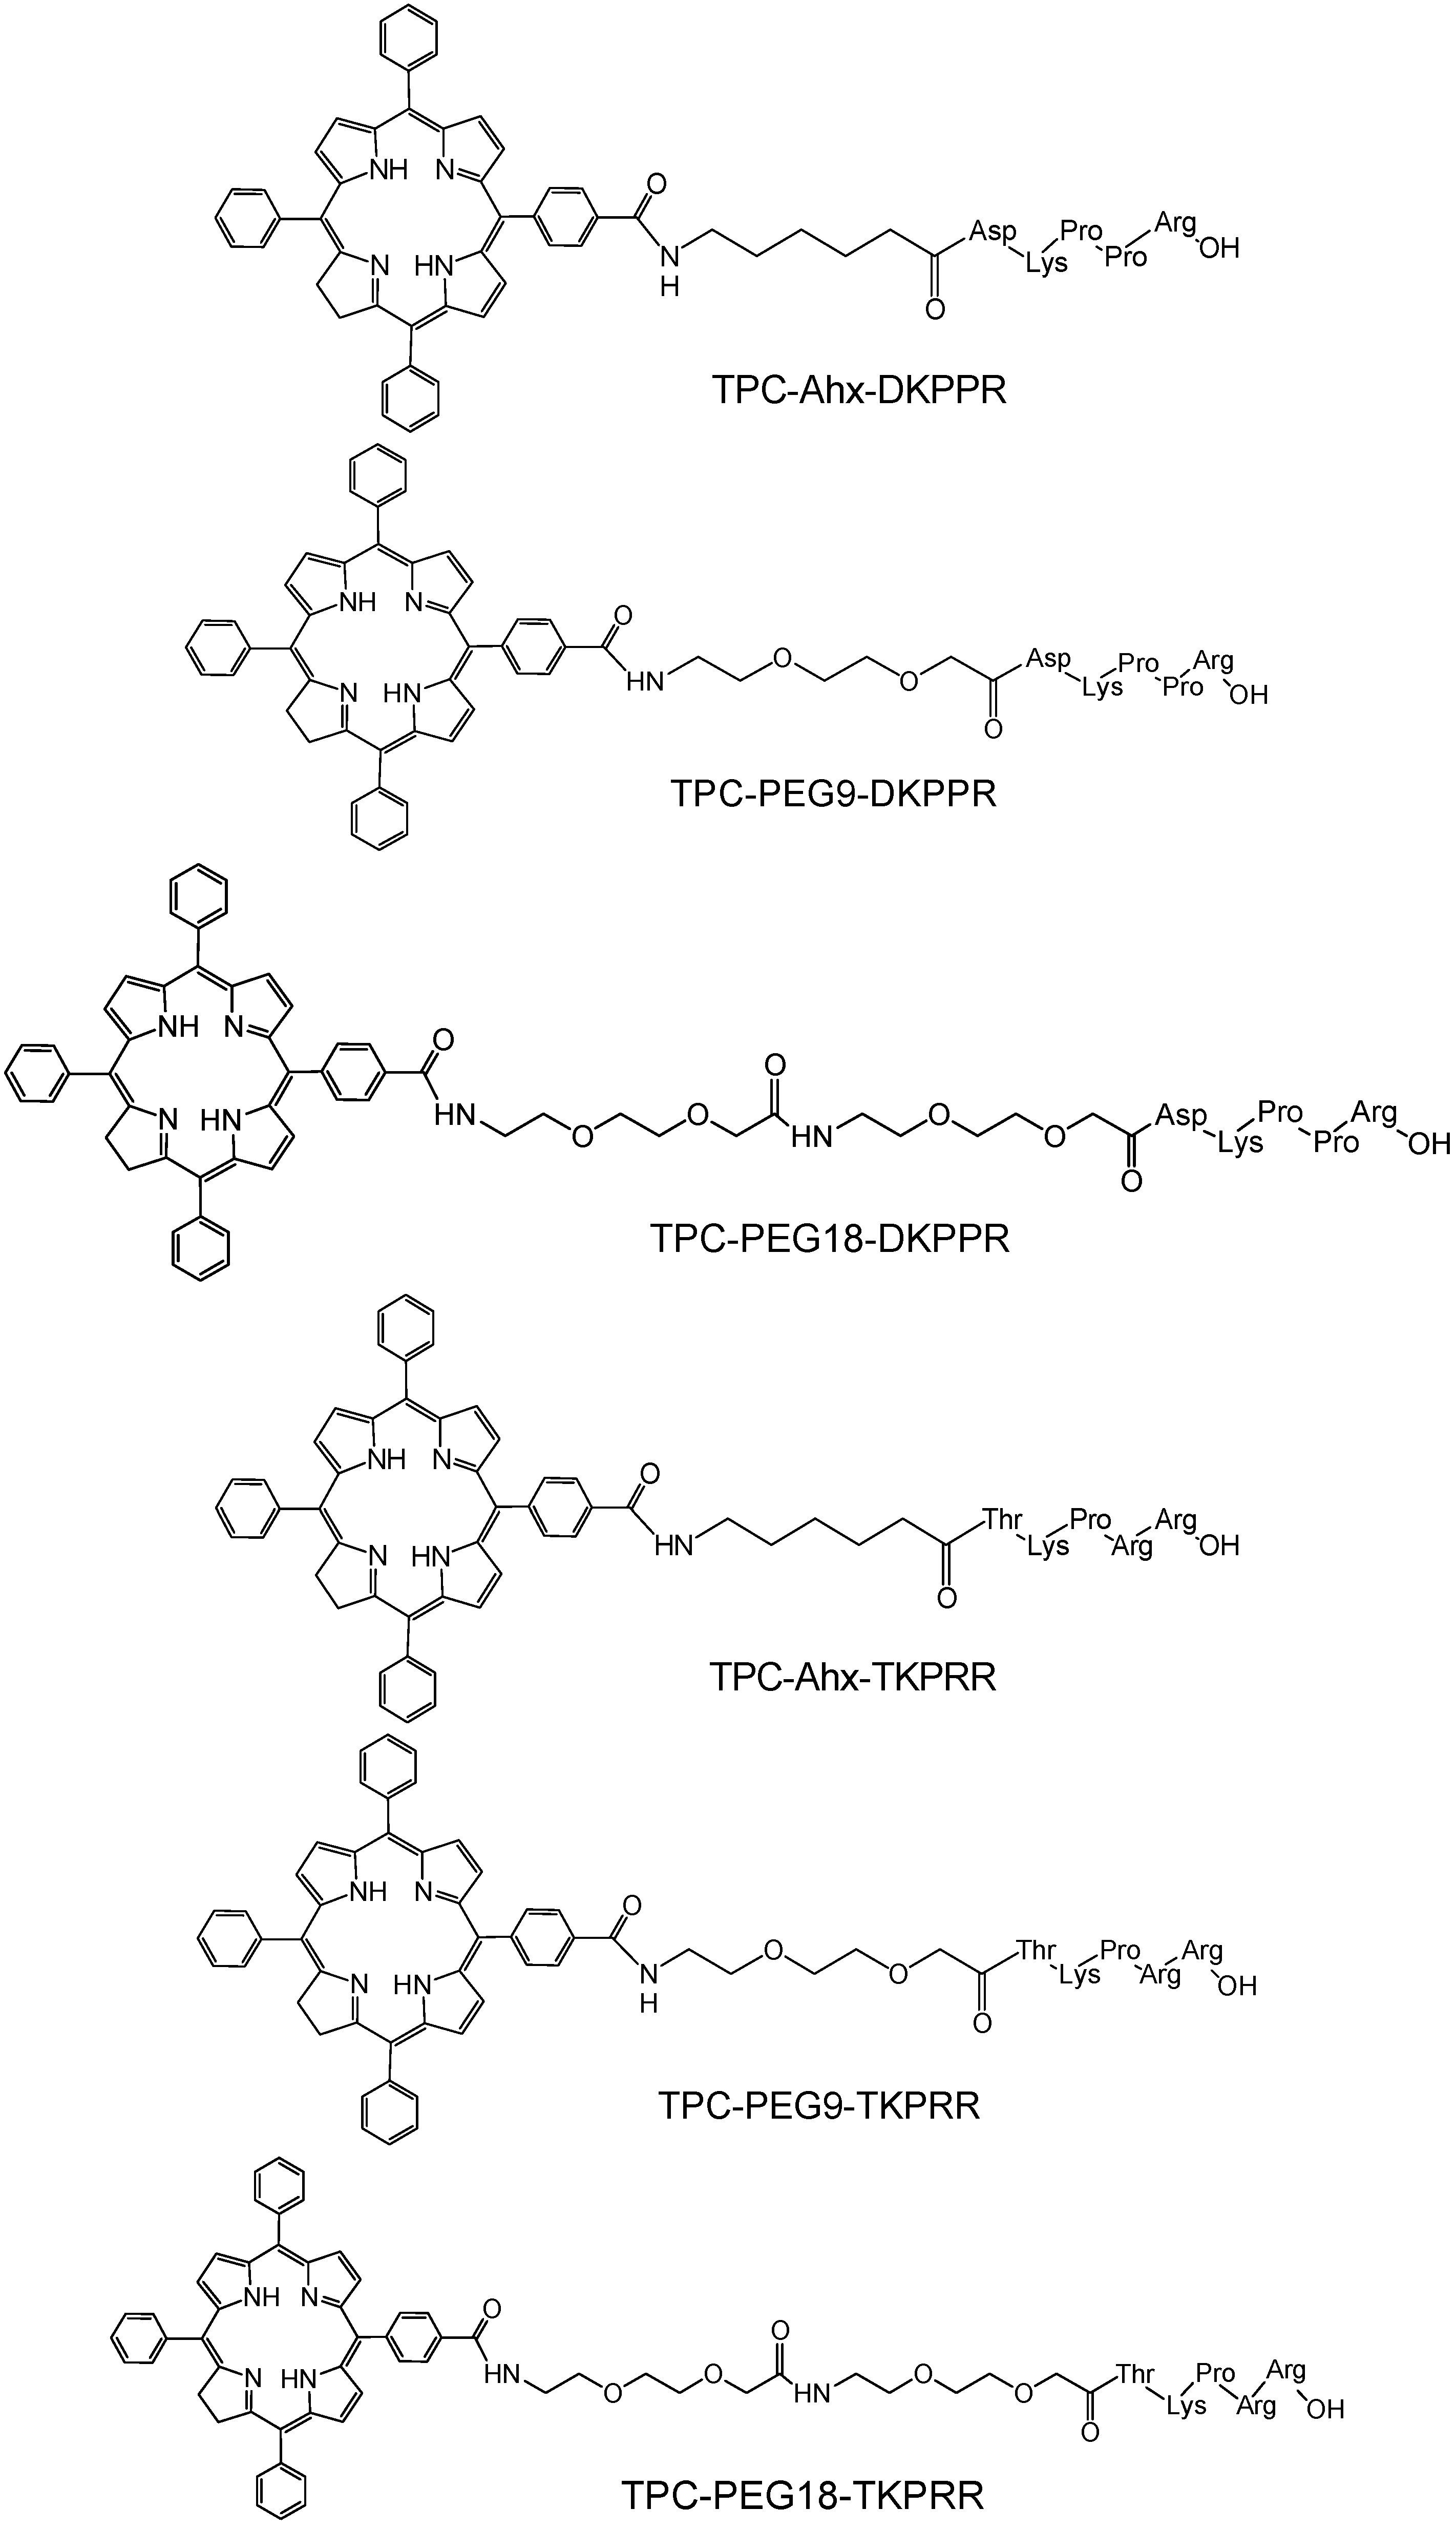
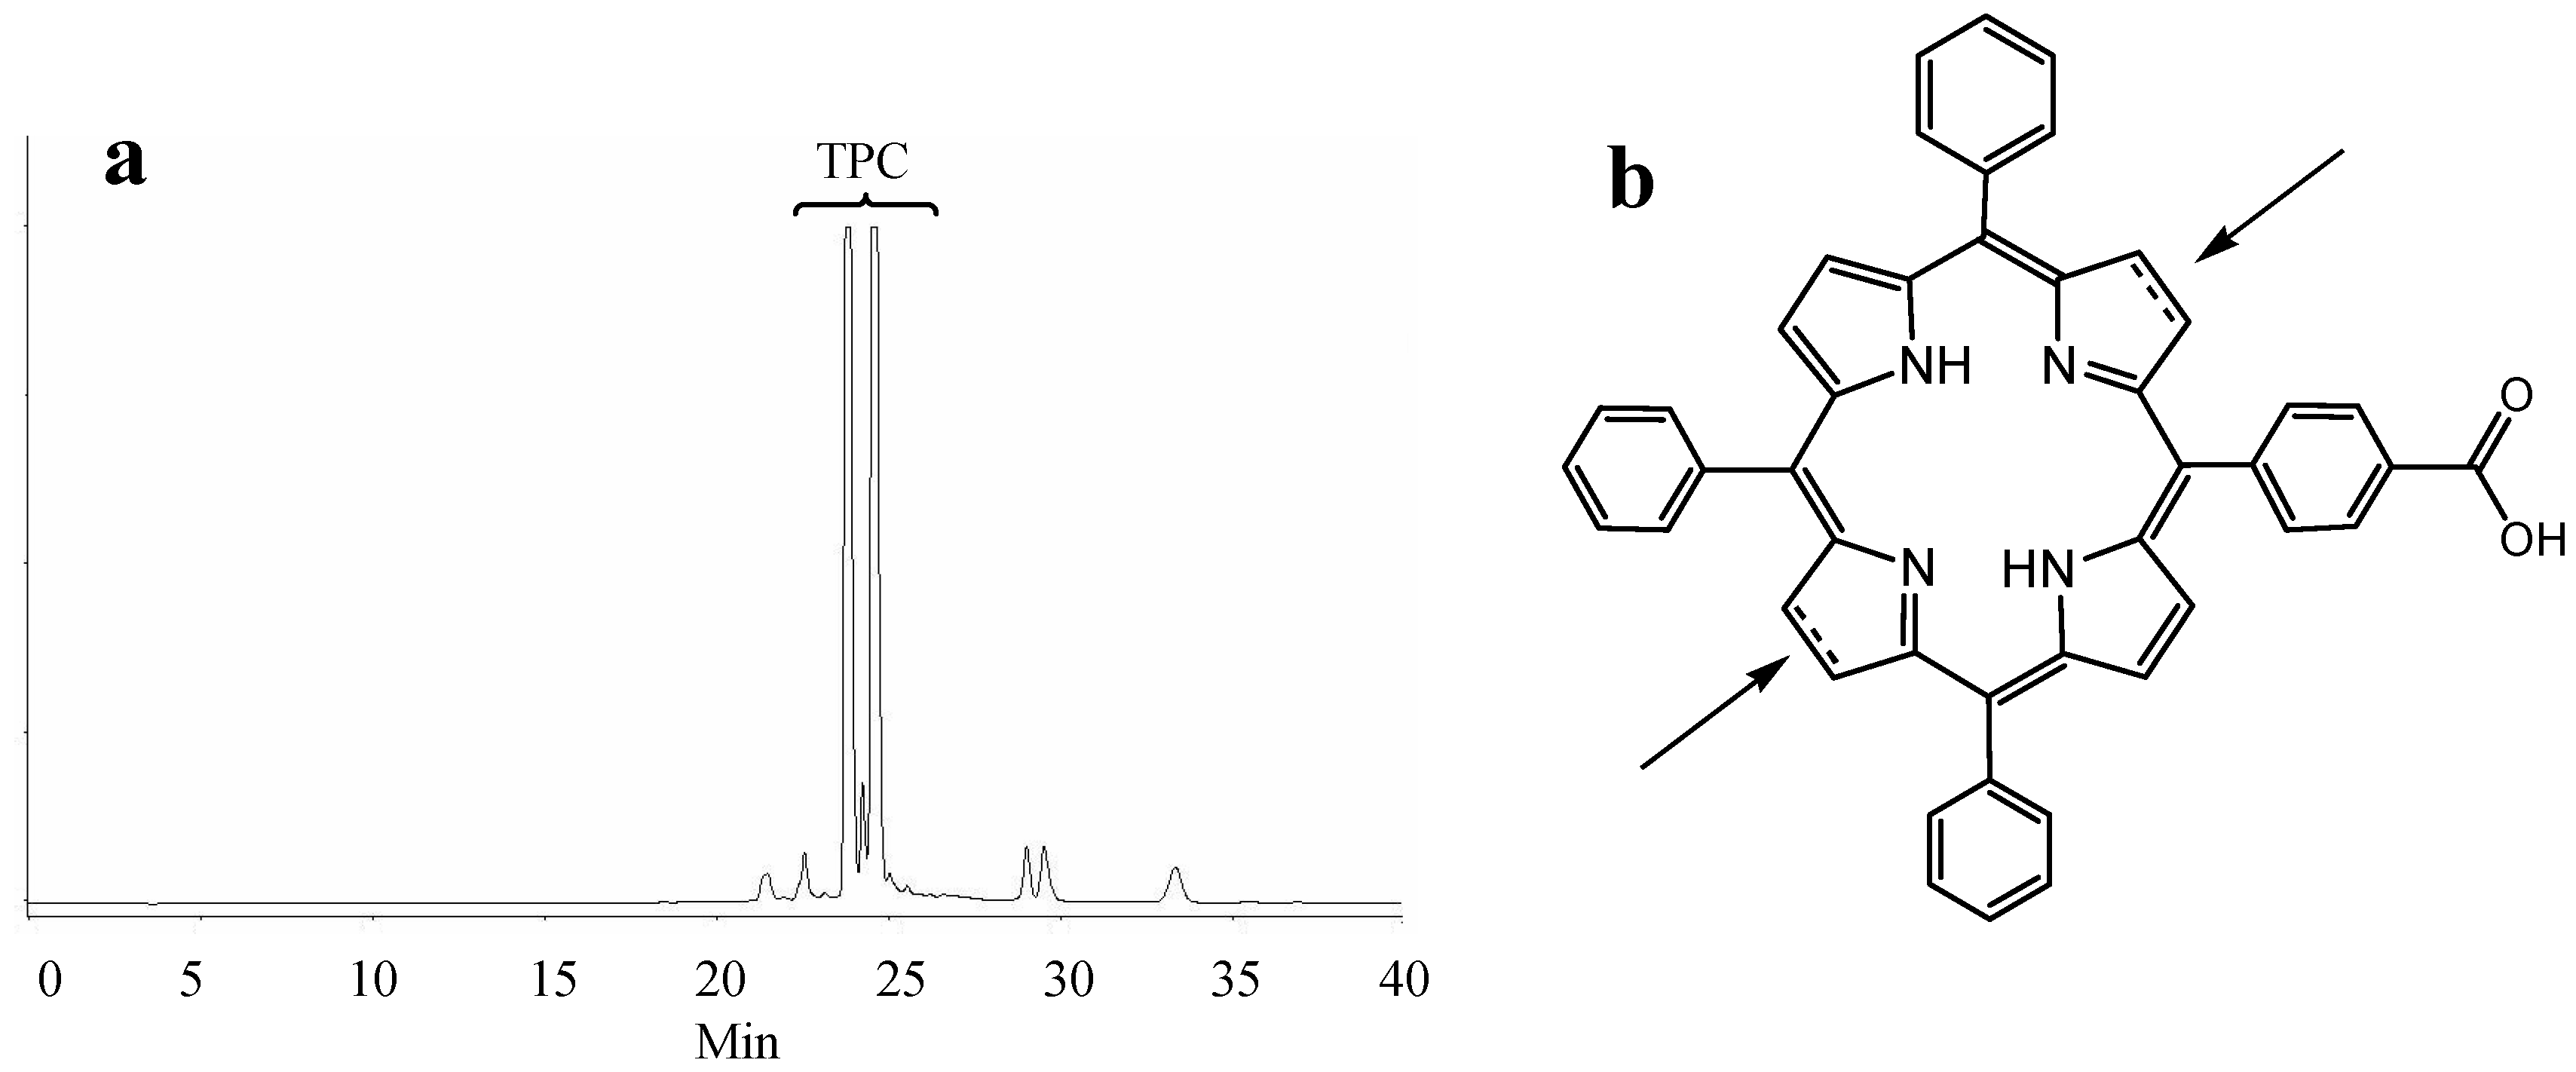
2.1. Synthesis of Novel TPC (5-(4-Carboxyphenyl)-10,15,20-triphenyl chlorin)–Peptide Conjugates


| Conjugate | [M + 2H]2+ | [M + 3H]3+ | ||
|---|---|---|---|---|
| Mass Theory | Experimental | Mass Theory | Experimental | |
| TPC-Ahx-DKPPR | 684.8 | 685 | 456.9 | 457 |
| TPC-Peg9-DKPPR | 700.8 | 700 | 467.5 | 467 |
| TPC-PEG18-DKPPR * | 772.9 | 773 | 515.6 | 516 |
| TPC-Ahx-TKPRR | 707.3 | 707 | 471.9 | 472 |
| TPC-Peg9-TKPRR | 723.3 | 723 | 482.6 | 482 |
| TPC-Peg18-TKPRR * | 795.9 | 795 | 530.9 | 530 |
2.2. Distribution Coefficient
| Sample | Shake Flask Method | Polarity (Methanol/Water), (min) | ||
|---|---|---|---|---|
| Distribution Coefficient, D | Peak 1 a | Peak 2 b | Average | |
| TPC | 2.61 ± 0.2 | 23.88 | 24.61 | 24.18 |
| TPC–Ahx–ATWLPPR | 2.61 ± 0.2 | 23.66 | 24.41 | 24.05 |
| TPC–Ahx–DKPPR | 1.00 ± 0.2 | 18.75 | 19.74 | 19.35 |
| TPC–PEG9–DKPPR | 0.80 ± 0.2 | 18.53 | 19.57 | 19.05 |
| TPC–PEG18–DKPPR | 0.31 ± 0.2 | 17.41 | 18.41 | 18.02 |
| TPC–Ahx–TKPRR | 0.39 ± 0.2 | 16.77 | 17.76 | 17.41 |
| TPC–PEG9–TKPRR | 0.01 ± 0.2 | 16.68 | 17.72 | 17.37 |
| TPC–PEG18–TKPRR | −0.38 ± 0.2 | 16.29 | 17.33 | 16.94 |
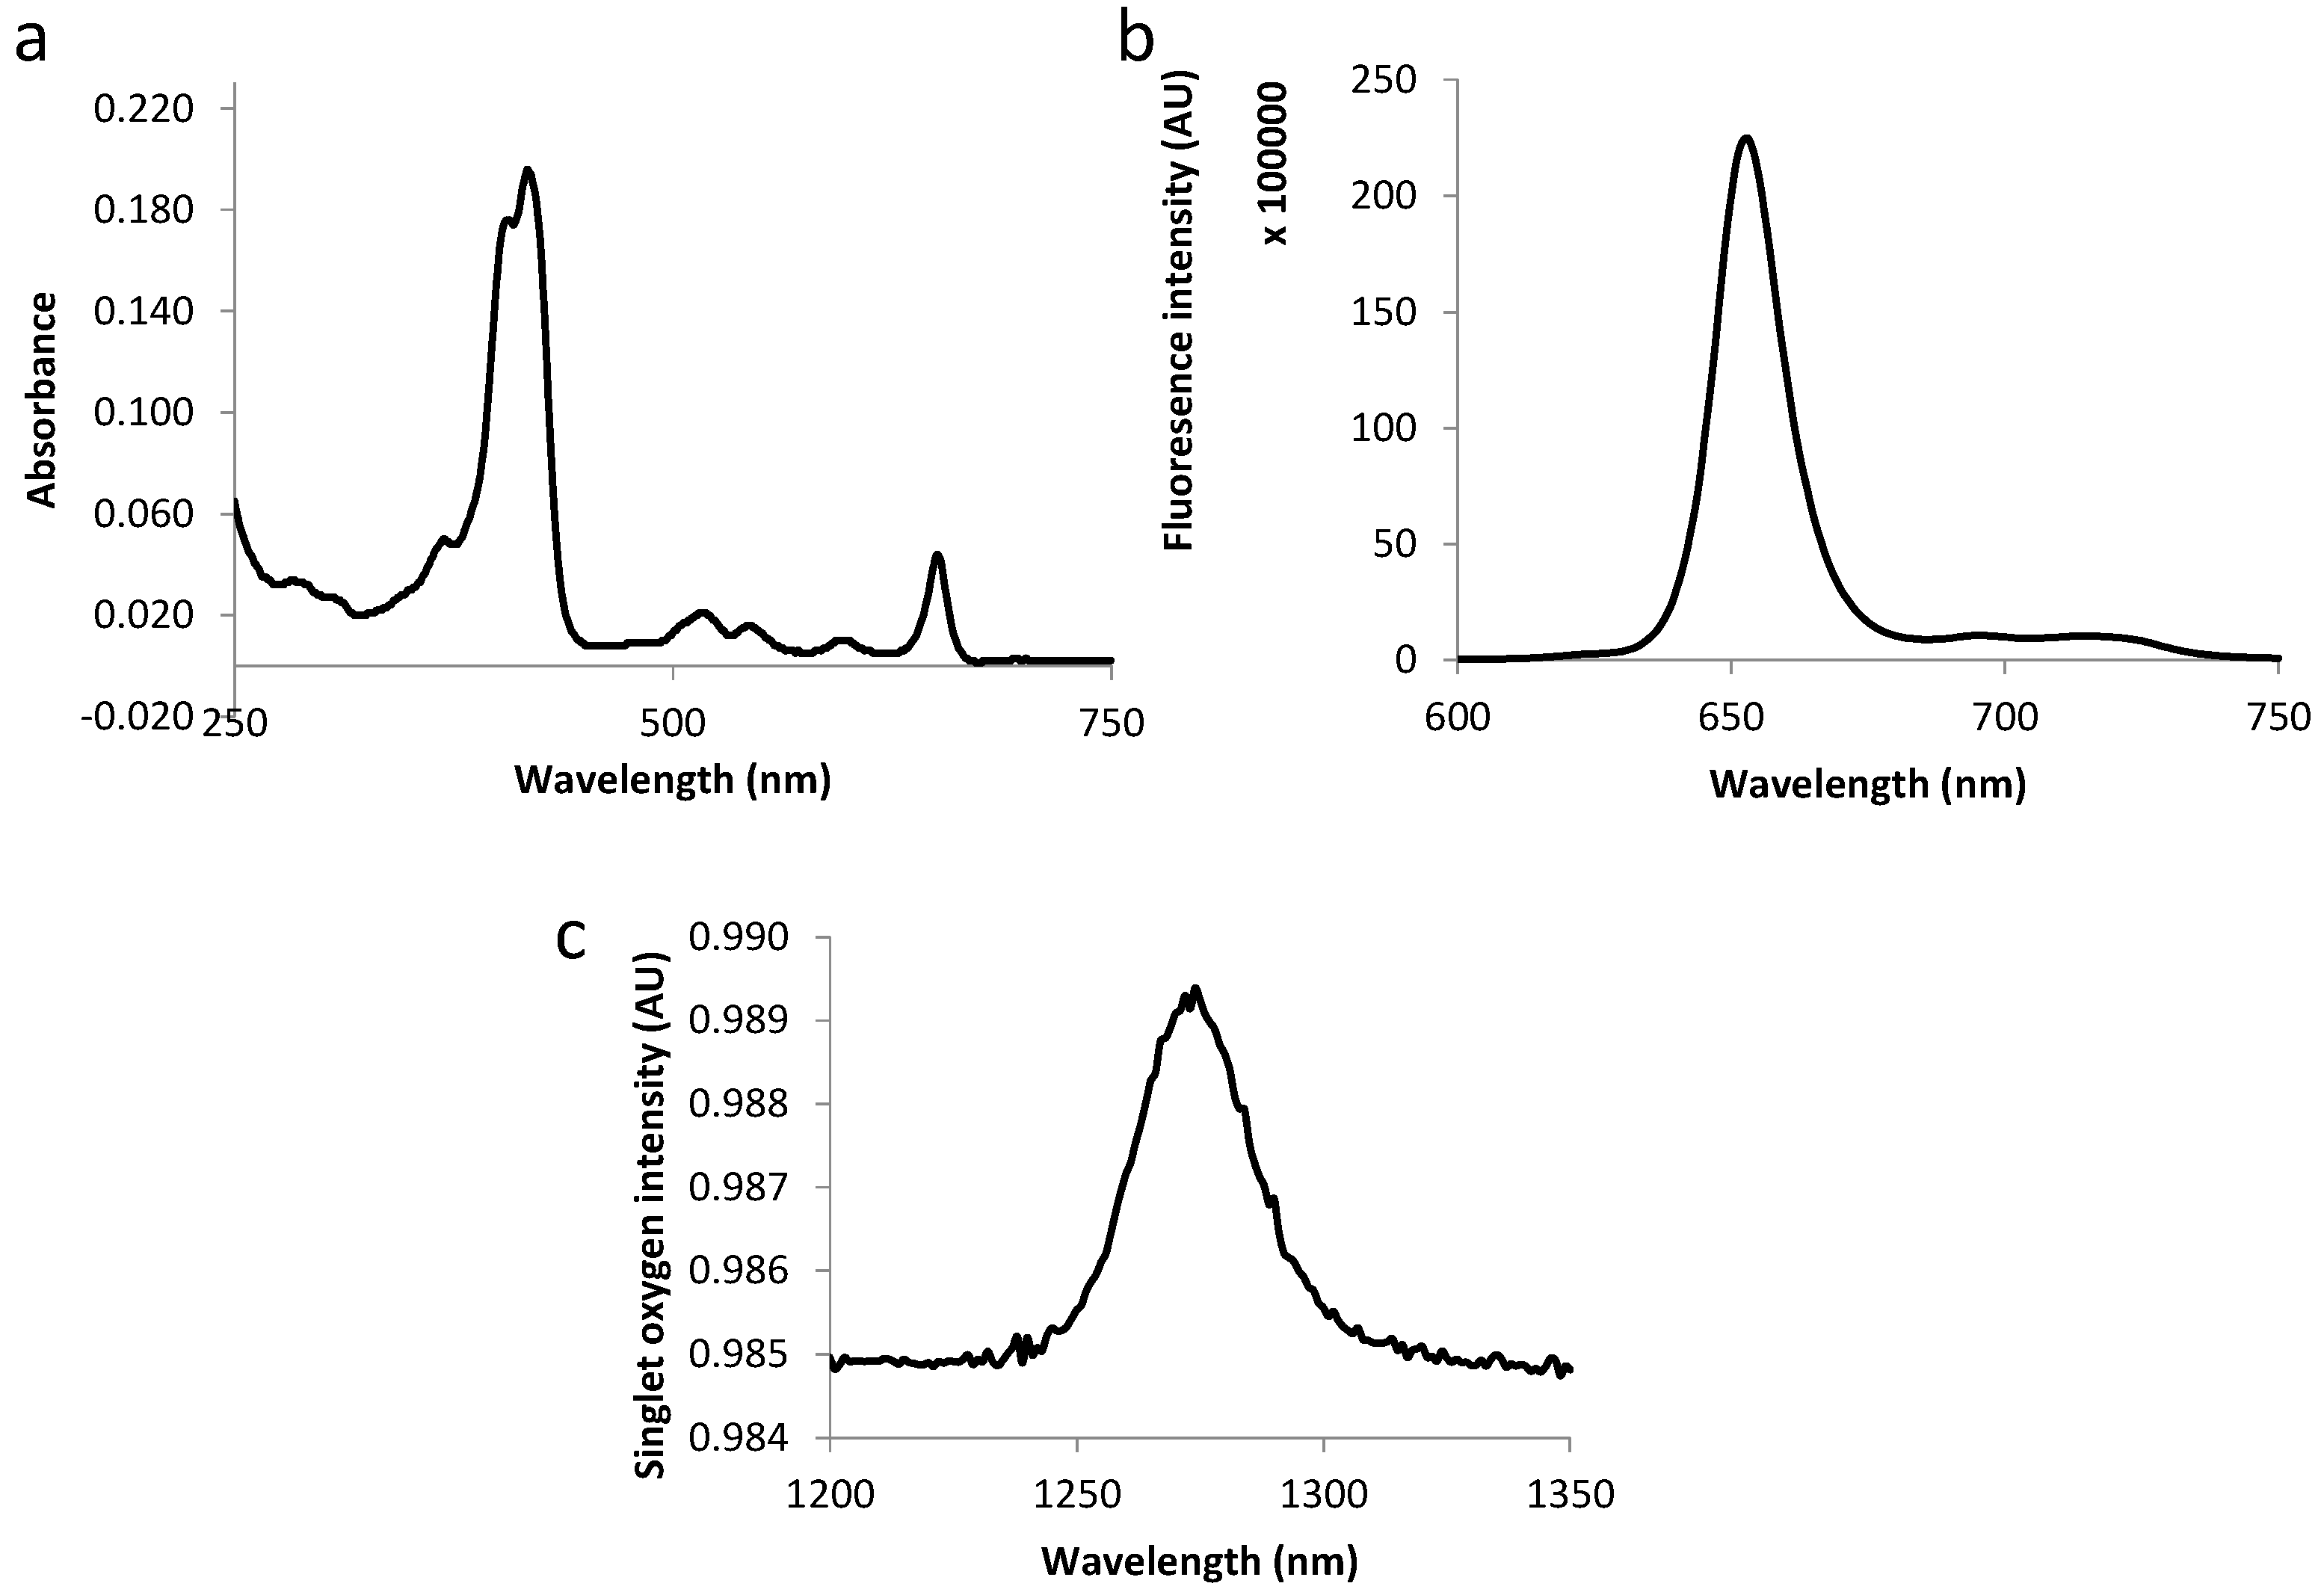
2.3. Photophysical Characterization of Novel Peptides–TPC Conjugates
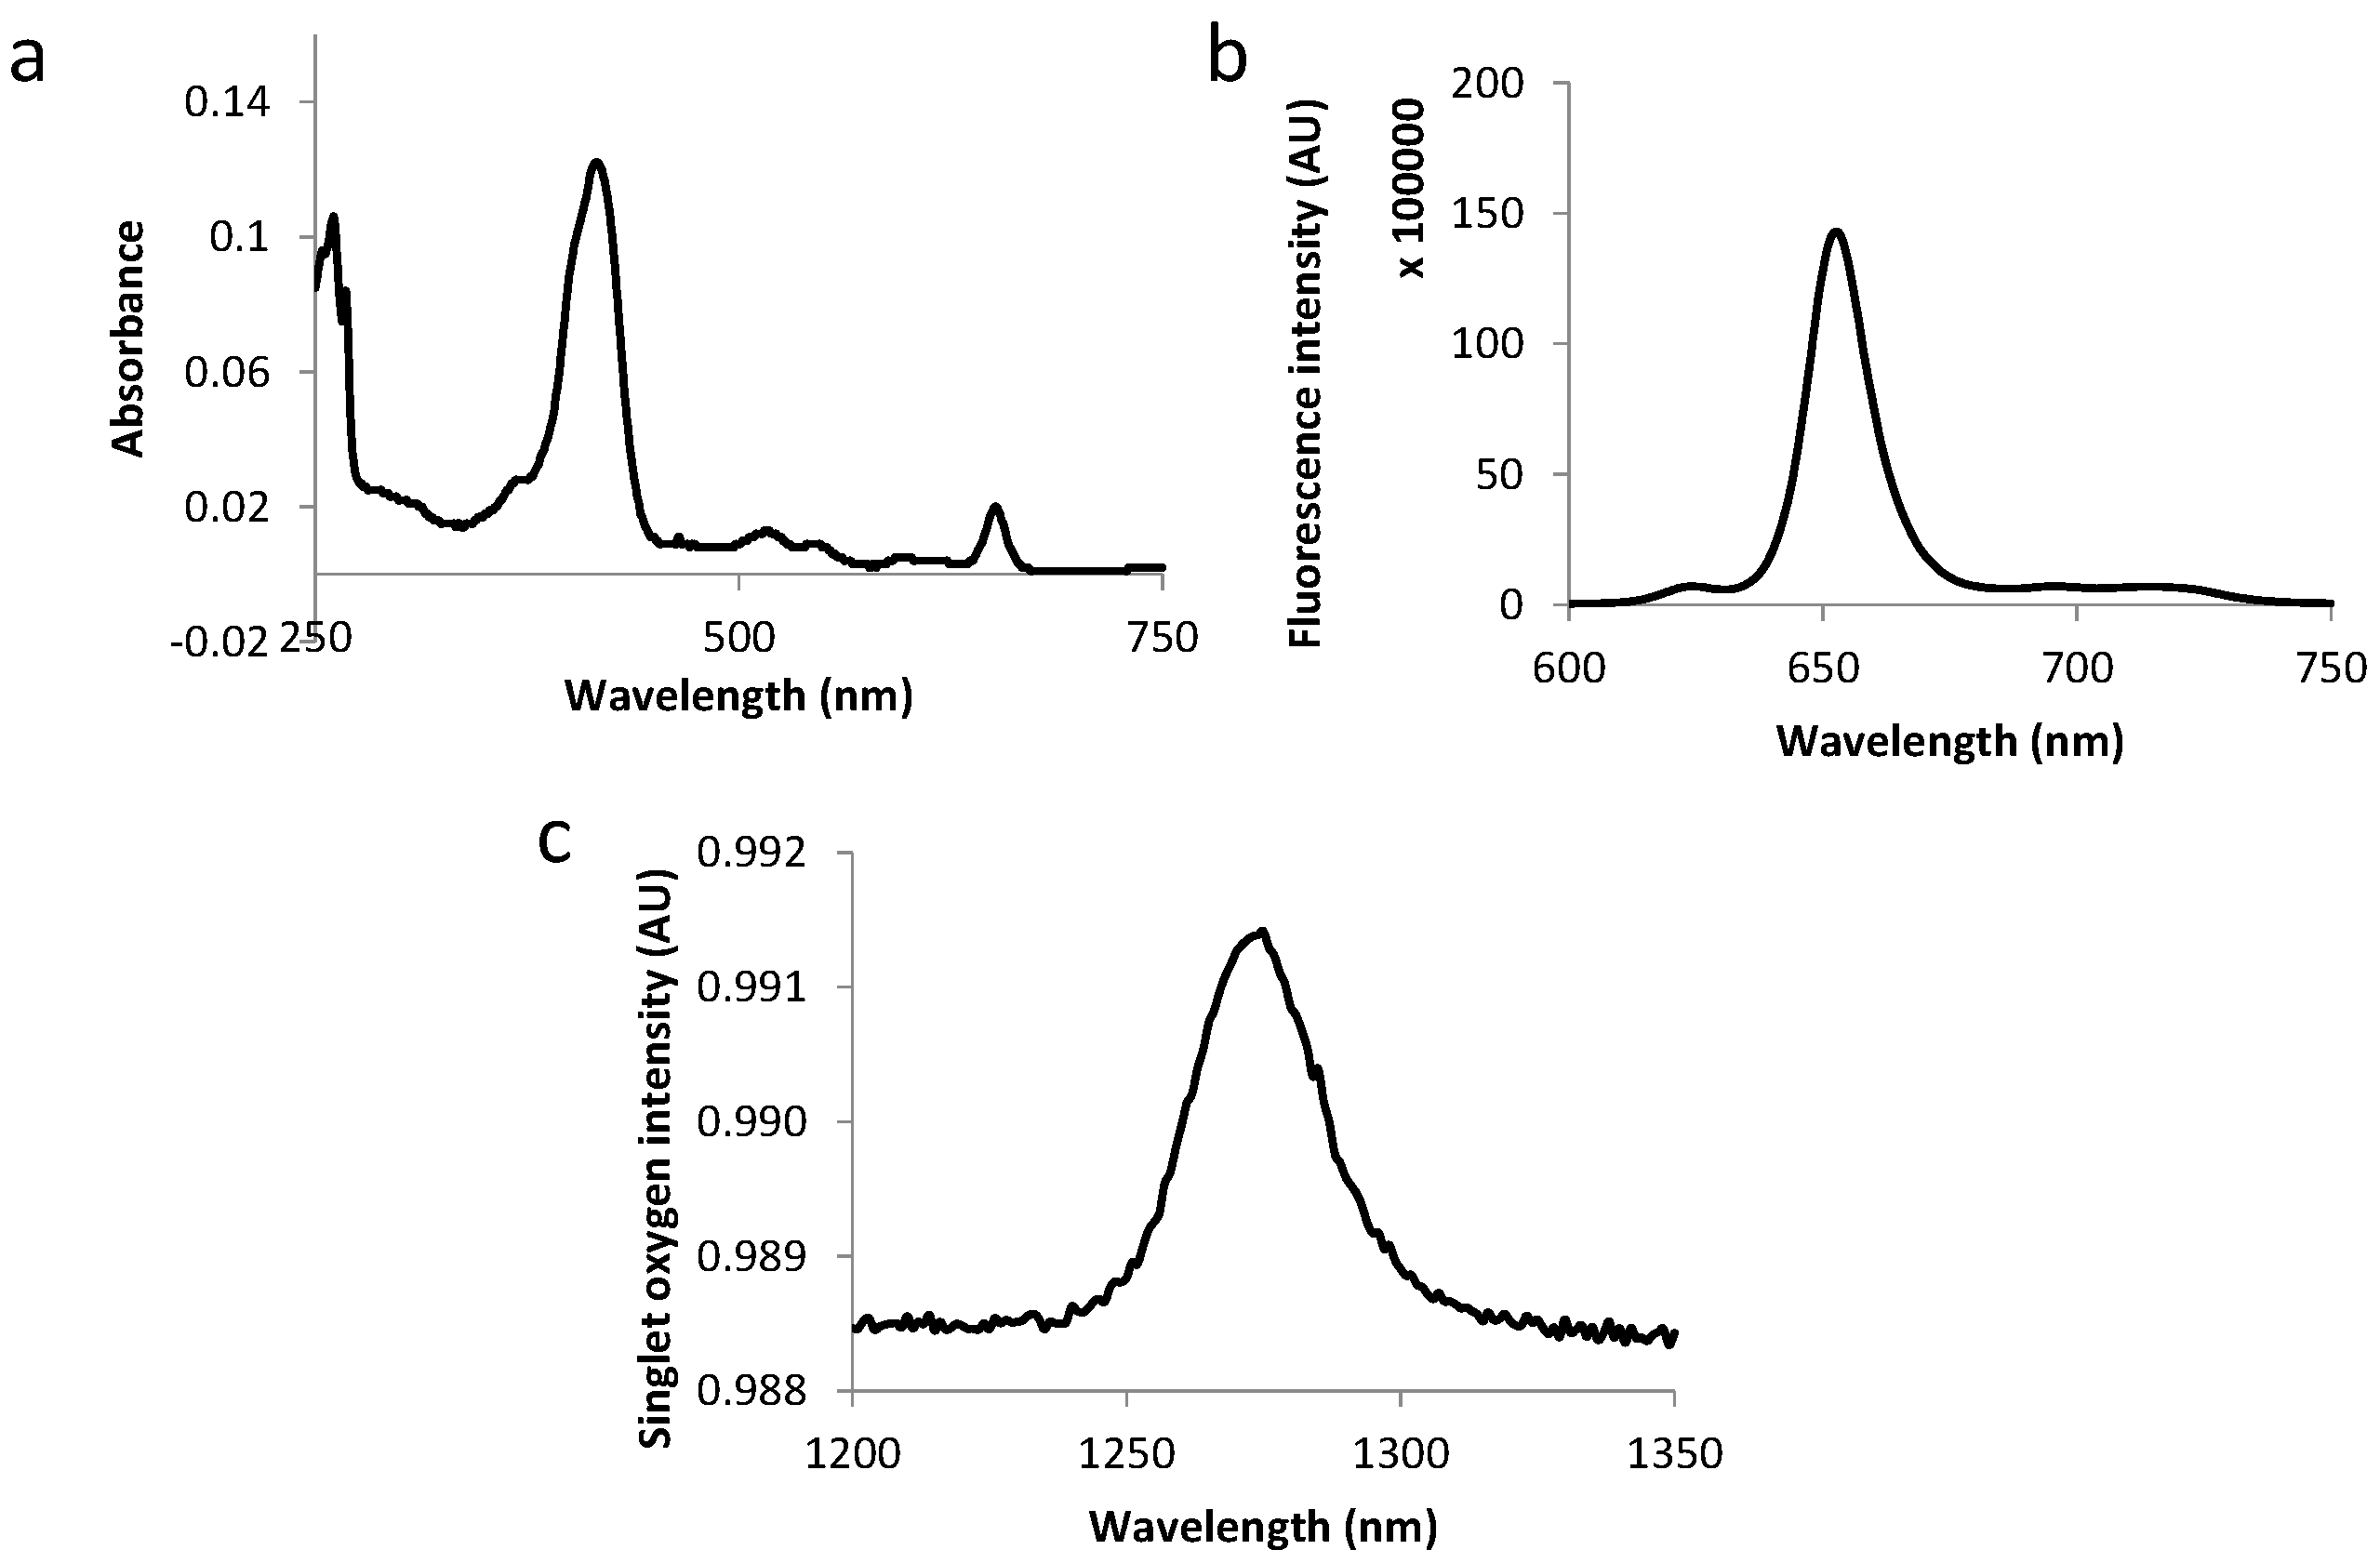
| Compound | Molar Extinction Coefficient (L·M−1·cm−1) | Fluorescence and Singlet Oxygen Quantum Yields | |||||
|---|---|---|---|---|---|---|---|
| Soret | QIV | QIII | QII | QI | |||
| ε415 | ε516 | ε543 | ε598 | ε650 | Φf | Φ∆ | |
| TPC | 76.00 | 8.00 | 5.00 | 4.00 | 12.00 | 0.18 | 0.47 |
| TPC–Ahx–ATWLPPR | 74.00 | 6.80 | 4.90 | 2.60 | 12.00 | 0.18 | 0.39 |
| TPC–Ahx–DKPPR | 68.00 | 6.60 | 4.90 | 2.80 | 14.00 | 0.23 | 0.68 |
| TPC–PEG9–DKPPR | 92.80 | 7.40 | 5.60 | 3.20 | 13.00 | 0.30 | 0.70 |
| TPC–PEG18–DKPPR | 62.40 | 6.40 | 4.70 | 2.80 | 13.20 | 0.30 | 0.69 |
| TPC–Ahx–TKPRR | 73.00 | 4.50 | 3.50 | 2.20 | 10.00 | 0.22 | 0.70 |
| TPC–PEG9–TKPRR | 79.00 | 6.40 | 4.50 | 2.80 | 13.90 | 0.25 | 0.67 |
| TPC–PEG18–TKPRR | 88.30 | 6.20 | 4.30 | 2.40 | 14.90 | 0.27 | 0.67 |
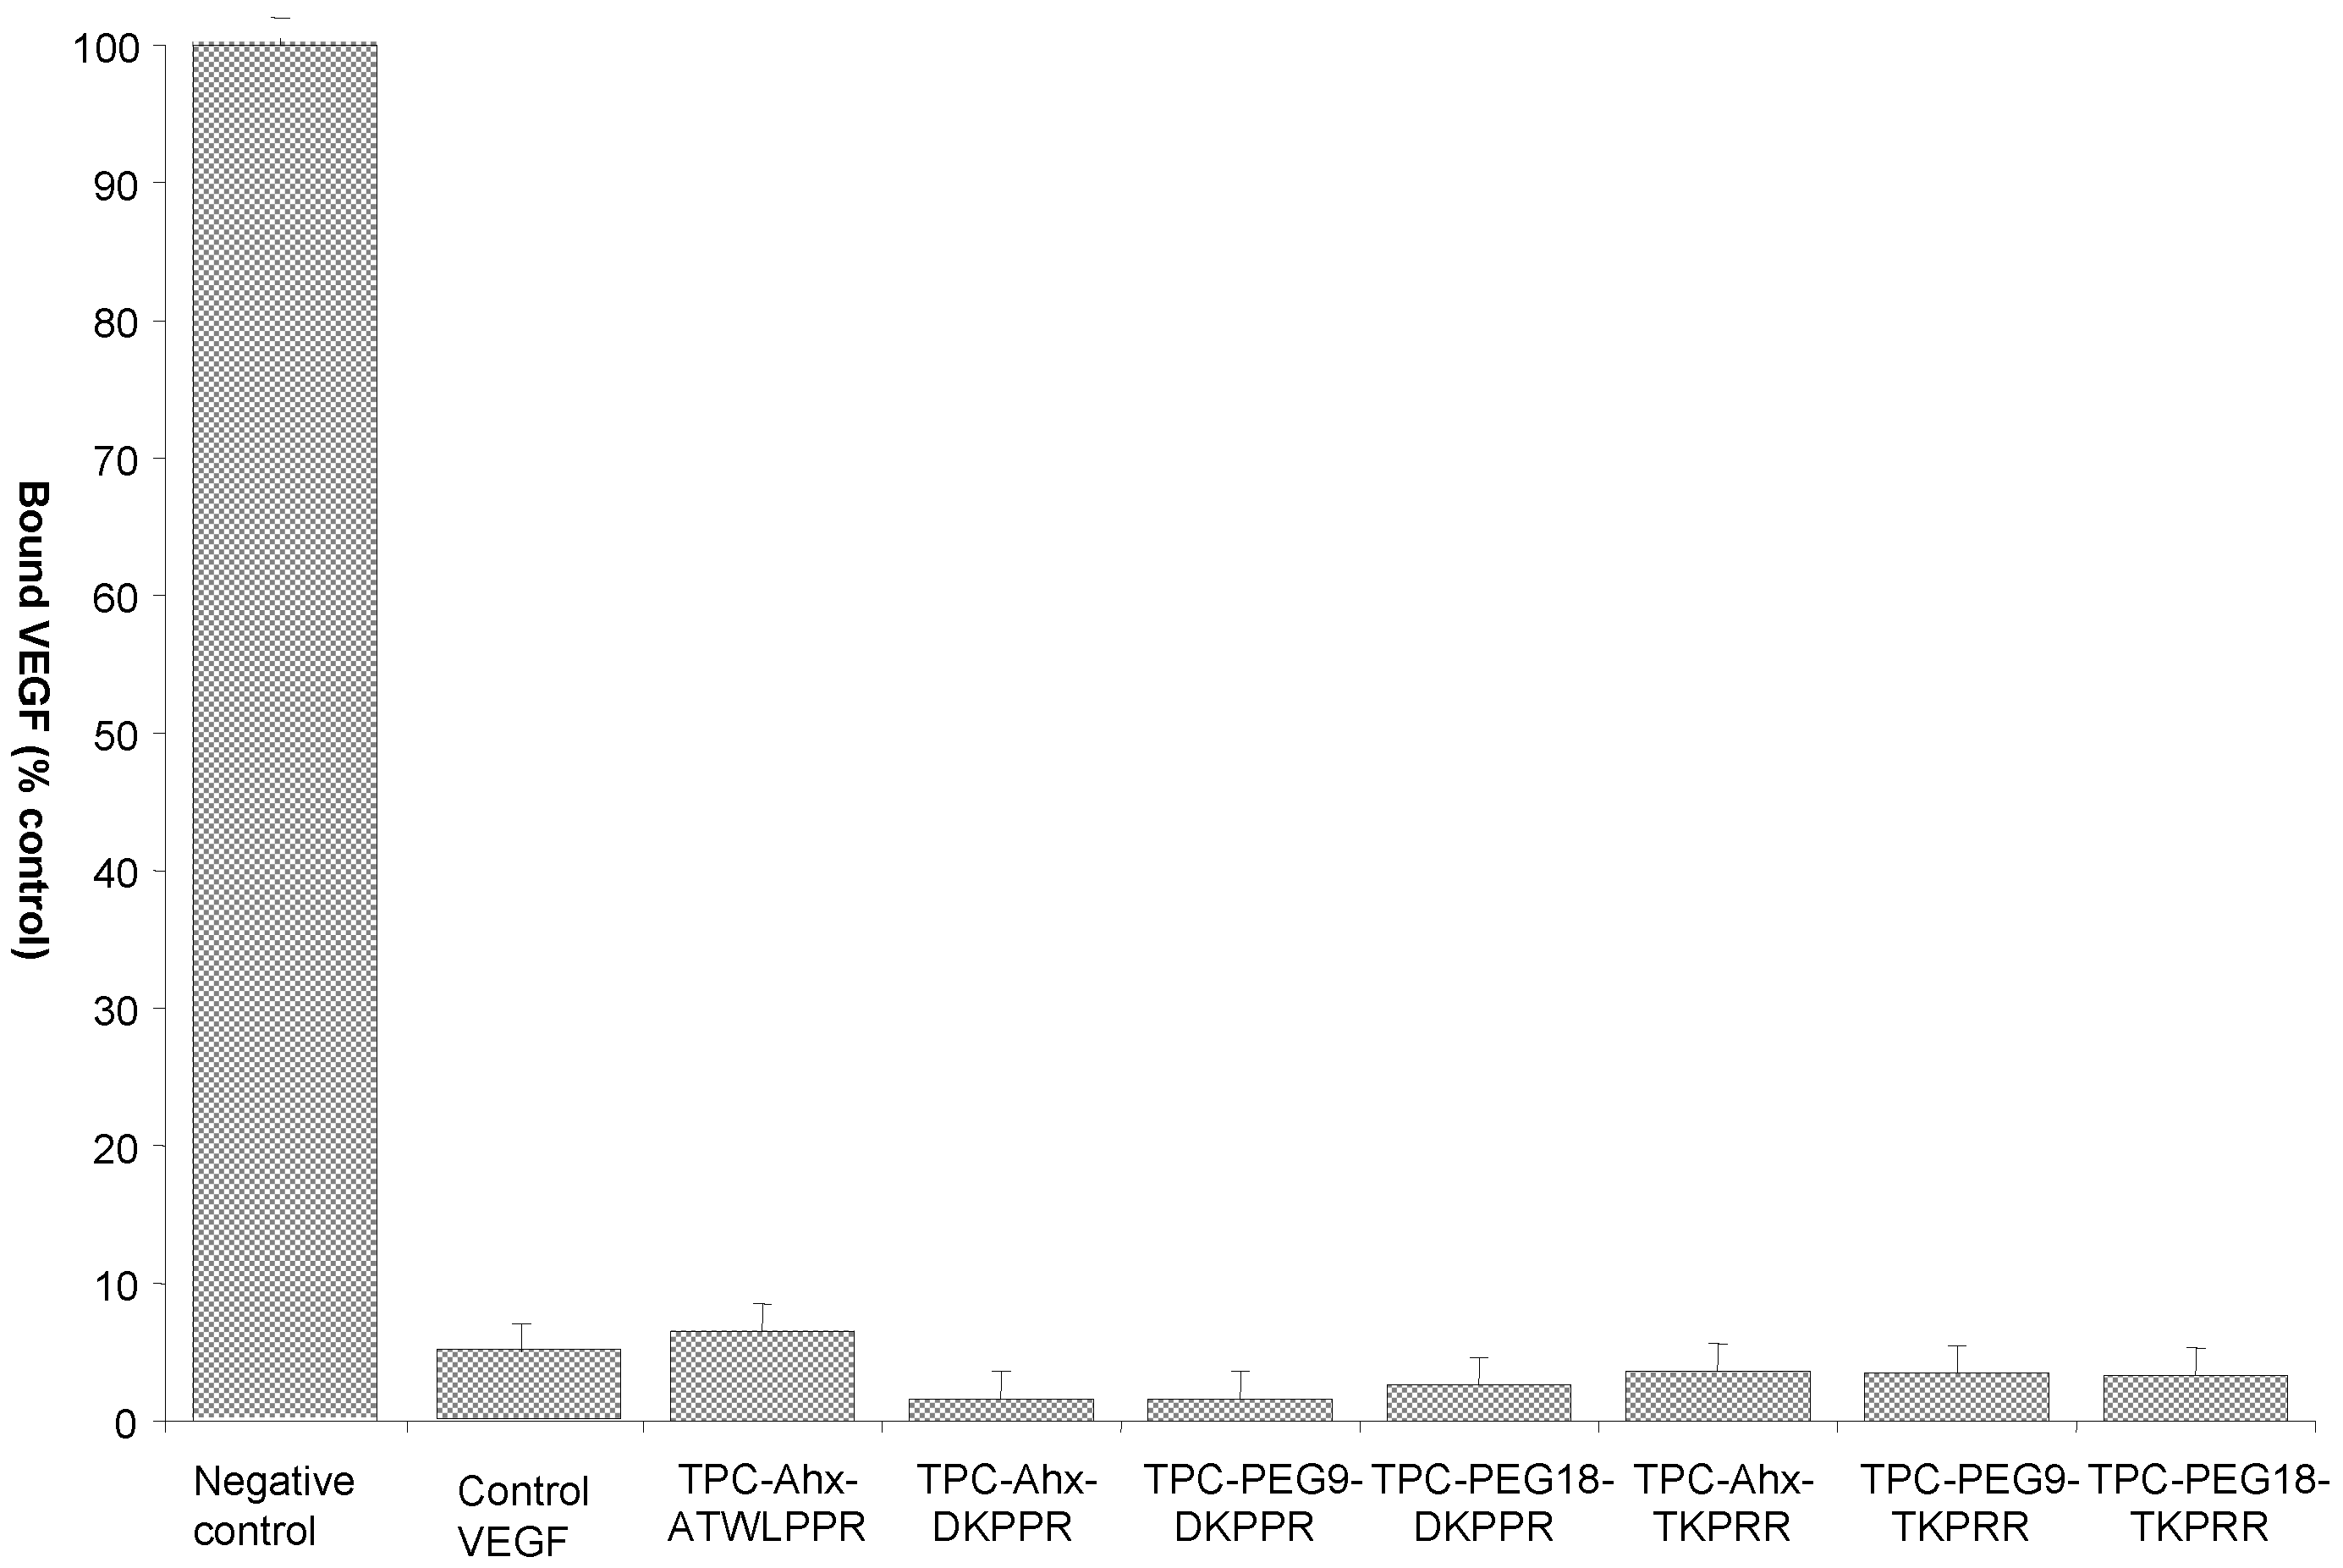
2.4. Binding Study of Novel TPC–Peptide Conjugates to Recombinant NRP-1 (Neuropilin-1 Receptor) Protein

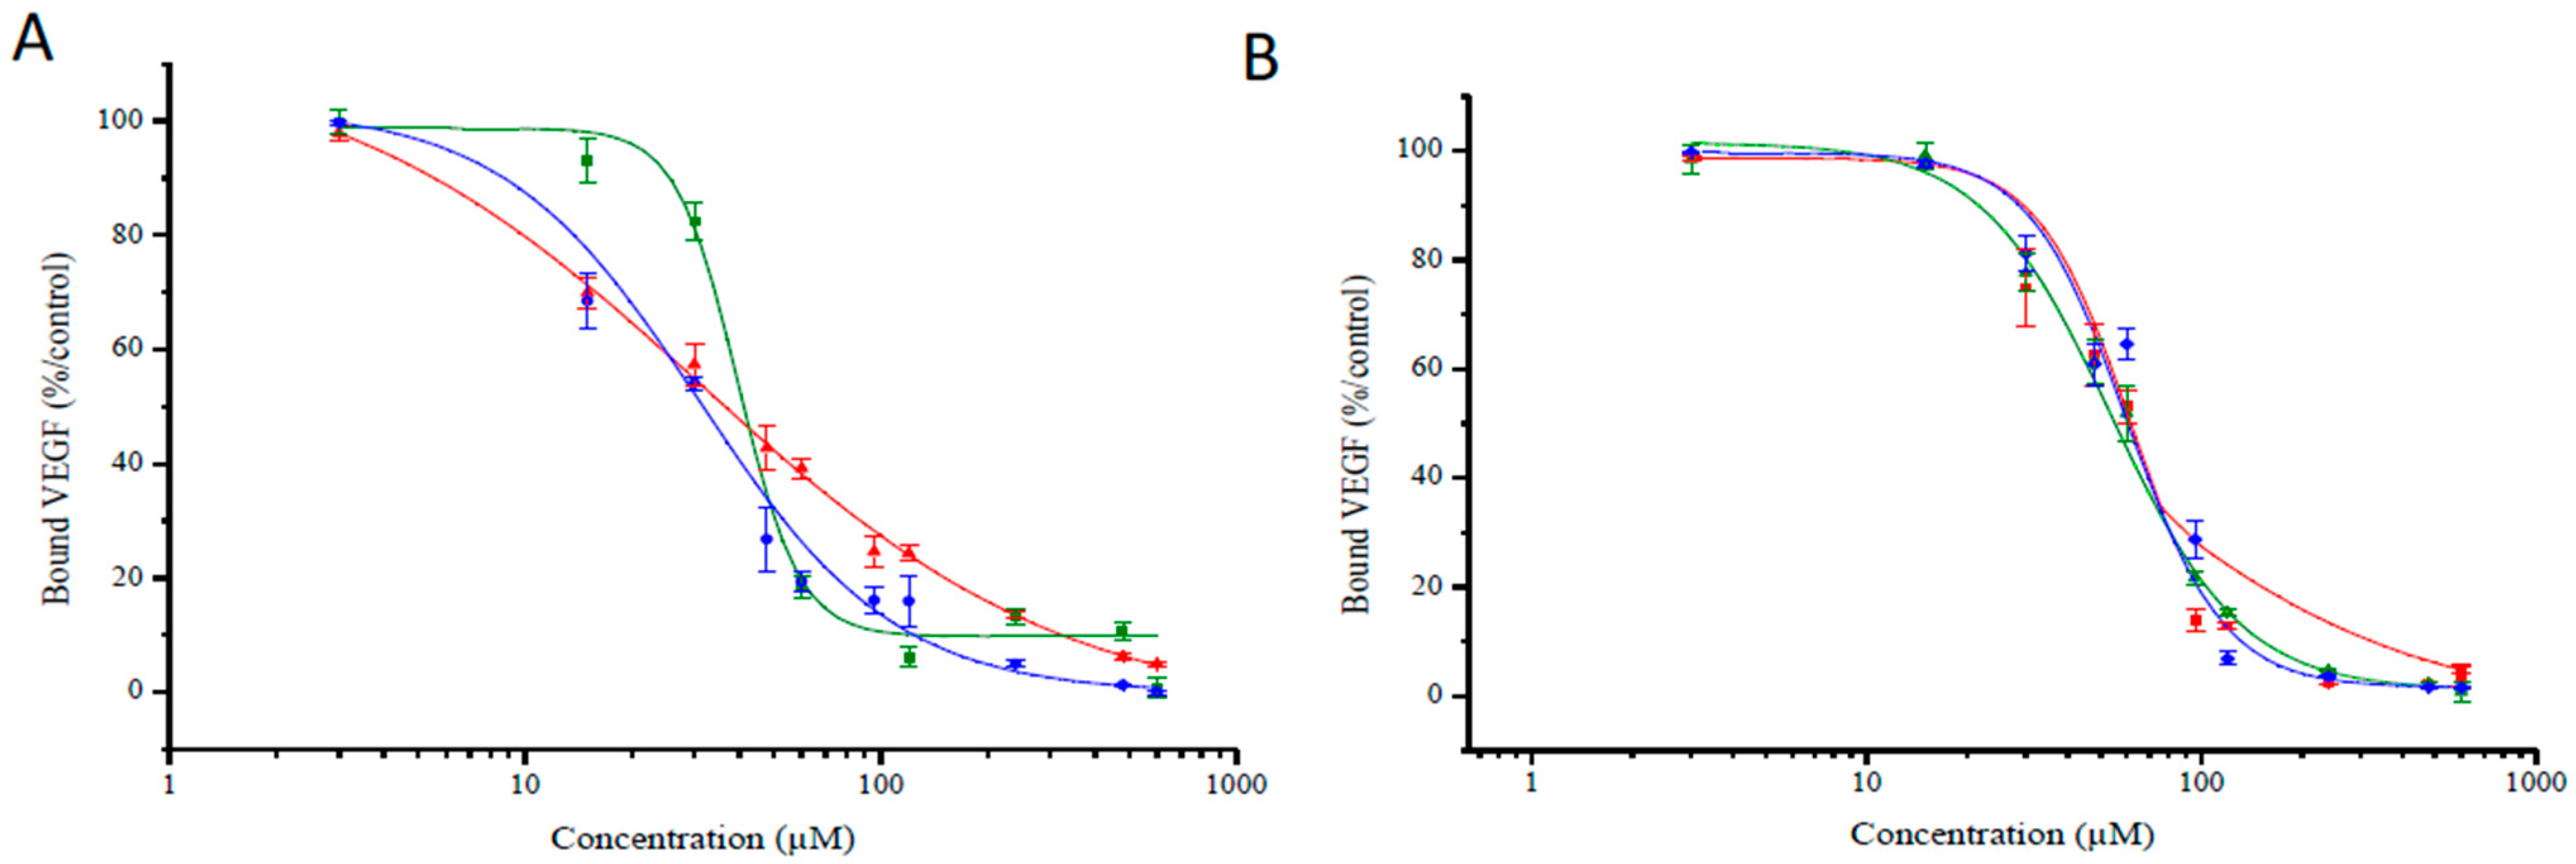
| Inhibitory Concentration, Mean IC50 Values(μM) | ||||||
|---|---|---|---|---|---|---|
| ATWLPPR | DKPPR | TKPRR | ||||
| TPC–Ahx–ATWLPPR | TPC–Ahx–DKPPR | TPC–PEG9–DKPPR | TPC–PEG18–DKPPR | TPC–Ahx–TKPRR | TPC–PEG9–TKPRR | TPC–PEG18–TKPRR |
| 171 | 33 | 39 | 30 | 55 | 51 | 53 |
2.5. In Vivo Distribution in Plasma

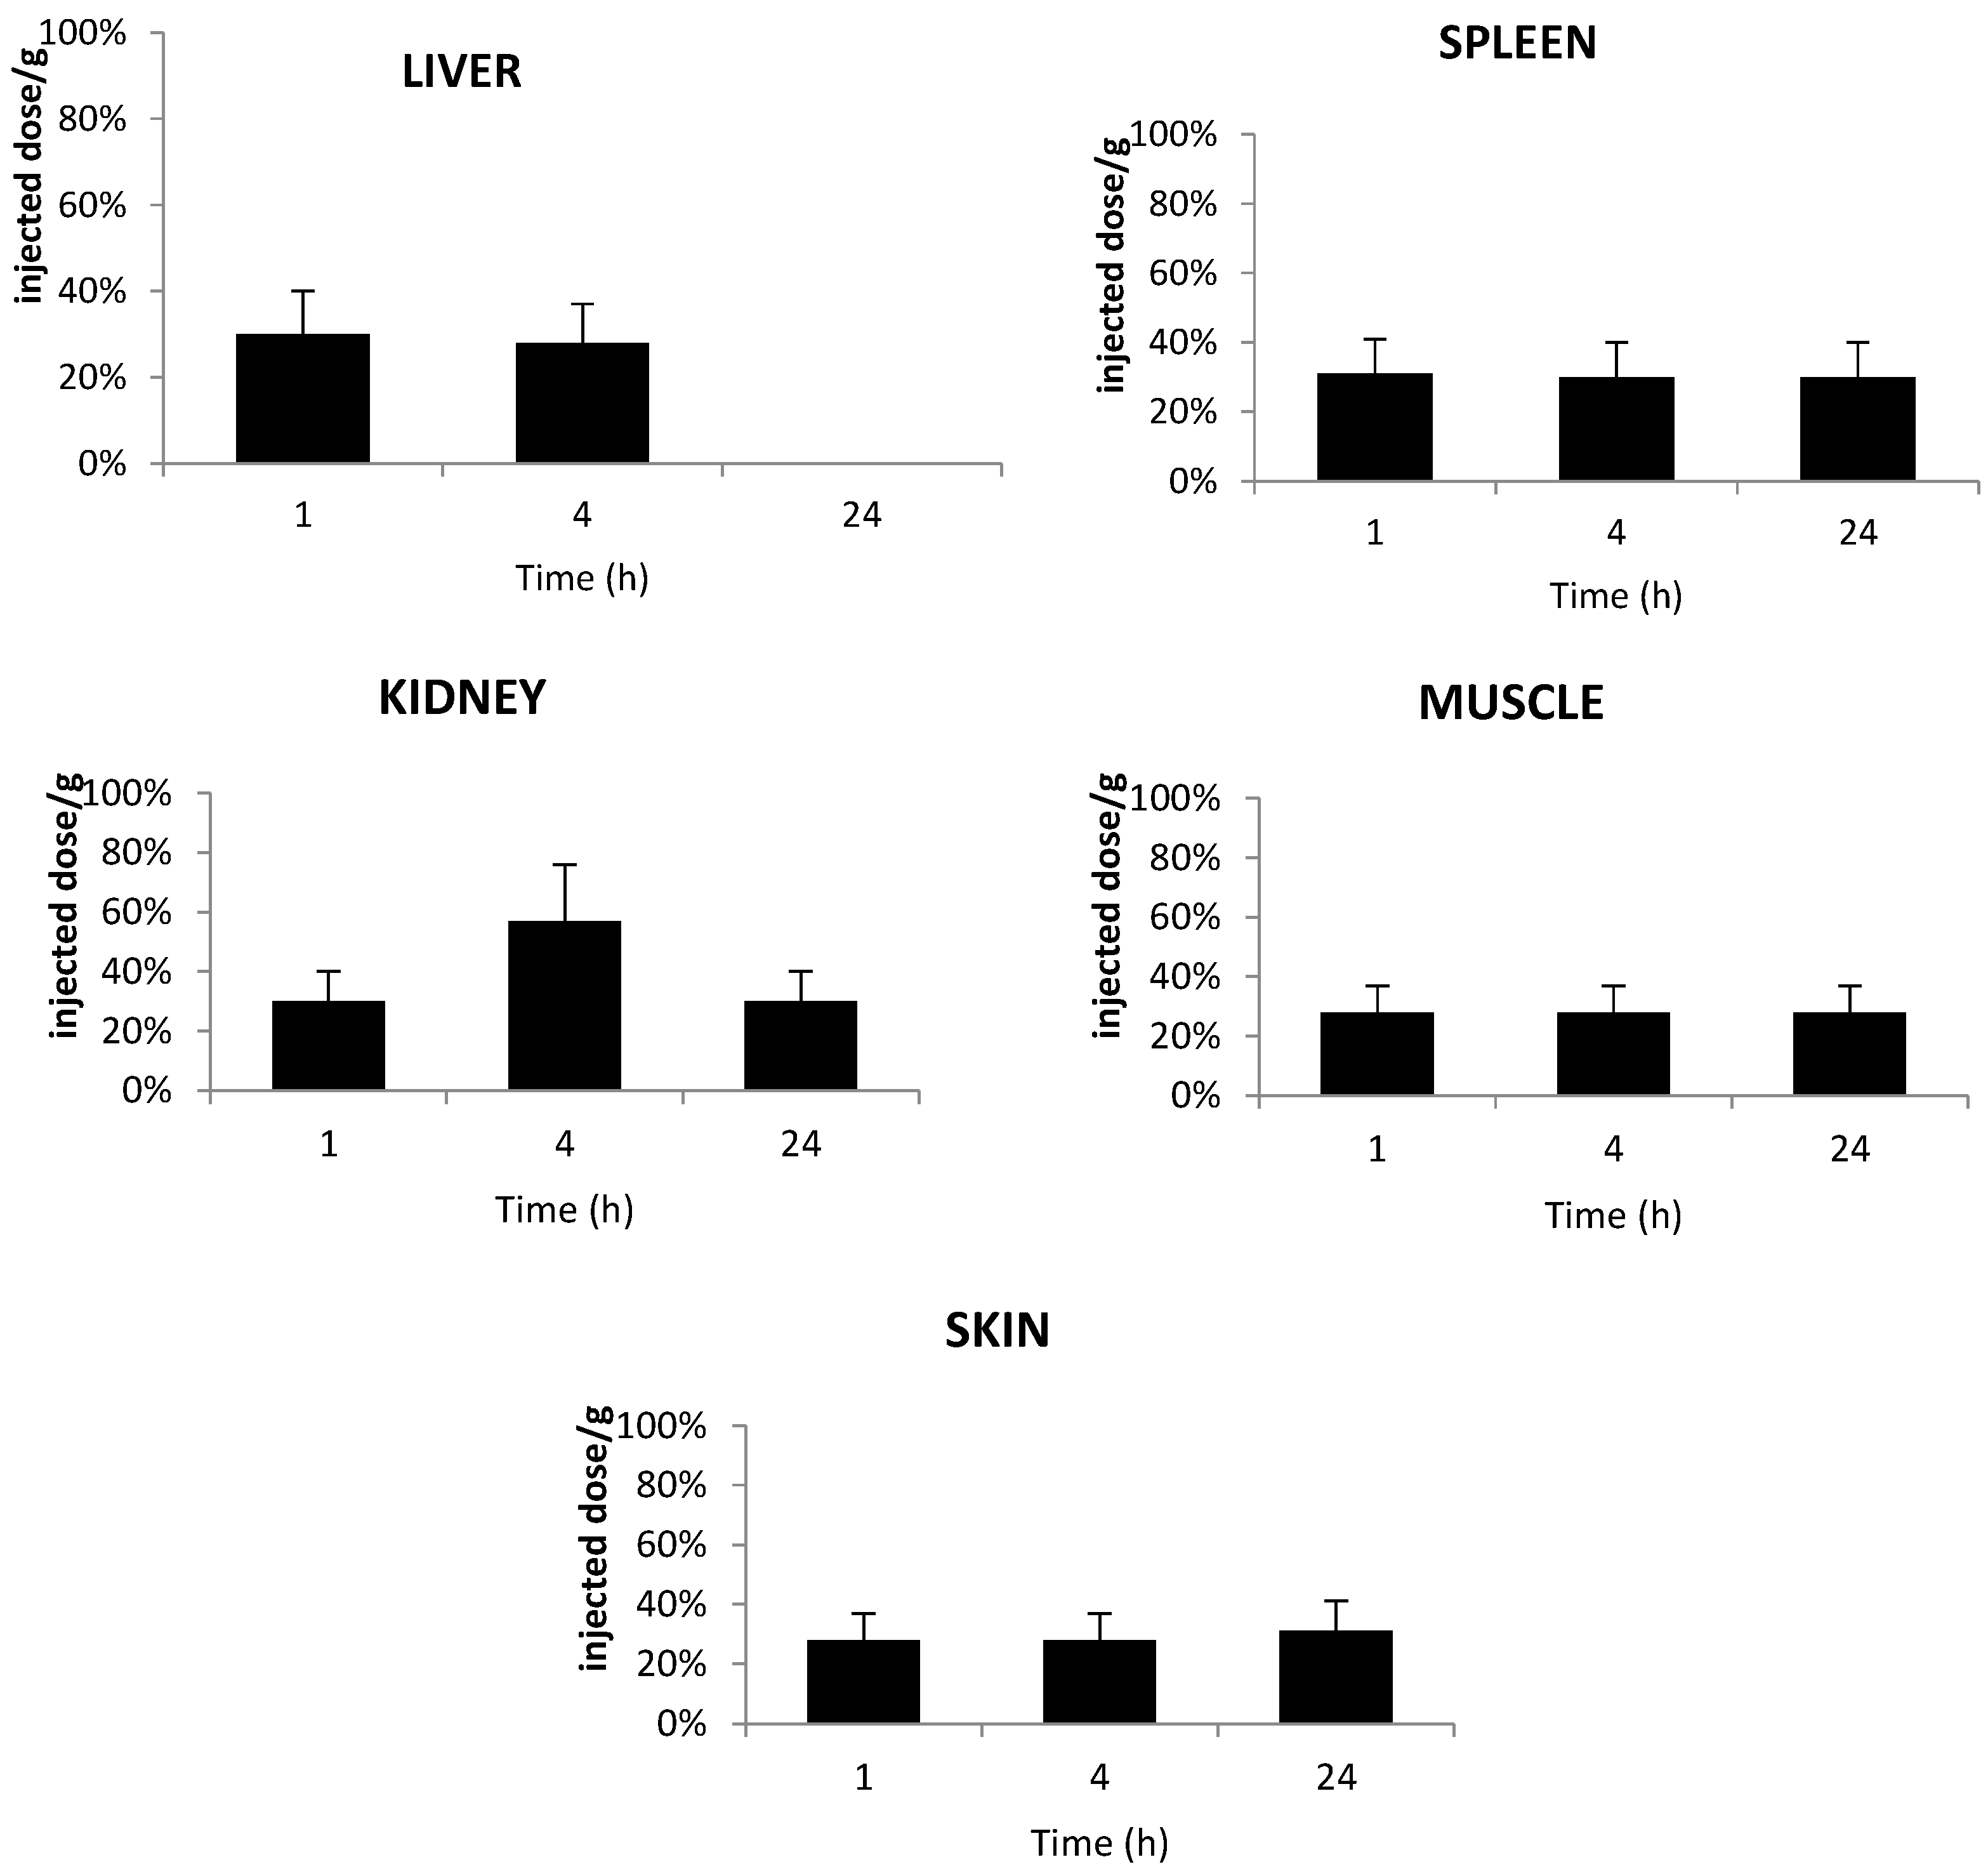
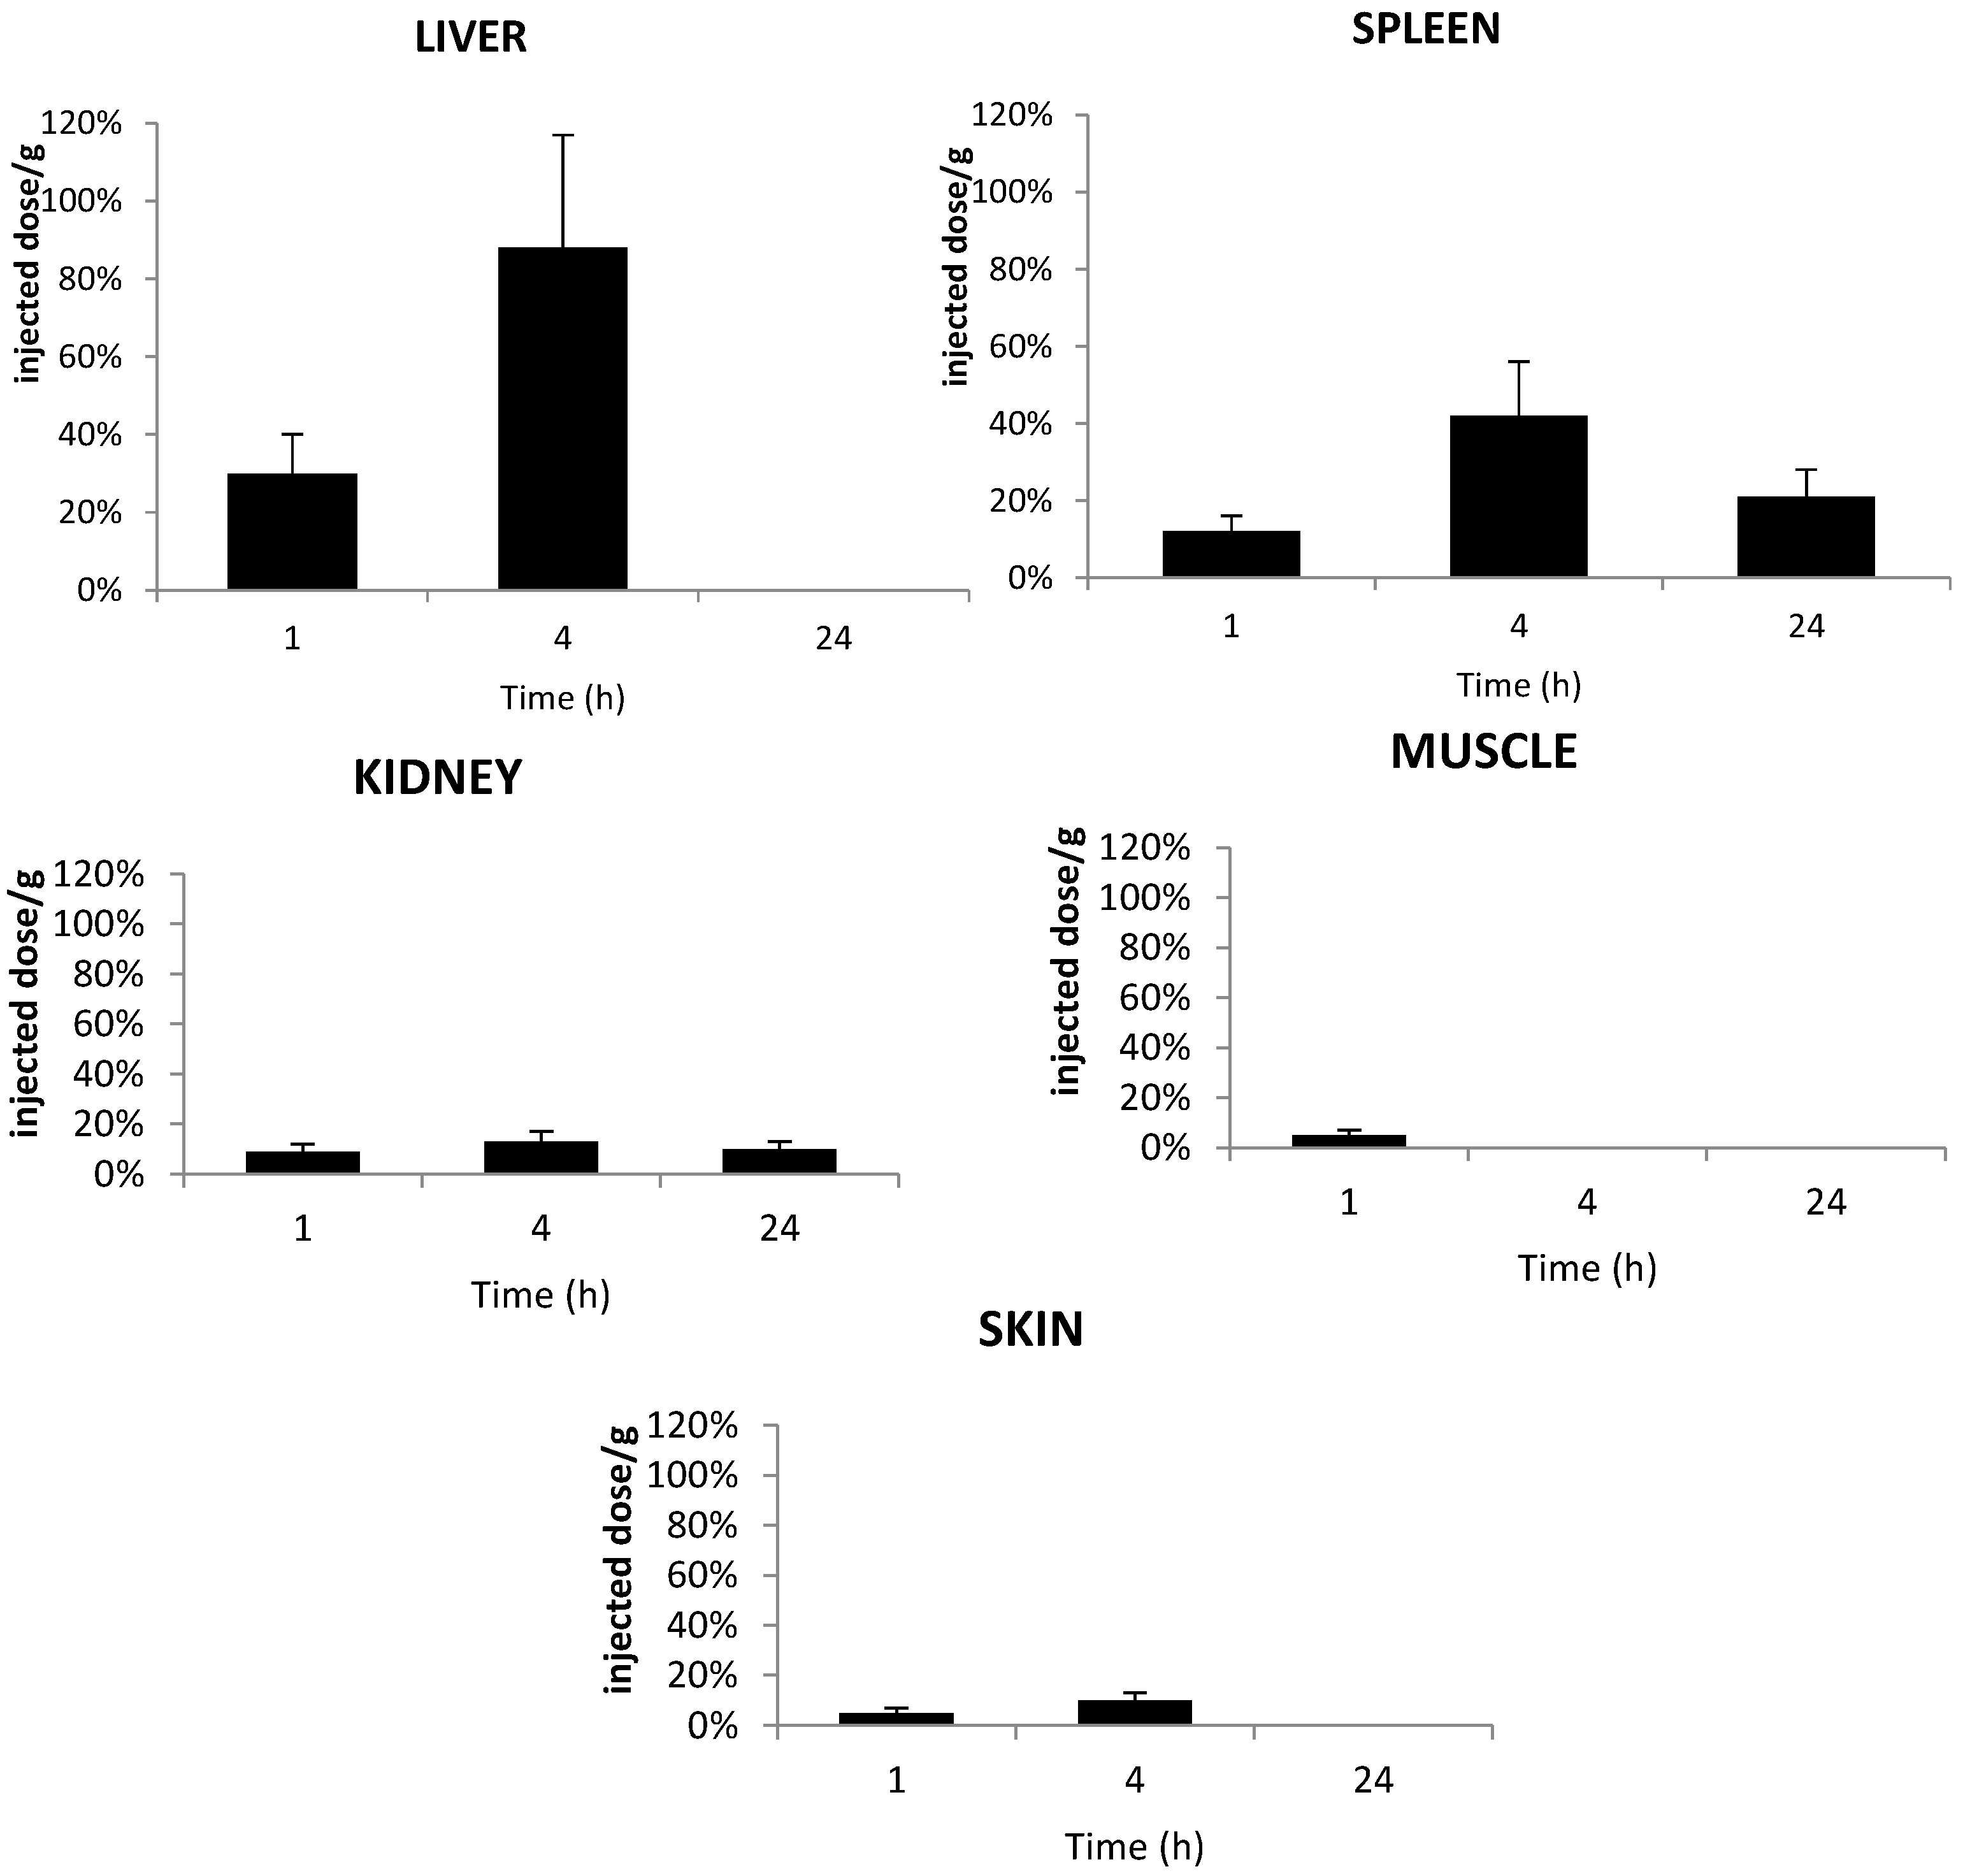
2.6. Tissue Distribution of TPC Conjugates


2.7. Stability of Conjugates in Plasma and Liver

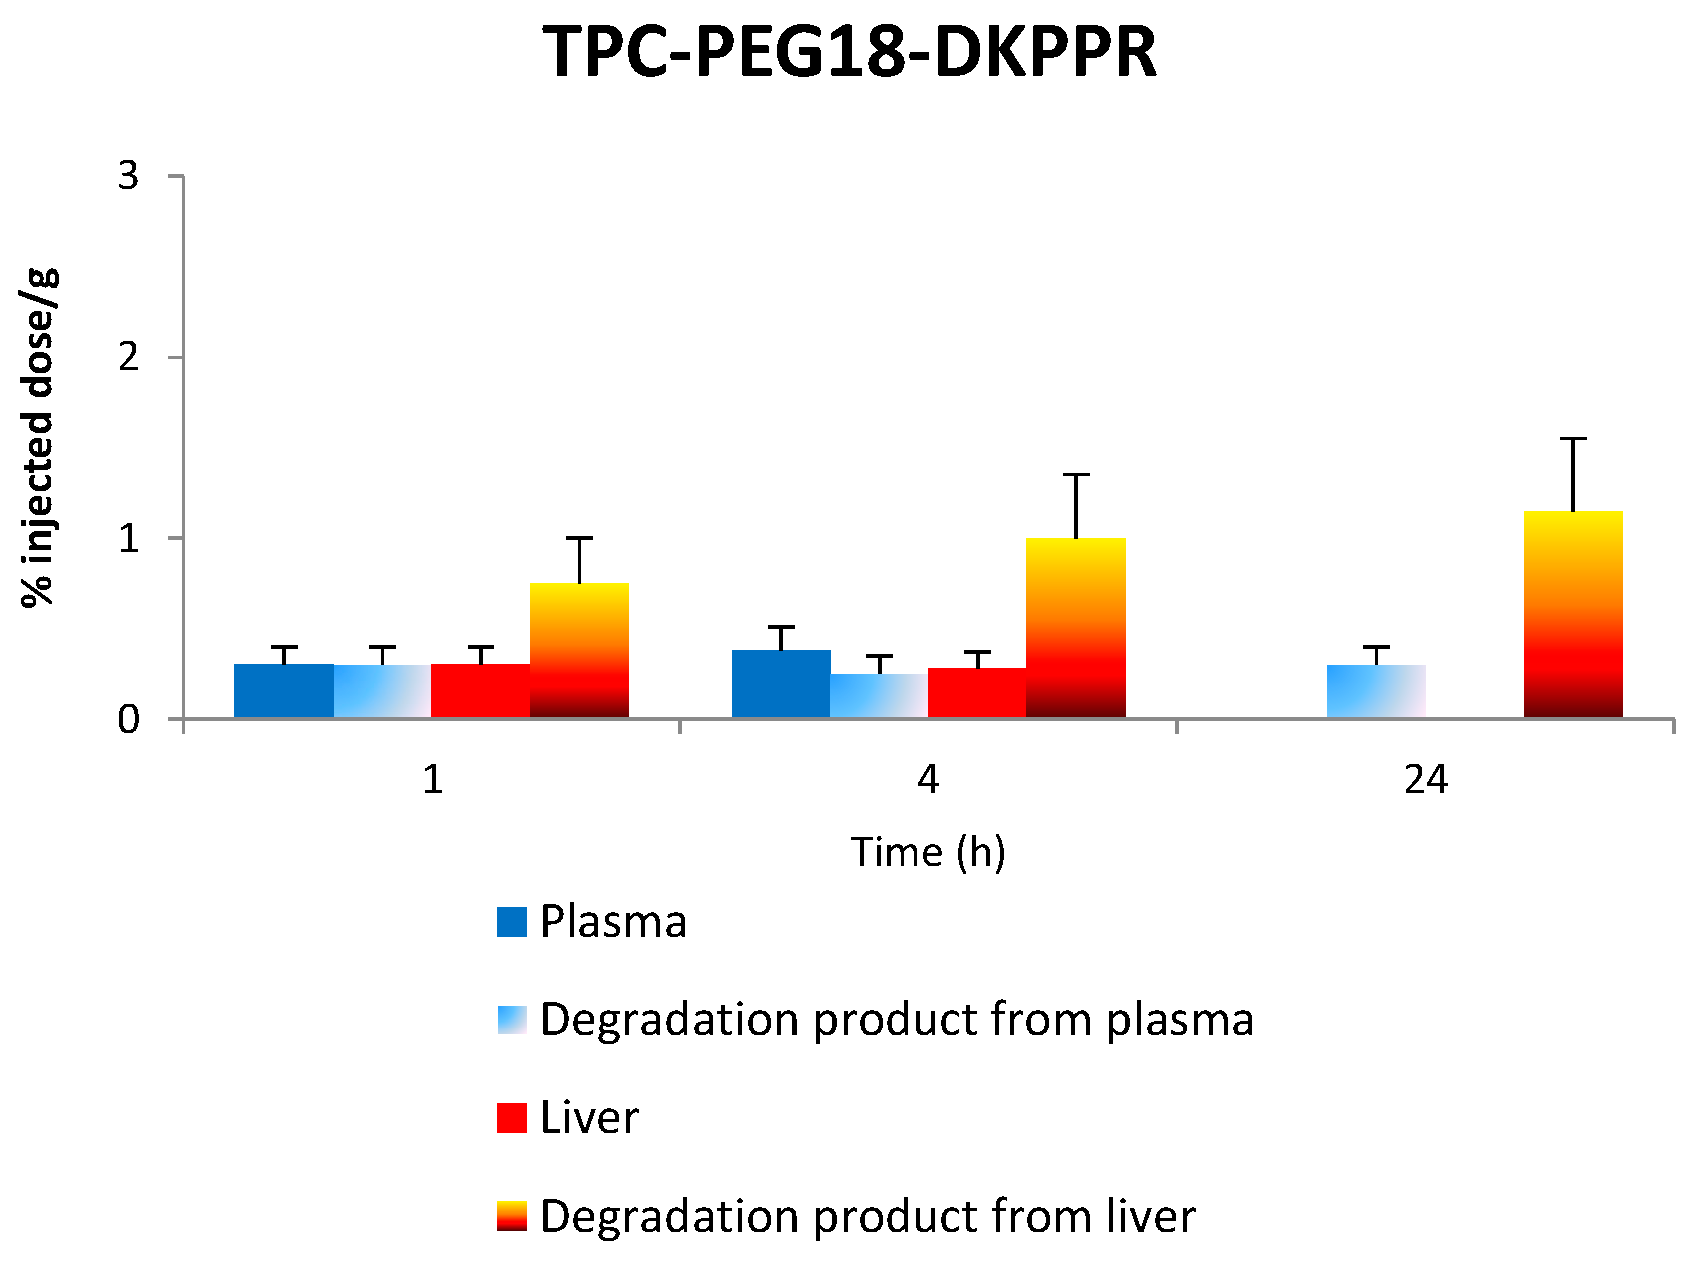
2.7.1. Stability of TPC–PEG18–DKPPR in the Plasma
2.7.2. Stability of TPC–PEG18–DKPPR in the Liver
| Observed m/z * | Hypothesis | Formula ** | Theoretical m/z * | Signal Intensity | ||
|---|---|---|---|---|---|---|
| 1 h | 4 h | 24 h | ||||
| 951.433 | TPC–PEG18 | C57H55N6O8 | 951.408 | Nd *** | 200 | 2000 |
| 1066.457 | TPC–PEG18–D | C61H60N7O11 | 1066.435 | 500 | 1300 | 200 |
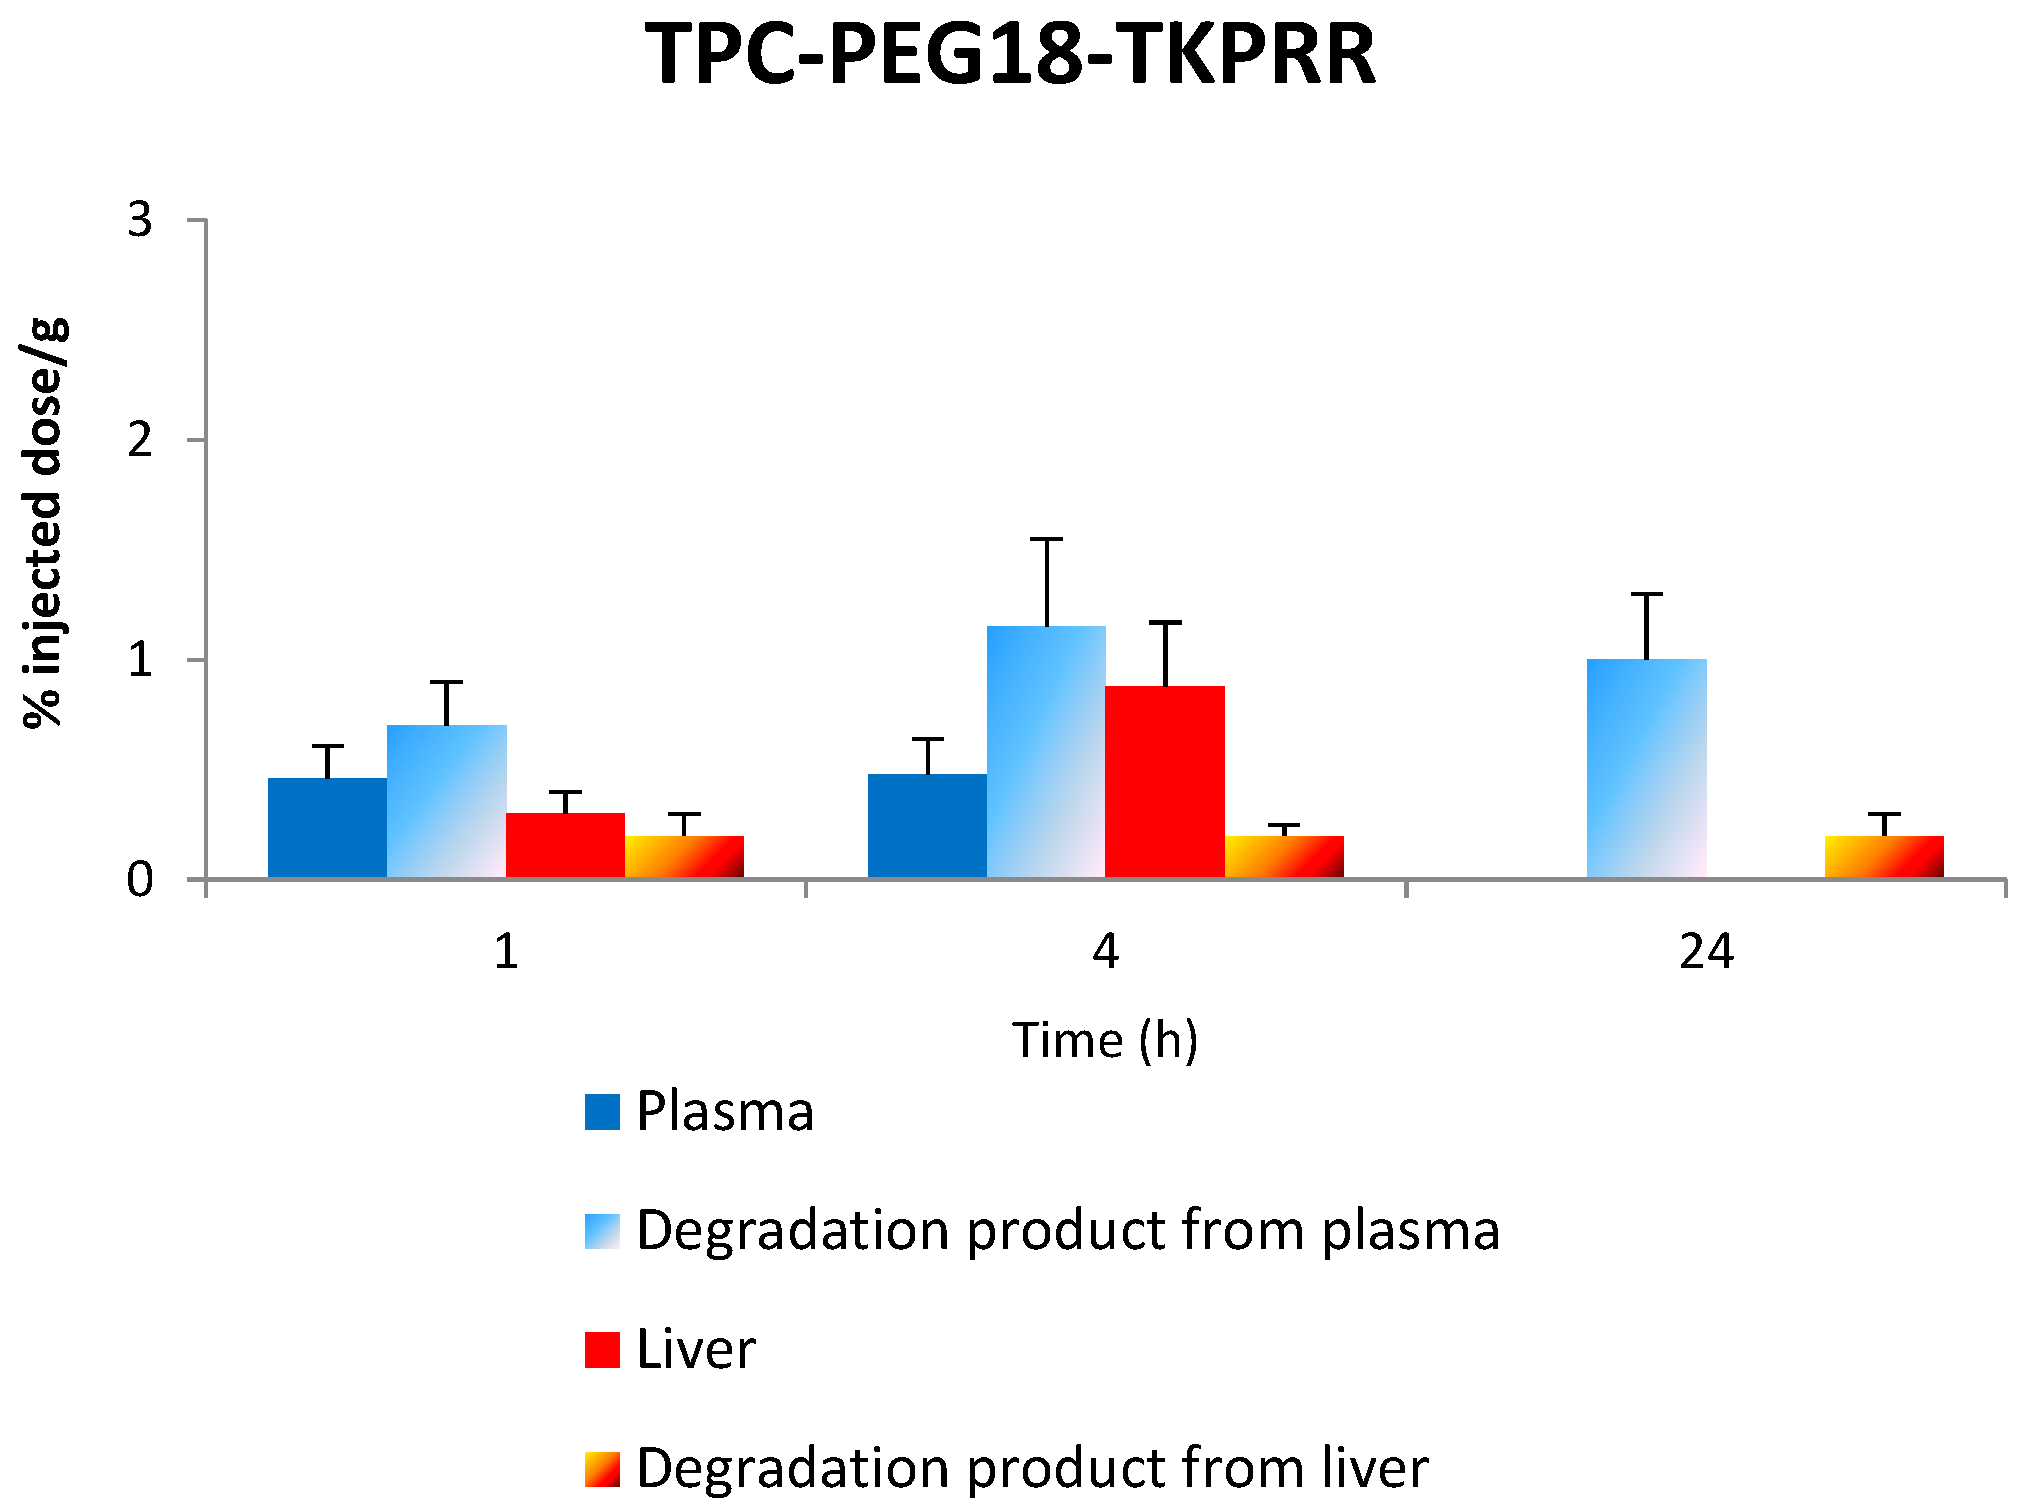
2.7.3. Stability of TPC–PEG18–TKPRR in the Plasma
2.7.4. Stability of TPC–PEG18–TKPRR in the Liver
| Observed m/z * | Hypothesis | Formula ** | Theoretical m/z * | Signal Intensity | ||
|---|---|---|---|---|---|---|
| 1 h | 4 h | 24 h | ||||
| 951.615 | TPC–PEG18 | C57H55N6O8 | 951.408 | 200 | 3400 | 1200 |
| 1052.632 | TPC–PEG18–T | C61H62N7O10 | 1052.455 | 200 | 3000 | Nd *** |
3. Discussion
4. Experimental Section
4.1. Synthesis of TPC–Peptide Conjugates
4.2. Chemical Characterization of TPC and the Novel TPC–Peptide Conjugates
4.3. Photophysical Characterization of Novel TPC–Peptide Conjugates
4.4. Binding of Peptides and Conjugates to Recombinant KDR and NRP-1 Proteins
4.5. In Vivo Study
4.5.1. Preparation of Samples for HPLC Analysis
4.5.2. In Vivo Stability Analysis by HPLC Technique of TPC–Ahx–ATWLPPR, TPC–PEG18–DKPPR and TPC–PEG18–TKPRR in Plasma and Tissue Distribution of the Conjugates
4.5.3. Statistical Analysis
4.5.4. Mass Spectrometry
5. Conclusions
Supplementary Materials
Acknowledgments
Author Contributions
Conflicts of Interest
Abbreviations
References
- Dougherty, T.J.; Gomer, C.J.; Henderson, B.W.; Jori, G.; Kessel, D.; Korbelik, M.; Moan, J.; Peng, Q. Photodynamic therapy. J. Natl. Cancer Inst. 1998, 90, 889–905. [Google Scholar] [CrossRef] [PubMed]
- Bechet, D.; Tirand, L.; Faivre, B. Neuropilin-1 targeting photosensitization-induced early stages of thrombosis via tissue factor release. Pharm. Res. 2010, 27, 468–479. [Google Scholar] [CrossRef] [PubMed]
- Mukai, H.; Yasuhiro, W.; Watanabe, Y. The synthesis of 64Cu-chelated porphyrin photosensitizers and their tumor-targeting peptide conjugates for the evaluation of target cell uptake and PET image-based pharmacokinetics of targeted photodynamic therapy agents. Ann. Nucl. Med. 2013, 27, 625–639. [Google Scholar] [CrossRef] [PubMed]
- Lafont, D.; Zorlu, Y.; Savoie, H.; Albrieux, F.; Ahsen, V.; Boyle, R.W.; Dumoulin, F. Monoglycoconjugated phthalocyanines: Effect of sugar and linkage on photodynamic activity. Photodiagn. Photodyn. Ther. 2013, 10, 252–259. [Google Scholar] [CrossRef] [PubMed]
- Mazière, J.C.; Morlière, P.; Santus, R. The role of the low density lipoprotein receptor pathway in the delivery of lipophilic photosensitizers in the photodynamic therapy of tumours. J. Photochem. Photobiol. B 1991, 8, 351–360. [Google Scholar] [CrossRef]
- Schmidt-Erfurth, U.; Diddens, H.; Birngruber, R.; Hasan, T. Photodynamic targeting of human retinoblastoma cells using covalent low-density lipoprotein conjugates. Br. J. Cancer 1997, 75, 54–61. [Google Scholar] [CrossRef] [PubMed][Green Version]
- Mew, D.; Wat, C.K.; Towers, G.H.; Lew, J.G. Photoimmunotherapy: Treatment of animal tumors with tumor-specific monoclonal antibody-hematoporphyrin conjugates. J. Immunol. 1983, 130, 1473–1477. [Google Scholar] [PubMed]
- Bryden, F.; Maruani, A.; Savoie, H.; Chudasama, V.; Smith, M.E.B.; Caddick, S.; Boyle, R.W. Regioselective and stoichiometrically controlled conjugation of photodynamic sensitizers to a HER2 targeting antibody fragment. Bioconjug. Chem. 2014, 25, 611–617. [Google Scholar] [CrossRef] [PubMed]
- Gupta, S.; Dwarakanath, B.S.; Chaudhury, N.K.; Mishra, A.K.; Muralidhar, K.; Jain, V. In vitro and in vivo targeted delivery of photosensitizers to the tumor cells for enhanced photodynamic effects. J. Cancer Res. Ther. 2011, 7, 310–320. [Google Scholar] [CrossRef] [PubMed]
- Lovell, J.F.; Liu, T.W.B.; Chen, J.; Zheng, G. Activatable Photosensitizers for Imaging and Therapy. Chem. Rev. 2010, 110, 2839–2857. [Google Scholar] [CrossRef] [PubMed]
- Schneider, R.; Tirand, L.; Frochot, C.; Vanderesse, R.; Thomas, N.; Gravier, J.; Guillemin, F.; Barberi-Heyob, M. Recent improvements in the use of synthetic peptides for a selective photodynamic therapy. Anticancer Agents Med. Chem. 2006, 6, 469–488. [Google Scholar] [CrossRef] [PubMed]
- Tirand, L.; Frochot, C.; Vanderesse, R.; Thomas, N.; Trinquet, E.; Pinel, S.; Viriot, M.L.; Guillemin, F.; Barberi-Heyob, M. A peptide competing with VEGF165 binding on neuropilin-1 mediates targeting of a chlorin-type photosensitizer and potentiates its photodynamic activity in human endothelial cells. J. Control. Release 2006, 111, 153–164. [Google Scholar] [CrossRef] [PubMed]
- Tirand, L.; Thomas, N.; Dodeller, M.; Dumas, D.; Frochot, C.; Maunit, B.; Guillemin, F.; Barberi-Heyob, M. Metabolic profile of a peptide-conjugated chlorin-type photosensitizer targeting neuropilin-1: An in vivo and in vitro study. Drug Metab. Dispos. 2007, 35, 806–813. [Google Scholar] [CrossRef] [PubMed]
- Thomas, N.; Bechet, D.; Becuwe, P.; Tirand, L.; Vanderesse, R.; Frochot, C.; Guillemin, F.; Barberi-Heyob, M. Peptide-conjugated chlorin-type photosensitizer binds neuropilin-1 in vitro and in vivo. J. Photochem. Photobiol. B 2009, 96, 101–108. [Google Scholar] [CrossRef] [PubMed]
- Garcia, G.; Naud-Martin, D.; Carrez, D.; Croisy, A.; Maillard, P. Microwave-mediated “click-chemistry” synthesis of glycoporphyrin derivatives and in vitro photocytotoxicity for application in photodynamic therapy. Tetrahedron 2011, 67, 4924–4932. [Google Scholar] [CrossRef]
- Chu, E.S.M.; Wong, T.K.S.; Yow, C.M.N. Photodynamic effect in medulloblastoma: downregulation of matrix metalloproteinases and human telomerase reverse transcriptase expressions. Photochem. Photobiol. Sci. 2008, 7, 76–83. [Google Scholar] [CrossRef] [PubMed]
- Olivo, M.; Bhuvaneswari, R.; Lucky, S.S.; Dendukuri, N.; Thong, S-P.P. Targeted therapy of cancer using photodynamic therapy in combination with multi-faceted anti-tumor modalities. Pharmaceuticals 2010, 3, 1507–1529. [Google Scholar] [CrossRef]
- Thomas, N.; Pernot, M.; Vanderesse, R.; Becuwe, P.; Kamarulzaman, E.; Da Silva, D.; Francois, A.; Frochot, C.; Guillemin, F.; Barberi-Heyob, M. Photodynamic therapy targeting neuropilin-1: Interest of pseudopeptides with improved stability properties. Biochem. Pharmacol. 2010, 80, 226–235. [Google Scholar] [CrossRef] [PubMed]
- Thomas, N.; Tirand, L.; Chatelut, E.; Plénat, F.; Frochot, C.; Dodeller, M.; Guillemin, F.; Barberi-Heyob, M. Tissue distribution and pharmacokinetics of an ATWLPPR-conjugated chlorin-type photosensitizer targeting neuropilin-1 in glioma-bearing nude mice. Photochem. Photobiol. Sci. 2008, 7, 433–441. [Google Scholar] [CrossRef] [PubMed]
- Kamarulzaman, E.E.; Vanderesse, R.; Mohd Gazzali, A.; Barberi-Heyob, M.; Boura, C.; Frochot, C.; Shawkataly, O.; Aubry, A.; Wahab, H.A. Molecular modelling, synthesis and biological evaluation of peptide inhibitors as anti-angiogenic agent targeting Neuropilin-1 for anticancer application. J. Biomol. Struct. Dyn. 2015, in press. [Google Scholar]
- Von Wronski, M.A.; Raju, N.; Pillai, R.; Bogdan, N.J.; Marinelli, E.R.; Nanjappan, P.; Ramalingam, K.; Arunachalam, T.; Eaton, S.; Linder, K.E.; et al. Tuftsin binds neuropilin-1 through a sequence similar to that encoded by exon 8 of vascular endothelial growth factor. J. Biol. Chem. 2006, 281, 5702–5710. [Google Scholar] [CrossRef] [PubMed]
- Cebe-Suarez, S.; Grunewald, F.S.; Jaussi, R.; Li, X.J.; Claesson-Welsh, L.; Spillmann, D.; Mercer, A.A.; Prota, A.E.; Ballmer-Hofer, K. Orf virus VEGF-E NZ2 promotes paracellular NRP-1/VEGFR-2 coreceptor assembly via the peptide RPPR. FASEB J. 2008, 22, 3078–3086. [Google Scholar] [CrossRef] [PubMed]
- Allain, B.; Jarray, R.; Borriello, L.; Leforban, B.; Dufour, S.; Liu, W.-Q.; Pamonsinlapatham, P.; Bianco, S.; Larghero, J.R.M.; Hadj-Slimane, R.D.; et al. Neuropilin-1 regulates a new VEGF-induced gene, Phactr-1, which controls tubulogenesis and modulates lamellipodial dynamics in human endothelial cells. Cell. Signal. 2012, 24, 214–223. [Google Scholar] [CrossRef] [PubMed]
- Figueiredo, T.L.C.; Johnstone, R.A.W.; SantAna Sorensen, A.M.P.; Burget, D.; Jacques, P. Determination of fluorescence yields, singlet lifetimes and singlet oxygen yields of water-insoluble porphyrins and metalloporphyrins in organic solvents and in aqueous media. Photochem. Photobiol. 1999, 69, 517–528. [Google Scholar] [CrossRef]
- DeRosa, M.C.; Crutchley, R.J. Photosensitized singlet oxygen and its applications. Coord. Chem. Rev. 2002, 233, 351–371. [Google Scholar] [CrossRef]
- Engel, A.; Chatterjee, S.K.; Al-Arifi, A.; Nuhn, P. Influence of Spacer Length on the Agglutination of Glycolipid-Incorporated Liposomes by ConA as Model Membrane. J. Pharm. Sci. 2003, 92, 2229–2235. [Google Scholar] [CrossRef] [PubMed]
- Kostenich, G.; Livnah, N.; Bonasera, T.A.; Yechezkel, T.; Salitra, Y.; Litman, P.; Kimel, S.; Orenstein, A. Targeting small-cell lung cancer with novel fluorescent analogs of somatostatin. Lung Cancer 2005, 50, 319–328. [Google Scholar] [CrossRef] [PubMed]
- Schneider, R.; Schmitt, F.; Frochot, C.; Fort, Y.; Lourette, N.; Guillemin, F.; Müller, J.F.; Barberi-Heyob, M. Design, synthesis, and biological evaluation of folic acid targeted tetraphenylporphyrin as novel photosensitizers for selective photodynamic therapy. Bioorg. Med. Chem. 2005, 13, 2799–2808. [Google Scholar] [CrossRef] [PubMed]
- Bonnett, R.; White, R.D.; Winfield, U.J.; Berenbaum, M.C. Hydroporphyrins of the meso-tetra(hydroxyphenyl)porphyrin series as tumour photosensitizers. Biochem. J. 1989, 261, 277–280. [Google Scholar] [CrossRef] [PubMed]
- Whitlock, H.W., Jr.; Hanauer, R.; Oester, M.Y.; Bower, B.K. Diimide reduction of porphyrins. J. Am. Chem. Soc. 1969, 91, 7485–7489. [Google Scholar] [CrossRef]
© 2015 by the authors; licensee MDPI, Basel, Switzerland. This article is an open access article distributed under the terms and conditions of the Creative Commons Attribution license (http://creativecommons.org/licenses/by/4.0/).
Share and Cite
Kamarulzaman, E.E.; Gazzali, A.M.; Acherar, S.; Frochot, C.; Barberi-Heyob, M.; Boura, C.; Chaimbault, P.; Sibille, E.; Wahab, H.A.; Vanderesse, R. New Peptide-Conjugated Chlorin-Type Photosensitizer Targeting Neuropilin-1 for Anti-Vascular Targeted Photodynamic Therapy. Int. J. Mol. Sci. 2015, 16, 24059-24080. https://doi.org/10.3390/ijms161024059
Kamarulzaman EE, Gazzali AM, Acherar S, Frochot C, Barberi-Heyob M, Boura C, Chaimbault P, Sibille E, Wahab HA, Vanderesse R. New Peptide-Conjugated Chlorin-Type Photosensitizer Targeting Neuropilin-1 for Anti-Vascular Targeted Photodynamic Therapy. International Journal of Molecular Sciences. 2015; 16(10):24059-24080. https://doi.org/10.3390/ijms161024059
Chicago/Turabian StyleKamarulzaman, Ezatul Ezleen, Amirah Mohd Gazzali, Samir Acherar, Céline Frochot, Muriel Barberi-Heyob, Cédric Boura, Patrick Chaimbault, Estelle Sibille, Habibah A. Wahab, and Régis Vanderesse. 2015. "New Peptide-Conjugated Chlorin-Type Photosensitizer Targeting Neuropilin-1 for Anti-Vascular Targeted Photodynamic Therapy" International Journal of Molecular Sciences 16, no. 10: 24059-24080. https://doi.org/10.3390/ijms161024059
APA StyleKamarulzaman, E. E., Gazzali, A. M., Acherar, S., Frochot, C., Barberi-Heyob, M., Boura, C., Chaimbault, P., Sibille, E., Wahab, H. A., & Vanderesse, R. (2015). New Peptide-Conjugated Chlorin-Type Photosensitizer Targeting Neuropilin-1 for Anti-Vascular Targeted Photodynamic Therapy. International Journal of Molecular Sciences, 16(10), 24059-24080. https://doi.org/10.3390/ijms161024059