Article

The Synthesis, Metal Exchange, and Hyaluronate Functionalization of a Cationic Gallium-Based Thiosemicarbazone Anticancer Drug

1
College of Chemistry, Chemical Engineering, and Materials Science, Soochow University, Suzhou 215123, China
2
James Watt School of Engineering, Glasgow University, University Avenue, Glasgow G12 8QQ, UK
*
Author to whom correspondence should be addressed.
Molecules 2026, 31(3), 577; https://doi.org/10.3390/molecules31030577
Submission received: 5 December 2025 / Revised: 4 February 2026 / Accepted: 5 February 2026 / Published: 6 February 2026
(This article belongs to the Special Issue Transition Metal Complexes with Bioactive Ligands)

Abstract

We herein demonstrate that the thiosemicarbazone (TSC) ligand N′-(di(pyridin-2-yl)methylene)-4-(thiazol-2-yl)piperazine-1-carbothiohydrazide (HL) can coordinate with Ga3+ to give cationic complex [Ga(L)2]NO3 featuring an octahedral Ga(III) center. [Ga(L)2]NO3 undergoes metathesis with both Fe2+ and Fe3+, resulting in the formation of respective Fe2+- and Fe3+ complexes. [Ga(L)2]NO3 is also susceptible to anion exchange with sodium hyaluronate (NaA) to produce the nanoformulation [Ga(L)2]A with boosted aqueous solubility and cell targeting. [Ga(L)2]A demonstrated remarkable in vitro cytotoxicity against NCI-H82 and A549 (lung cancer), as well as KYSE-510 and Te-1 (esophageal cancer) cell lines, featuring half maximal inhibitory concentration (IC50) values in the range 0.102–2.616 μmol L−1. This work highlights the potential of using non-toxic and biocompatible Ga3+ as the central ion to prepare TSC-based nanomedicines for combating cancer.

Graphical Abstract

1. Introduction

Thiosemicarbazones (TSCs) are a class of Schiff base that have been widely documented as highly promising anticancer drugs for a broad spectrum of cancer types through diverse mechanisms [1,2,3,4]. As N- and S-rich metal chelators, TSCs can elicit their anticancer effect by quick sequestration of cell-proliferative-dependent Fe3+ ions [4]. The anticancer effect of TSCs is profoundly affected by their structures [2,4,5,6]. In particular, the presence of an additional N coordination site, such as an α-pyridyl moiety, enables the formation of a more stable N, N, S tridentate chelate for more effective ion removal [7,8,9]. The promising anticancer potential of TSCs has been showcased by several drugs that have successfully entered clinical trials, such as Triapine, 5-HP, and COTI-2 [10,11,12,13].
Gallium (Ga), though with limited physiological function in the human body, has demonstrated important biological properties [14,15]. For example, Ga3+ is effective in suppressing bone resorption and simultaneously elevating plasma calcium [15]. It is used clinically for the treatment of hypercalcemia of malignancy and Paget’s disease of the bones [16]. Gallium(III) has also shown clinical efficacy in suppressing osteolysis and bone pain associated with multiple myeloma and bone metastases, and has been suggested as a treatment for osteoporosis [14].
It is notable that Ga3+ and Fe3+ share very similar charge-to-radius ratios, and that the chemical behavior of Ga3+ closely resembles that of Fe3+ [15,17,18]. Consequently, Ga3+ can bind to the iron-transport protein transferrin (Tf), although the affinity of Tf for Fe3+ is much higher than that for Ga3+, and the replacement of Ga3+ by Fe3+ occurs very slowly [15]. By comparison, Ga3+ is unable to enter Fe2+-containing proteins, such as hemoglobin and cytochromes. Hence, it does not enter red blood cells and does not interfere with oxygen transport [15].
Intrigued by this similarity between Ga3+ and Fe3+, an ion that is so critical to the metabolism of cancer cells, Ga(III)-based drugs have been widely developed to target Fe3+-dependent metabolism [6,19,20,21]. For example, tris(8-quinolinolato)-gallium(III) (KP46), originally demonstrated to show better bioavailability and higher toxicity than GaCl3 upon oral administration, is now used for treating various cancers, such as melanoma and renal cell carcinoma [19]. KP46 is also found to sensitize resistant leukemia cells and overcome Bcl-2-induced multidrug resistance in lymphoma cells via up-regulation of Harakiri and down-regulation of XIAP in vitro [20]. Ga(III) complexes with cloxyquin ligands have also been reported to induce ferroptosis in cancer cells [21]. Using human cancer cell lines 41M and SK-BR-3 as models, Arion and Keppler et al. revealed that the coordination of Ga3+ to TSCs unequivocally and specifically modulated cytotoxic potency in a beneficial manner, whereas surrogation of Ga3+ with Fe3+ impaired biological activity [6].
In our recent work, we reported the synthesis of a new TSC-based anticancer drug of N′-(di(pyridin-2-yl)methylene)-4-(thiazol-2-yl)piperazine-1-carbothiohydrazide (HL) featuring the di-2-pyridylketone moiety with chelating-bridging functions [22]. Ligand HL can readily associate with Cu2+ to give the corresponding coordination complexes that demonstrated superior anticancer performances against hepatocellular carcinoma by reactive oxygen species generation. Pharmacokinetic studies also revealed that HL can be successfully absorbed via oral administration, with a favorable half-life that was nearly double that of intravenous administration, rendering HL a clinically promising oral drug.
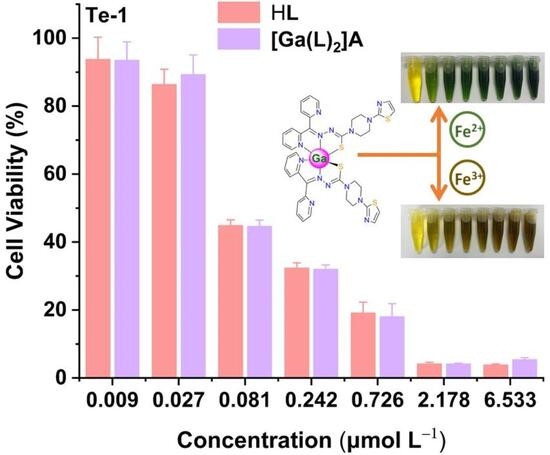
Herein, we explore the reaction of HL with Ga(NO3)3·9H2O and obtain the anticipated octahedral complex [Ga(L)2]NO3 (Scheme 1 and Figure 1a). [Ga(L)2]NO3 underwent metathesis with both Fe2+ and Fe3+ to yield the respective Fe2+- and Fe3+-based complexes quantitatively. The ionic nature of [Ga(L)2]NO3 further permitted its anion exchange reaction with sodium hyaluronate (NaA) to give the corresponding nanoformulation [Ga(L)2]A to endow the material with aqueous solubility and targetability (Scheme 1) [23,24,25]. Our preliminary results suggest that [Ga(L)2]A exhibits pronounced cytotoxicity in cell lines NCI-H82 and A549 (lung cancer), as well as KYSE-510 and Te-1 (esophageal cancer). This work highlights the potential of anticancer nanomedicines from non-toxic and biocompatible Ga3+ and TSC ligands.

2. Results and Discussion

2.1. Synthesis and Structure of [Ga(L)2]NO3

The ligand HL was synthesized according to our previously reported procedures [22]. HL and similar ligand types featuring N, N, S-chelation functions are demonstrated to associate with diverse metal ions, particularly the biologically relevant Fe2+/3+ [6,26,27], Cu+/2+ [28,29,30], and Zn2+ [31,32], due to their soft-hard hybrid combinations. The reaction of Ga(NO3)3·9H2O and HL in MeOH under ambient conditions, followed by ether diffusion, gave rise to [Ga(L)2]NO3 as yellow block crystals in 23.3% yield. Crystals of [Ga(L)2]NO3 were soluble in common solvents ranging from polar to medium-polar solvents, such as H2O, MeOH, DMSO, DMF, and CH2Cl2.
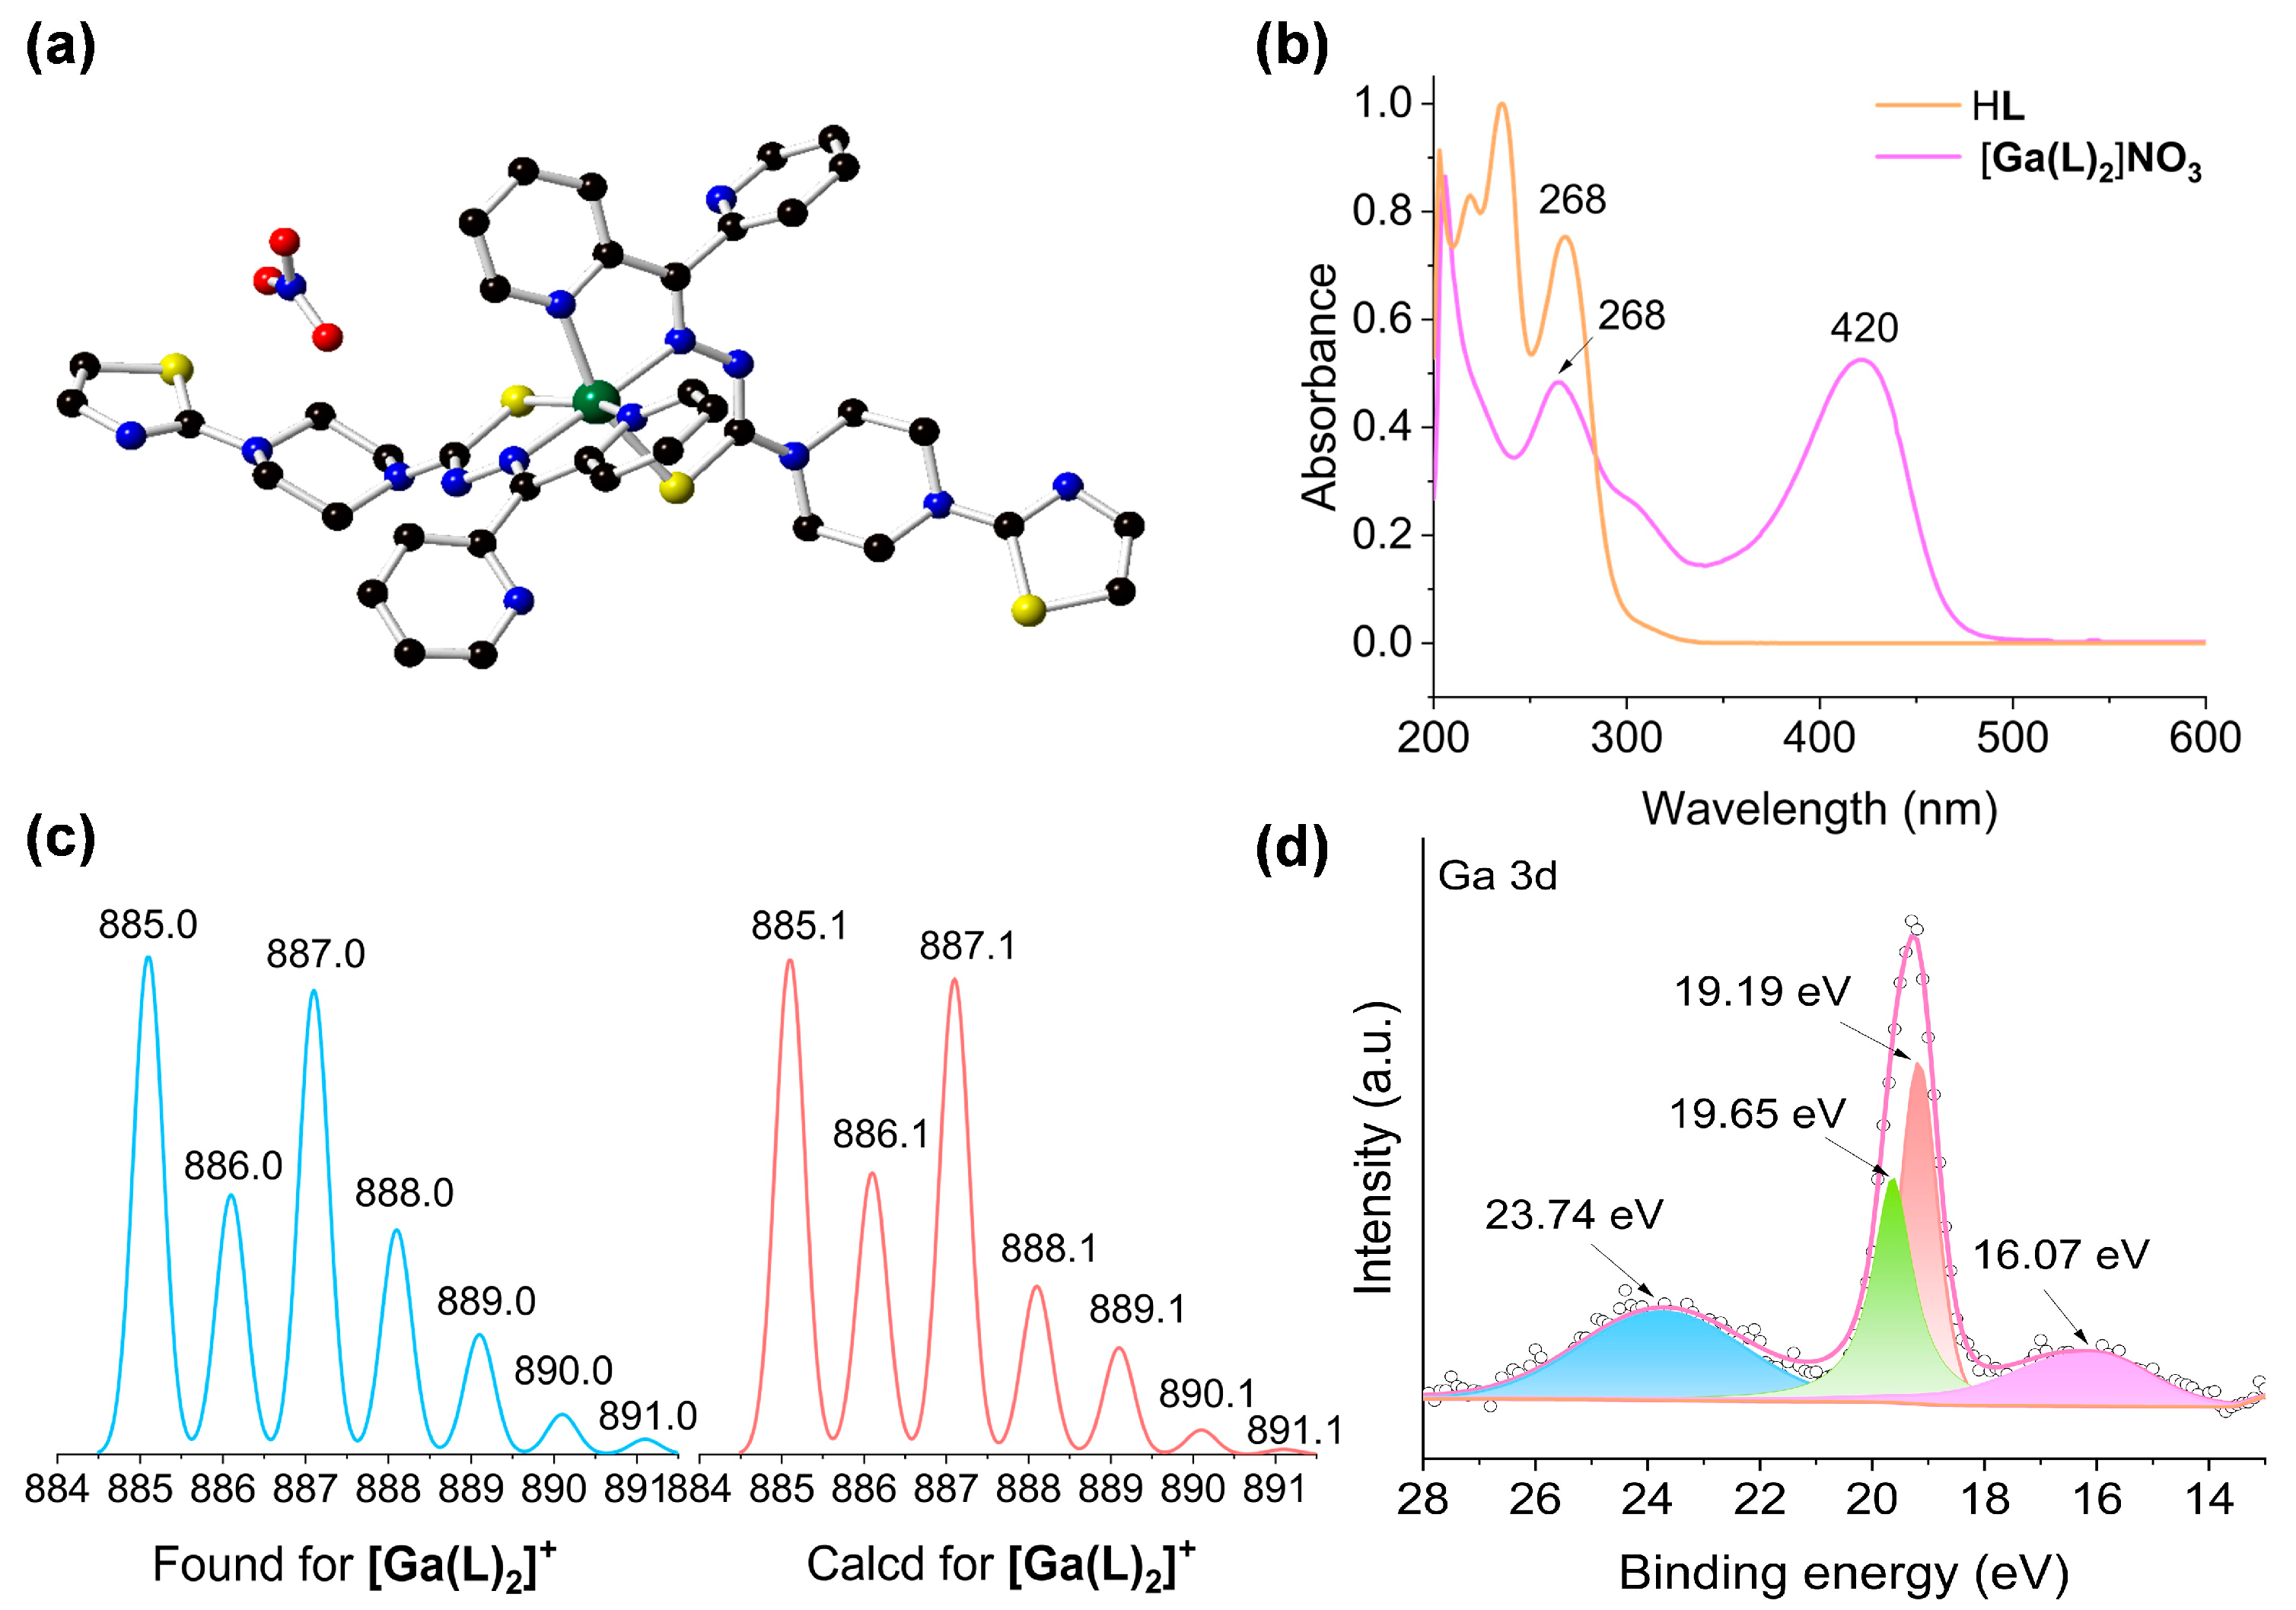
Compound [Ga(L)2]NO3 crystallized in the monoclinic space group P21/n (Table 1), and its asymmetric unit contained a full [Ga(L)2]NO3 molecule along with a MeOH solvate (Figure 1a). The octahedral coordination preference of Ga3+ enabled the chelation of a pair of ligands to give the [Ga(L)2]+ cation, in which a pair of Npy and a pair of S atoms are in cis positions, respectively. This is in addition to the trans arrangement of the Nhydrazone pair. The use of a tridentate ligand such as HL for octahedral complex precludes the formation of possible and unwanted ∆/Λ enantiomers typically found for bidentate ligands, such as dipyridyls and phenylpyridines [33]. The [Ga(L)2]+ cation was accompanied by an NO3 counterion, further indicating that the ligand is tautomerized toward its enol form (thiol), which is then subsequently deprotonated [34,35].
In [Ga(L)2]NO3, the Ga–S bond distances (2.3600(6) and 2.3715(6) Å, Table 2) were similar to those reported in the literature, such as [bis(acetylpyrazine N, N-dimethylthiosemicarbazonato)-N, N, S-gallium (III)] hexafluorophosphate (2.3321(7) and 2.3532(9) Å) [6], [bis(acetylpyrazine N-pyrrolidinylthiosemicarbazonato)-N, N, S-gallium(III)] hexafluorophosphate (2.3389(6) and 2.3525(6) Å) [6]. It should be noted that, although Ga3+ and Fe3+ share a similar ionic radius, their respective Fe3+-based complexes using the same TSC ligand exhibit marginally shorter Fe–S bond distances. For example, the Fe–S bond distances in [bis(acetylpyrazine N, N-dimethylthiosemicarbazonato)-N, N, S-iron(III)] tetrachloroferrate(III) are 2.2242(6) and 2.2341(7) Å [6], similar to those found in [bis(acetylpyrazine N-pyrrolidinylthiosemicarbazonato)-N, N, S-iron(III)] tetrachloroferrate(III) (2.2156(9) and 2.2322(10) Å) [6]. A similar trend is observed in other Fe-TSC complexes, such as the Fe3+ complex 4-(4-nitrophenyl)-1-((pyridin-2-yl)methylene)thiosemicarbazide (2.2161(6) and 2.2009(9) Å) [36]. The shorter, more stable Fe–S bond distances compared to those of Ga–S probably serve as the driving force for their metathesis.
Platon void calculation also suggested that the guest-accessible void of [Ga(L)2]NO3 occupies 7.4% (325.7 Å3 of 4381.8 Å3) of the total cell volume, and these voids are located with MeOH solvates (Figure S1) that are hydrogen-bonded to the free NO3 (Table S1) [37].

2.2. Spectroscopic and Spectrometric Characterization of [Ga(L)2]NO3

High-performance liquid chromatography–mass spectrometry (HPLC-MS) analysis revealed signals at 885.0 m/z for [Ga(L)2]NO3, corresponding to [Ga(L)2]+ (calculated 885.1 m/z) (Figure 1c). The 1H nuclear magnetic resonance (1H NMR) spectra showed that the thiosemicarbazone proton peak at 14.64 ppm in HL is absent in [Ga(L)2]NO3 (Figure S2), providing evidence of the thione-to-thiol tautomerism and subsequent Ga3+ coordination by eliminating the thiol proton.
Fourier-transform infrared (FT-IR) spectroscopic analysis revealed significant coordination-induced modifications in the vibrational modes. The ν(C=S) vibration at 869 cm−1 in the free ligand HL bathochromically shifted to 854 cm−1 in [Ga(L)2]NO3 (Figure S3) [38]. By contrast, the C=N stretching vibration of HL, originally observed at 1579 cm−1 in the FT-IR spectrum, hypsochromically shifted to 1598 cm−1 upon coordination with Ga3+ in [Ga(L)2]NO3 [39,40,41]. In addition, a sharp peak at 1362 cm−1, characteristic of the presence of NO3 [42], was also identified.
Ultraviolet–visible (UV-Vis) spectral analysis revealed that, in comparison to HL, [Ga(L)2]NO3 demonstrated distinct absorption bands at 420 nm (Figure 1b), which are characteristic of ligand-to-metal charge transfer (LMCT) transitions [41]. This spectral evidence confirms the successful formation of coordination bonds between the Ga(III) center and the organic ligand.
Energy dispersive X-ray spectroscopy (EDS) revealed an atomic ratio of Ga:S = 0.9:4.0 (equivalent to 1.0:4.4) for [Ga(L)2]NO3 (Figure S4), consistent with the derived ratio of Ga:S ratio of 1.0:4.0 from the single-crystal data. X-ray photoelectron spectroscopy (XPS) of [Ga(L)2]NO3 confirmed the presence of C, N, O, and Ga3+ (Figure S5). The Ga 3d XPS of [Ga(L)2]NO3 showed two peaks at binding energies of 19.19 eV and 19.65 eV, which are assignable to the spin–orbit splitting of Ga 3d5/2 and Ga 3d3/2 of Ga3+ (Figure 1d) [43,44,45]. The N, N, S-conjugated tridentate moiety in the thiosemicarbazone ligand exhibited high electron cloud density and strong coordinating capability, potentially leading to a slight decrease in the binding energy of Ga 3d orbitals [43].

2.3. Fe2+ and Fe3+ Exchange with [Ga(L)2]NO3

[Ga(L)2]NO3 smoothly underwent transmetalation with Fe2+ (using (NH4)2Fe(SO4)2·6H2O) and Fe3+ (using NH4Fe(SO4)2·12H2O) in DMF. For the transmetalation with Fe2+, the solution color gradually changed from light green to dark green (Figure S6), while for the corresponding reaction of Fe3+, the solution color gradually changed to yellowish-brown (Figure S7), presumably driven by the more stable complex formation. EDS of the exchanged samples indeed indicated that for both reactions, the Ga3+ was totally removed (Figure S8).
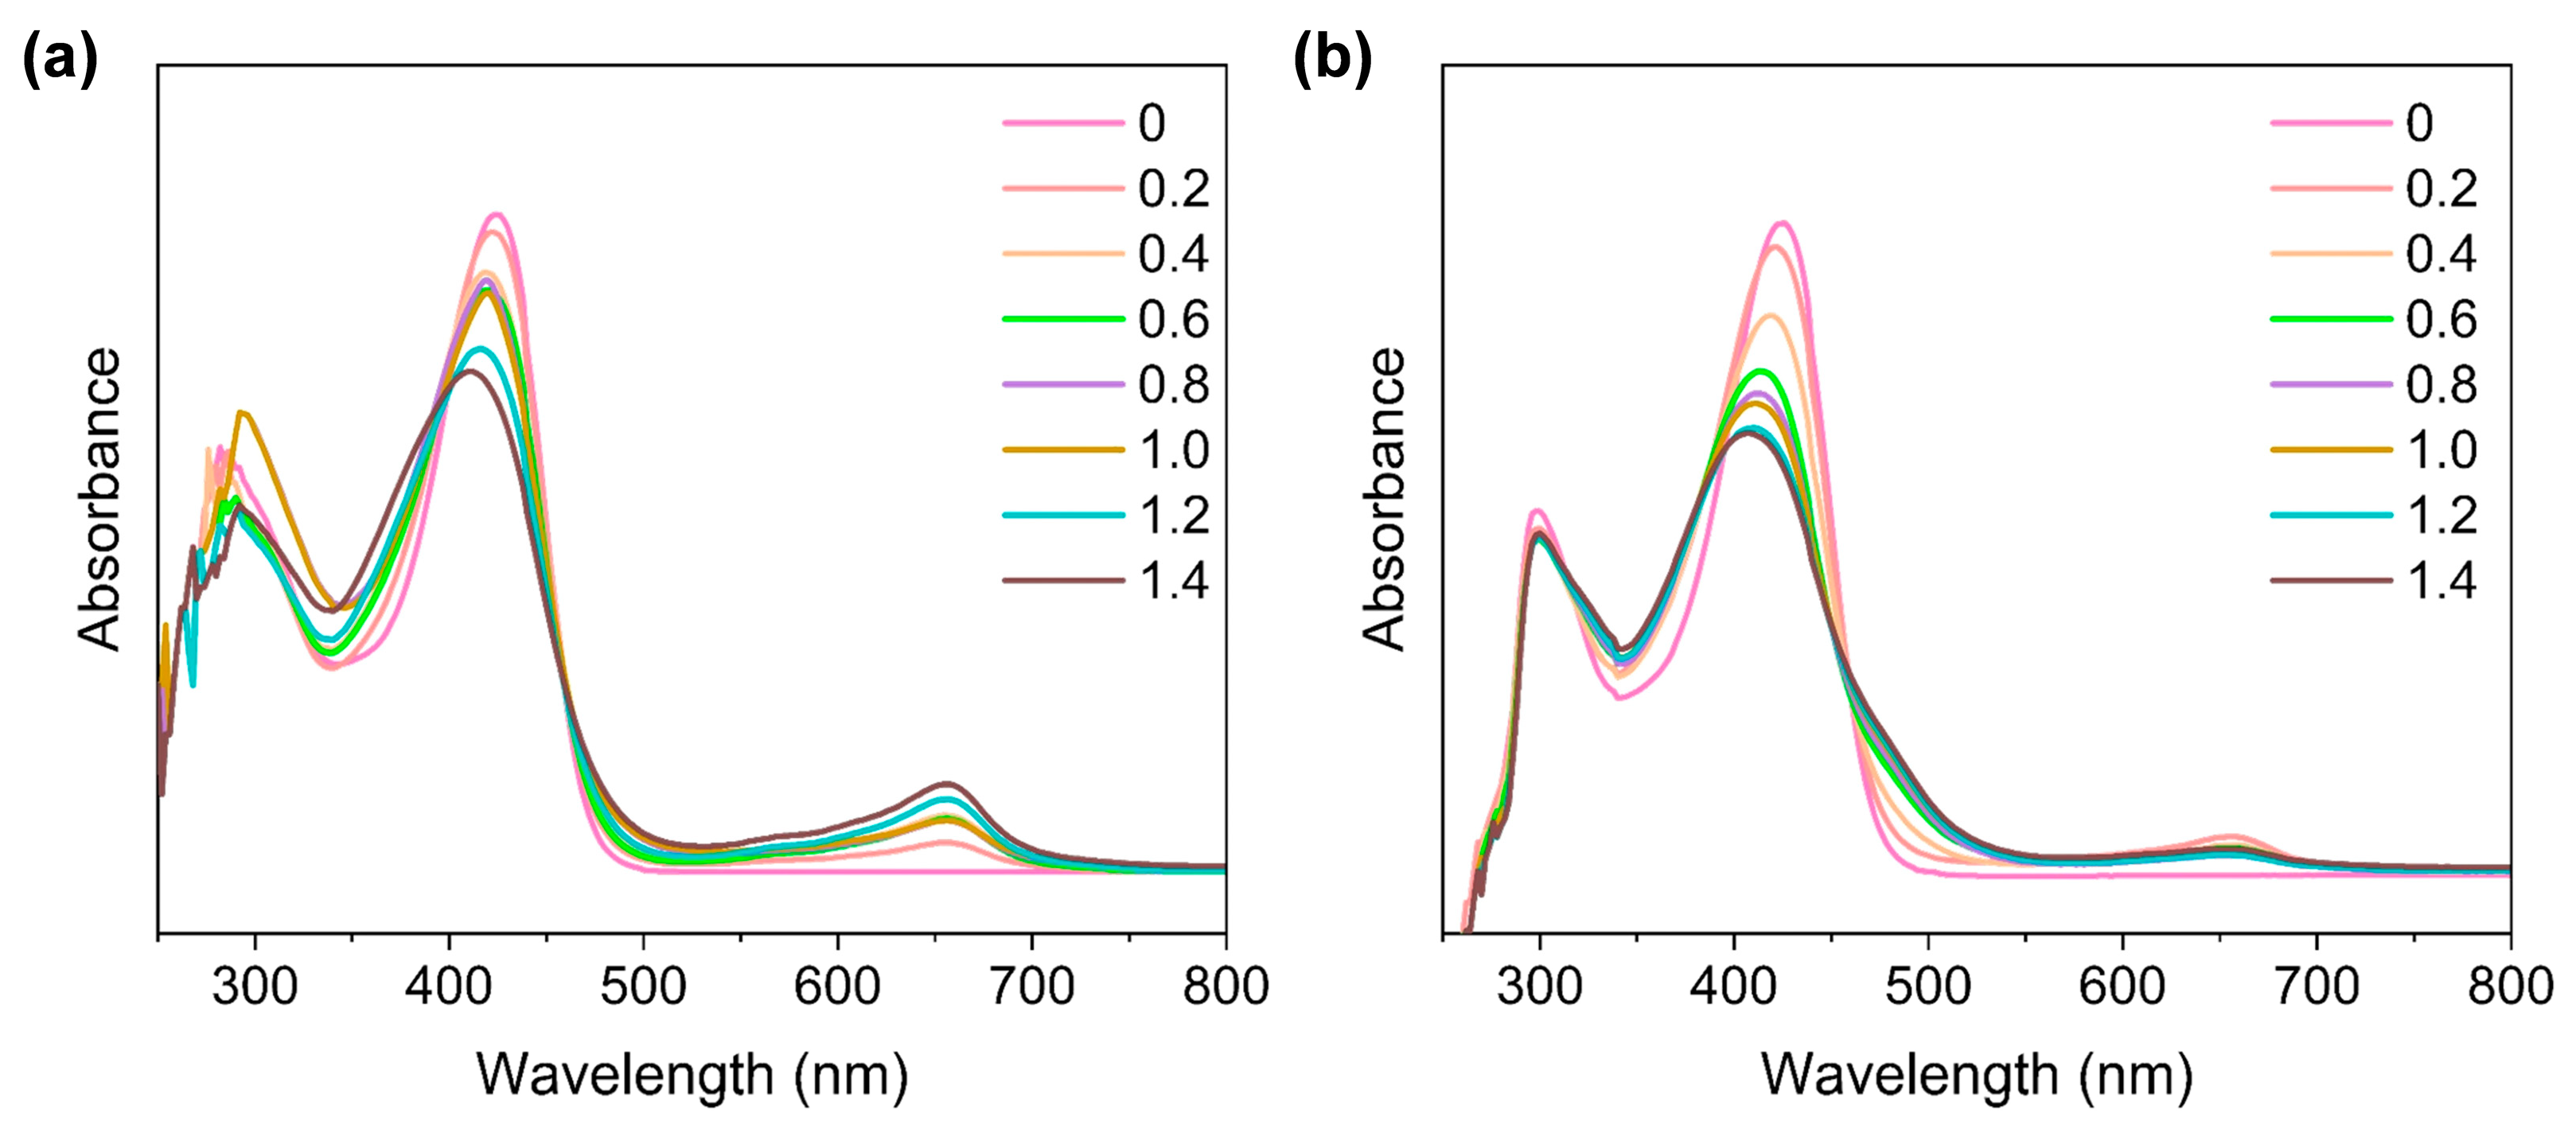
The titration experiment for DMF-H2O indicated that for Fe2+ exchange, the LMCT band at 426 nm gradually shifted to 400 nm (Figure 2a), accompanied by the appearance of a new band at 644 nm, assignable as the lower energy charge transfer transition from the thiolate sulfur to Fe2+, which is unique to Fe(II)-TSC complexes [46]. It is interesting to note that, for the metathesis with Fe3+, the reaction initially generated Fe2+ species characterized by the generation of a low-energy peak at 657 nm (Figure 2b), presumably due to the reductive nature of the thiols [24,25]. Meanwhile, the LMCT band of [Ga(L)2]NO3 gradually blue-shifted from 426 nm to 406 nm, accompanied by a shoulder peak at 484 nm, characteristic of Fe3+ bonding [47]. We further observed that the transmetalation reaction proceeded smoothly, as indicated by these titration curves and sample photographs recorded at 0.5 h, 6 h, and 72 h (Figures S6 and S7).
We further compared the exchange rate of [Ga(L)2]NO3 with Fe2+/Fe3+. To achieve this, we reacted [Ga(L)2]NO3 with an equivalent amount of Fe2+/Fe3+ at 60 °C in DMF/H2O, and monitored their absorbance changes at 654 nm over 24 h. As shown in Figure S9, both exchange reactions initially displayed first-order kinetics in the first three hours, with the exchange rate of Fe(III) being faster than that of Fe(II). Equilibrium was reached in around 7 h. Notably, the Fe(II) species formed were gradually oxidized, as seen in the slight decrease in the peak intensity at 24 h for both reactions.
In addition to Fe2+/Fe3+, [Ga(L)2]NO3 was found to exhibit partial metal exchange with other ions as indicated by EDS, including Cu2+ (Cu:Ga = 1.0:0.6; exchange rate 63%; Figure S10a), Mn2+ (Mn:Ga = 0.1:0.5; exchange rate 17%; Figure S10b), Co2+ (Co:Ga = 0.7:0.1; exchange rate 88%; Figure S10c), Ni2+ (Ni:Ga = 1.0:0.5; exchange rate 67%; Figure S10d), and Zn2+ (Zn:Ga = 0.2:0.1; exchange rate 67%; Figure S10e). Nevertheless, given the inherently strong chelation characteristics of the HL ligand and the facile synthetic procedure, we suggest that these metal complexes can be most conveniently obtained by direct chelation.

2.4. Synthesis and Characterizations of [Ga(L)2]A Nanoparticles

Hyaluronic acid (HA) has been widely used for the delivery of drug molecules, exploiting the overexpression of the hyaluronan receptor CD-44 in numerous cancer cell lines [48,49,50]. Chemically, HA is rich in oxygen donors (carboxylate and hydroxyl) that can be useful for the delivery of metal-based medicines via binding to the metal ions. The sodium salt of HA, viz., NaA, in principle, can form stable nanoparticles with [Ga(L)2]NO3 via the ejection of NaNO3. [Ga(L)2]A nanoparticles were prepared by stirring a DMSO solution of [Ga(L)2]NO3 and an aqueous solution of NaA, followed by dialysis using a membrane with a molecular weight cutoff of 1000 Da. FT-IR spectroscopy showed that the peak at 1362 cm−1 (Figure S3), characteristic for NO3, was absent in [Ga(L)2]A, indicating that the anion exchange process was complete [42].
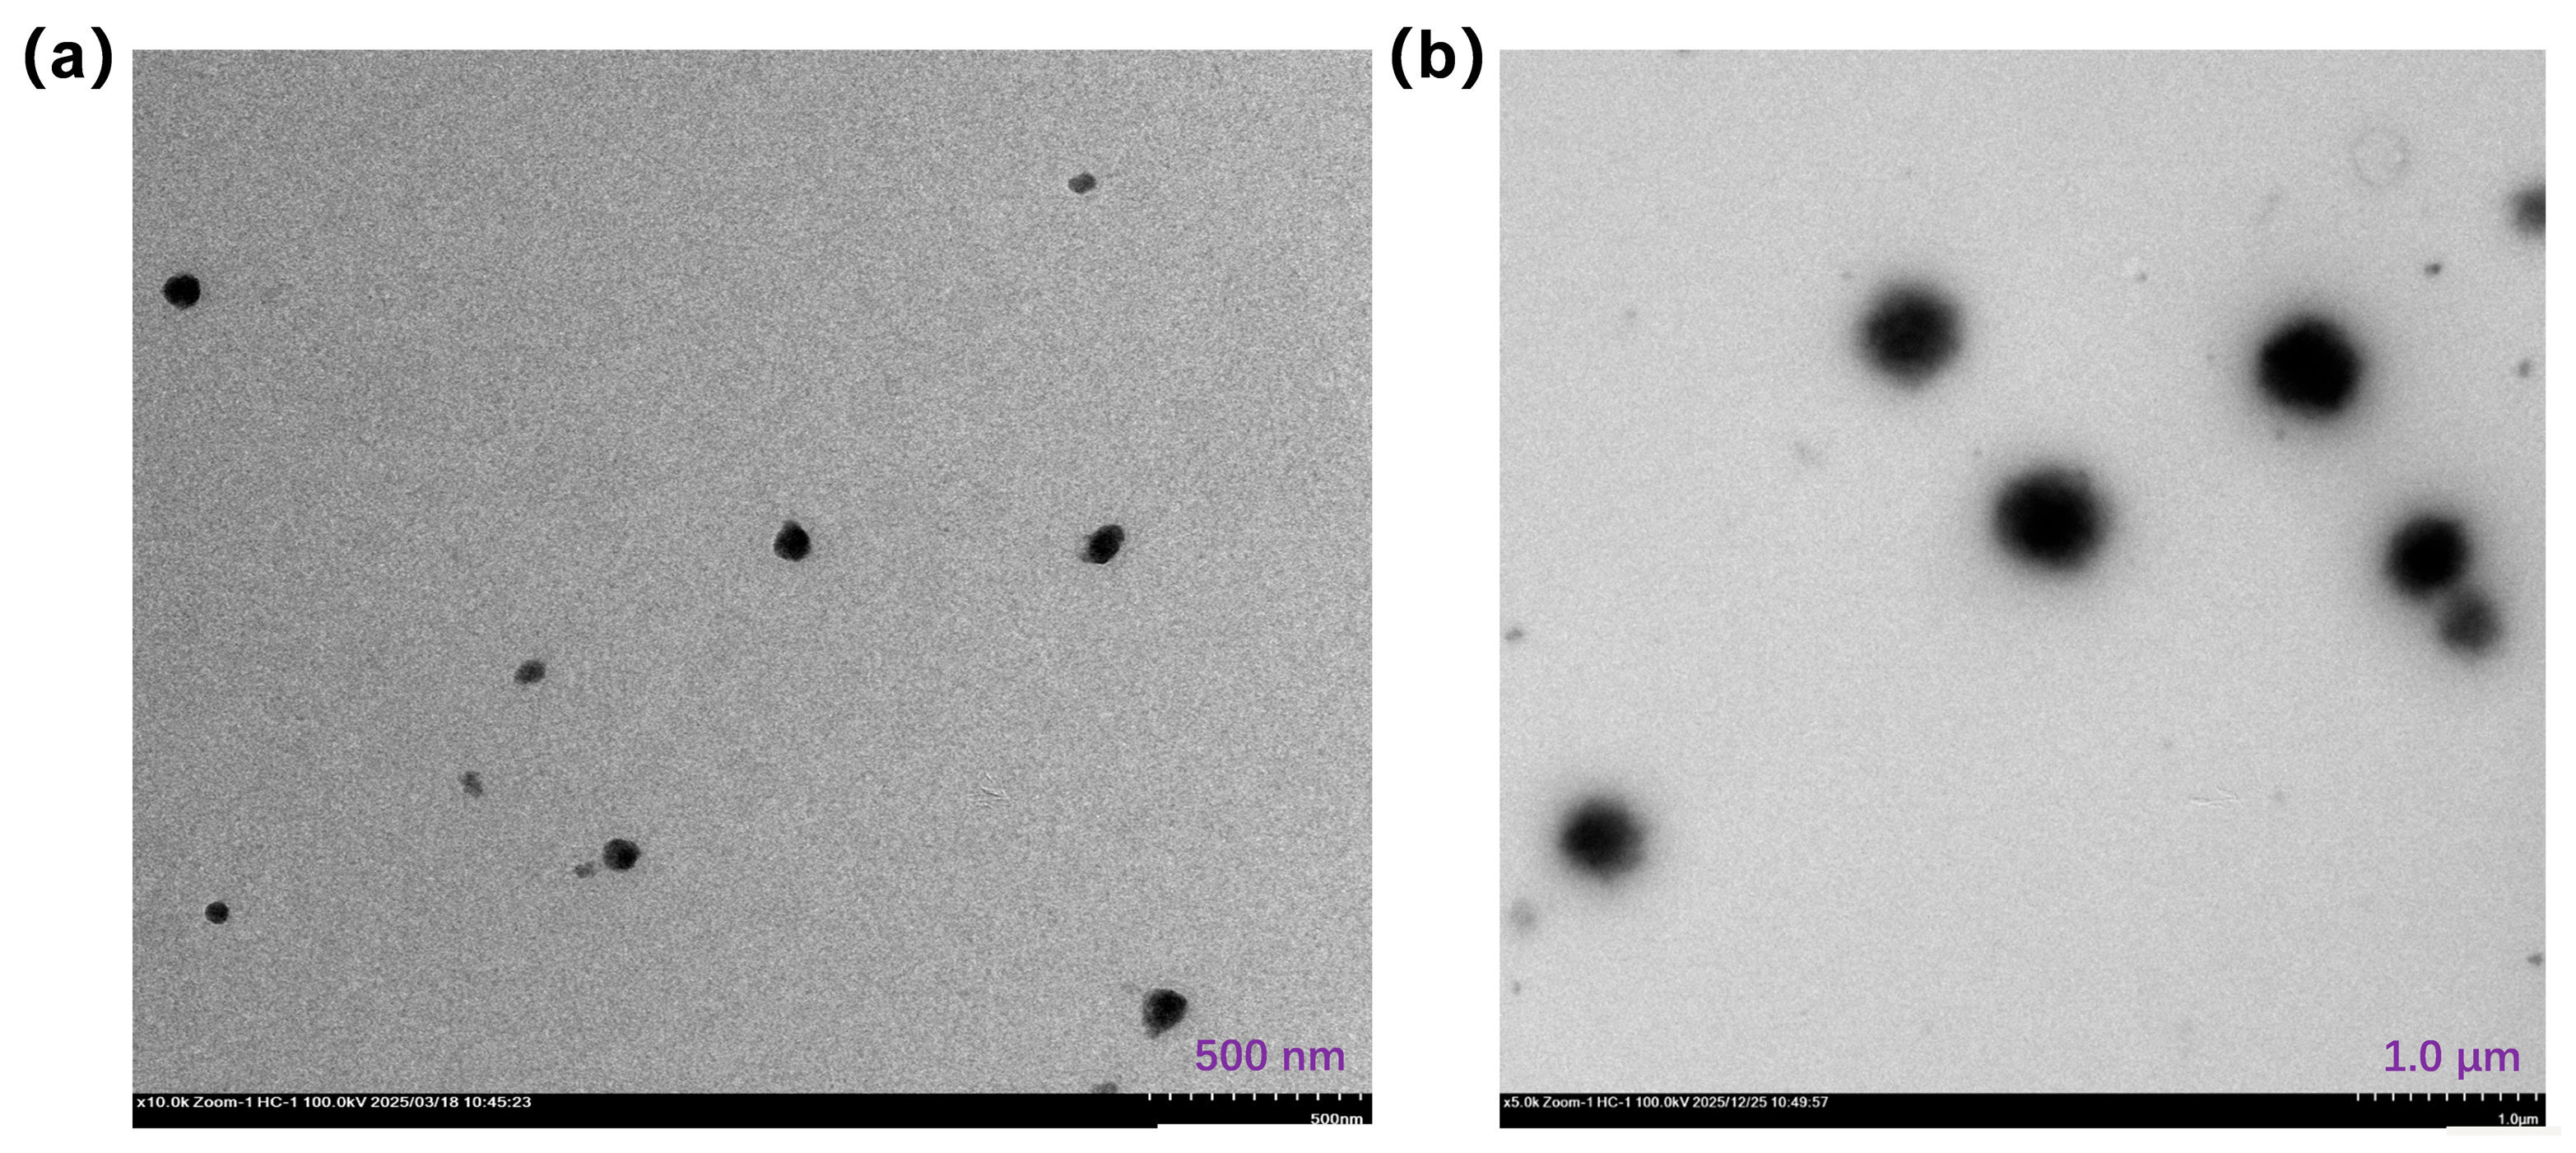
Transmission electron microscopy (TEM) indicated that the particle sizes for [Ga(L)2]A were 82 ± 15 nm (Figure 3a), which is conducive to cellular uptake. The average hydrodynamic diameters of these particles, determined by dynamic light scattering (DLS), were measured to be 195.2 nm (PDI = 0.456; Figure S11). Such sizes measured by DLS are significantly larger than the corresponding TEM-derived values due to the hydration of the micelles [25,51]. The zeta potential for [Ga(L)2]A was −26.1 mV, which is significantly different from that of [Ga(L)2]NO3 (3.09 mV) (Figure S12). Materials with neutral or positive zeta potentials generally exhibit enhanced cell binding affinity with cell membranes, although this may concurrently increase systemic toxicity [52]. Conversely, materials with negative zeta potentials, such as those described herein, are more likely to maintain prolonged plasma circulation, thereby optimizing enhanced cell permeability and retention (EPR) [53,54].
The advantage of ion pairs such as [Ga(L)2]NO3 to the formation of hyaluronate-based particles is showcased by comparison of particle formation with our previously reported [Cu(NO3)(L)]2 featuring a coordinated NO3 [22]. The reaction of [Cu(NO3)(L)]2 with NaA, following a similar protocol to that for [Ga(L)2]A, yielded much larger particles of around 440 nm (Figure 3b), and with partial replacement of NO3 (Figure S13). This is probably due to the coordination of the carboxylate to the Cu(II) center to yield cross-linked structures with the dimeric [Cu(NO3)(L)]2.
We examined the stability of [Ga(L)2]A in serum-containing medium, i.e., 0.1 × (RPMI + 10% FBS + 1% P/S), as well as in deionized water, recorded over 0–72 h at room temperature by direct observation and UV-Vis spectroscopy to measure the absorbance intensity change at 600 nm (A600) (Figure S14) [55]. Aggregation of nanoparticles with a diameter of around 100 nm will cause a reduction in light transmission at λ = 600 nm due to increased light scattering by the colloids. A600-based turbidity monitoring is therefore a practical and commonly used measure to follow changes in nanoparticle dispersions over time. Within 72 h, the A600 of [Ga(L)2]A did not show a time-dependent increase in either serum-containing medium or in deionized water (Figure S14). For direct observation, we intentionally used a more concentrated dispersion to make any potential agglomeration easier to observe. Again, there was no obvious agglomeration for these samples in the 0.1 × (RPMI + 10% FBS + 1% P/S) solution and deionized water. We therefore conclude that these particles are stable in serum-containing medium or deionized water and do not aggregate over time.

2.5. Cell Cytotoxicity Assay

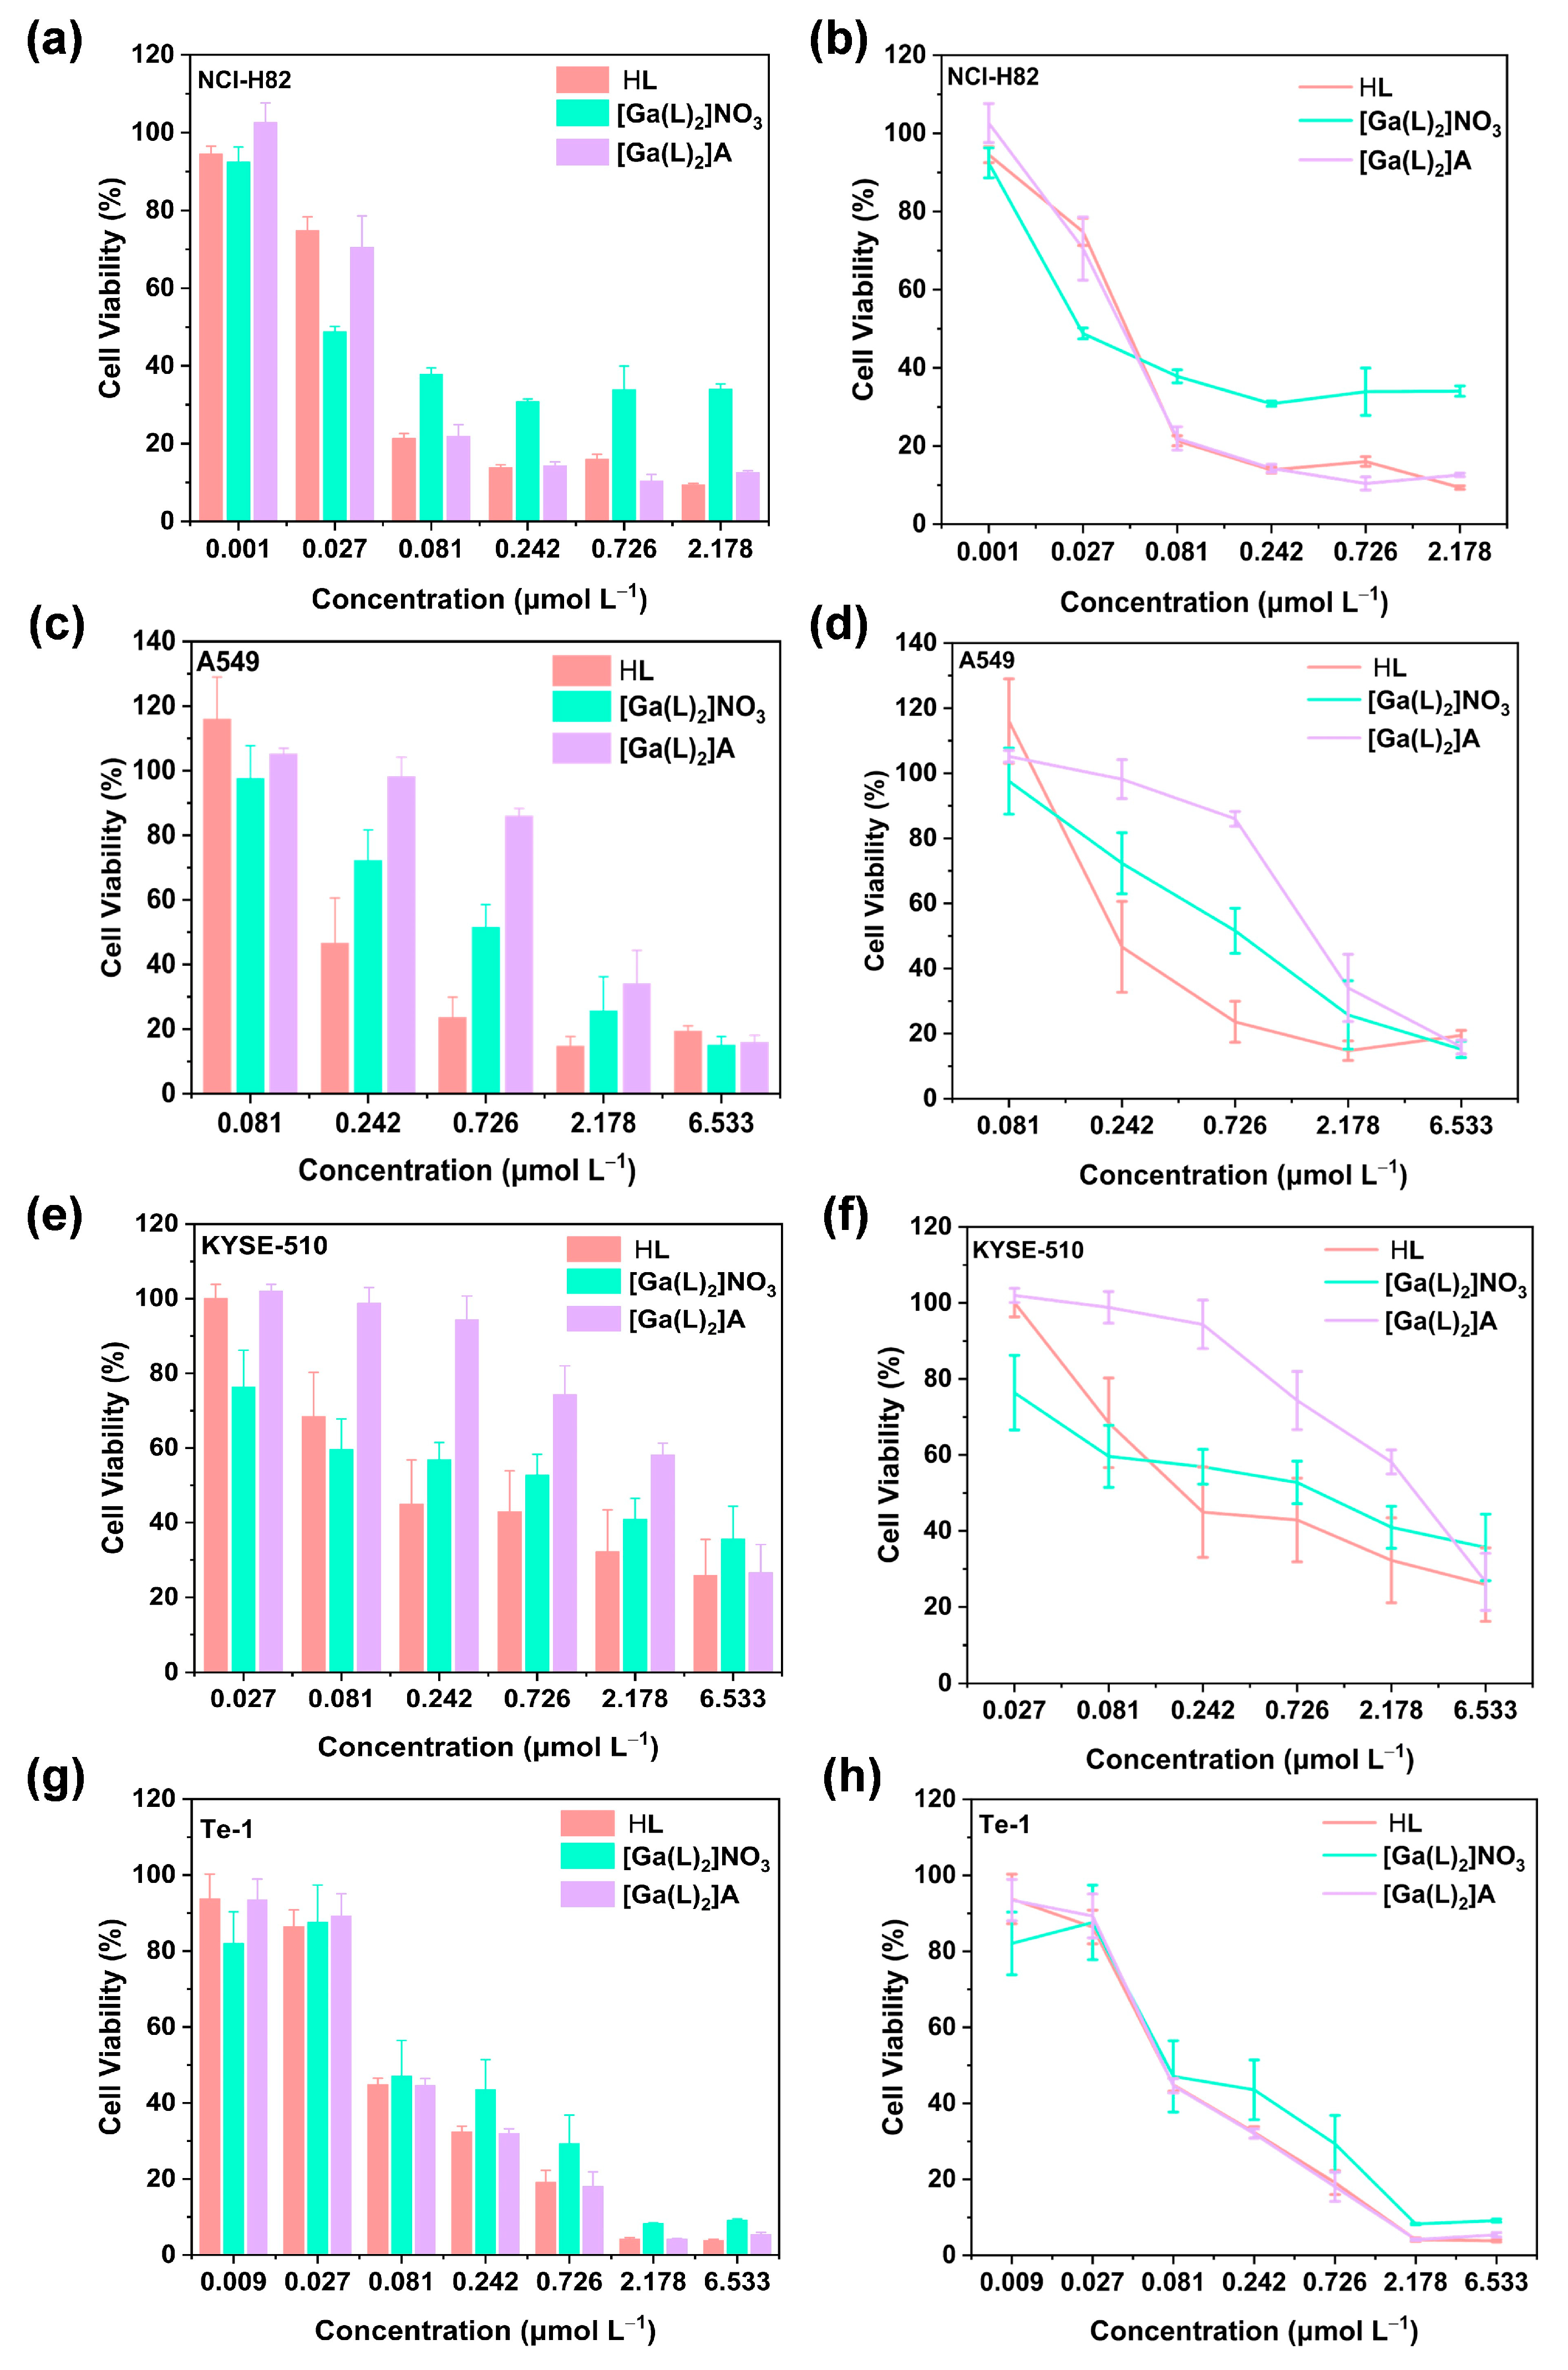
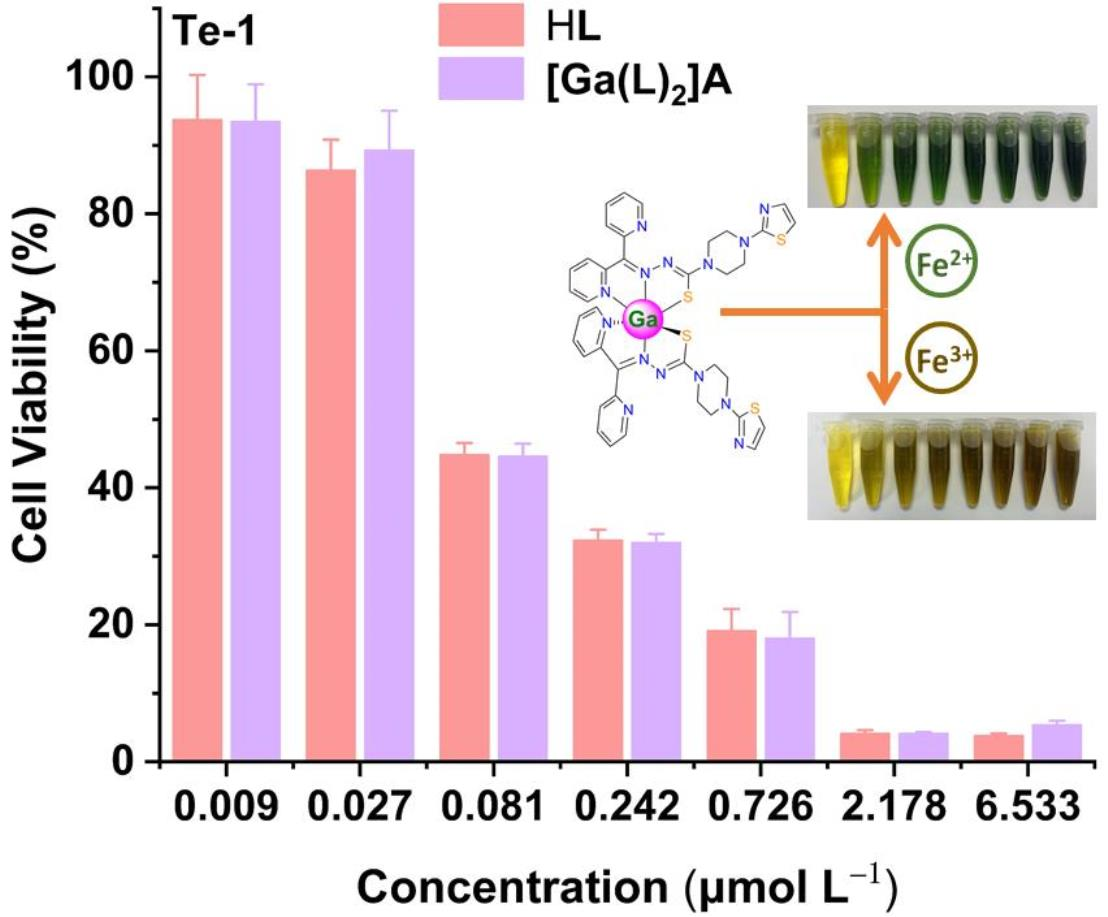
To evaluate the anticancer potency of [Ga(L)2]A, we assessed their inhibitory rates against four cancer cell lines: NCI-H82 (lung cancer), A549 (lung cancer), KYSE-510 (esophageal cancer), and Te-1 (esophageal cancer), and compared them with those for HL and [Ga(L)2]NO3. As shown in Figure 4a–h, both [Ga(L)2]NO3, and [Ga(L)2]A exhibited superior in vitro cytotoxicity against all these cell lines, featuring half maximal inhibitory concentration (IC50) values in the range of 0.102–2.616 μmol L−1 for [Ga(L)2]A (Table 3). These values are comparable to other Ga3+- and Fe3+-based TSC complexes reported in the literature, as well as the benchmarking drugs used clinically, such as DOX and cisplatin [56,57], indicating the potency of [Ga(L)2]A in killing diverse cancer cells.
It is also notable that comparing HL, [Ga(L)2]NO3, and [Ga(L)2]A, the free ligand HL exhibited the highest toxicity, followed by [Ga(L)2]NO3 and [Ga(L)2]A. This is presumably due to their different working mechanisms (i.e., different cellular uptake processes between small molecular drugs and nanoparticles, direct metal sequestration of the free ligand HL, and the necessity of metathesis for metal-based drugs).

2.6. Cellular Uptake of [Ga(L)2]A

To evaluate the contribution of hyaluronate in the cellular uptake process, we pretreated KYSE-510 cells with NaA followed by a dosage of [Ga(L)2]A (NaA-pretreated cells are denoted as [Ga(L)2]A′), and compared the results with those of directly administered [Ga(L)2]A. As shown in Table 4, the inductively coupled plasma mass spectrometric data (ICP-MS) showed that drug uptake by the cells increased with incubation time. However, the uptake of [Ga(L)2]A by KYSE-510 cells pretreated with NaA was lower than that of cells directly treated with [Ga(L)2]A. These results indicate that the drug [Ga(L)2]A modified by hyaluronic acid has a CD-44 targeting effect.

3. Materials and Methods

3.1. General

Ligand HL and [Cu(NO3)(L)]2 were synthesized as described in our previous report [22]. Ga(NO3)3·9H2O (99.99%, Xiya Chemical Technology Co., Ltd., Shandong, China), (NH4)2Fe(SO4)2·6H2O (99.5%, Shanghai Lingfeng Chemical Reagent Co., Ltd., Shanghai, China), NH4Fe(SO4)2·12H2O (99%, Macklin Biochemical Co., Ltd., Shanghai, China), Co(CH3COO)2 (98%, Shanghai Acmec Biochemical Co., Ltd., Shanghai, China), ZnCl2 (99.95%, Shanghai Aladdin Biochemical Technology Co., Ltd., Shanghai, China), NiBr2·xH2O (98%, Adamas Reagent Co., Ltd., Shanghai, China), Mn(CH3COO)2·4H2O (98%, Shanghai Titan Scientific Co., Ltd., Shanghai, China) and sodium hyaluronate (97%, Energy Chemicals, Shanghai, China) were available from the corresponding suppliers without further purification. CH2Cl2, CH3OH, N, N-dimethylformamide (DMF), dimethyl sulfoxide (DMSO), and diethyl ether (Et2O), all of analytical grade, were procured from Chinasun Specialty Products Co., Ltd. (Jiangsu, China).
Cell lines NCI-H82, A549, KYSE-510, and Te-1 were purchased from the Shanghai Institute of Cell Biology, Chinese Academy of Sciences (Shanghai, China). 0.25% Trypsin solution (containing EDTA, dissolved in PBS) was purchased from Procell Life Science & Technology Co., Ltd. (Hubei, China) Cell culturing medium RPMI 1640 (10% FBS + 1% P/S), RPMI 1640 (1% P/S), Ham’s F-12 (10% FBS + 1% P/S), Ham’s F-12 (1% P/S), and Phosphate-buffered solution (PBS) were purchased from Shanghai Basal Media Technologies Co., Ltd. (Shanghai, China) The cell counting kit-8 (CCK-8) was purchased from APExBIO Technology LLC (Shanghai, China).
1H nuclear magnetic resonance (NMR) spectra were recorded on a BRUKER AVANCE III HD 400 MHz superconducting NMR spectrometer (Bruker AXS GmbH, Karlsruhe, Germany). Fourier-transform infrared (FT-IR) spectra were measured using a Bruker VERTEX 70 + HYPERION 2000 FT-IR spectrometer (Bruker AXS GmbH, Karlsruhe, Germany), employing the attenuated total reflection (ATR) technique. Ultraviolet–visible (UV-Vis) spectra were acquired using a Varian Cary-50 UV-Vis spectrophotometer (Varian, Inc., Palo Alto, CA, USA). X-ray photoelectron spectroscopy (XPS) was performed on an EXCALAB 250 XI X-ray photoelectron spectrometer (Thermo Scientific, Waltham, MA, USA). Energy-dispersive X-ray spectroscopy (EDS) was conducted using a ZEISS EVO 18 scanning electron microscope (ZEISS Group, Oberkochen, Germany). Transmission electron microscopy (TEM) images were obtained using a HITACHI HT7700 transmission electron microscope (Hitachi, Tokyo, Japan), and samples were prepared by dropping aqueous solutions onto copper grids. Dynamic light scattering (DLS) and zeta potential measurements were performed using an LA-950S2 laser particle size analyzer (Horiba, Kyoto, Japan). The high-performance liquid chromatography–mass spectrometry (HPLC-MS) was carried out on an Agilent 1260 Infinity II Bio-SEC system (Agilent Technologies, Inc., Santa Clara, CA, USA). Inductively coupled plasma-mass spectrometry (ICP-MS) was performed with an iCAP PRO instrument (Thermo Scientific, Waltham, MA, USA). Cytotoxicity assays were performed on a TECAN M1000 PRO microplate reader (Tecan, Zürich, Switzerland) by measuring absorbance at 450 nm.

3.2. Synthesis of [Ga(L)2]NO3

Ga(NO3)3·9H2O (2.5 mg, 6.0 μmol) and HL (3.0 mg, 7.3 μmol) were added to a 10 mL centrifuge tube. CH3OH (3 mL) was then added dropwise under ambient conditions to achieve complete dissolution. The reaction mixture was stirred at room temperature for 24 h, followed by centrifugation to remove the precipitate. The clear yellow solution was diffused with anhydrous ether to give yellow block crystals of [Ga(L)2]NO3·as the CH3OH solvate after 7 days. The crystals were filtered, washed with anhydrous ether, and dried. Yield: 0.8 mg (23.3% based on HL). IR (ATR, cm−1): 3360(m), 2920(s), 2850(m), 1633(w), 1598(m), 1513(s), 1488(s), 1463(s), 1425(vs), 1362(vs), 1336(s), 1299(vs), 1276(vs), 1237(vs), 1224(vs), 1202(vs), 1173(s), 1133(vs), 1097(s), 1057(s), 1009(vs), 980(s), 956(m), 912(s), 870(w), 854(w), 823(s), 792(s), 746(s), 725(m), 696(w), 661(m), 646(m), 613(m). 1H NMR (400 MHz, DMSO-d6) δ 8.89 (d, J = 3.8 Hz, 2H), 8.32 (d, J = 7.7 Hz, 2H), 8.26–8.11 (m, 6H), 7.84 (d, J = 8.0 Hz, 2H), 7.76–7.66 (m, 4H), 7.18 (d, J = 3.2 Hz, 2H), 6.89 (d, J = 3.2 Hz, 2H), 3.94 (s, 8H), 3.49 (s, 8H).

3.3. Single-Crystal X-Ray Crystallography

Diffraction data were acquired on a Bruker APEX II CCD X-ray diffractometer (Bruker AXS GmbH, Karlsruhe, Germany) using Mo-Kα (λ = 0.71073 Å) irradiation for [Ga(L)2]NO3. Refinement of and reduction in the collected data were achieved using the program SAINT, and absorption corrections were performed using a multi-scan method [64]. The crystal structures of [Ga(L)2]NO3 were solved by direct methods and refined on F2 by full-matrix least-squares techniques with SHELXTL-2016 [65].
Crystallographic data for [Ga(L)2]NO3 have been deposited in the Cambridge Crystallographic Data Center (CCDC) as supplementary publication number 2482780. These data can be obtained free of charge either from the CCDC via www.ccdc.cam.ac.uk/data_request/cif (accessed on 10 October 2025), or from the Supplementary Information. A summary of the key crystallographic data for [Ga(L)2]NO3 is listed in Table 1.

3.4. Fe2+ Exchange with [Ga(L)2]NO3

[Ga(L)2]NO3 (3.0 mg, 3.2 μmol) and (NH4)2Fe(SO4)2·6H2O (1.2 mg, 3.2 μmol) were dissolved in 5 mL of DMF, and the mixture was stirred at room temperature for 72 h. The solution color gradually changed from orange-yellow to dark green. A portion of 50 mL H2O was then introduced, and the solution was extracted three times with 80 mL CH2Cl2. The CH2Cl2 layers were then combined, and the solvent was removed by rotary evaporation to give the yellowish-brown powder.

3.5. Fe3+ Exchange with [Ga(L)2]NO3

[Ga(L)2]NO3 (3.0 mg, 3.2 μmol) and NH4Fe(SO4)2·12H2O (1.5 mg, 3.2 μmol) were dissolved in 5 mL of DMF, and the mixture was stirred at room temperature for 72 h. The solution changed from orange-yellow to yellowish-brown. A portion of 50 mL H2O was then introduced, and the solution was extracted three times with 80 mL CH2Cl2. The CH2Cl2 layers were then combined, and the solvent was removed by rotary evaporation to give the yellowish-brown powder.

3.6. Ion Exchange of [Ga(L)2]NO3 with Different Transition Metal Ions

[Ga(L)2]NO3 (10.0 mg, 10.56 μmol) and an equivalent of the respective metal salt Cu(NO3)2·xH2O, Mn(CH3COO)2·4H2O, Co(CH3COO)2, NiBr2·xH2O, or ZnCl2 were dissolved in 10 mL of CH3OH, and the mixture was stirred at room temperature for 72 h. The CH2Cl2 phase was extracted with water three times, and the solvent was then removed by rotary evaporation to afford the respective ion exchange products subjected to EDS analysis.

3.7. Exchange Rate Comparison Between [Ga(L)2]NO3 and Fe2+/Fe3+

A DMF solution of [Ga(L)2]NO3 with a concentration of 3.17 × 10⁻⁴ mol·L−1 (10.0 mL) was prepared. An aqueous solution of (NH4)2Fe(SO4)2·6H2O (1.26 × 10⁻² mol·L−1) was then added to achieve an equimolar ratio of Fe(II) to [Ga(L)2]NO3. The reaction mixture was maintained at 60 °C, and aliquots were withdrawn at 0, 2, 10, 20, 40, 60, 120, 240, 360, 480, 600, and 1440 min. Each aliquot was diluted 10-fold with DMF before measurement, and the time-dependent spectral changes at 654 nm were monitored by UV-Vis absorption spectroscopy. Titration experiments with Fe3+ were carried out in the same manner using NH4Fe(SO4)2·12H2O.

3.8. Stability Analysis of [Ga(L)2]A

[Ga(L)2]A was respectively dispersed in 0.1 × (RPMI + 10% FBS + 1% P/S) solution and in deionized water. Each solution was gently shaken and then stored at room temperature under static conditions. Aliquots were collected at different time intervals (0, 24, 48, and 72 h) to record the absorbance at λ = 600 nm (A600), using the corresponding 0.1 × (RPMI + 10% FBS + 1% P/S) solution or deionized water as the blank.

3.9. Titration Experiment

For the titration with Fe2+, a DMF solution of [Ga(L)2]NO3 with a concentration of 1.06 × 10⁻³ mol·L−1 and an aqueous solution of (NH4)2Fe(SO4)2·6H2O with a concentration of 1.28 × 10⁻² mol·L−1 were prepared as the titrant. Eight aliquots (3 mL each) of the complex solution were treated with different volumes of the Fe2+ titrant to achieve Fe2+ equivalent ratios of 0, 0.2, 0.4, 0.6, 0.8, 1.0, 1.2, and 1.4 eq relative to the complex. After reacting at room temperature for 0.5 h, 6 h, and 72 h, respectively, each reaction mixture was diluted 40 times with DMF, and its spectral changes were monitored by UV-Vis spectroscopy. The titration experiments with Fe3+ were carried out in the same manner using NH4Fe(SO4)2·12H2O.

3.10. Nanoparticle Formations of [Ga(L)2]A

[Ga(L)2]NO3 (10.0 mg, 10.6 μmol) was dissolved in DMSO (1 mL) and then added dropwise to an aqueous solution of sodium hyaluronate (68.8 mg in 11 mL of water). The mixture was stirred at r.t. and protected from light for 72 h to obtain the resulting nanoparticles, which were dialyzed for 24 h (molecular weight cut-off of 1000 Da) to obtain [Ga(L)2]A. The preparation process for Cu-based particles was similar except that [Cu(NO3)(L)]2 [22] was used instead of [Ga(L)2]NO3.

3.11. Determination of the Concentration of [Ga(L)2]A

The concentration of [Ga(L)2]A was determined by UV-Vis spectroscopy. A calibration curve was established using [Ga(L)2]NO3 as the reference. A series of standard aqueous solutions with different concentrations was prepared, and their absorbance values at 420 nm (LMCT band) were recorded. A linear relationship between the absorbance and concentration was observed within the tested concentration range (Figure S15). The aqueous dispersion of [Ga(L)2]A was measured under identical conditions, and its absorbance at 420 nm was converted to concentration using the calibration curve. As each [Ga(L)2]+ unit contains a pair of ligands, the calculated [Ga(L)2]+ concentration was multiplied by two to obtain the ligand-equivalent concentration, which was used consistently for dose definition in all biological experiments.

3.12. In Vitro Cytotoxicity Evaluation by CCK-8 Assay

The NCI-H82 cell line (suspension-grown) was cultured in RPMI 1640 medium supplemented with 10% FBS, 1% P/S, or RPMI 1640 medium containing 1% P/S. Specifically, the suspension-grown cells were centrifuged, and the supernatant was discarded. The cells were resuspended in serum-supplemented RPMI 1640 medium at a concentration of 1 × 10⁵ cells mL−1. These cells were cultured at 37 °C under a 5% CO2 atmosphere for the CCK-8 assays.
NCI-H82 cells were seeded at a density of 2 × 10⁴ cells per well in 100 µL of serum-free medium (RPMI 1640 + 1% P/S) containing various concentrations of HL, [Ga(L)2]NO3, [Ga(L)2]A. All experiments were conducted with five replicates (n = 5), using untreated cells as the 100% cell viability control and cell-free medium (RPMI 1640 + 10 µL FBS + 1% P/S + CCK-8) as the blank.
The NCI-H82 cells were incubated continuously for 72 h. After the incubation period, 10 µL FBS and 10 µL CCK-8 were added to the wells, and the plates were further incubated for 3.5 h before analysis at 450 nm using a microplate reader. The relative cell viability (%) was calculated using Equation (1) as described below:
V % = [ A ] e x p e r i m e n t a l [ A ] b l a n k [ A ] c o n t r o l [ A ] b l a n k × 100 %
in which V% is the percentage of cell viability, [A]experimental is the absorbance of the wells culturing the treated cells, [A]blank is the absorbance of the blank, and [A]control is the absorbance of the wells culturing untreated cells.
The A549 cell line (adherent cells) was cultured in Ham’s F-12 medium supplemented with 10% FBS, 1% P/S, or Ham’s F-12 medium containing 1% P/S. Specifically, the adherent cells grew as a monolayer and were detached at confluence using trypsin (0.5% w/v in PBS). After trypsinization, the cells were incubated for 3 min, centrifuged, and the supernatant was discarded. A 3 mL portion of serum-supplemented culture medium was added to neutralize any residual trypsin. The cells were re-suspended in serum-supplemented Ham’s F-12 medium at a concentration of 1 × 10⁵ cells mL−1 and cultured under standard conditions (37 °C, 5% CO2) for the CCK-8 studies.
A549 cells were seeded at a density of 1 × 10⁴ cells per well in 90 µL of culture medium (Ham’s F-12 + 10% FBS + 1% P/S) and cultured for 24 h at 37 °C and 5% CO2 to allow cell attachment. The culture medium was then replaced with serum-free medium (Ham’s F-12 + 1% P/S) containing various concentrations of the HL, [Ga(L)2]NO3, [Ga(L)2]A. All experiments were performed with five replicates (n = 5), using untreated cells as the 100% cell viability control and cell-free medium (Ham’s F-12 + 10% FBS + 1% P/S + CCK-8) as the blank.
The A549 cells were incubated continuously for 72 h. After the incubation period, 10 µL of FBS and 10 µL of CCK-8 were added to each well, and the plates were incubated for an additional 2.5 h before being analyzed at 450 nm using a microplate reader. The relative cell viability (%) was calculated using Equation (1) above.
For the KYSE-510 (adherent cells) and Te-1 (adherent cells) cell lines, the cytotoxicity assessment followed a similar protocol to that of the A549 cells, with the exception of the culture media. KYSE-510 cells were cultured in a 1:1 mixture of RPMI 1640 and Ham’s F-12 media, while Te-1 cells were cultured in RPMI 1640 medium. The exact compositions were: RPMI 1640:Ham’s F-12 = 1:1 + 10% FBS + 1% P/S and RPMI 1640:Ham’s F-12 = 1:1 + 1% P/S for KYSE-510; RPMI 1640 + 10% FBS + 1% P/S and RPMI 1640 + 1% P/S for Te-1.

3.13. Cellular Uptake

KYSE-510 cells were seeded into six 10 cm cell culture dishes at a density of 2 × 10⁵ cells per dish. Cells were cultured in serum-supplemented medium (RPMI 1640:Ham’s F-12 = 1:1 + 10% FBS + 1% P/S) until reaching approximately 95% confluence. The medium was then replaced with serum-free medium. To distinguish the group pretreated with sodium hyaluronate from the direct treatment group, designated [Ga(L)2]A, the pretreated group was labeled [Ga(L)2]A′. For the pretreated group, dishes were pretreated with 30 mg of sodium hyaluronate for 24 h prior to the addition of [Ga(L)2]A, while the [Ga(L)2]A group was administered the drug directly. Both groups were exposed to [Ga(L)2]A at a final HL concentration of 50 μM. Cells were incubated with the compound for 2 h, 4 h, or 6 h. Following incubation, cells were washed three times with PBS buffer and harvested via trypsin digestion. The harvested cells were collected into 15-mL centrifuge tubes and centrifuged at 900 rpm for 3 min. The resulting pellet was washed twice with PBS and centrifuged again. For metal content analysis, the cell pellet was digested with 0.4 mL concentrated nitric acid. The digest was diluted to 3 mL with deionized water, filtered through a 0.45 μm membrane, and subjected to ICP-MS analysis to quantify the Ga3+ concentration.

4. Conclusions

Intrigued by the biocompatibility of Ga3+ and the similarities between Ga3+ and Fe3+, we have demonstrated that the thiosemicarbazone ligand HL can form a biologically active, cationic octahedral complex [Ga(L)2]NO3, and that nitrate-for-hyaluronate surrogation further yielded [Ga(L)2]A as a nanomedicine that endowed the material with aqueous solubility and cell selectivity. The facile yet gradual metathesis of [Ga(L)2]NO3 with both Fe2+ and Fe3+ suggests that [Ga(L)2]NO3 could be a promising anticancer drug with ‘stealth’ properties during drug delivery. Further investigation of the mechanisms of action, oral bioavailability, and in vivo performance is needed in pursuit of these goals.

Supplementary Materials

The following supporting information can be downloaded at: https://www.mdpi.com/article/10.3390/molecules31030577/s1, Additional structure diagrams, spectroscopies, and a hydrogen-bonding table.

Author Contributions

Conceptualization, W.-H.Z.; methodology, Y.N.; validation, M.-L.D. and W.-H.Z.; formal analysis, Y.N.; data curation, Y.N.; writing—original draft preparation, Y.N.; writing—review and editing, W.-H.Z. and D.J.Y.; supervision, W.-H.Z.; project administration, W.-H.Z.; funding acquisition, W.-H.Z. All authors have read and agreed to the published version of the manuscript.

Funding

This work was financially supported by Suzhou Municipal Health Commission (MSXM2024020, SKYD2023143), Suzhou Municipal Science and Technology Bureau (SKY2023203), and Guangdong Provincial Key Laboratory of New Drug Screening, Southern Medical University.

Institutional Review Board Statement

Not applicable.

Informed Consent Statement

Not applicable.

Data Availability Statement

Data are contained within the article and Supplementary Materials.

Conflicts of Interest

The authors declare no conflicts of interest.

References

  1. Kalinowski, D.S.; Quach, P.; Richardson, D.R. Thiosemicarbazones: The new wave in cancer treatment. Future Med. Chem. 2009, 1, 1143–1151. [Google Scholar] [CrossRef] [Scilit]
  2. Serda, M.; Kalinowski, D.S.; Rasko, N.; Potůčková, E.; Mrozek-Wilczkiewicz, A.; Musiol, R.; Małecki, J.G.; Sajewicz, M.; Ratuszna, A.; Muchowicz, A.; et al. Exploring the anti-cancer activity of novel thiosemicarbazones generated through the combination of retro-fragments: Dissection of critical structure-activity relationships. PLoS ONE 2014, 9, e110291. [Google Scholar] [CrossRef] [Scilit] [PubMed]
  3. Dilworth, J.R.; Hueting, R. Metal complexes of thiosemicarbazones for imaging and therapy. Inorg. Chim. Acta 2012, 389, 3–15. [Google Scholar] [CrossRef] [Scilit]
  4. Shakya, B.; Yadav, N.P. Thiosemicarbazones as potent anticancer agents and their modes of action. Mini-Rev. Med. Chem. 2020, 20, 638–661. [Google Scholar] [CrossRef] [Scilit] [PubMed]
  5. Rudnev, A.V.; Foteeva, L.S.; Kowol, C.; Berger, R.; Jakupec, M.A.; Arion, V.B.; Timerbaev, A.R.; Keppler, B.K. Preclinical characterization of anticancer gallium(III) complexes: Solubility, stability, lipophilicity and binding to serum proteins. J. Inorg. Biochem. 2006, 100, 1819–1826. [Google Scholar] [CrossRef] [Scilit]
  6. Kowol, C.R.; Berger, R.; Eichinger, R.; Roller, A.; Jakupec, M.A.; Schmidt, P.P.; Arion, V.B.; Keppler, B.K. Gallium(III) and iron(III) complexes of α-N-heterocyclic thiosemicarbazones:  Synthesis, characterization, cytotoxicity, and interaction with ribonucleotide reductase. J. Med. Chem. 2007, 50, 1254–1265. [Google Scholar] [CrossRef] [Scilit]
  7. Yuan, J.; Lovejoy, D.B.; Richardson, D.R. Novel di-2-pyridyl–derived iron chelators with marked and selective antitumor activity: In Vitro and in vivo assessment. Blood 2004, 104, 1450–1458. [Google Scholar] [CrossRef] [Scilit]
  8. Richardson, D.R.; Kalinowski, D.S.; Richardson, V.; Sharpe, P.C.; Lovejoy, D.B.; Islam, M.; Bernhardt, P.V. 2-acetylpyridine thiosemicarbazones are potent iron chelators and antiproliferative agents: Redox activity, iron complexation and characterization of their antitumor activity. J. Med. Chem. 2009, 52, 1459–1470. [Google Scholar] [CrossRef] [Scilit]
  9. Lovejoy, D.B.; Sharp, D.M.; Seebacher, N.; Obeidy, P.; Prichard, T.; Stefani, C.; Basha, M.T.; Sharpe, P.C.; Jansson, P.J.; Kalinowski, D.S.; et al. Novel second-generation di-2-pyridylketone thiosemicarbazones show synergism with standard chemotherapeutics and demonstrate potent activity against lung cancer xenografts after oral and intravenous administration in vivo. J. Med. Chem. 2012, 55, 7230–7244. [Google Scholar] [CrossRef] [Scilit]
  10. Ma, B.; Goh, B.C.; Tan, E.H.; Lam, K.C.; Soo, R.; Leong, S.S.; Wang, L.Z.; Mo, F.; Chan, A.T.C.; Zee, B.; et al. A multicenter phase II trial of 3-aminopyridine-2-carboxaldehyde thiosemicarbazone (3-AP, Triapine®) and gemcitabine in advanced non-small-cell lung cancer with pharmacokinetic evaluation using peripheral blood mononuclear cells. Investig. New Drugs 2008, 26, 169–173. [Google Scholar] [CrossRef] [Scilit]
  11. DeConti, R.C.; Toftness, B.R.; Agrawal, K.C.; Tomchick, R.; Mead, J.A.R.; Bertino, J.R.; Sartorelli, A.C.; Creasey, W.A. Clinical and pharmacological studies with 5-hydroxy-2-formylpyridine thiosemicarbazone. Cancer Res. 1972, 32, 1455–1462. [Google Scholar] [PubMed]
  12. Westin, S.N.; Nieves-Neira, W.; Lynam, C.; Salim, K.Y.; Silva, A.D.; Ho, R.T.; Mills, G.B.; Coleman, R.L.; Janku, F.; Matei, D. Abstract CT033: Safety and early efficacy signals for COTI-2, an orally available small molecule targeting p53, in a phase I trial of recurrent gynecologic cancer. Cancer Res. 2018, 78, CT033. [Google Scholar] [CrossRef] [Scilit]
  13. Bormio Nunes, J.H.; Hager, S.; Mathuber, M.; Pósa, V.; Roller, A.; Enyedy, É.A.; Stefanelli, A.; Berger, W.; Keppler, B.K.; Heffeter, P.; et al. Cancer cell resistance against the clinically investigated thiosemicarbazone COTI-2 is based on formation of intracellular copper complex glutathione adducts and ABCC1-mediated efflux. J. Med. Chem. 2020, 63, 13719–13732. [Google Scholar] [CrossRef] [Scilit] [PubMed]
  14. Lessa, J.A.; Parrilha, G.L.; Beraldo, H. Gallium complexes as new promising metallodrug candidates. Inorg. Chim. Acta 2012, 393, 53–63. [Google Scholar] [CrossRef] [Scilit]
  15. Bernstein, L.R. Mechanisms of therapeutic activity for Gallium. Pharmacol. Rev. 1998, 50, 665–682. [Google Scholar] [CrossRef] [Scilit]
  16. Zhang, X.; Yang, X.-R.; Huang, X.-W.; Wang, W.-M.; Shi, R.-Y.; Xu, Y.; Wang, Z.; Qiu, S.-J.; Fan, J.; Zhou, J. Sorafenib in treatment of patients with advanced hepatocellular carcinoma: A systematic review. Hepatob. Pancreat. Dis. 2012, 11, 458–466. [Google Scholar] [CrossRef] [Scilit]
  17. Collery, P.; Keppler, B.; Madoulet, C.; Desoize, B. Gallium in cancer treatment. Crit. Rev. Oncol. Hemat. 2002, 42, 283–296. [Google Scholar] [CrossRef] [Scilit]
  18. He, J.; Ye, Y.; Zhang, D.; Yao, K.; Zhou, M. Visualized Gallium/lyticase-integrated antifungal strategy for fungal keratitis treatment. Adv. Mater. 2022, 34, 2206437. [Google Scholar] [CrossRef] [Scilit]
  19. Hofheinz, R.; Dittrich, C.; Jakupec, M.A.; Drescher, A.; Jaehde, U.; Gneist, M.; Graf von Keyserlingk, N.; Keppler, B.K.; Hochhaus, A. Early results from a phase I study on orally administered tris(8-quinolinolato)gallium(III) (FFC11, KP46) in patients with solid tumors—A CESAR study (Central European Society for Anticancer Drug Research—EWIV). Int. J. Clin. Pharm. Ther. 2005, 43, 590–591. [Google Scholar] [CrossRef] [Scilit]
  20. Wilke, N.L.; Abodo, L.O.; Frias, C.; Frias, J.; Baas, J.; Jakupec, M.A.; Keppler, B.K.; Prokop, A. The gallium complex KP46 sensitizes resistant leukemia cells and overcomes Bcl-2-induced multidrug resistance in lymphoma cells via upregulation of Harakiri and downregulation of XIAP in vitro. Biomed. Pharmacother. 2022, 156, 113974. [Google Scholar] [CrossRef] [Scilit]
  21. Hreusova, M.; Novohradsky, V.; Markova, L.; Kostrhunova, H.; Potočňák, I.; Brabec, V.; Kasparkova, J. Gallium(III) complex with cloxyquin ligands induces ferroptosis in cancer cells and is a potent agent against both differentiated and tumorigenic cancer stem rhabdomyosarcoma cells. Bioinorg. Chem. Appl. 2022, 2022, 3095749. [Google Scholar] [CrossRef] [Scilit]
  22. Luo, S.-Y.; Zeng, C.-M.; Xu, P.; Ning, Y.; Dong, M.-L.; Zhang, W.-H.; Yu, G. Thiazole functionalization of thiosemicarbazone for Cu(II) complexation: Moving toward highly efficient anticancer drugs with promising oral bioavailability. Molecules 2024, 29, 3832. [Google Scholar] [CrossRef] [Scilit]
  23. Cao, F.-L.; Zhang, Z.-S.; Dong, M.-L.; Ning, Y.; Zhang, W.-H.; Mao, Y.; Young, D.J. A high-entropy coordination cage featuring an Au-porphyrin metalloligand for the photodynamic therapy of liver cancer. Chem. Commun. 2025, 61, 6663–6666. [Google Scholar] [CrossRef] [Scilit]
  24. Li, W.; Li, R.; Ye, Q.; Zou, Y.; Lu, X.; Zhang, W.; Chen, J.; Zhao, Y. Mn3O4 nanoshell coated metal–organic frameworks with microenvironment-driven O2 production and GSH exhaustion ability for enhanced chemodynamic and photodynamic cancer therapies. Adv. Healthc. Mater. 2023, 12, 2202280. [Google Scholar] [CrossRef] [Scilit]
  25. Hou, Y.-K.; Zhang, Z.-J.; Li, R.-T.; Peng, J.; Chen, S.-Y.; Yue, Y.-R.; Zhang, W.-H.; Sun, B.; Chen, J.-X.; Zhou, Q. Remodeling the tumor microenvironment with core–shell nanosensitizer featuring dual-modal imaging and multimodal therapy for breast cancer. ACS Appl. Mater. Interfaces 2023, 15, 2602–2616. [Google Scholar] [CrossRef] [Scilit] [PubMed]
  26. Stefani, C.; Punnia-Moorthy, G.; Lovejoy, D.B.; Jansson, P.J.; Kalinowski, D.S.; Sharpe, P.C.; Bernhardt, P.V.; Richardson, D.R. Halogenated 2′-benzoylpyridine thiosemicarbazone (XBpT) chelators with potent and selective anti-neoplastic activity: Relationship to intracellular redox activity. J. Med. Chem. 2011, 54, 6936–6948. [Google Scholar] [CrossRef] [Scilit] [PubMed]
  27. Kalinowski, D.S.; Yu, Y.; Sharpe, P.C.; Islam, M.; Liao, Y.-T.; Lovejoy, D.B.; Kumar, N.; Bernhardt, P.V.; Richardson, D.R. Design, synthesis, and characterization of novel iron chelators: Structure–activity relationships of the 2-benzoylpyridine thiosemicarbazone series and their 3-nitrobenzoyl analogues as potent antitumor agents. J. Med. Chem. 2007, 50, 3716–3729. [Google Scholar] [CrossRef] [Scilit]
  28. Milunovic, M.N.M.; Ohui, K.; Besleaga, I.; Petrasheuskaya, T.V.; Dömötör, O.; Enyedy, É.A.; Darvasiova, D.; Rapta, P.; Barbieriková, Z.; Vegh, D.; et al. Copper(II) complexes with isomeric morpholine-substituted 2-formylpyridine thiosemicarbazone hybrids as potential anticancer drugs inhibiting both ribonucleotide reductase and tubulin polymerization: The morpholine position matters. J. Med. Chem. 2024, 67, 9069–9090. [Google Scholar] [CrossRef] [Scilit] [PubMed]
  29. Man, X.; Li, S.; Xu, G.; Li, W.; Zhu, M.; Zhang, Z.; Liang, H.; Yang, F. Developing a copper(II) isopropyl 2-pyridyl ketone thiosemicarbazone compound based on the IB subdomain of human serum albumin–indomethacin complex: Inhibiting tumor growth by remodeling the tumor microenvironment. J. Med. Chem. 2024, 67, 5744–5757. [Google Scholar] [CrossRef] [Scilit]
  30. Li, A.; Huang, K.; Pan, W.; Wu, Y.; Liang, Y.; Zhang, Z.; Wu, D.; Ma, L.; Gou, Y. Thiosemicarbazone mixed-valence Cu(I/II) complex against lung adenocarcinoma cells through multiple pathways involving cuproptosis. J. Med. Chem. 2024, 67, 9091–9103. [Google Scholar] [CrossRef] [Scilit]
  31. Stacy, A.E.; Palanimuthu, D.; Bernhardt, P.V.; Kalinowski, D.S.; Jansson, P.J.; Richardson, D.R. Zinc(II)–thiosemicarbazone complexes are localized to the lysosomal compartment where they transmetallate with copper ions to induce cytotoxicity. J. Med. Chem. 2016, 59, 4965–4984. [Google Scholar] [CrossRef] [Scilit]
  32. Qi, J.; Zhao, W.; Zheng, Y.; Wang, R.; Chen, Q.; Wang, F.-A.; Fan, W.; Gao, H.; Xia, X. Single-crystal structure and intracellular localization of Zn(II)-thiosemicarbazone complex targeting mitochondrial apoptosis pathways. Bioorg. Med. Chem. Lett. 2020, 30, 127340. [Google Scholar] [CrossRef] [Scilit]
  33. Xue, W.; Ronson, T.K.; Lu, Z.; Nitschke, J.R. Solvent drives switching between Λ and Δ metal center stereochemistry of M8L6 cubic cages. J. Am. Chem. Soc. 2022, 144, 6136–6142. [Google Scholar] [CrossRef] [Scilit] [PubMed]
  34. Carcelli, M.; Tegoni, M.; Bartoli, J.; Marzano, C.; Pelosi, G.; Salvalaio, M.; Rogolino, D.; Gandin, V. In Vitro and in vivo anticancer activity of tridentate thiosemicarbazone copper complexes: Unravelling an unexplored pharmacological target. Eur. J. Med. Chem. 2020, 194, 112266. [Google Scholar] [CrossRef] [Scilit] [PubMed]
  35. Kaya, B.; Gholam Azad, M.; Suleymanoglu, M.; Harmer, J.R.; Wijesinghe, T.P.; Richardson, V.; Zhao, X.; Bernhardt, P.V.; Dharmasivam, M.; Richardson, D.R. Isosteric replacement of sulfur to selenium in a thiosemicarbazone: Promotion of Zn(II) complex dissociation and transmetalation to augment anticancer efficacy. J. Med. Chem. 2024, 67, 12155–12183. [Google Scholar] [CrossRef] [Scilit]
  36. Fathy, A.; Ibrahim, A.B.M.; Elkhalik, S.A.; Villinger, A.; Abbas, S.M. New iron(III) complexes with 2-formylpyridine thiosemicarbazones: Synthetic aspects, structural and spectral analyses and cytotoxicity screening against MCF-7 human cancer cells. Heliyon 2023, 9, e13008. [Google Scholar] [CrossRef] [Scilit] [PubMed]
  37. Spek, A.L. Single-crystal structure validation with the program PLATON. J. Appl. Cryst. 2003, 36, 7–13. [Google Scholar] [CrossRef] [Scilit]
  38. Wiles, D.M.; Suprunchuk, T. The C=S stretching vibration in the infrared spectra of some thiosemicarbazones. II. Aldehyde thiosemicarbazones containing aromatic groups. Can. J. Chem. 1967, 45, 2258–2263. [Google Scholar] [CrossRef] [Scilit]
  39. West, D.X.; Billeh, I.S.; Jasinski, J.P.; Jasinski, J.M.; Butcher, R.J. Complexes of N(4)-cyclohexylsemicarbazones and N(4)-cyclohexylthiosemicarbazones derived from 2-formyl-, 2-acetyl- and 2-benzoylpyridine. Transit. Met. Chem. 1998, 23, 209–214. [Google Scholar] [CrossRef] [Scilit]
  40. Quiroga, A.G.; Pérez, J.M.; López-Solera, I.; Montero, E.I.; Masaguer, J.R.; Alonso, C.; Navarro-Ranninger, C. Binuclear chloro-bridged palladated and platinated complexes derived from p-isopropylbenzaldehyde thiosemicarbazone with cytotoxicity against cisplatin resistant tumor cell lines. J. Inorg. Biochem. 1998, 69, 275–281. [Google Scholar] [CrossRef] [Scilit]
  41. John, R.P.; Sreekanth, A.; Rajakannan, V.; Ajith, T.A.; Kurup, M.R.P. New copper(II) complexes of 2-hydroxyacetophenone N(4)-substituted thiosemicarbazones and polypyridyl co-ligands: Structural, electrochemical and antimicrobial studies. Polyhedron 2004, 23, 2549–2559. [Google Scholar] [CrossRef] [Scilit]
  42. Wu, K.-Y.; Qin, L.; Fan, C.; Cai, S.-L.; Zhang, T.-T.; Chen, W.-H.; Tang, X.-Y.; Chen, J.-X. Sequential and recyclable sensing of Fe3+ and ascorbic acid in water with a terbium(III)-based metal–organic framework. Dalton Trans. 2019, 48, 8911–8919. [Google Scholar] [CrossRef] [Scilit]
  43. Bourque, J.L.; Biesinger, M.C.; Baines, K.M. Chemical state determination of molecular gallium compounds using XPS. Dalton Trans. 2016, 45, 7678–7696. [Google Scholar] [CrossRef] [Scilit]
  44. Hao, H.; Chen, X.; Li, Z.; Shen, Y.; Wang, H.; Zhao, Y.; Huang, R.; Liu, T.; Liang, J.; An, Y.; et al. Remote plasma-enhanced atomic layer deposition of gallium oxide thin films with NH3 plasma pretreatment. J. Semicond. 2019, 40, 012806. [Google Scholar] [CrossRef] [Scilit]
  45. Zatsepin, D.A.; Boukhvalov, D.W.; Zatsepin, A.F. Quality assessment of GaN epitaxial films: Acidification scenarios based on XPS-and-DFT combined study. Appl. Surf. Sci. 2021, 563, 150308. [Google Scholar] [CrossRef] [Scilit]
  46. Borges, R.H.U.; Paniago, E.; Beraldo, H. Equilibrium and kinetic studies of iron(II) and iron(III) complexes of some α(N)-heterocyclic thiosemicarbazones. Reduction of the iron(III) complexes of 2-formylpyridine thiosemicarbazone and 2-acetylpyridine thiosemicarbazone by cellular thiol-like reducing agents. J. Inorg. Biochem. 1997, 65, 267–275. [Google Scholar]
  47. Alcaraz, R.; Muñiz, P.; Cavia, M.; Palacios, Ó.; Samper, K.G.; Gil-García, R.; Jiménez-Pérez, A.; García-Tojal, J.; García-Girón, C. Thiosemicarbazone-metal complexes exhibiting cytotoxicity in colon cancer cell lines through oxidative stress. J. Inorg. Biochem. 2020, 206, 110993. [Google Scholar] [CrossRef] [Scilit] [PubMed]
  48. Liu, H.; Feng, X.-D.; Yang, B.; Tong, R.-L.; Lu, Y.-J.; Chen, D.-Y.; Zhou, L.; Xie, H.-Y.; Zheng, S.-S.; Wu, J. Dimethyl fumarate suppresses hepatocellular carcinoma progression via activating SOCS3/JAK1/STAT3 signaling pathway. Am. J. Transl. Res. 2019, 11, 4713–4725. [Google Scholar] [PubMed]
  49. Li, H.; Wang, Y.; Su, R.; Jia, Y.; Lai, X.; Su, H.; Fan, Y.; Wang, Y.; Xing, W.; Qin, J. Dimethyl fumarate combined with vemurafenib enhances anti-melanoma efficacy via inhibiting the Hippo/YAP, NRF2-ARE, and AKT/mTOR/ERK pathways in A375 melanoma cells. Front. Oncol. 2022, 12, 794216. [Google Scholar] [CrossRef] [Scilit]
  50. Basilotta, R.; Lanza, M.; Filippone, A.; Casili, G.; Mannino, D.; De Gaetano, F.; Chisari, G.; Colarossi, L.; Motta, G.; Campolo, M.; et al. Therapeutic potential of dimethyl fumarate in counteract oral squamous cell carcinoma progression by modulating apoptosis, oxidative stress and epithelial–mesenchymal transition. Int. J. Mol. Sci. 2023, 24, 2777. [Google Scholar] [CrossRef] [Scilit]
  51. Huang, N.; Tang, X.-Y.; Meng, W.; Lai, Y.-H.; Zhou, X.; Yu, X.-Z.; Zhang, W.-H.; Chen, J.-X. Immunogenic radiation therapy for enhanced antitumor immunity via a core–shell nanosensitizer-mediated immunosuppressive tumor microenvironment modulation. ACS Nano 2023, 17, 19853–19864. [Google Scholar] [CrossRef] [Scilit] [PubMed]
  52. Öztürk, K.; Kaplan, M.; Çalış, S. Effects of nanoparticle size, shape, and zeta potential on drug delivery. Int. J. Pharm. 2024, 666, 124799. [Google Scholar] [CrossRef] [Scilit]
  53. Maeda, H.; Nakamura, H.; Fang, J. The EPR effect for macromolecular drug delivery to solid tumors: Improvement of tumor uptake, lowering of systemic toxicity, and distinct tumor imaging in vivo. Adv. Drug Deliv. Rev. 2013, 65, 71–79. [Google Scholar] [CrossRef] [Scilit]
  54. Zhang, L.; Liu, Y.; Liu, G.; Xu, D.; Liang, S.; Zhu, X.; Lu, Y.; Wang, H. Prolonging the plasma circulation of proteins by nano-encapsulation with phosphorylcholine-based polymer. Nano Res. 2016, 9, 2424–2432. [Google Scholar] [CrossRef] [Scilit]
  55. Abuhelal, S.; Centelles, M.N.; Wright, M.; Mason, A.J.; Thanou, M. Development of cationic lipid LAH4-L1 siRNA complexes for focused ultrasound enhanced tumor uptake. Mol. Pharm. 2023, 20, 2341–2351. [Google Scholar] [CrossRef] [Scilit] [PubMed]
  56. Panebianco, R.; Viale, M.; Bertola, N.; Bellia, F.; Vecchio, G. Terpyridine functionalized cyclodextrin nanoparticles: Metal coordination for tuning anticancer activity. Dalton Trans. 2022, 51, 5000–5003. [Google Scholar] [CrossRef] [Scilit]
  57. Shanmugapriya, A.; Prabha, P.; Ranjani, M.; Kalaivani, P.; Sparkes, H.A.; Selvakumar, S.; Prabhakaran, R. Nickel(II) metallates induced intrinsic apoptotic pathway-mediated cell death in lung and breast cancer cells. Inorg. Chim. Acta 2025, 586, 122792. [Google Scholar] [CrossRef] [Scilit]
  58. Mendes, I.C.; Soares, M.A.; dos Santos, R.G.; Pinheiro, C.; Beraldo, H. Gallium(III) complexes of 2-pyridineformamide thiosemicarbazones: Cytotoxic activity against malignant glioblastoma. Eur. J. Med. Chem. 2009, 44, 1870–1877. [Google Scholar] [CrossRef] [Scilit]
  59. Kumar, K.; Schniper, S.; González-Sarrías, A.; Holder, A.A.; Sanders, N.; Sullivan, D.; Jarrett, W.L.; Davis, K.; Bai, F.; Seeram, N.P.; et al. Highly potent anti-proliferative effects of a gallium(III) complex with 7-chloroquinoline thiosemicarbazone as a ligand: Synthesis, cytotoxic and antimalarial evaluation. Eur. J. Med. Chem. 2014, 86, 81–86. [Google Scholar] [CrossRef] [Scilit] [PubMed]
  60. Yang, T.; Zhang, Z.; Zhang, J.; Li, Y.; Li, W.; Liang, H.; Yang, F. Developing a Gallium(III) agent based on the properties of the tumor microenvironment and lactoferrin: Achieving two-agent co-delivery and multi-targeted combination therapy of cancer. J. Med. Chem. 2023, 66, 793–803. [Google Scholar] [CrossRef] [Scilit]
  61. Dharmasivam, M.; Kaya, B.; Wijesinghe, T.; Gholam Azad, M.; Gonzálvez, M.A.; Hussaini, M.; Chekmarev, J.; Bernhardt, P.V.; Richardson, D.R. Designing tailored thiosemicarbazones with bespoke properties: The styrene moiety imparts potent activity, inhibits heme center oxidation, and results in a novel “stealth Zinc(II) complex”. J. Med. Chem. 2023, 66, 1426–1453. [Google Scholar] [CrossRef] [Scilit] [PubMed]
  62. Bernhardt, P.V.; Sharpe, P.C.; Islam, M.; Lovejoy, D.B.; Kalinowski, D.S.; Richardson, D.R. Iron chelators of the dipyridylketone thiosemicarbazone class: Precomplexation and transmetalation effects on anticancer activity. J. Med. Chem. 2009, 52, 407–415. [Google Scholar] [CrossRef] [Scilit]
  63. Zhao, X.; Qian, Y.; Hu, S.; Tian, Y. Synthesis, anticancer activity and mechanism of action of Fe(III) complexes. Drug Dev. Res. 2024, 85, e22264. [Google Scholar] [CrossRef] [Scilit] [PubMed]
  64. Sheldrick, G.M. SADABS; Version 2.03; Program for Empirical Absorption Correction of Area Detector Data; University of Göttingen: Göttingen, Germany, 1996. [Google Scholar]
  65. Sheldrick, G.M. Crystal structure refinement with SHELXL. Acta Crystallogr. Sect. C 2015, 71, 3–8. [Google Scholar] [CrossRef] [Scilit] [PubMed]
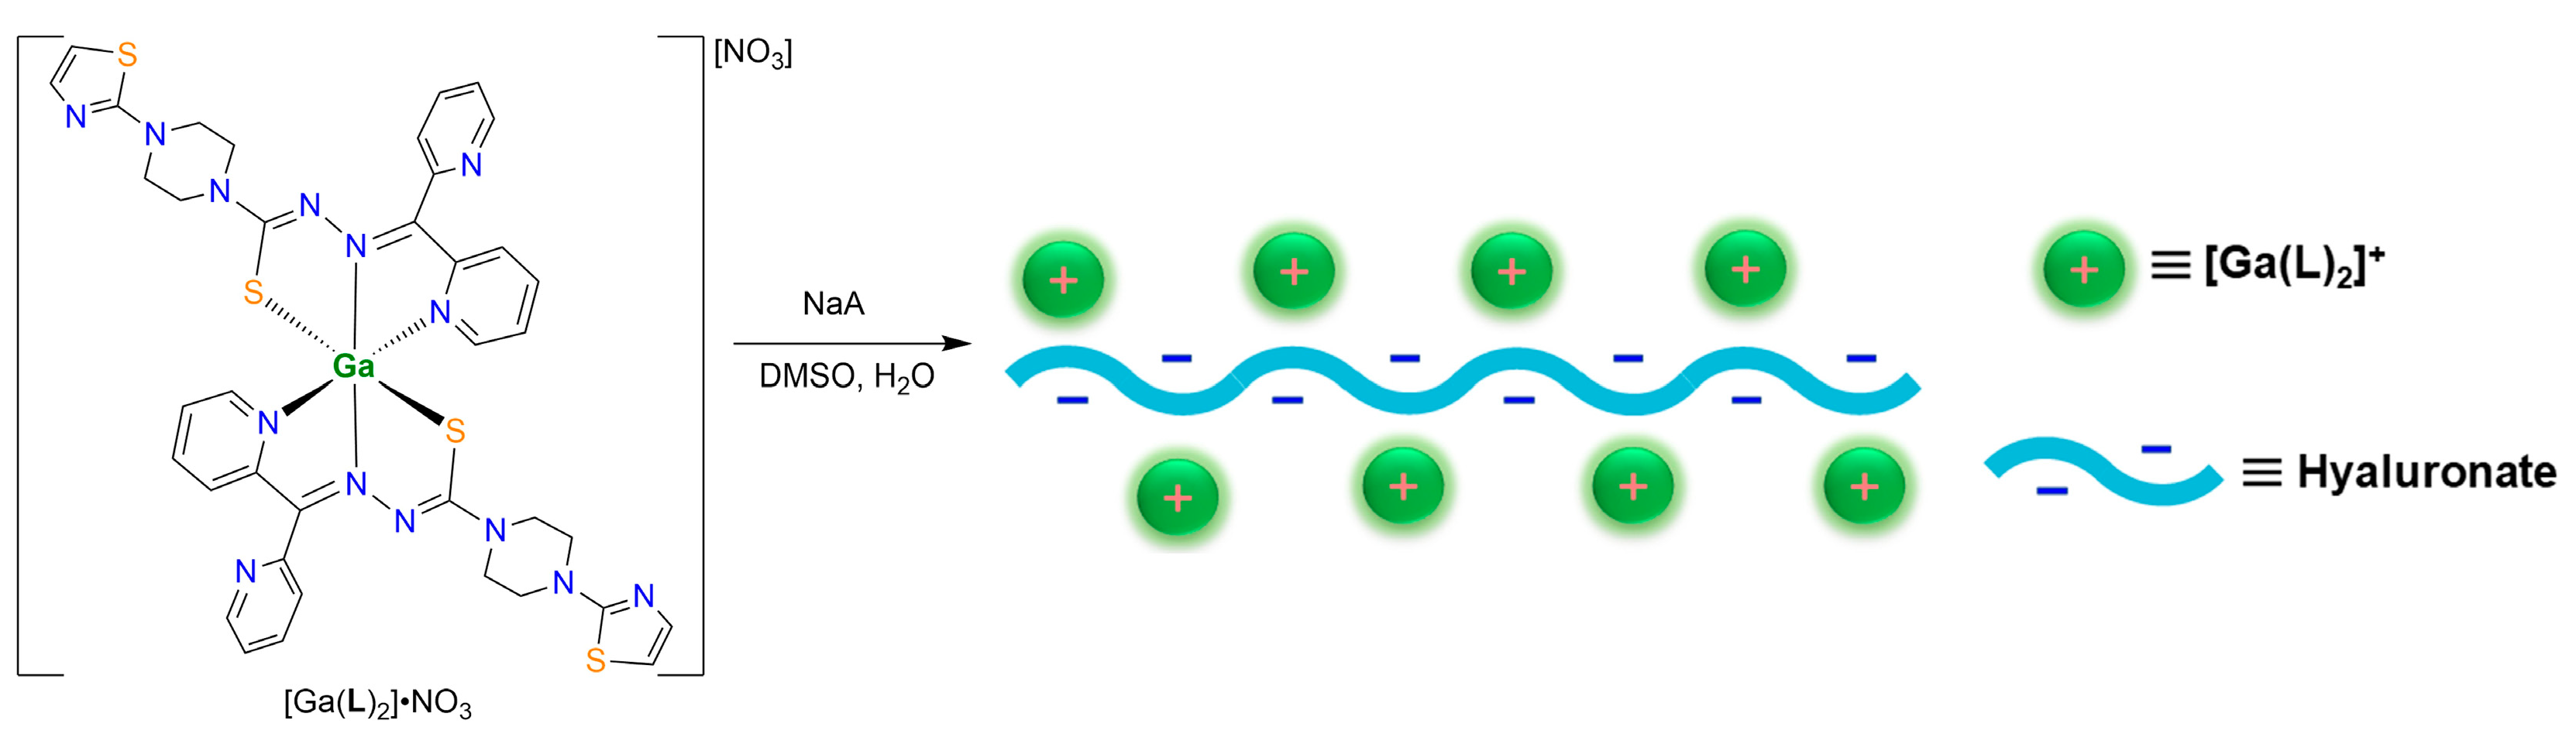
Scheme 1. Synthesis of [Ga(L)2]NO3 and its anion exchange with NaA to give [Ga(L)2]A.
Molecules 31 00577 sch001
Figure 1. The crystal structure of [Ga(L)2]NO3 (a). The UV-Vis spectra of HL and [Ga(L)2]NO3 in CH2Cl2 solution (b). The HPLC-MS results of [Ga(L)2]NO3, as demonstrated by the consistency between the experimental (blue) and calculated (orange) peak values and patterns (c) assignable as [Ga(L)2]+. The Ga 3d XPS spectra of [Ga(L)2]NO3 (d). For (a), the MeOH solvate and hydrogen atoms are omitted for clarity. Color legend: Ga (dark green), S (yellow), O (red), N (blue), and C (black).
Molecules 31 00577 g001
Figure 2. UV-Vis spectral changes observed during the titration of [Ga(L)2]NO3 with (NH4)2Fe(SO4)2·6H2O (a) and with NH4Fe(SO4)2·12H2O (b). For each titration, a 1.0 equivalent solution of the Ga(III) complex in DMF was successively titrated with 0.2 equivalent aliquots of the respective iron salt.
Molecules 31 00577 g002
Figure 3. TEM images of [Ga(L)2]A (a) and particles formed from [Cu(NO3)(L)]2 + NaA (b).
Molecules 31 00577 g003
Figure 4. A comparison of cell viability of NCI-H82 (a,b), A549 (c,d), KYSE-510 (e,f), and Te-1 (g,h) upon incubation with gradient concentrations HL, [Ga(L)2]NO3, and [Ga(L)2]A.
Molecules 31 00577 g004
Table 1. Crystal data and structure refinement parameters for [Ga(L)2]NO3.
[Ga(L)2]NO3
FormulaC39H40GaN15O4S4
Formula Weight980.82
Crystal SystemMonoclinic
Space GroupP21/n
a13.7231(4)
b16.5511(5)
c19.3202(7)
β93.1060(10)
V34381.8(2)
Z4
ρcalc/(g cm−3)1.487
F(000)2024
μ (Mo–Kα)/mm−10.879
Total Reflections102,760
Unique Reflections10,031
No. Observations8243
Rint0.0528
No. Parameters570
R a0.0374
wR b0.0912
GOF c1.111
a R1 = Σ||Fo| − |Fc||/Σ|Fo|, b wR2 = {Σ[w(Fo2Fc2)2]/Σ[w(Fo2)2]}1/2, c GOF = {Σ[w(Fo2Fc2)2]/(np)}1/2, where n is the number of reflections and p is total number of parameters refined.
Table 2. Selected bond distances (Å) and angles (°) of [Ga(L)2]NO3 involving the Ga(III) center.
Ga1–S12.3600(6)Ga1–S32.3715(6)
Ga1–N122.0493(17)Ga1–N52.0529(16)
Ga1–N72.0938(18)Ga1–N132.1249(18)
N12–Ga1–N5175.06(7)N12–Ga1–N797.70(7)
N5–Ga1–N778.03(7)N12–Ga1–N1377.30(7)
N5–Ga1–N1399.88(7)N7–Ga1–N1387.69(7)
N12–Ga1–S1101.96(5)N5–Ga1–S182.07(5)
N7–Ga1–S1159.62(5)N13–Ga1–S191.44(5)
N12–Ga1–S382.12(5)N5–Ga1–S3100.30(5)
N7–Ga1–S390.52(5)N13–Ga1–S3158.91(5)
S1–Ga1–S397.36(2)
Table 3. A comparison of the IC50 values of HL, [Ga(L)2]NO3, and [Ga(L)2]A with literature examples for different cell lines.
EntryCompoundCell LineIC50 (µM)Reference
1DOXA5490.058[56]
2CisplatinA54936.39[57]
3[Ga(La)2]NO3RT2810[58]
4[Ga(Lb)2(NO3)]·xH2OHCT-1160.55[59]
5[Ga(Lc)2]PF6SK-BR-31.7 × 10⁻⁴[6]
6Ga(Ld)Cl2MCF-71.05[60]
7[Fe(Le)2](ClO4)SK-N-MC0.19[61]
8Fe(Lf)2(NO3)(H2O)3SW-48019.11[47]
9[Fe(Lg)2](ClO4)HL600.4[62]
10[Fe(Lh)2]ClMDA-MB-23112.38[63]
11[Cu(NO3)(L)]2Hep-G216.86[22]
12HLNCI-H820.041This work
13HLA5490.107This work
14HLKYSE-5100.095This work
15HLTe-10.108This work
16[Ga(L)2]NO3NCI-H820.029This work
17[Ga(L)2]NO3A5490.787This work
18[Ga(L)2]NO3KYSE-5100.463This work
19[Ga(L)2]NO3Te-10.176This work
20[Ga(L)2]ANCI-H820.102This work
21[Ga(L)2]AA5491.342This work
22[Ga(L)2]AKYSE-5102.616This work
23[Ga(L)2]ATe-10.267This work
DOX = doxorubicin; La = N(4)-methyl-2-pyridineformamide thiosemicarbazone; Lb = N1-(7-chloro-quinolin-4-yl)-ethylamino-2-acetylpyridine-thiosemicarbazone; Lc = acetylpyrazine N, N-dimethylthiosemicarbazone; Ld = isopropyl-2-pyridyl-ketone-4, 4-dimethylthiosemicarbazone; Le = (Z)-3-phenyl-1-(2-pyridinyl)-2-propen-1-one-4, 4-dimethyl-3-thiosemicarbazone; Lf = pyridine-2-carbaldehyde 4-N-methylthiosemicarbazone; Lg = dipyridylketone 4-allylthiosemicarbazone; Lh = 2-benzoylpyridine 4-methyl-3-thiosemicarbazone.
Table 4. Cellular uptake of [Ga(L)2]A by KYSE-510 (1 × 10⁷ cells) with and without NaA pre-treatment, as determined by Ga3+ concentration (ppb) using ICP-MS. The NaA pre-treated sample is denoted as [Ga(L)2]A′.
[Ga(L)2]A[Ga(L)2]A′
2 h310.325224.521
4 h503.897309.679
6 h554.22323.187
Disclaimer/Publisher’s Note: The statements, opinions and data contained in all publications are solely those of the individual author(s) and contributor(s) and not of MDPI and/or the editor(s). MDPI and/or the editor(s) disclaim responsibility for any injury to people or property resulting from any ideas, methods, instructions or products referred to in the content.