Article

Comprehensive Analysis of Phytochemical Compounds in Seeds of Indigenous Grape Varieties Cultivated in Southeastern Anatolia: Fatty Acids, Tocopherols, Phytosterols, Vitamins, and Antioxidant Properties


by
Mehmet İlhan Odabaşioğlu
1,
Atilla Çakır
2,*,
Nesrin Karaca Sanyürek
3 and
Fırat İşlek
4
1
Department of Horticulture, Faculty of Agriculture, Adıyaman University, Kâhta 02400, Türkiye
2
Department of Horticulture, Faculty of Agriculture, Bingöl University, Bingöl 12000, Türkiye
3
Department of Food Engineering, Faculty of Engineering, Munzur University, Tunceli 62000, Türkiye
4
Department of Plant and Production Technologies, Faculty of Applied Sciences, Muş Alparslan University, Muş 49250, Türkiye
*
Author to whom correspondence should be addressed.
Molecules 2026, 31(18), 3168; https://doi.org/10.3390/molecules31183168
Submission received: 7 August 2026 / Revised: 31 August 2026 / Accepted: 7 September 2026 / Published: 9 September 2026

Abstract

Aim: In this study, the phytochemical composition of the seeds of twelve different local grape (Vitis vinifera L.) varieties traditionally cultivated in the Southeastern Anatolia Region (Diyarbakır, Türkiye) was investigated using a holistic approach. The main objective of the study was to evaluate the associations of the effects of berry skin colour, the ripening stage and utilization type on the fatty acid profile, tocopherol and phytosterol contents, vitamin K and D levels, antioxidant capacity (DPPH) and lipid peroxidation (MDA) of grape seeds. Method: The seeds of grape varieties belonging to four different colour groups, grown on their own roots, were harvested during the 2017 growing season and analysed. Fatty acid composition was determined by gas chromatography (GC), vitamin and phytosterol contents by HPLC-UV, MDA content by the thiobarbituric acid reactive substance (TBARS) method, and antioxidant capacity by the DPPH radical scavenging assay. Findings: Linoleic acid was identified as the predominant fatty acid in all varieties (53.68–67.06%), followed by oleic acid (13.80–27.32%). α-Tocopherol was identified as the predominant tocopherol form (1.597–4.703 mg kg−1), whilst β-sitosterol was the phytosterol component present at the highest level (915.67–3340.42 µg g−1). Statistically significant varietal differences were detected for most measured phytochemical parameters. Group-wise differences associated with berry skin colour and ripening stage were observed for selected traits. Overall, varietal differences appeared to be more pronounced than those associated with berry skin colour or ripening stage. It was observed that the differences in phytochemical composition between the various commercial classifications of grapes were very limited. Result: The findings reveal that the seeds of the local grape varieties studied exhibit a rich phytochemical profile and represent an important source of bioactive compounds that could be utilised, particularly in the functional food, nutraceutical and cosmetics industries. The ‘Tahannebi’ variety stood out as the one with the highest values across many parameters. Differences observed among samples of the same cultivar collected from different vineyards suggest that vineyard-specific conditions may contribute to variation in selected phytochemical traits. Future multi-year and multi-location studies are needed to confirm the stability of these phytochemical profiles and to further clarify genotype × environment interactions.

1. Introduction

The grape (Vitis vinifera L.) is one of the fruit species with the largest cultivation area worldwide and has held a central position in human dietary culture throughout history. According to data from the Food and Agriculture Organisation of the United Nations (FAO), global grape production exceeds approximately 78 million tonnes annually, with a significant proportion of this production being used to produce processed products such as wine, raisins, fruit juice and vinegar [1]. By-products arising from grape processing include components such as skins, seeds and stems, which account for approximately 20% of the total fruit weight [2]. According to [3], the quantity of grape seeds generated as waste by the food industry amounts to approximately 1.4 million tonnes annually. These components, which were long regarded as waste, have in recent years become the focus of scientific research due to the bioactive compounds they contain.
Among grape-processing by-products, grape seeds are particularly noteworthy because, although they account for only approximately 3–6% of the fruit’s total weight, they possess an extremely rich biochemical composition, including phenolic compounds, fatty acids, tocopherols, phytosterols, and various vitamins [4,5]. The positive effects of these compounds on human health are evident across a wide range of areas, from cardiovascular protection, anti-inflammatory and anti-carcinogenic activities to the support of bone health [5,6]. For this reason, grape seeds are attracting increasing interest in the fields of functional foods, nutraceuticals, and pharmaceutical applications.
Within this diverse biochemical matrix, the lipid fraction of grape seeds is particularly notable for its high content of unsaturated fatty acids (UFAs). Linoleic acid is the primary fatty acid in grape seed oil and constitutes a large proportion of its lipid composition [7]. The cholesterol-lowering effect of this fatty acid and its potential to reduce the risk of cardiovascular disease have been supported by epidemiological and clinical studies [8]. Furthermore, other fatty acids such as oleic acid, palmitic acid and stearic acid also constitute important components of the grape seed lipid profile. Research in the literature has shown that between 5 and 34 different fatty acids can be found in grape seeds, and that their composition may vary depending on genotype and environmental factors [9,10,11].
Beyond fatty acids, grape seeds also contain important lipid-soluble bioactive compounds, particularly tocopherols and phytosterols. Tocopherols are potent fat-soluble antioxidants; in particular, the α-tocopherol (vitamin E) form plays a critical role in protecting biological membranes against oxidative damage [12]. It has been reported that α-tocopherol is the predominant form in grape seed oil, whilst γ-tocopherol is also present at significant levels [13,14]. Phytosterols, on the other hand, are plant-derived sterol compounds that have the capacity to lower plasma LDL-cholesterol levels by reducing cholesterol absorption [15,16,17]. β-sitosterol is the most abundant phytosterol in grape seeds, whilst stigmasterol and campesterol are also among the significant components [18,19].
In addition to compositional characterization, evaluating antioxidant capacity and oxidative damage is essential for understanding the functional properties of grape seeds. The DPPH (2,2-diphenyl-1-picrylhydrazyl) radical scavenging assay, frequently used to assess antioxidant capacity, is recognised as a reliable method for determining the free radical scavenging potential of grape seed extracts [20,21,22,23]. On the other hand, malondialdehyde (MDA), an end product of lipid peroxidation, is widely used in biochemical research as an indirect indicator of oxidative stress at the cellular level [24,25]. The simultaneous assessment of these two parameters is of great importance for understanding the dynamic balance between oxidative damage and antioxidant defence systems.
Recent research has shown that, in addition to being rich in phenolic compounds and lipids, grape seeds also contain trace amounts of vitamins K and D. However, the levels of these compounds can vary significantly depending on numerous factors, such as variety, ecology, harvest time, skin colour and altitude [19,26].
Given that the levels of these phytochemical constituents may vary markedly among genotypes and growing environments, their characterization is particularly relevant in major centres of grape biodiversity. Türkiye is one of the world’s most important centres of grape biodiversity, and the Southeastern Anatolia Region in particular, with its millennia-old viticultural tradition, is home to a large number of local grape varieties. The systematic characterisation of the phytochemical profiles of the seeds of these local varieties is of strategic importance both for the conservation of genetic resources and for the evaluation of the industrial potential of these resources.
Whilst there are numerous studies in the existing literature that examine different aspects of grape seed composition separately, studies that comprehensively evaluate parameters such as fatty acids, tocopherols, phytosterols, vitamins, antioxidant capacity (DPPH) and lipid peroxidation (MDA) within the same research framework are quite limited. Furthermore, statistically elucidating the interrelationships between these components will make a significant contribution to a comprehensive understanding of the functional properties of grape seeds.
In this context, the aim of the present study is to determine the fatty acid composition, tocopherol and phytosterol contents, levels of vitamins K and D, antioxidant activity (DPPH) and lipid peroxidation (MDA) parameters in seed samples from different local grape varieties grown in the Southeastern Anatolia Region; to statistically analyse the relationships between these components and to elucidate the associations of berry skin colour, ripening stage, and utilization type with the aforementioned parameters.

2. Results and Discussion

2.1. Vitamin Composition (Vitamins K and D)

When the vitamin K and D content of grape seed samples was examined, statistically significant differences at a high level were detected between varieties for all vitamin components (p < 0.01). This indicates that vitamin accumulation is strongly dependent on genotypic structure (Table 1). However, when grape varieties were grouped according to the evaluation methods used, no statistically significant differences were found in the K and D vitamin content of the seeds between the evaluation method groups.
A wide variation in vitamin K1 content was observed among the varieties, ranging from 0.063 to 0.833 µg g−1. The ‘Şitu’ variety had the highest Vitamin K1 value at 0.833 µg g−1, followed by the ‘Tahannebi’ (0.653 µg g−1) and ‘Çirbeyt (V2)’ (0.533 µg g−1) varieties. The lowest K1 level was determined in the ‘Habo’ variety (0.063 µg g−1). Vitamin K2 was generally found at low levels, with seven varieties having K2 levels below the detection limit. The ‘Hatun Parmağı’ variety stood out as having the highest K2 content at 0.387 µg g−1 (p < 0.01).
A considerable variation in vitamin D2 levels was observed among the varieties. The ‘Asuri’ variety had the statistically highest D2 level at 1.603 µg g−1, whilst vitamin D2 could not be detected in four varieties. As for vitamin D3, the highest value was recorded in the ‘Çirbeyt (V2)’ variety at 0.577 µg g−1; however, this vitamin was not detected in samples taken from the V3 location of the same variety.
When the grape varieties examined in this study were grouped according to their berry skin colour, statistically significant differences were found between the berry skin colour groups in terms of vitamin K2 and D2 content (Figure 1a). The Green-Yellow skin colour group was found to have a higher vitamin K2 content (0.199 µg g−1), whilst the Dark Red group had a higher vitamin D2 content (0.955 µg g−1) compared to the others. In contrast, the skin colour groups were found to be similar in terms of vitamin K1 and D3 content. Furthermore, the groups classified by fruit ripening stage showed statistically significant differences in K1 and K2 vitamin content in the kernels; however, no significant difference was detected between the groups in terms of D2 and D3 vitamin content (Figure 1b). The vitamin K content in the seeds of early-maturing varieties (K1 0.468 µg g−1 and K2 0.203 µg g−1, respectively) was found to be higher than that of mid-season and late-season varieties.
The significant differences (p < 0.01) observed among varieties in vitamins K and D suggest genotype-associated variation in vitamin accumulation. However, environmental and growing conditions may also contribute to these differences. Indeed, similar findings were reported by Akbaba et al. [26] and Çakır et al. [19] in the grape varieties they studied. In particular, the higher levels of vitamin D2 found in dark-coloured varieties can be explained by the relationship between the pigmentation characteristics of the tissues and the UV-induced photochemical conversion of ergosterol. Ergosterol is a key sterol precursor that can be converted into vitamin D2 when exposed to ultraviolet radiation. It has been reported that differences in the optical properties of the tissue surface, pigment density and UV penetration capacity may influence the efficiency of this conversion [27,28].
The fact that early-maturing varieties exhibit higher levels of vitamins K1 and K2 can be explained by the photosynthetic mechanism exhibiting more intense metabolic activity during the short growing season and the close relationship between vitamin K biosynthesis and chloroplast metabolism. Vitamin K1 (phylloquinone) is a cofactor involved in the photosynthetic electron transport chain and therefore accumulates in tissues with high photosynthetic activity [29]. On the other hand, the accumulation of vitamin K1 in plant tissues may vary depending on the level of light exposure [30].

2.2. Tocopherol Composition

Statistically significant differences were observed between grape varieties in terms of the tocopherol content of the seeds (p < 0.01). α-Tocopherol was identified as the predominant component in all grape varieties examined (Table 2). The α-tocopherol content in grape seeds ranged from 1.597 to 4.703 mg kg−1, with the ‘Şitu’ and ‘Tahannebi’ varieties identified as having the highest α-tocopherol content. In the seeds of the ‘Siyahi’ variety, however, this component was found in lower quantities than in the other varieties examined. The δ-tocopherol content ranged from 0.030 to 1.027 mg kg−1, with the ‘Çirbeyt (V2)’ variety having the highest content and the ‘Boğazkere’ variety having the lowest. Furthermore, differences in δ-tocopherol content were observed between samples (V1, V2, V3) taken from different vines of the ‘Çirbeyt’ variety.
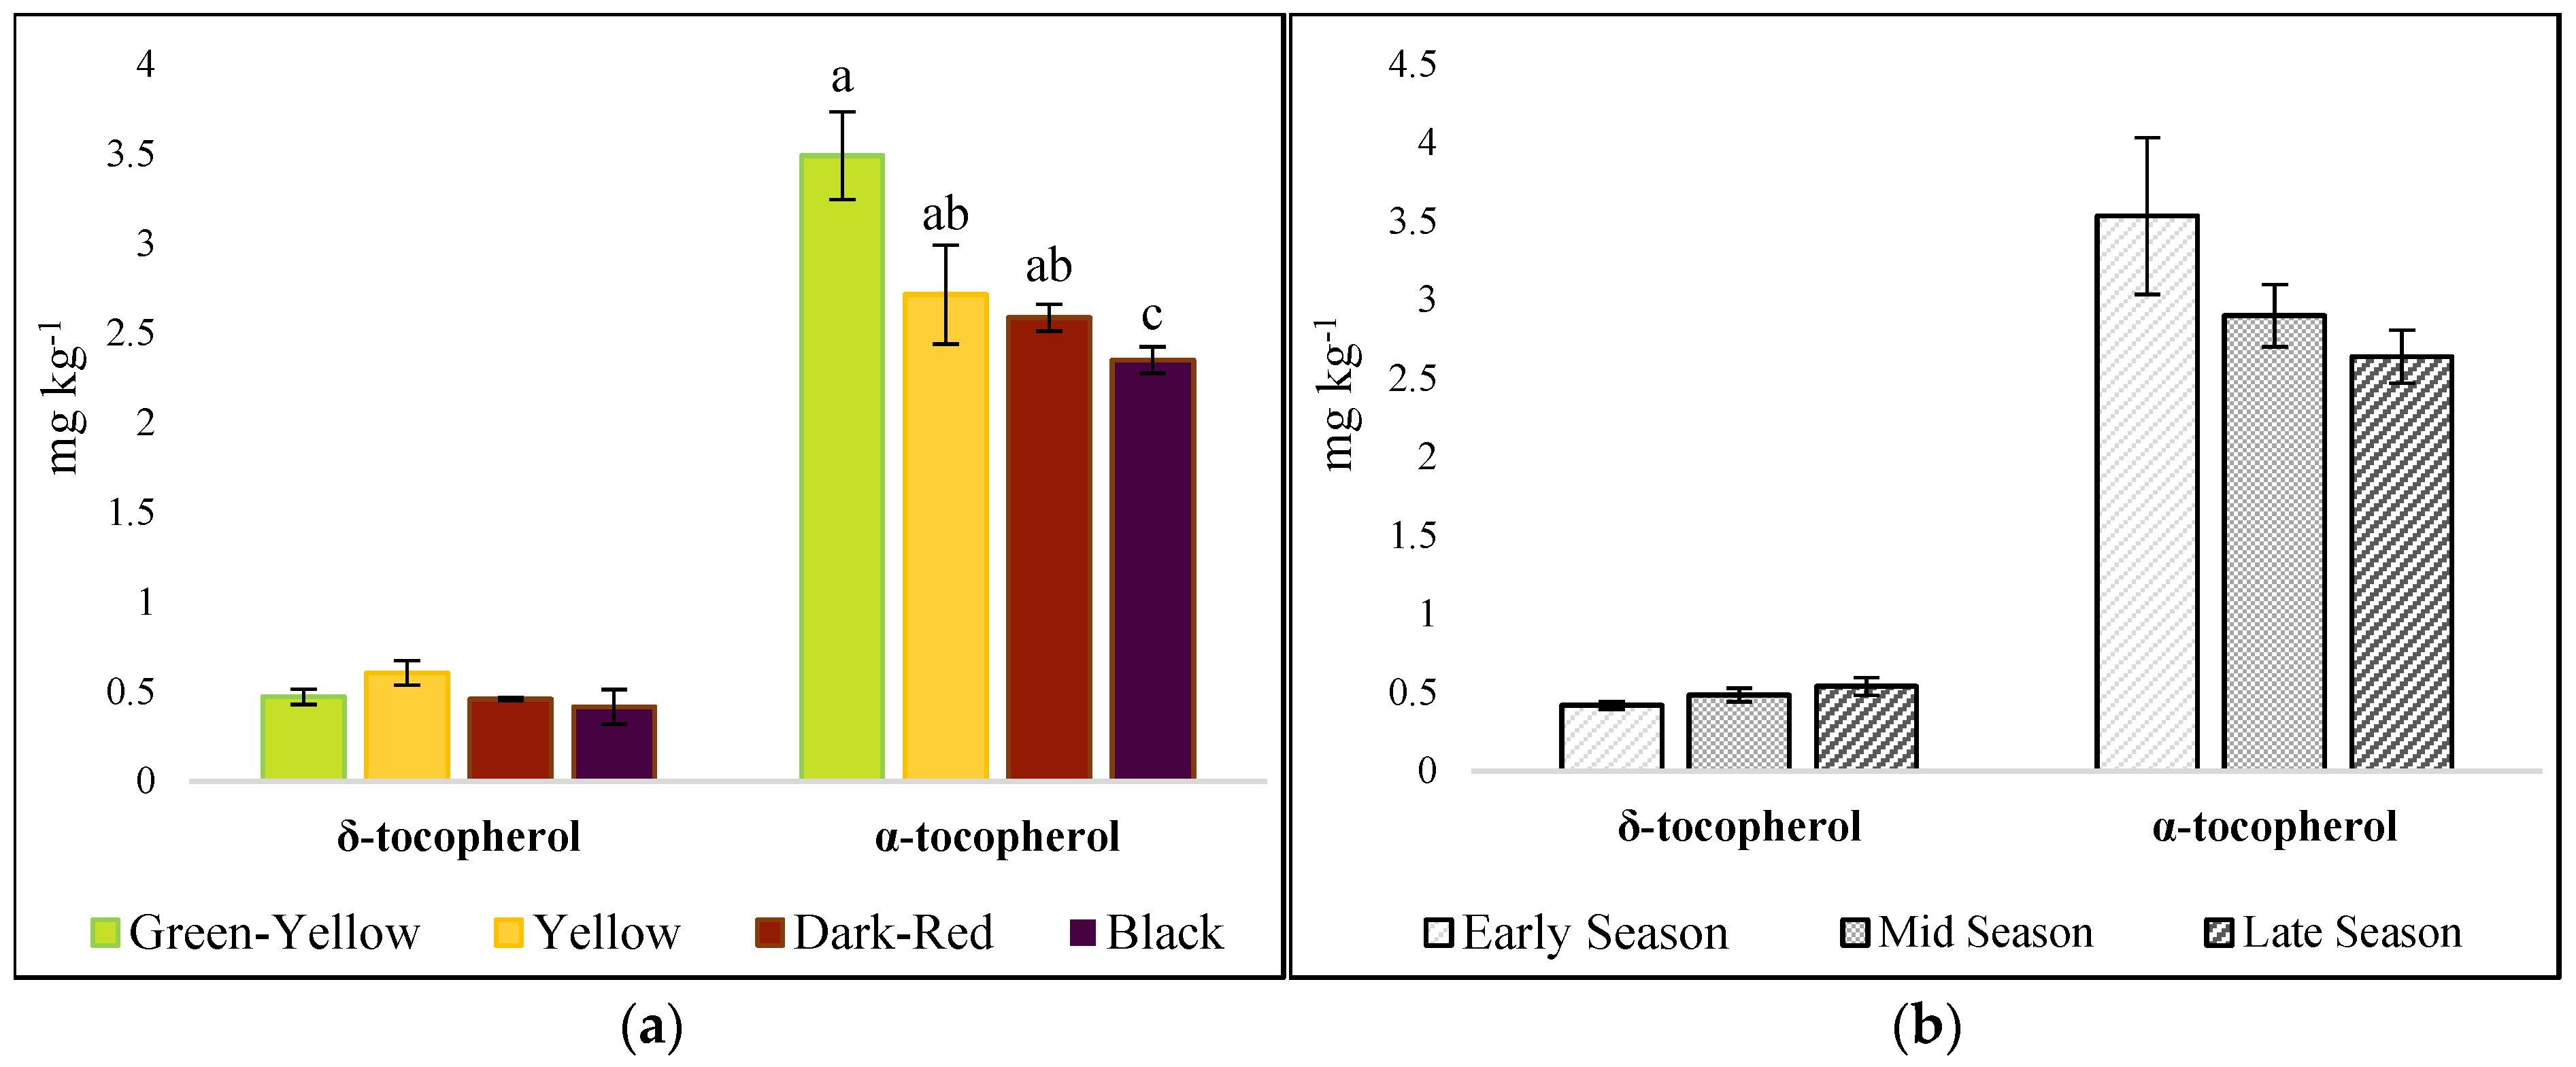
In the evaluation based on husk colour groups, it was determined that the α-tocopherol content in grape seeds decreased as the husk colour darkened along a colour scale ranging from green-yellow to black (p < 0.05). In contrast, the δ-tocopherol content in the seeds did not show any statistically significant differences between the berry skin colour groups (p > 0.05) (Figure 2a). Vujasinovic et al. [31] and Carmona-Jimenez et al. [14], who reached similar findings, reported that white grape varieties contain higher amounts of α-tocopherol in their seeds compared to red grape varieties. The effects of the ripening period (Figure 2b) and evaluation method (Table 2) groups on the content of both tocopherol compounds in grape seeds were not found to be statistically significant (p > 0.05).
The identification of α-tocopherol as the predominant tocopherol form in all varieties once again confirms the potential of grape seeds as a natural source of vitamin E. Whilst Crews et al. [32] reported α-isomers as the dominant component in grape seed oils of different origins, Shinagawa et al. [13] emphasised that this component makes a significant contribution to the oxidative stability of grape seed oil. The α-tocopherol content values we determined in the varieties examined in our study are similar to those reported by Carmona-Jimenez et al. [14] for varieties grown in southern Spain.
The detection of higher α-tocopherol levels in green-yellow skinned varieties stands out as a notable biochemical finding. The higher α-tocopherol levels observed in light-coloured varieties may be associated with differences in metabolic allocation between tocopherol- and pigment-related pathways [33,34]. However, the underlying metabolic mechanism was not directly investigated in the present study and therefore requires further targeted analysis.

2.3. Phytosterol Composition

Significant statistical differences were observed between the varieties in terms of phytosterol components (β-sitosterol, stigmasterol and ergosterol) (p < 0.01). β-sitosterol was identified as the predominant phytosterol component in all varieties. Among the grape varieties examined, the ‘Tahannebi’ variety had the highest β-sitosterol and stigmasterol content in its seeds. In contrast, the highest ergosterol content was found in the seeds of the ‘Boğazkere’ variety. The ‘Mazrone’ variety, on the other hand, was identified as having the lowest phytosterol content in the seeds amongst the grape varieties examined (Table 3). Another notable finding in our study was that the phytosterol content varied in samples of the ‘Çirbeyt’ variety taken from different vineyards. Samples taken from location V1 were found to have higher β-sitosterol and ergosterol content, whilst those from location V2 had higher stigmasterol content.
Although the average stigmasterol and β-sitosterol content in the seeds of table grape varieties, and the average ergosterol content in the seeds of wine grape varieties, were found to be higher than those of the others, no statistically significant difference was detected between the grape evaluation groups in terms of the amount of phytosterol components (p > 0.05).
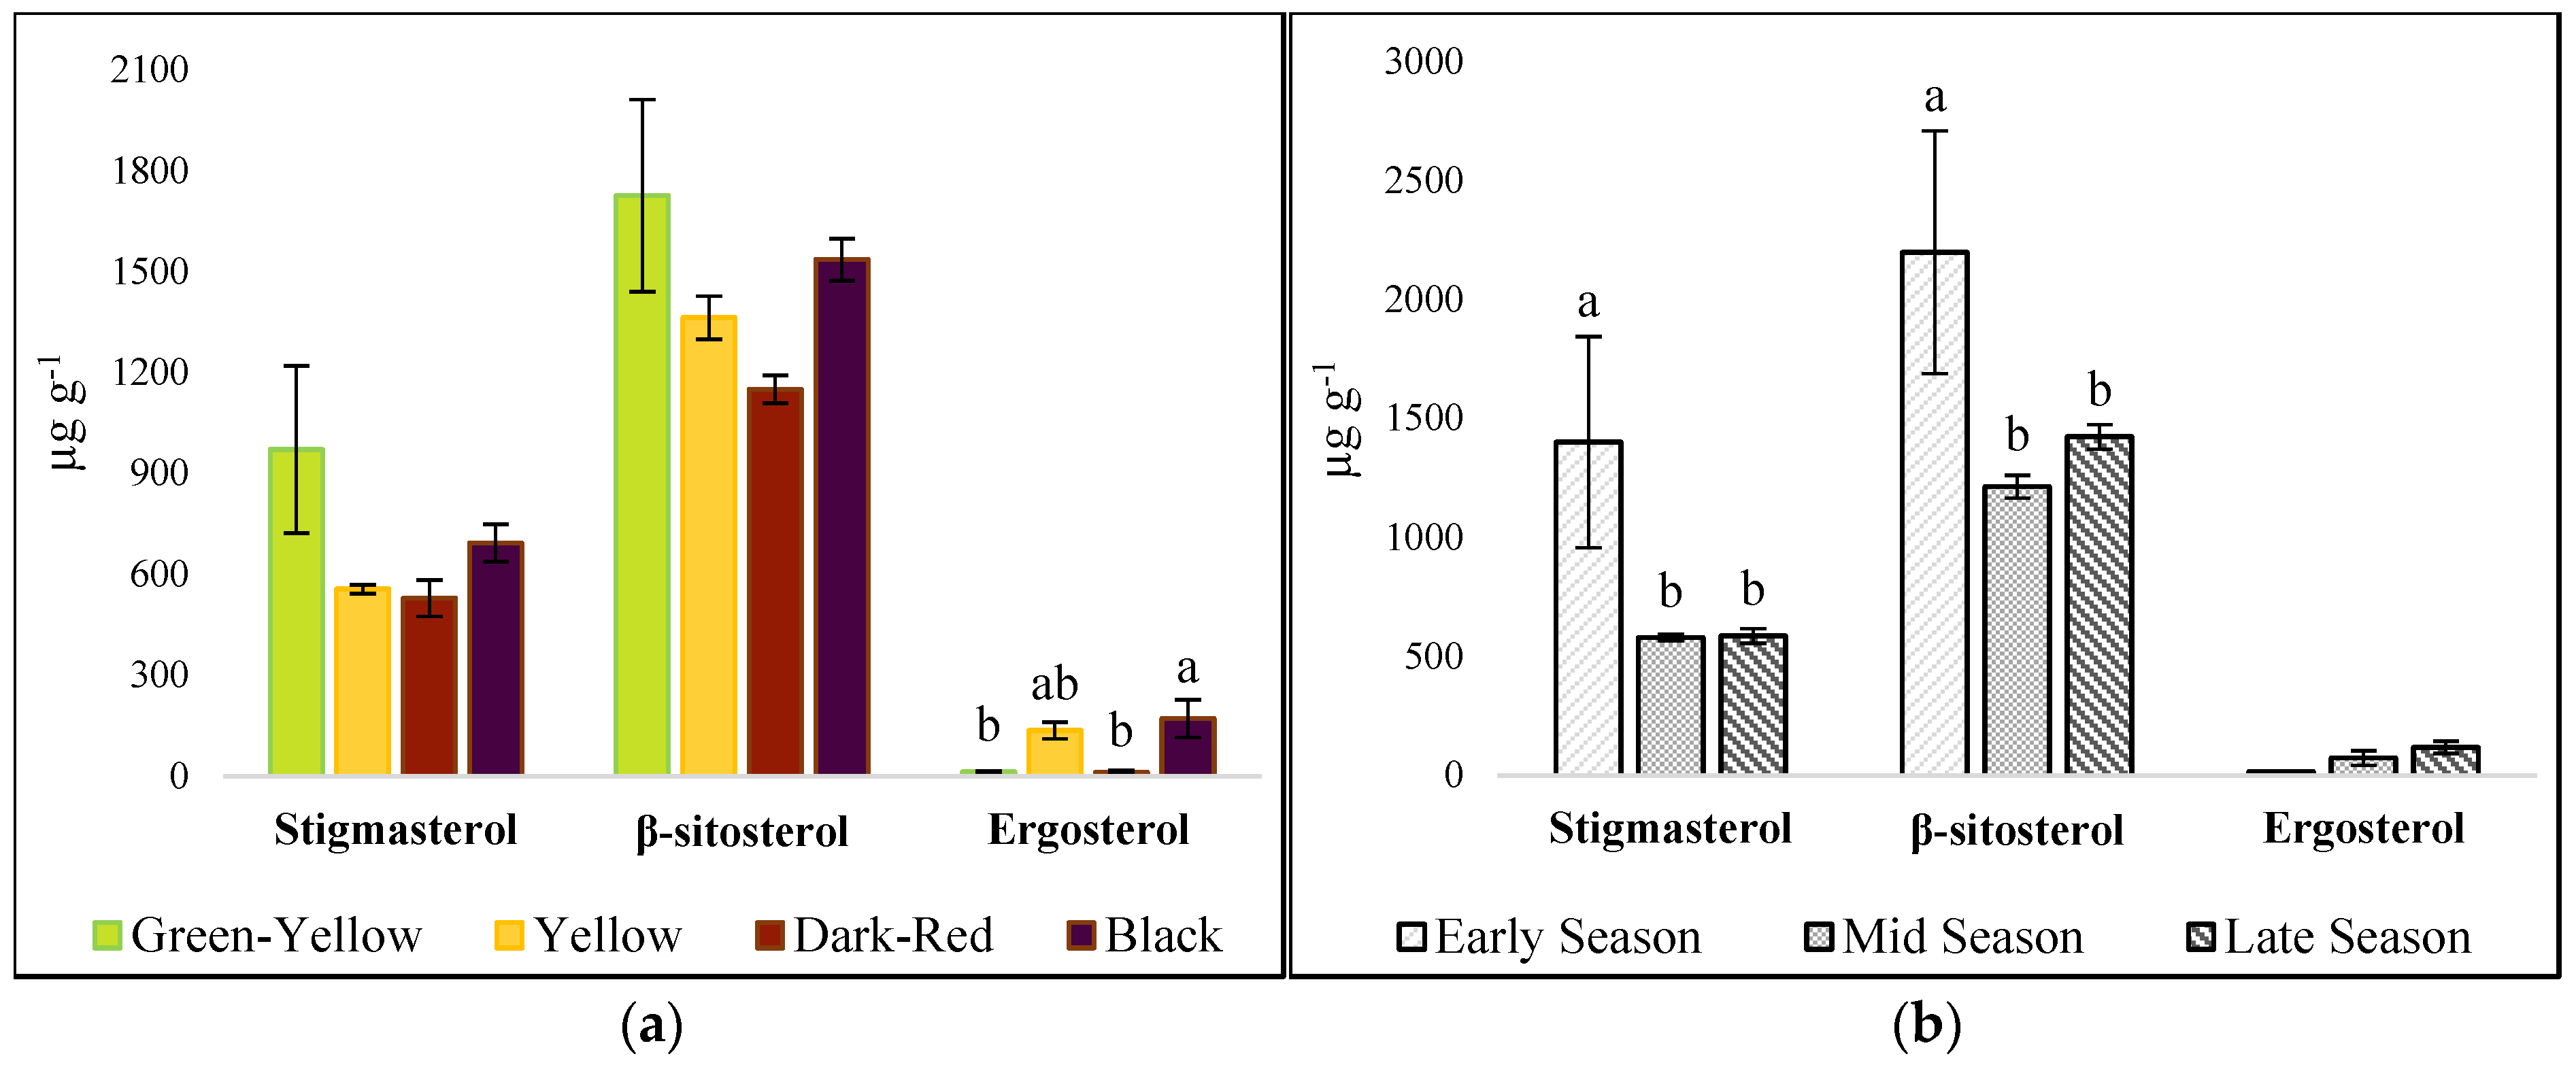
It was found that the grape seed skin colour groups showed statistically significant differences (p < 0.01) in terms of ergosterol content, and that this compound was found to be higher in varieties with a ‘Black’ skin colour (Figure 3a). It was found that the stigmasterol and β-sitosterol content in the seeds was not affected by berry skin colour (p > 0.05); however, statistically significant differences (p < 0.01) were observed between the berry ripening period groups. The levels of both stigmasterol and β-sitosterol in the kernels of early-maturing varieties were found to be higher than those in mid-season and late-season varieties (Figure 3b).
The identification of β-sitosterol as the predominant phytosterol component is fully consistent with previous studies conducted on various vegetable oils [15,35] and different grape varieties [36]. On the other hand, Piironen et al. [16] emphasised that stigmasterol is one of the most abundant sterol group compounds in commonly consumed vegetable oils. Previous researchers have demonstrated that phytosterol compounds present in grape seeds may vary between Vitis species, Vitis vinifera L. varieties and even Vitis sp. hybrids [37,38,39]. In this respect, our findings are consistent with those of previous researchers. Some studies have reported that phytosterols in grape seeds may be influenced by ecological conditions and cultural practices carried out in vineyards [40,41,42]. The variation in phytosterol content observed in samples of the Çirbeyt variety collected from different vineyards may be attributable to differences in the cultural practices applied in the vineyards.
The ability of phytosterols to lower plasma LDL-cholesterol levels by reducing cholesterol absorption has been strongly supported by epidemiological studies [17]. Furthermore, it has been reported that β-sitosterol offers protection against candidiasis, whilst stigmasterol inhibits cholesterol synthesis in the liver and intestinal absorption [43]. In this context, the high β-sitosterol (3340.42 µg g−1) and stigmasterol (2394.58 µg g−1) contents of the ‘Tahannebi’ variety in particular suggest that this variety could be prioritised for consideration in nutraceutical and functional food applications.
The fact that the stigmasterol and β-sitosterol contents of early-ripening varieties were found to be significantly higher than those of other groups indicates that the phenological development process has a decisive influence on phytosterol accumulation. Indeed, Rubio et al. [44] found that, in parallel with berry development, the β-sitosterol content in grape seeds decreased, whilst the stigmasterol content increased. Ruggiero et al. [40], on the other hand, reported that phytosterols other than stigmasterol in the seeds decreased significantly after berry drop compared to the period before berry drop. This finding can be interpreted as suggesting that a shorter growing season in early-maturing varieties may increase metabolic concentration. The higher ergosterol levels in black-coloured varieties, meanwhile, indicate the existence of complex interactions between pigmentation and sterol metabolism.

2.4. Lipid Peroxidation (MDA) and Antioxidant Activity (DPPH)

The grape varieties examined in this study exhibited statistically significant differences (p < 0.01) in terms of MDA content and antioxidant capacity (DPPH) in their seeds. MDA content ranged from 34.51 to 314.50 nmol g−1, with the ‘Tahannebi’ variety identified as having the highest level of lipid peroxidation. The lowest MDA values were recorded in the ‘Hasani’ (34.51 nmol g−1) and ‘Habo’ (35.50 nmol g−1) varieties (Table 4).
DPPH radical scavenging activity varied within the range of 91.41–96.89%. Whilst the ‘Tahannebi’ variety exhibited the highest antioxidant activity, the lowest antioxidant activity was observed in samples taken from the V3 location of the ‘Çirbeyt’ variety. The fact that differences were observed between samples taken from different vines of the same variety, both in terms of lipid peroxidation and antioxidant capacity, indicates that the physiological response mechanism exhibited by varieties of the species Vitis vinifera L. to environmental factors is highly dynamic and flexible. Indeed, Akbaba et al. [42] also found that MDA and DPPH values in the seeds of the ‘Kohnu’ grape variety, grown in different regions, differed significantly.
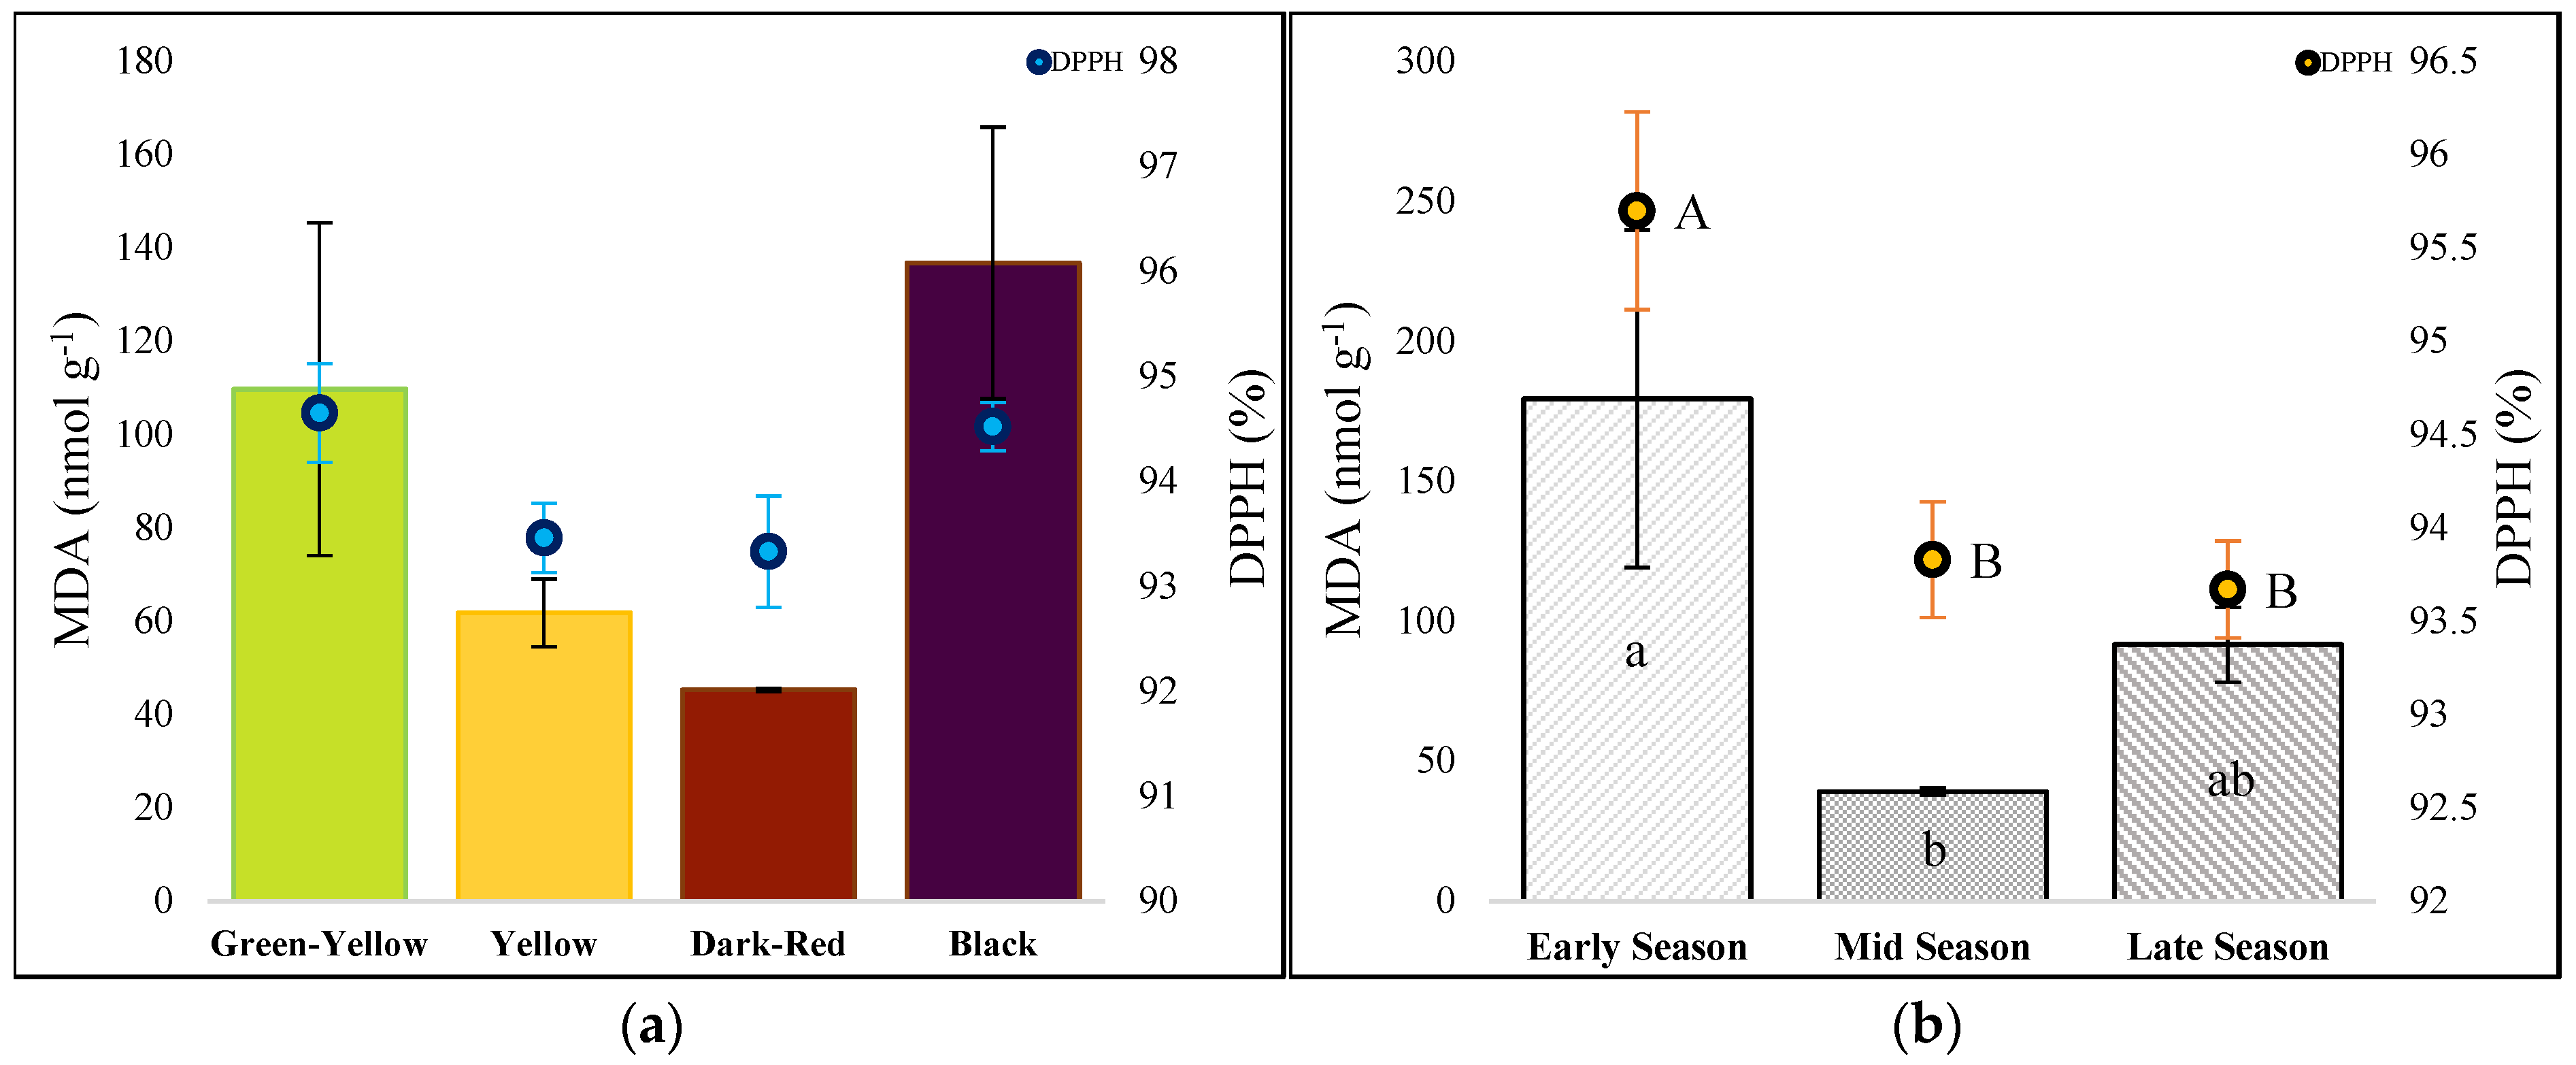
In our study, the fact that varieties with high MDA values simultaneously exhibited high DPPH activity indicates the presence of a positive correlation (r = 0.55, p < 0.01) between oxidative stress and antioxidant defence mechanisms. When grape varieties were grouped according to evaluation methods (Table 4) and skin colour (Figure 4a), no statistically significant differences were found between the groups in terms of seed MDA content and antioxidant capacity (p > 0.05). Katalinic et al. [45] highlighted that the free radical scavenging capacities of grape varieties may be related to their polyphenolic content. In numerous studies examining grape skin or pulp + skin tissues, findings are frequently reported in the literature indicating that varieties with coloured skins (ranging from red to black) possess higher antioxidant capacity compared to those with green or green-yellow skins [46,47,48]. On the other hand, Niu et al. [49] reported that coloured varieties do not always outperform white varieties in terms of antioxidant capacity. Çakır et al. [19], however, reported that lipid peroxidation and antioxidant capacity in grape seeds did not vary according to berry skin colour groups, and that the main factor influencing these parameters was genotype. Furthermore, findings in the literature indicating that antioxidant and anti-radical capacities exhibit significant variations even among clones of a single grape variety [50,51] constitute important evidence of the evolutionary plasticity of the genus Vitis.
In the grouping based on the ripening stage of the berries, it was found that early-ripening varieties had higher values for both MDA (179.50 nmol g−1) and DPPH (95.70%) compared to the other groups (p < 0.01) (Figure 4b). The parallel trend observed at the variety level between the MDA and DPPH parameters strongly suggests that oxidative stress and antioxidant defence mechanisms are activated simultaneously in grape seed biochemistry. This finding can be interpreted within the framework of the concept of ‘oxidative adaptation’. It is known that in tissues with high metabolic activity, the synthesis of antioxidant enzyme systems and non-enzymatic antioxidants is increased in response to rising oxidative stress [52,53]. Rockenbach et al. [54] reported that grape seed extracts possess potent antioxidant activity, whilst also emphasising that this activity exhibits significant variations depending on the variety. Similarly, previous studies have reported that the antioxidant profile in the seeds, berry skins and raceme stalks of different grape varieties reflects metabolomic variation [55,56,57]. The fact that the ‘Tahannebi’ variety possesses both the highest MDA and the highest DPPH values indicates that oxidative metabolism is more active in this variety and, in parallel, that antioxidant defence mechanisms are induced more strongly.
The fact that both MDA and DPPH values in early-ripening varieties were found to be significantly higher than in other groups can be interpreted as suggesting that a short growing season may increase metabolic intensity, thereby enhancing both oxidative stress and the antioxidant response. This finding demonstrates that the phenological development process plays a decisive role not only at the morphological level but also at the biochemical level.

2.5. Fatty Acid Composition

An analysis of the fatty acid profiles in the seeds of grape varieties revealed statistically significant differences (p < 0.01) between grape varieties in terms of major fatty acid content (Table 5). However, it was determined that linoleic acid (C18:2, n-6) was the predominant fatty acid in all grape varieties. Linoleic acid was followed, in order, by oleic acid, palmitic acid and stearic acid. The same order has also been reported by previous researchers who examined different grape varieties [37,58]. In seed oils, linoleic acid ranged from 53.68% to 67.06%, with the ‘Mazrone’ and ‘Tahannebi’ varieties identified as having the highest linoleic acid content. In contrast, the ‘Hatun Parmağı’ variety had the highest oleic acid content (27.32%), the ‘Şitu’ variety had the highest palmitic acid content (10.10%), and the ‘Boğazkere’ variety had the highest stearic acid content (6.28%). The marked differences in linoleic and oleic acid levels among varieties are consistent with genotype-associated variation in fatty acid composition. The strong inverse relationship observed between linoleic and oleic acids (r = −0.97, p < 0.01) may be related to differences in desaturase-mediated lipid metabolism reported in grapevine [59]; however, desaturase enzyme activity or gene expression was not directly measured in the present study. The fact that linoleic acid and oleic acid have been identified as the predominant fatty acids in all varieties confirms that grape seed oil is a rich source of essential fatty acids. Indeed, in other vegetable oils commonly consumed as part of the daily human diet (such as rapeseed oil, maize oil, sunflower oil, soya bean oil and olive oil), the levels of linoleic acid and oleic acid are also considerably higher than those of other fatty acids [60]. Our findings regarding linoleic and oleic acid content are largely consistent with the results of previous studies conducted on varieties of the Vitis vinifera L. species in different geographical regions. Indeed, previous researchers have reported that in Vitis vinifera L. varieties grown in Türkiye, the linoleic acid content ranged from 51.6% to 70.1%, whilst the oleic acid content ranged from 15.8% to 31.6% [3,19,61]. The levels of these fatty acids in different grape (V. vinifera L.) varieties were reported by Beveridge et al. [62] in Canada as ranging from 66.7–73.6% and 12.6–18.9%, respectively; by Fernandes et al. [58] in Portugal in the ranges of 63.0–73.1% and 13.7–20.8%, and Lachman et al. [63] in the Czech Republic in the ranges of 69.2–77.2% and 9.9–18.0%. Furthermore, similar findings have been reported in different Vitis species, interspecific hybrids and vine rootstocks [64,65,66,67]. These findings are consistent with Matthäus’s [8] assessment that linoleic acid is the characteristic fatty acid of grape seed oil.
In studies comparing grape varieties based on the fatty acid composition of their seeds, it has been reported that the fatty acid composition of the seeds can vary depending on factors such as genotype, berry skin colour, berry ripeness, climatic variations, altitude, rootstocks, ecology, irrigation regime, etc. [3,11,32,44,63,68,69,70]. However, genotype is the most dominant of these factors. Indeed, in samples of the Çirbeyt variety taken from different vineyards, the fatty acid composition exhibited a more stable profile compared to the other phytochemicals we examined. This finding is consistent with the observation by Odabaşioğlu and Gürsöz [3] that, in the composition of grape seeds, genotype is a more dominant determining factor than the growing season and rootstocks. On the other hand, in the commercial production of grape seed oil, there are other factors that may influence oil content and/or fatty acid composition. These include the method of drying the grapes/seeds after harvest, the storage conditions of the seeds, and the oil extraction method [36,62,64,71,72].
When the varieties were grouped according to their commercial uses, the differences in fatty acid composition between the groups were limited to palmitic acid and myristic acid (Table 5 and Table 6). Baydar and Akkurt [73], who reached similar findings, reported that there was no clear difference in fatty acid composition between the wine and table grape varieties they examined.
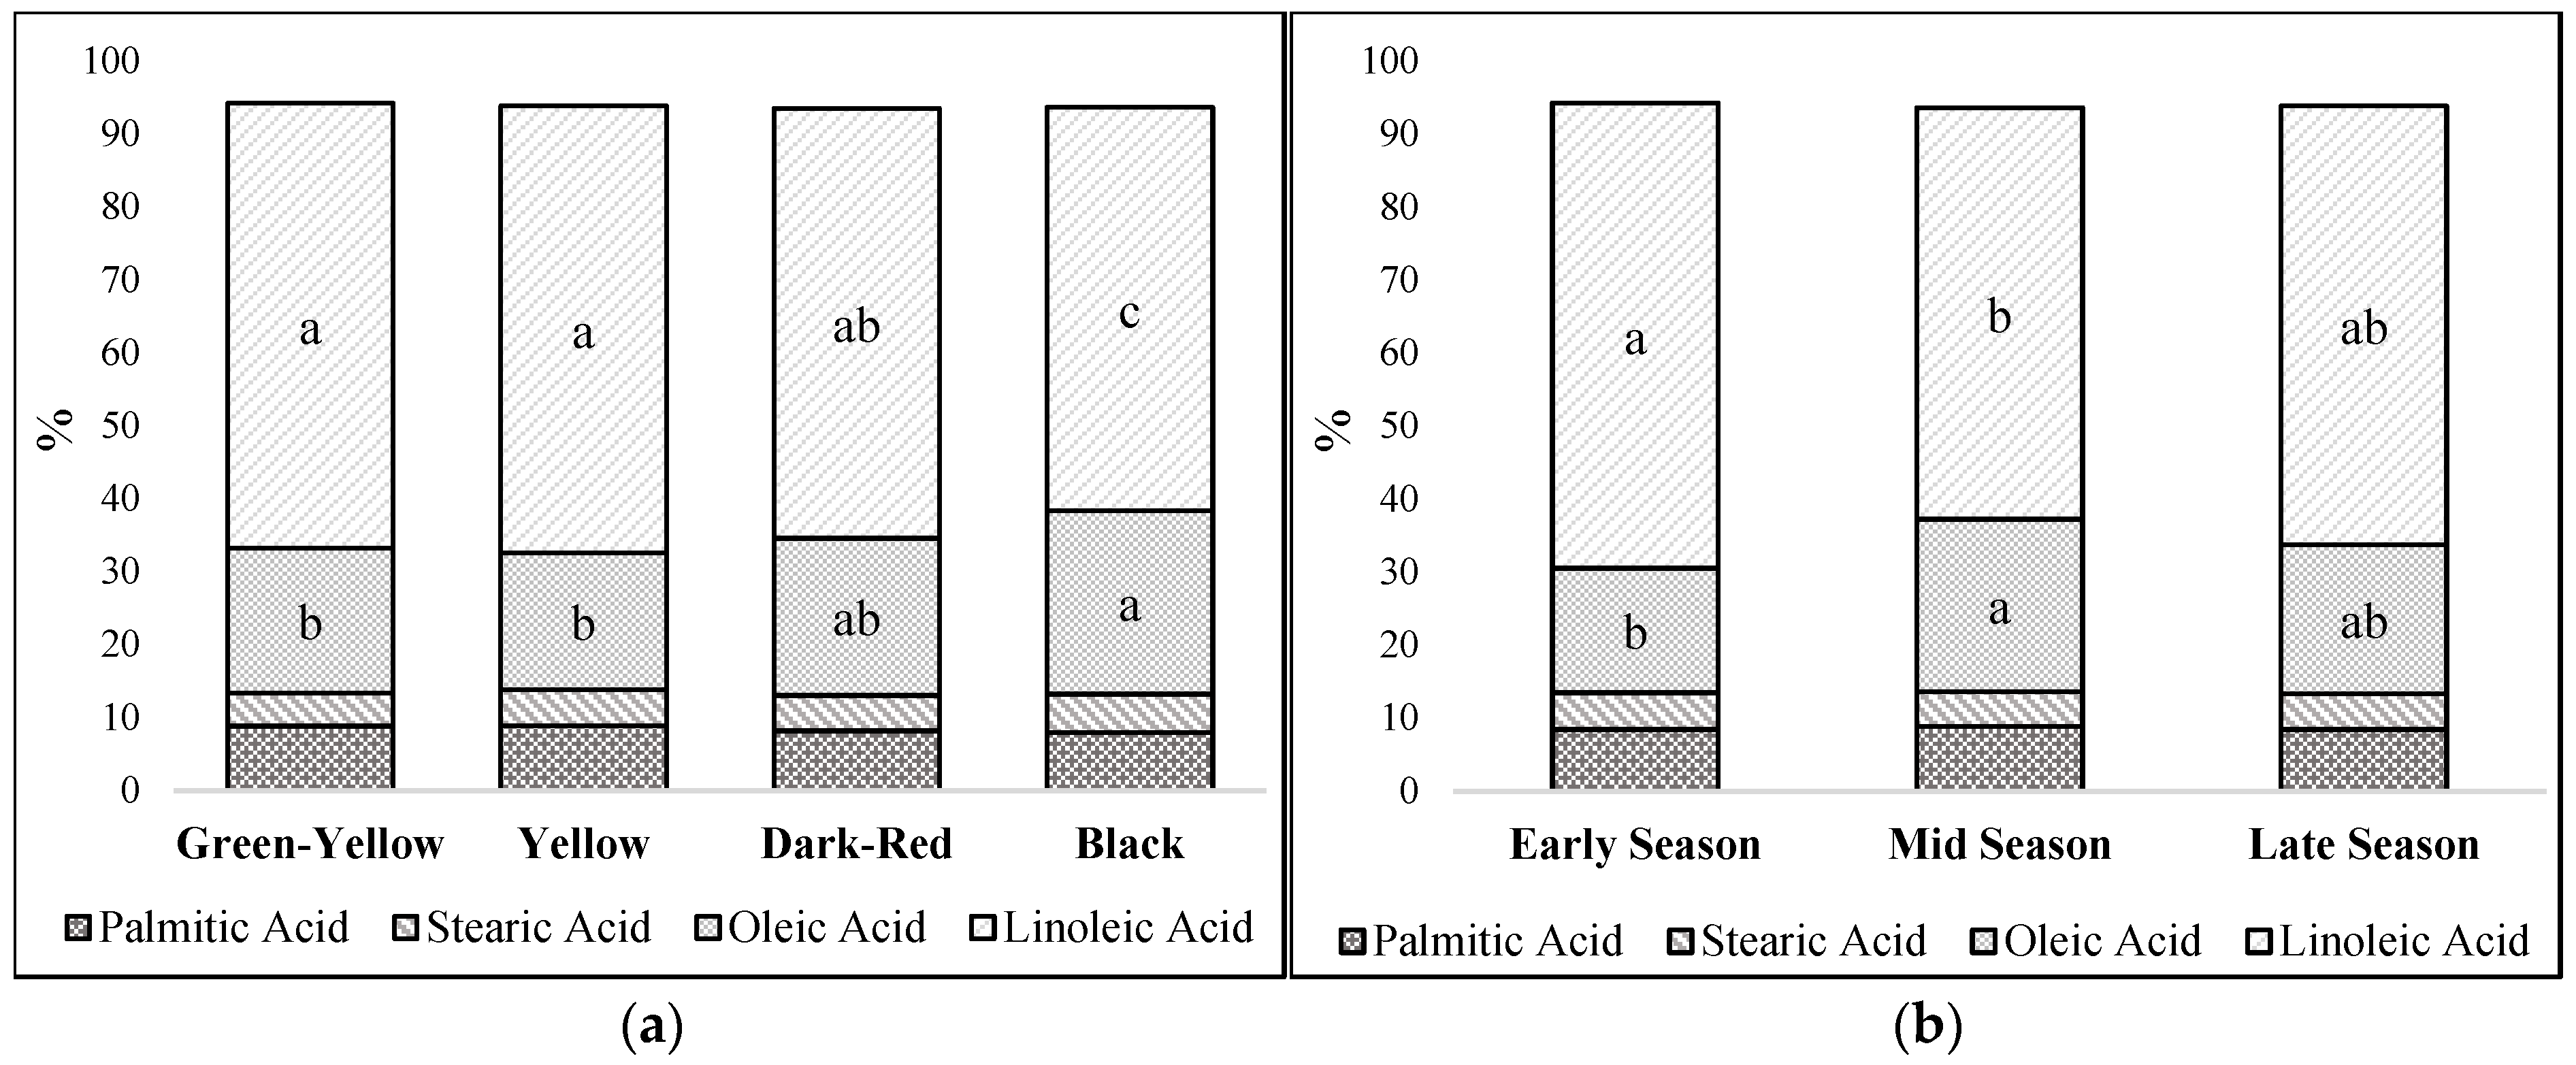
When varieties were classified according to skin colour, the groups with the highest linoleic acid content in their seeds were the Green-Yellow (60.97%) and Yellow (61.23%) skin colour groups, and these two groups were statistically distinct from the other colour groups (p < 0.01). In contrast, the oleic acid content of the Black husk colour group (25.15%) was found to be significantly higher than that of the other colour groups (p < 0.05). No statistically significant difference was detected between the peel colour groups in terms of palmitic acid and stearic acid content in the kernels (Figure 5a). The finding that the oleic acid ratio was higher and the linoleic acid ratio lower in the black-peel-coloured varieties is a particularly striking result. This phenomenon suggests that there may be a metabolic link between anthocyanin biosynthesis and lipid metabolism via a common precursor pool. Indeed, malonyl-CoA serves not only as a key precursor for fatty acid synthesis and elongation but also as a building block in flavonoid biosynthesis; furthermore, it has been reported that genetic interventions affecting this precursor pool alter both anthocyanin accumulation and metabolites associated with fatty acids and cuticular wax in some plant systems [74,75]. Meanwhile, similar findings regarding variations in oleic acid content in relation to skin colour have also been reported by Çakır et al. [19] in indigenous grape varieties cultivated in Southeastern Anatolia. However, some researchers argue that similar changes occur in the palmitic and stearic acid contents [11,76]. The differences between these studies may be due to variations in the grape varieties examined or the ecological conditions under which they were cultivated.
When the ripening stage groups were compared in terms of the fatty acid composition of the seeds, it was observed that linoleic acid and myristic acid were higher in the seeds of early-ripening varieties, whilst oleic acid, palmitoleic acid and trans-elaidic acid were higher in the seeds of mid- and late-season varieties (Figure 5b and Table 6). However, the other fatty acids present in the seeds were not affected by the ripening stages of the grape varieties (p > 0.05). According to Odabaşioğlu [11], the composition of major and minor fatty acids in grape seeds is influenced by the ripening period of the varieties; whilst linoleic acid, palmitic acid and stearic acid were found to be higher in early-ripening varieties, oleic acid was present in higher amounts in varieties ripening in the mid and late season. Çakır et al. [19], however, reported that linoleic acid was not affected by the ripening period, but that the oleic acid content was low in the seeds of early-ripening varieties. Taking into account the findings obtained and reports in the literature, it appears more appropriate to use mid- and late-season varieties with a high oleic acid content for the commercial production of grape seed oil, in order to maintain oxidative stability over the long term.
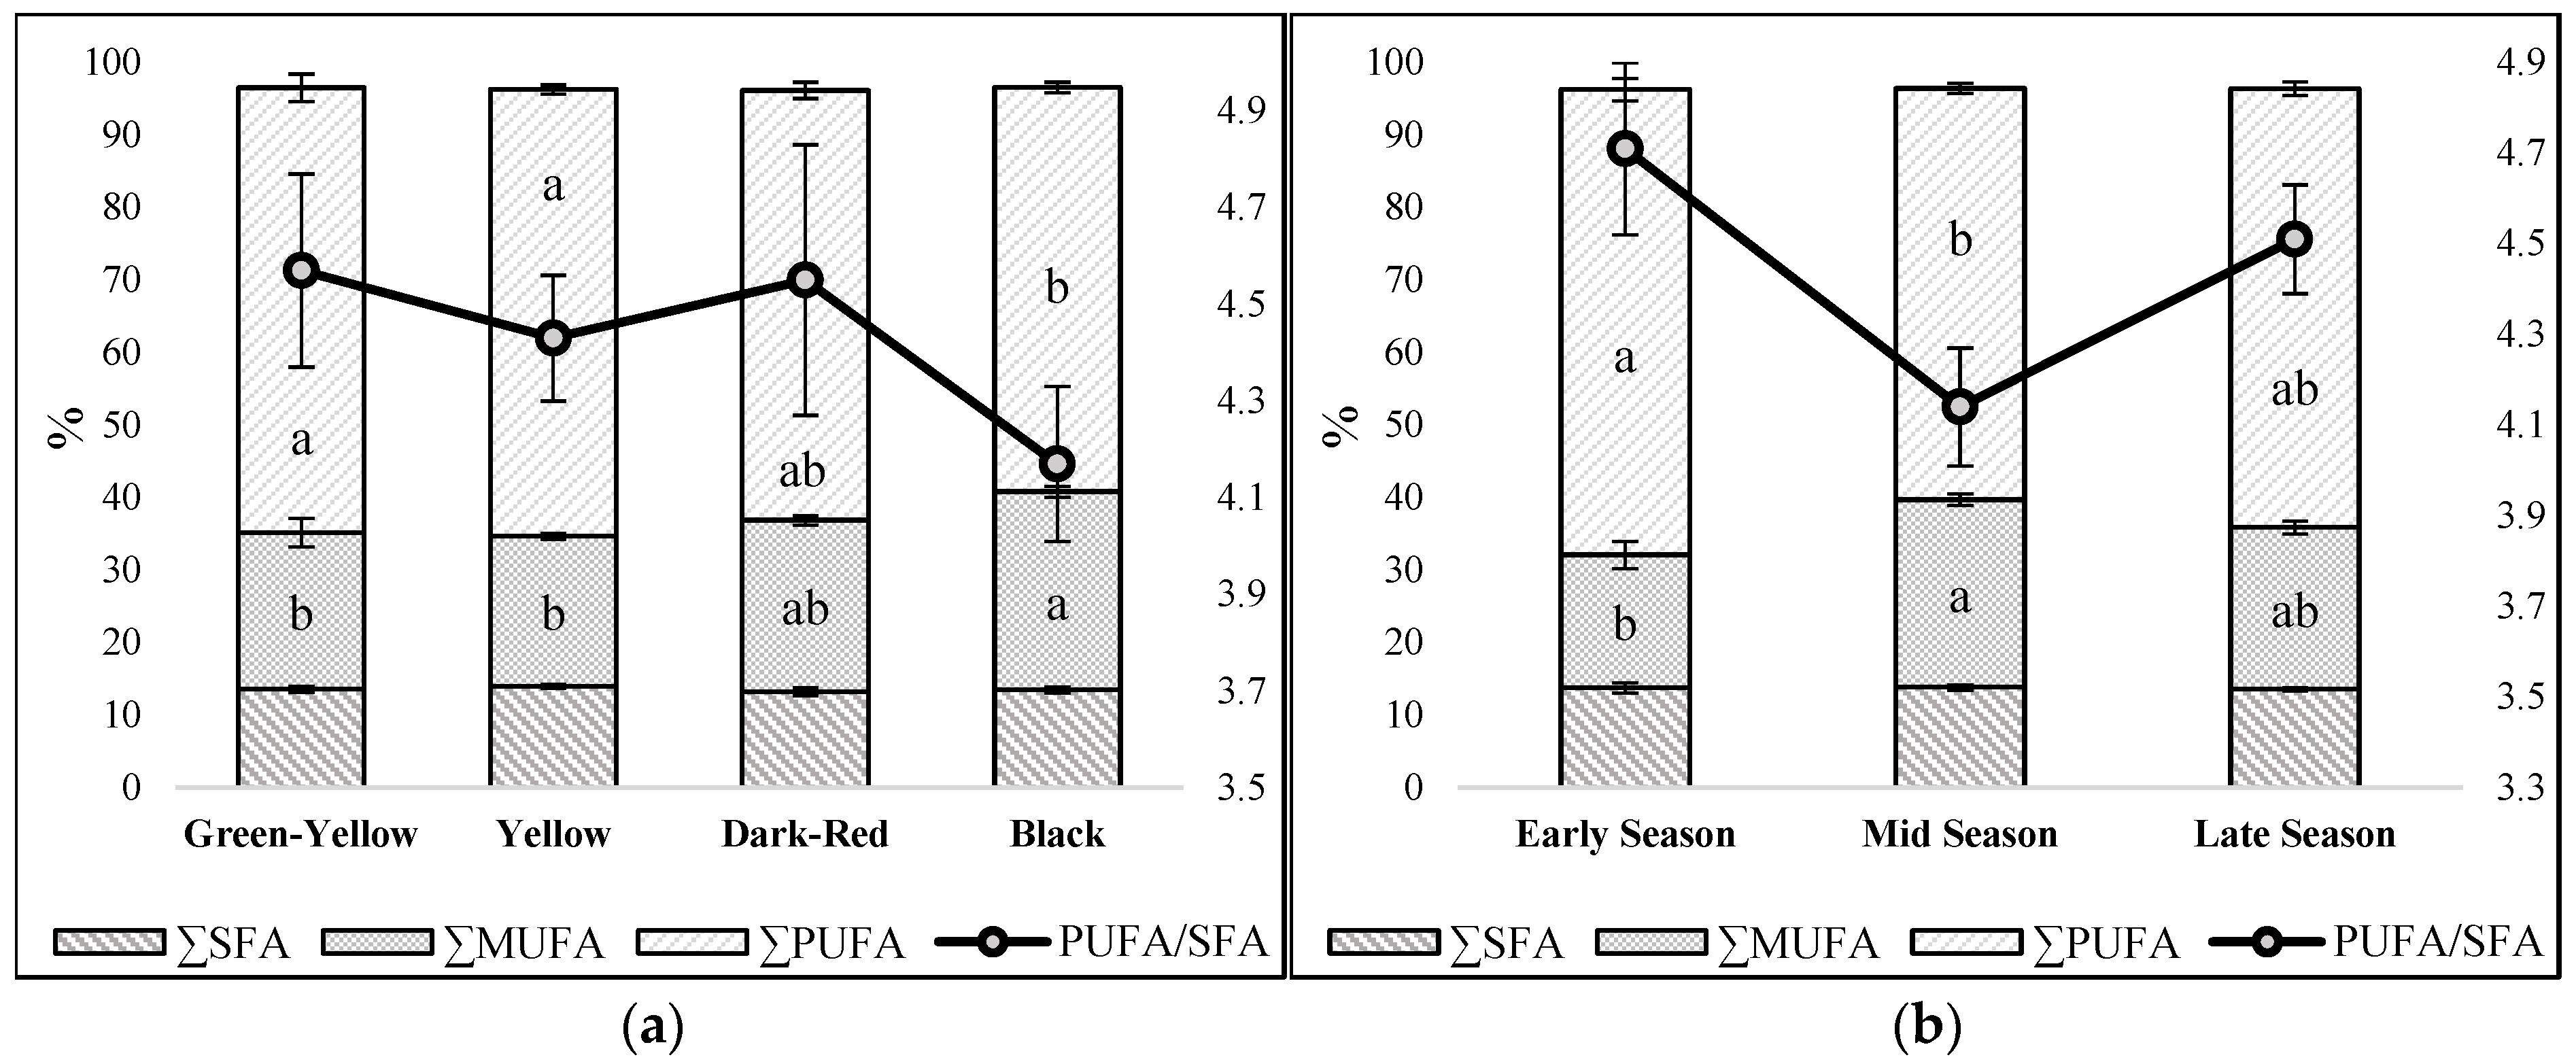
When the fatty acid composition of grape varieties was assessed according to the degree of saturation of the fatty acids, it was found that polyunsaturated fatty acids (PUFAs) were the predominant group in all varieties. Statistically significant differences (p < 0.01) were found between varieties in terms of PUFA, MUFA (monounsaturated fatty acids) and SFA (saturated fatty acids) content, as well as the PUFA/SFA ratio (Table 7). The PUFA content in the seeds ranged from 54.13% to 67.46%, with the ‘Mazrone’ variety identified as the grape variety with the highest PUFA content and the highest PUFA/SFA ratio (5.44). When the varieties were classified according to their intended use, it was observed that table grape varieties had a higher SFA content than wine and raisin varieties (p < 0.05).
In previous studies, grape seeds have also been ranked in the order PUFA > MUFA > SFA according to the saturation status of their fatty acids [77,78]. Furthermore, many researchers have reported that grape varieties differ from one another in terms of the SFA, MUFA and PUFA content of their seed oil [11,14,79]. Various studies have demonstrated that the PUFA/SFA ratio in seed oils, both in grapevines and in certain other fruit species, can be influenced by irrigation, fertilisation and other agricultural management practices [70,80,81,82]. In contrast to previous studies, our research—which examined the composition of seed oils from samples of the Çirbeyt variety collected from different vineyards within the same ecological region, taking into account their degree of saturation—suggests that the effects of cultural practices applied to the varieties on fatty acids are quite limited. Based on this, it can be suggested that the fatty acid composition of seed oil should be used in addition to other ampelographic indicators for the identification and comparison of genotypes belonging to the Vitis vinifera L. species that occur naturally within the same ecological region.
The PUFA/SFA ratio was above 3.97 in all varieties. This relatively high ratio indicates a fatty acid profile that may be considered nutritionally favourable in the context of current dietary recommendations favouring the replacement of saturated fatty acids with polyunsaturated fatty acids [83,84]. In a comparison based on skin colour groups, it was found that black-skinned varieties had a higher MUFA content (p < 0.05) and a lower PUFA content (p < 0.01) (Figure 6a). With regard to the ripening period, it was found that early-maturing varieties had a significantly higher PUFA ratio (p < 0.01) and a lower MUFA content (p < 0.05) (Figure 6b). No statistically significant differences were found in the PUFA/SFA ratio between either the husk colour or the seed maturity stage groups (p > 0.05).

2.6. Correlation

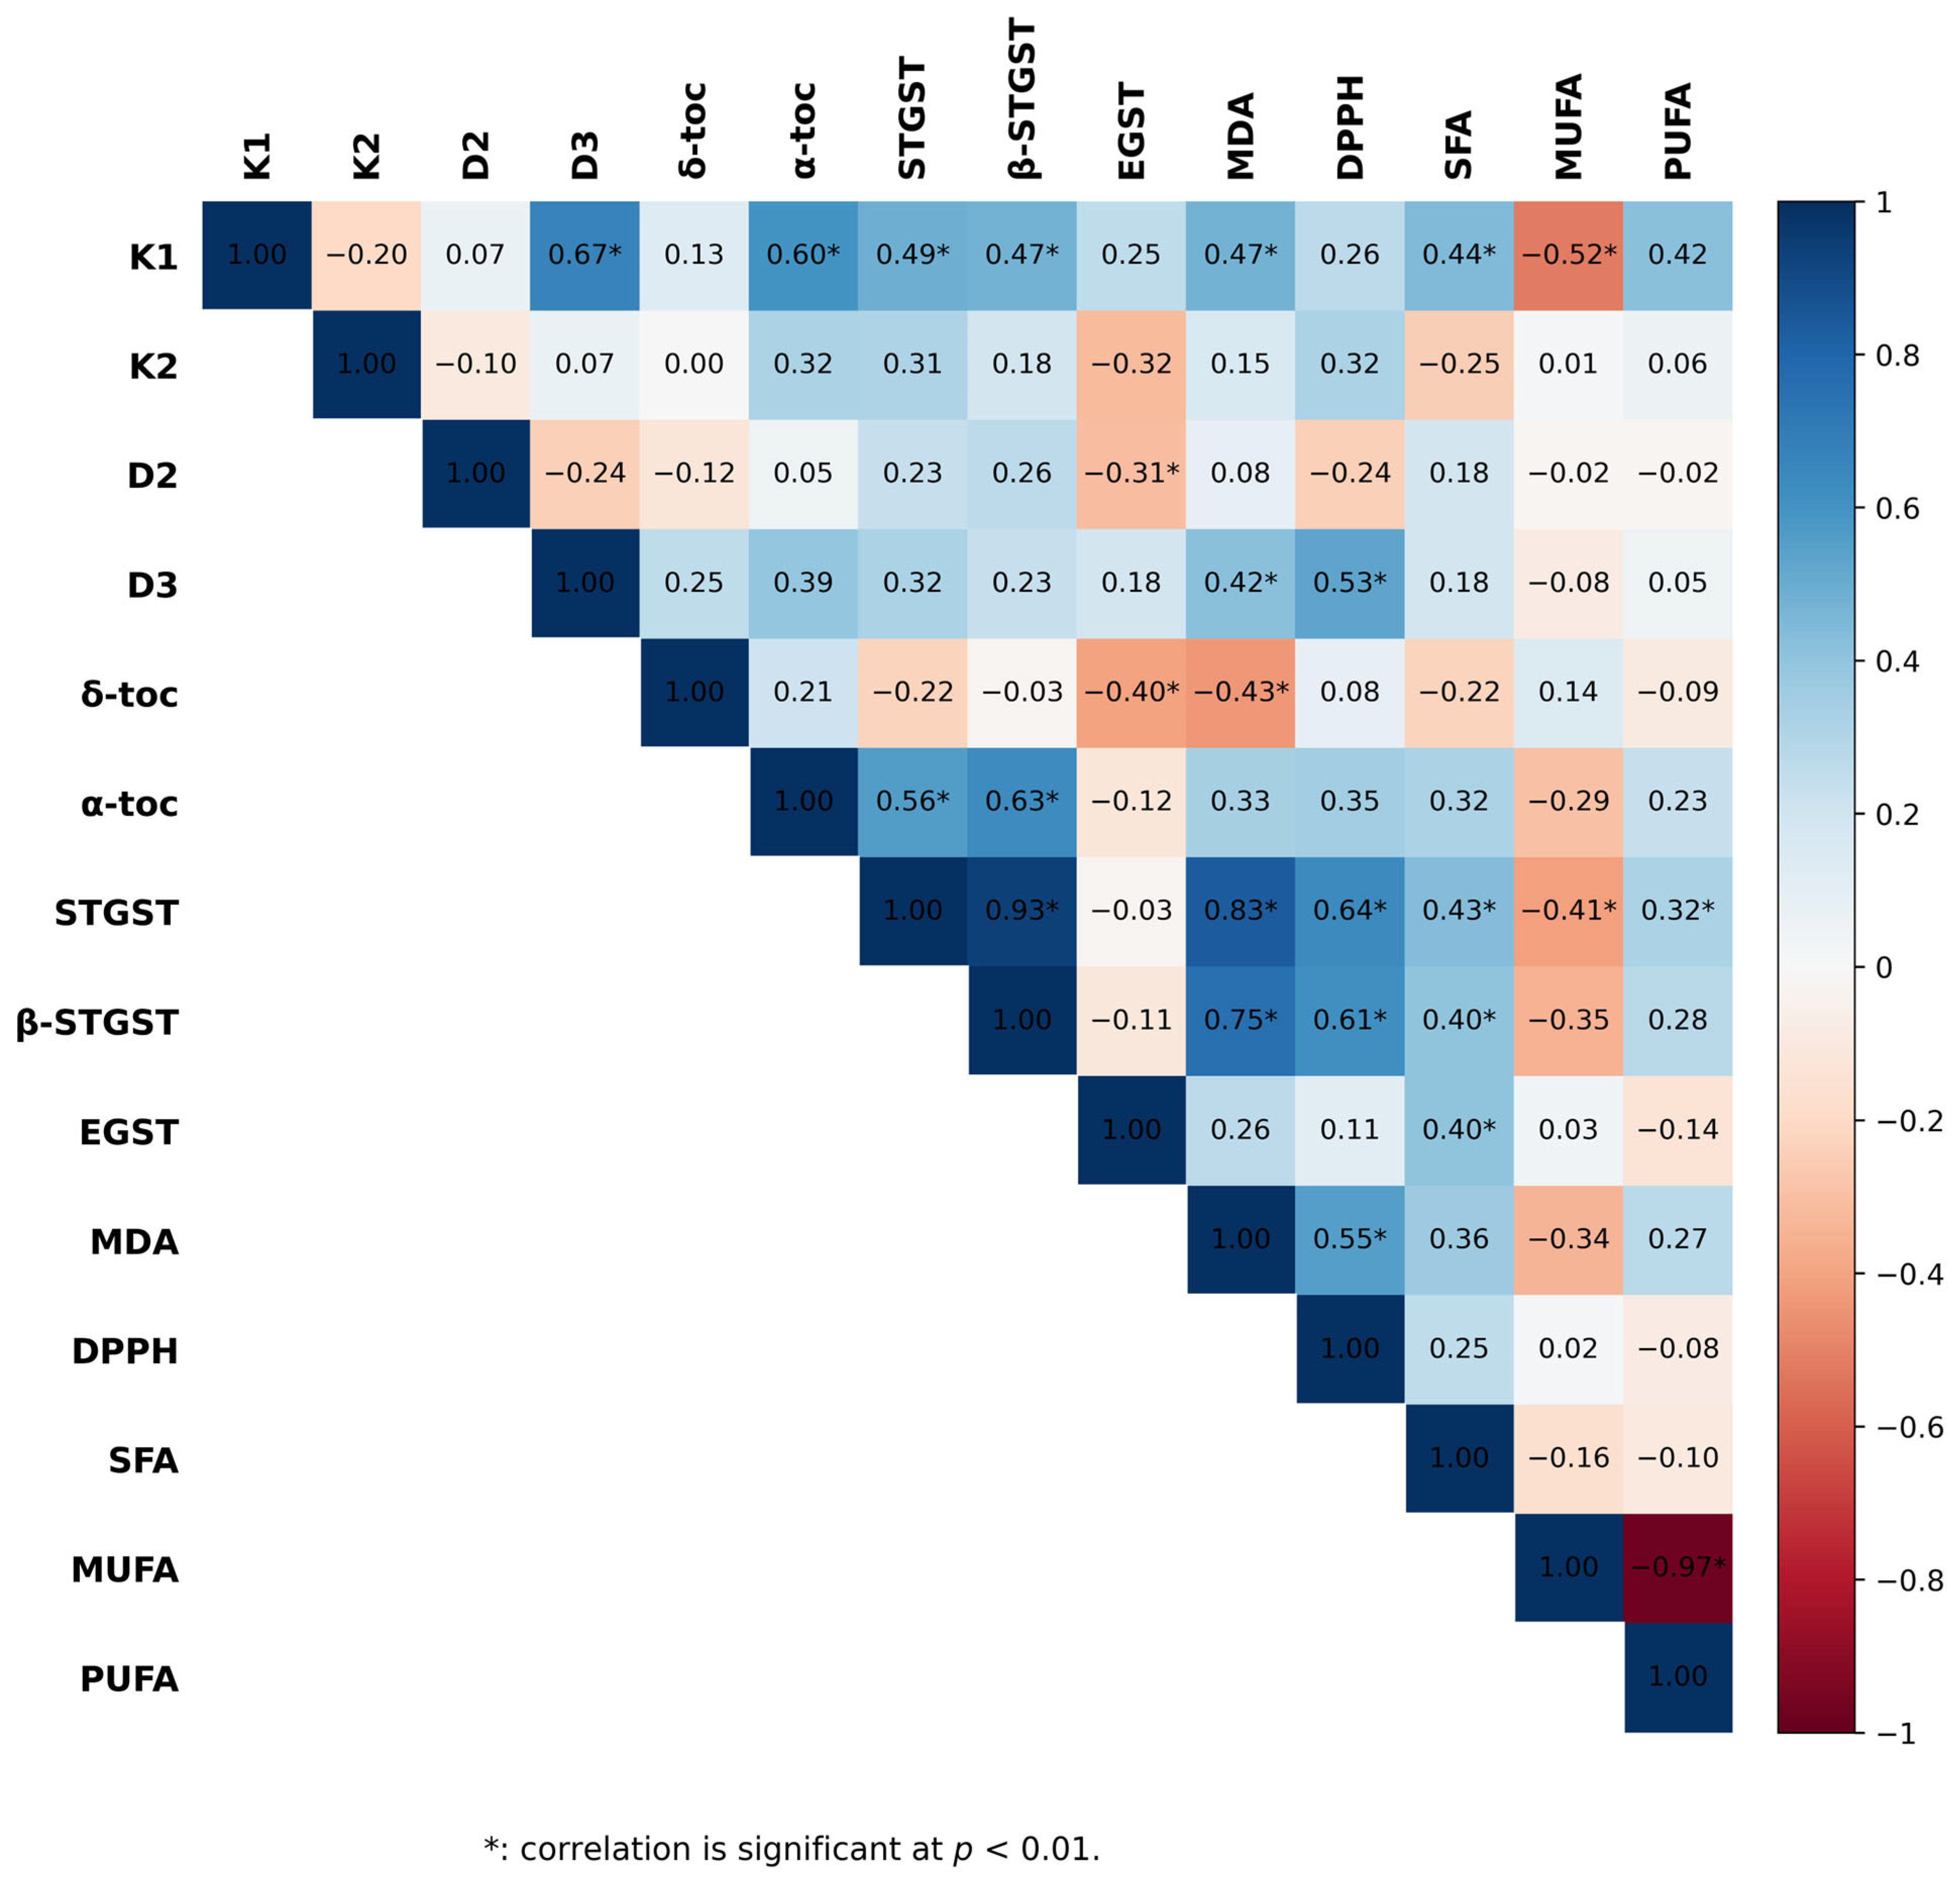
A correlation plot illustrating the interrelationships between the amounts of the phytochemicals analysed in the seeds of different grape varieties—regardless of variety—is presented in Figure 7. According to this, the strongest negative correlation (r = −0.97, p < 0.01) was observed between MUFA and PUFA. This is due to the inverse relationship between linoleic acid and oleic acid. Studies examining different grape varieties have also frequently highlighted the relationship between these two fatty acids [61,73,85]. Furthermore, in parallel with the increase in MUFA content in the seeds, the levels of vitamin K1, stigmasterol, β-sitosterol and MDA decreased. In parallel with the increase in SFA, the levels of vitamin K1, α-tocopherol, sterols and MDA in the seeds increased.
It has been found that, in grape seeds—which possess high antioxidant capacity—levels of α-tocopherol, stigmasterol, β-sitosterol, MDA and vitamins K2 and D3 also increase in parallel with the rise in antioxidant capacity (DPPH). Zhao et al. [66], who reached similar findings, reported a positive correlation between vitamin E content and DPPH in grape seeds. No relationship was detected between DPPH and fatty acid saturation groups. This finding has been reported by Yi et al. [10] in grape juice and by Çakır et al. [19] in grape seeds.
When the variations in vitamins within the seeds were examined individually, a statistically significant relationship (r = 0.67, p < 0.01) was observed only between K1 and D3. No significant (p > 0.05) relationship was found between the tocopherol groups. Although Sabir et al. [61] detected a positive correlation between α-tocopherol and δ-tocopherol in grape seeds, Çakır et al. [19] were unable to find this relationship in the varieties they examined. The strongest positive correlation (r = 0.93, p < 0.01) we observed in grape seeds was between stigmasterol and β-sitosterol. In contrast, the amount of ergosterol in the seeds was not affected by changes in the other two sterol compounds. Whilst the variation in phytochemicals in grape seeds may be influenced by numerous environmental factors, it is primarily shaped under the control of genotype. Therefore, the minor differences observed between studies in the literature, including our own, stem from these factors.

2.7. Principal Component Analysis (PCA)

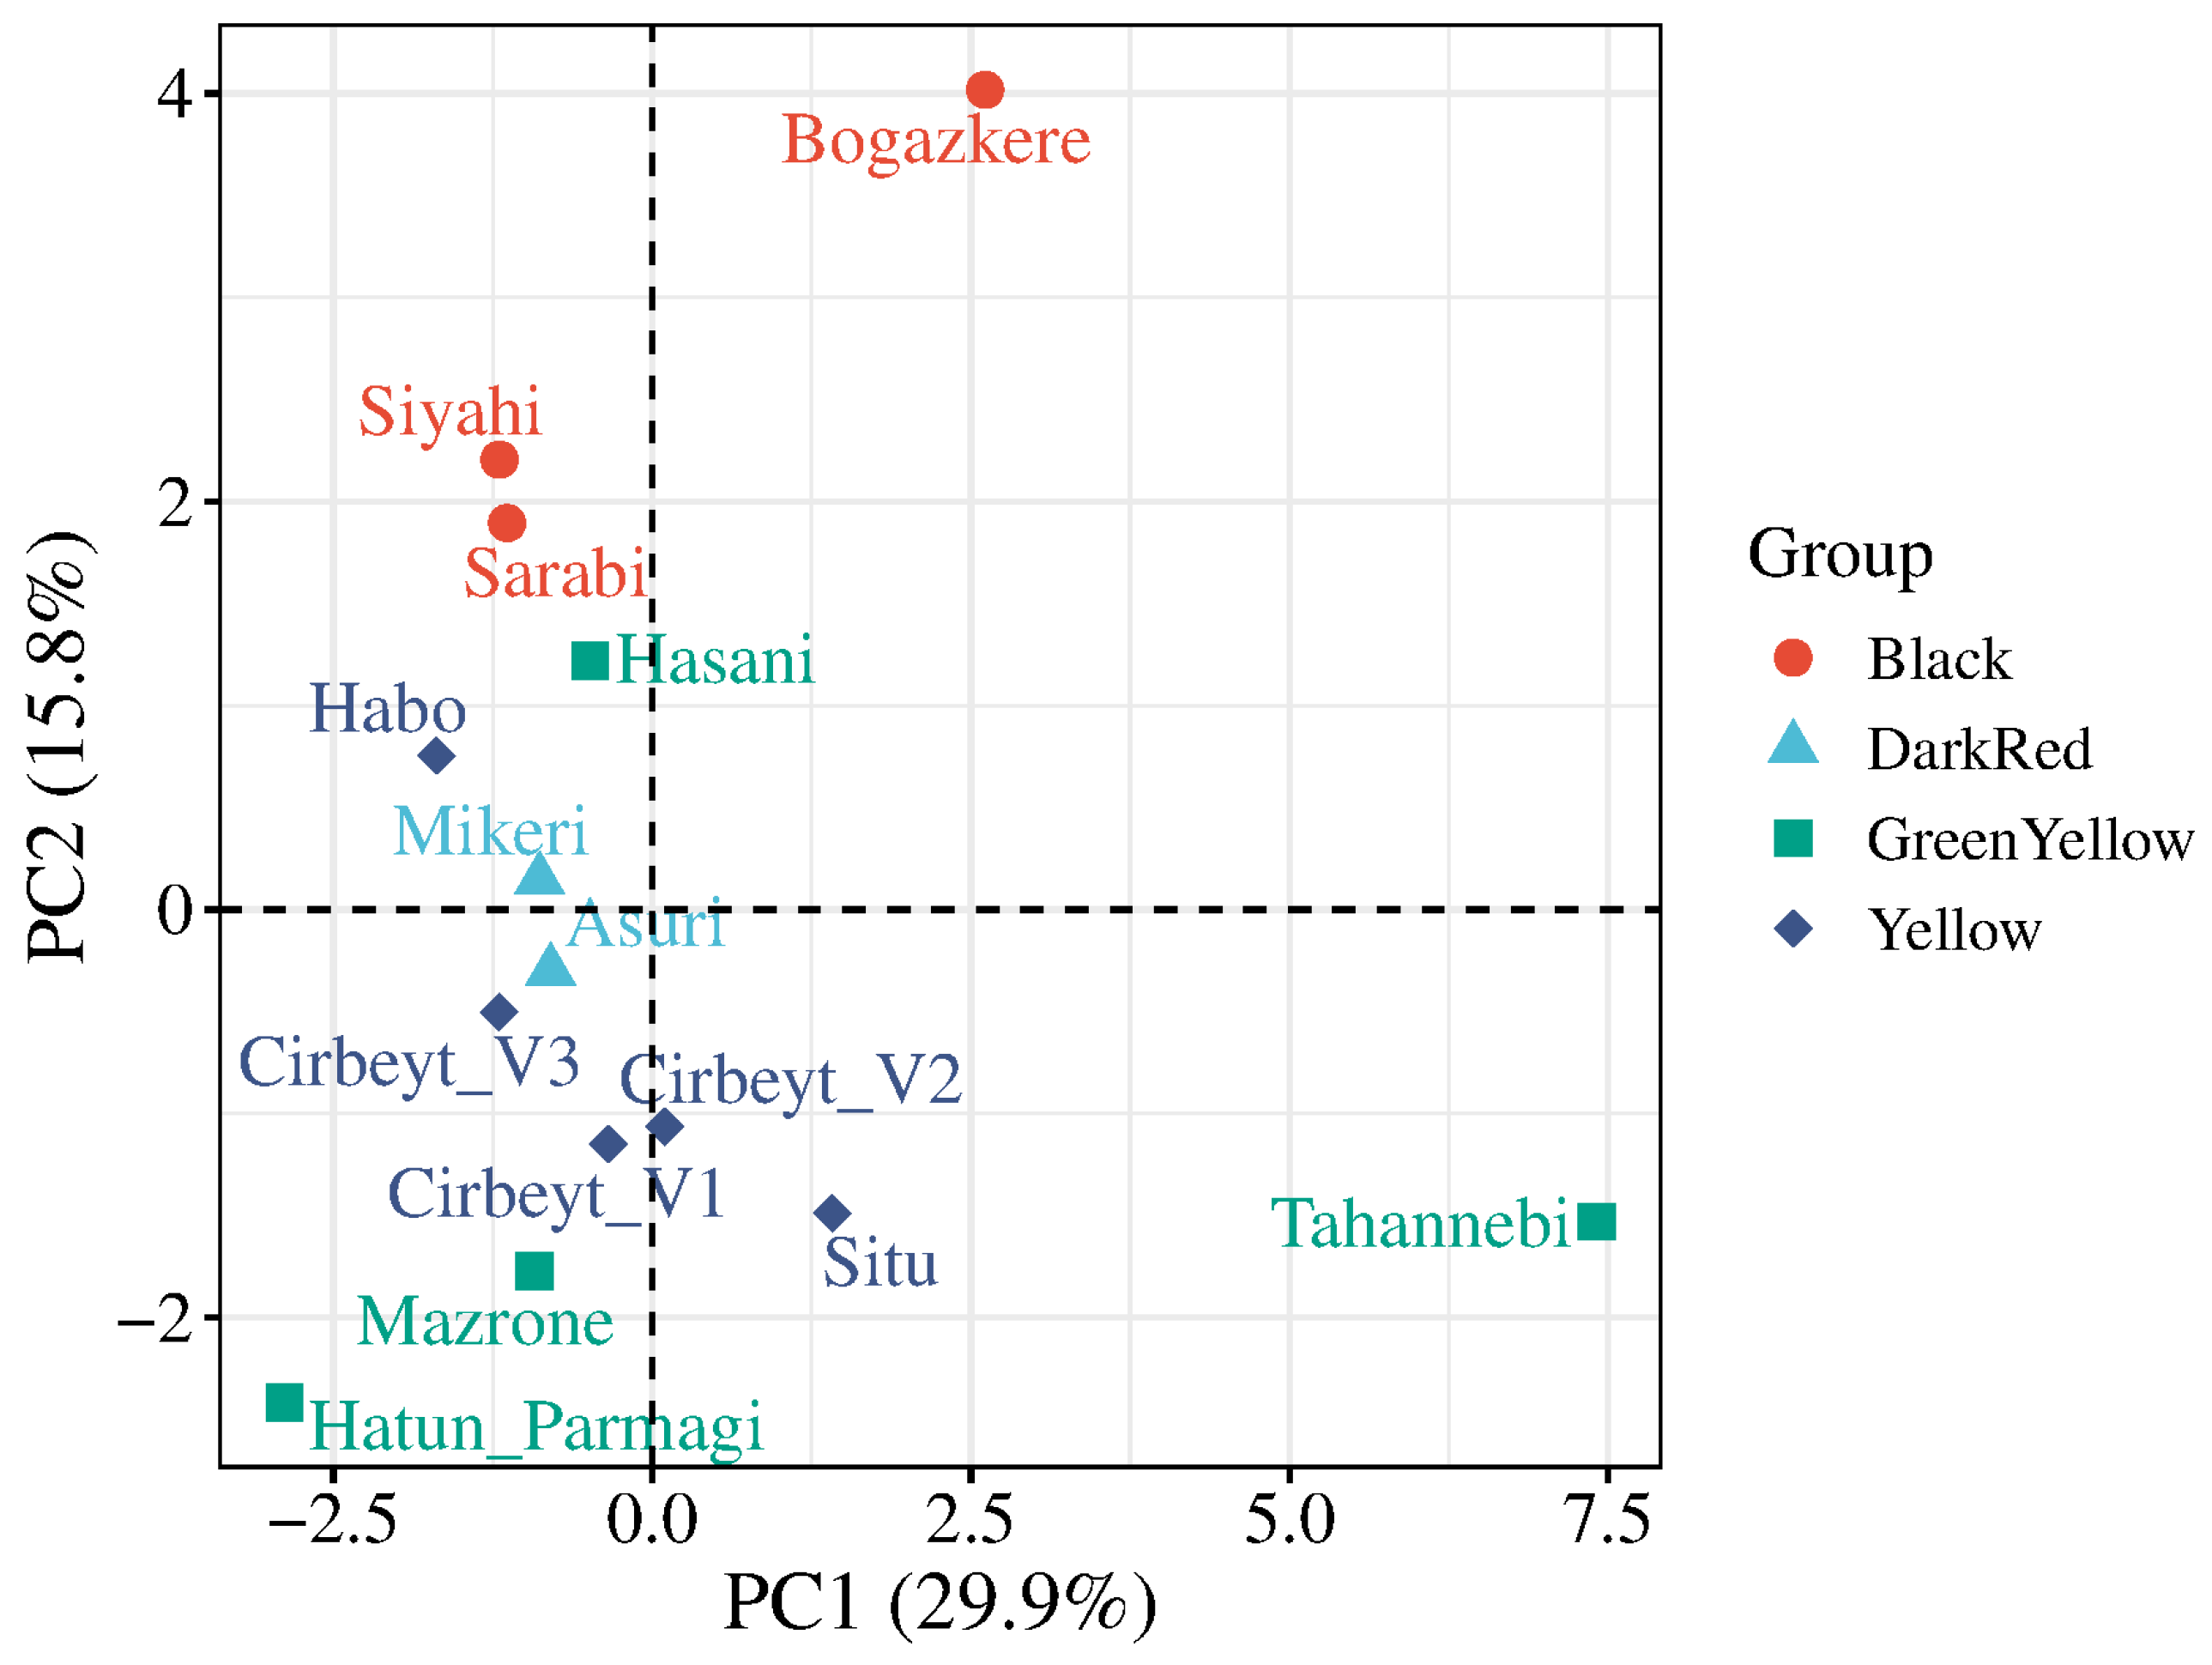
Principal component analysis (PCA) was performed to obtain an integrated multivariate evaluation of the phytochemical composition of grape seed samples. The first two principal components explained 45.7% of the total variation, with PC1 and PC2 accounting for 29.9% and 15.8%, respectively (Figure 8). The PCA score plot revealed a partial grouping of samples according to berry skin colour; however, the overlap among groups indicated that skin colour alone did not fully explain the observed variation. Tahannebi was clearly separated along the positive side of PC1, whereas Boğazkere was distinguished mainly along PC2. In contrast, the Çirbeyt samples (V1, V2 and V3) were positioned relatively close to each other, suggesting a similar phytochemical profile despite being collected from different vineyards. Overall, the PCA results supported the general conclusion of the study that varietal/genotypic differences played a more important role than berry skin colour in determining grape seed phytochemical composition.

3. Materials and Methods

3.1. Plant Material and Study Area

The research material consisted of seeds from twelve local grape (Vitis vinifera L.) varieties of economic importance in the regional viticulture of Eğil district, Diyarbakır province, Türkiye. The varieties were grown on their own roots and sampled from commercial vineyards located within the villages of Kazanlı, Selmanköy, Koçerli, Işıklı, and Konak. Ampelographic descriptions of the varieties were established in 2016, and local evaluation forms were prepared accordingly. Selected ampelographic characteristics of the examined varieties are presented in Table 8. Within the scope of the study, samples of the ‘Çirbeyt’ cultivar were collected from three different vineyards (V1, V2, and V3) and evaluated separately.
All grape varieties included in this study were cultivated in vineyards managed according to standard regional commercial practices. Vines were grown under rainfed conditions without supplemental irrigation, trained using the traditional goblet system, and spaced at 4 × 4 m. No mulching was applied either within or between rows, and annual winter pruning was performed. However, soil tillage, pest management, and fertilization practices were determined by individual growers.
The study area has a continental climate; in 2017, when the samples were taken, rainfall levels were lower (332 mm) than the long-term average (461 mm), although monthly average temperatures remained within seasonal norms [86]. For the contextual characterization of the study area, previously published soil data were used. According to Çiçek [87], the soils of the region are alkaline (pH 7.75), with an average organic matter content of 1.01% and lime content of 7.07%. The soil texture is clay loam (saturation: 66.8%), and the salinity level is low.

3.2. Sample Preparation

During the 2017 growing season, grapes from the varieties marked the previous year were harvested when their total soluble dry matter content reached the 18–21 Brix range. The seeds, removed from the berries using a scalpel, were washed with distilled water, dried at 40 °C for 3 h and subsequently ground in an agate mortar. The powdered samples were transferred to sealed tubes and stored at −80 °C only temporarily during laboratory preparation and procurement of the required analytical materials. The storage period did not exceed 15 days, and all laboratory analyses reported in the present study were completed during the 2017 experimental period.
For each grape variety/sample identity, three independent biological samples were collected and processed separately (n = 3). The three ‘Çirbeyt’ samples originating from different vineyards (V1, V2, and V3) were considered separate sample identities, each represented by three biological replicates.

3.3. Vitamin and Phytosterol Analyses

All chemicals and solvents used in the analyses were of analytical or HPLC grade and were purchased from Sigma-Aldrich (St. Louis, MO, USA).
Vitamin (K1, K2, D2 and D3) and phytosterol (β-sitosterol, stigmasterol and ergosterol) analyses were performed in 2017 using an HPLC-UV method. For this purpose, 1 g of seed sample was homogenised in a hexane/isopropanol mixture (3:2, v/v) and subsequently hydrolysed with 5% KOH at 85 °C. Unsaponifiable lipophilic compounds were extracted twice with 5 mL hexane. After evaporation of the hexane phase under a nitrogen stream, the residue was dissolved in 1 mL acetonitrile/methanol (3:2, v/v) and transferred to autosampler vials. Chromatographic analysis was performed using a Shimadzu LC-10 ADVP system equipped with an SPD-10AVP UV–Vis detector (Shimadzu Corporation, Kyoto, Japan) and a SUPELCOSIL™ LC-18 column (15 cm × 4.6 mm, 5 µm; Supelco, Bellefonte, PA, USA). Acetonitrile/methanol (3:2, v/v) was used as the mobile phase at a flow rate of 1.0 mL min−1. Detection was performed at 202 nm for α-tocopherol and phytosterols and at 265 nm for vitamins D and K. A comparable HPLC-UV analytical procedure was subsequently reported by Çakır et al. [19].

3.4. Determination of MDA Content

MDA content, an indicator of lipid peroxidation, was determined according to the method of Heath and Packer [88]. A 0.5 g seed sample was homogenised in 0.1% trichloroacetic acid (TCA) and centrifuged at 10,000 rpm. To the resulting 2 mL of supernatant, 2 mL of a 0.5% thiobarbituric acid (TBA, prepared in 20% TCA) solution was added, and the mixture was incubated at 95 °C for 30 min. The absorbance of the samples, which were cooled in an ice bath and centrifuged again, was measured at 532 and 600 nm. The MDA concentration was calculated using a molar absorption coefficient of 155 mM−1 cm−1 and the results were expressed in nmol g−1.

3.5. Determination of DPPH Radical Scavenging Capacity

The free radical scavenging capacity of grape seeds was determined according to the method developed by Brand-Williams et al. [20]. A 4 mL aliquot of a DPPH solution prepared in methanol at a concentration of 25 mg/L was mixed with plant extracts in varying volumes (50–800 µL) and incubated in the dark for 30 min. At the end of the incubation, the absorbance was measured at 517 nm and the percentage of inhibition was determined using the following formula (Equation (1)).
DPPH Inhibition (%) = [(Control ABS − Sample ABS)/Control ABS] × 100

3.6. Determination of Fatty Acid Composition

Lipid extraction was carried out using a hexane/isopropanol (3:2, v/v) mixture, in accordance with the method of Hara and Radin [89]. The resulting lipid fraction was methylated with 2% methanolic sulfuric acid at 50 °C for 15 h. After cooling to room temperature, 5% sodium chloride solution was added, and the fatty acid methyl esters (FAMEs) were extracted with n-hexane. The hexane phase was treated with 2% KHCO3 solution and allowed to stand for phase separation. Subsequently, the hexane phase was evaporated under a nitrogen stream at 45 °C, and the FAME residues were dissolved in n-hexane and transferred to vials for analysis.
FAMEs were analyzed using a Shimadzu GC-17 gas chromatograph (Shimadzu Corporation, Kyoto, Japan) equipped with an SP™-2380 capillary column (30 m × 0.25 mm i.d., 0.20 µm film thickness; Supelco, Bellefonte, PA, USA). The injector and detector temperatures were maintained at 240 and 280 °C, respectively. The oven temperature was initially set at 120 °C and increased to 200 °C at 5 °C min−1, followed by an increase from 200 to 220 °C at 4 °C min−1. Nitrogen was used as the carrier gas. Individual FAMEs were identified by comparing their retention times with those of standard fatty acid methyl esters analyzed under the same chromatographic conditions. Quantification was performed using Class GC 10 software (Shimadzu Corporation, Kyoto, Japan) and the external standard method.
The relative proportion of each fatty acid was calculated as a percentage of the total identified fatty acids according to the following equation (Equation (2)):
Fatty acid (%) = [individual fatty acid content/total content of identified fatty acids] × 100.

3.7. Statistical Analysis

Statistical analyses were based on three independent biological replicates for each of the 14 sample identities (n = 3 per sample identity; total N = 42 biological observations). Technical replicate measurements, where applicable, were not considered independent experimental units. One-way analysis of variance (one-way ANOVA) was applied to determine differences among sample identities, and Tukey’s multiple comparison test was used to compare means. The analyses were performed using IBM SPSS Statistics, version 20.0 (IBM Corp., Armonk, NY, USA).
The relationships among the measured variables were assessed using Pearson’s correlation analysis. Correlation coefficients (r) and corresponding significance levels (p) were calculated, and the resulting correlation matrix was visualized as a heatmap to facilitate the interpretation of relationships among variables.
In addition, principal component analysis (PCA) was performed using standardized (z-score-transformed) phytochemical variables for the 14 sample identities to evaluate the overall multivariate structure of the dataset and to visualize sample grouping patterns. Berry skin colour, ripening stage, and utilization type are cultivar-associated characteristics and are not fully orthogonal to varietal identity. Therefore, these categorical variables were not interpreted as independent experimental factors, and separate one-way comparisons were used only as exploratory group-wise analyses.

4. Conclusions

This study demonstrated substantial varietal variation in the phytochemical composition of grape seeds from indigenous Vitis vinifera L. cultivars grown in Southeastern Anatolia. Linoleic acid was the predominant fatty acid in all cultivars, while α-tocopherol and β-sitosterol were the major tocopherol and phytosterol components, respectively. The results further showed that ripening period and berry skin colour influenced selected phytochemical traits, whereas differences associated with utilization type were comparatively limited. Overall, these findings indicate that varietal characteristics represent a major source of variation in grape seed biochemical composition.
Among the evaluated cultivars, Tahannebi was distinguished by high levels of several bioactive constituents, whereas Mazrone exhibited the highest PUFA/SFA ratio. These results highlight the potential of local grape germplasm as a source of value-added compounds for food, nutraceutical, cosmetic, and related applications. In addition, the marked differences observed among cultivars suggest that the selection of grape varieties for industrial use should consider not only yield and technological characteristics but also seed phytochemical composition.
Nevertheless, the observed differences should be interpreted within the ecological and agronomic conditions of the present study. Future multi-year and multi-location studies involving grape varieties from different viticultural regions are warranted to validate the stability of these phytochemical profiles and to further elucidate genotype × environment interactions. Such studies may also help identify cultivars with consistently high-value biochemical profiles for targeted industrial applications.

Author Contributions

Conceptualization, A.Ç. and N.K.S.; Methodology, A.Ç. and N.K.S.; Investigation, A.Ç. and N.K.S.; Formal Analysis, M.İ.O., N.K.S. and F.İ.; Writing—Original Draft Preparation, A.Ç., M.İ.O. and F.İ.; Writing—Review and Editing, A.Ç., M.İ.O., N.K.S. and F.İ. All authors have read and agreed to the published version of the manuscript.

Funding

This research received no external funding.

Institutional Review Board Statement

For this article, no studies with human participants or animals were performed by any of the authors. All studies mentioned were in accordance with the ethical standards indicated in each case.

Data Availability Statement

The data presented in this study are available from the corresponding author upon reasonable request.

Conflicts of Interest

The authors declare no conflicts of interest.

References

  1. OIV. State of the World Vine and Wine Sector in 2022; International Organisation of Vine and Wine: Dijon, France, 2023. [Google Scholar]
  2. Moutinho, J.; Gouvinhas, I.; Domínguez-Perles, R.; Barros, A. Optimization of the extraction methodology of grape pomace polyphenols for food applications. Molecules 2023, 28, 3885. [Google Scholar] [CrossRef] [Scilit] [PubMed]
  3. Odabaşıoğlu, M.İ.; Gürsöz, S. Effects of drought-tolerant grapevine rootstocks on the mineral contents and fatty acid compositions of grape seeds. J. Berry Res. 2022, 12, 383–400. [Google Scholar] [CrossRef] [Scilit]
  4. Shi, J.; Yu, J.; Pohorly, J.E.; Kakuda, Y. Polyphenolics in grape seeds—Biochemistry and functionality. J. Med. Food 2003, 6, 291–299. [Google Scholar] [CrossRef] [Scilit] [PubMed]
  5. Garavaglia, J.; Markoski, M.M.; Oliveira, A.; Marcadenti, A. Grape seed oil compounds: Biological and chemical actions for health. Nutr. Metab. Insights 2016, 9, 59–64. [Google Scholar] [CrossRef] [Scilit] [PubMed]
  6. Unusan, N. Proanthocyanidins in grape seeds: An updated review of their health benefits and potential uses in the food industry. J. Funct. Foods 2020, 67, 103861. [Google Scholar] [CrossRef] [Scilit]
  7. Yalcin, H.; Kavuncuoglu, H.; Ekici, L.; Sagdic, O. Determination of fatty acid composition, volatile components, physico-chemical and bioactive properties of grape (Vitis vinifera) seed and seed oil. J. Food Process. Preserv. 2017, 41, e12854. [Google Scholar] [CrossRef] [Scilit]
  8. Matthäus, B. Virgin grape seed oil: Is it really a nutritional highlight? Eur. J. Lipid Sci. Technol. 2008, 110, 645–650. [Google Scholar] [CrossRef] [Scilit]
  9. Özkan, G.; Baydar, N.G.; Çetin, E.S. Characterization of grape seed and pomace oil extracts. Grasas Aceites 2007, 58, 29–33. [Google Scholar] [CrossRef] [Scilit]
  10. Yi, C.; Shi, J.; Kramer, J.; Xue, S.; Jiang, Y.; Zhang, M.; Ma, Y.; Pohorly, J. Fatty acid composition and phenolic antioxidants of winemaking pomace powder. Food Chem. 2009, 114, 570–576. [Google Scholar] [CrossRef] [Scilit]
  11. Odabaşıoğlu, M.I. Total oil and fatty acid composition of the seed of 16 grape genotypes with different skin colors and ripening times. J. Berry Res. 2023, 13, 325–342. [Google Scholar] [CrossRef] [Scilit]
  12. Yamauchi, R. Vitamin E: Mechanism of its antioxidant activity. Food Sci. Technol. Int. Tokyo 1997, 3, 301–309. [Google Scholar] [CrossRef] [Scilit]
  13. Shinagawa, F.B.; De Santana, F.C.; Torres, L.R.O.; Mancini-Filho, J. Grape seed oil: A potential functional food? Food Sci. Technol. 2015, 35, 399–406. [Google Scholar] [CrossRef] [Scilit]
  14. Carmona-Jiménez, Y.; Igartuburu, J.M.; Guillén-Sánchez, D.A.; García-Moreno, M.V. Fatty acid and tocopherol composition of pomace and seed oil from five grape varieties southern Spain. Molecules 2022, 27, 6980. [Google Scholar] [CrossRef] [Scilit] [PubMed]
  15. Ryan, E.; Galvin, K.; O’connor, T.P.; Maguire, A.R.; O’brien, N.M. Phytosterol, squalene, tocopherol content and fatty acid profile of selected seeds, grains, and legumes. Plant Foods Hum. Nutr. 2007, 62, 85–91. [Google Scholar] [CrossRef] [Scilit] [PubMed]
  16. Piironen, V.; Lindsay, D.G.; Miettinen, T.A.; Toivo, J.; Lampi, A.M. Plant sterols: Biosynthesis, biological function and their importance to human nutrition. J. Sci. Food Agric. 2000, 80, 939–966. [Google Scholar] [CrossRef] [Scilit]
  17. Shaghaghi, M.A.; Abumweis, S.S.; Jones, P.J. Cholesterol-lowering efficacy of plant sterols/stanols provided in capsule and tablet formats: Results of a systematic review and meta-analysis. J. Acad. Nutr. Diet. 2013, 113, 1494–1503. [Google Scholar] [CrossRef] [Scilit] [PubMed]
  18. Martin, M.E.; Grao-Cruces, E.; Millan-Linares, M.C.; Montserrat de la Paz, S. Grape (Vitis vinifera L.) seed oil a functional food from the winemaking industry. Foods 2020, 9, 1360. [Google Scholar] [CrossRef] [Scilit] [PubMed]
  19. Çakır, A.; Odabaşıoğlu, M.İ.; Sanyürek, N.K.; Aydın, S. Comprehensive evaluation of the relationships between grape skin color/ripening time and antioxidative capacity, some phytochemicals, and fatty acid compositions of their seeds. Erwerbs-Obstbau 2023, 65, 1991–2004. [Google Scholar] [CrossRef] [Scilit]
  20. Brand-Williams, W.; Cuvelier, M.E.; Berset, C. Use of a free radical method to evaluate antioxidant activity. LWT-Food Sci. Technol. 1995, 28, 25–30. [Google Scholar] [CrossRef] [Scilit]
  21. Prior, R.L.; Wu, X.; Schaich, K. Standardized methods for the determination of antioxidant capacity and phenolics in foods and dietary supplements. J. Agric. Food Chem. 2005, 53, 4290–4302. [Google Scholar] [CrossRef] [Scilit] [PubMed]
  22. Shimamura, T.; Sumikura, Y.; Yamazaki, T.; Tada, A.; Kashiwagi, T.; Ishikawa, H.; Matsui, T.; Sugimoto, N.; Akiyama, H.; Ukeda, H. Applicability of the DPPH assay for evaluating the antioxidant capacity of food additives-inter-laboratory evaluation study. Anal. Sci. 2014, 30, 717–721. [Google Scholar] [CrossRef] [Scilit] [PubMed]
  23. Yemis, O.; Bakkalbasi, E.; Artik, N. Antioxidative activities of grape (Vitis vinifera) seed extracts obtained from different varieties grown in Turkey. Int. J. Food Sci. Technol. 2008, 43, 154–159. [Google Scholar] [CrossRef] [Scilit]
  24. Del Rio, D.; Stewart, A.J.; Pellegrini, N. A review of recent studies on malondialdehyde as toxic molecule and biological marker of oxidative stress. Nutr. Metab. Cardiovasc. Dis. 2005, 15, 316–328. [Google Scholar] [CrossRef] [Scilit] [PubMed]
  25. Tsikas, D. Assessment of lipid peroxidation by measuring malondialdehyde (MDA) and relatives in biological samples: Analytical and biological challenges. Anal. Biochem. 2017, 524, 13–30. [Google Scholar] [CrossRef] [Scilit] [PubMed]
  26. Akbaba, E.; Erişir, F.E.; Aydın, S.; Sanyürek, N.K.; Çakır, A. Vitamin content and MDA levels of certain white grape varieties from different altitudes in Turkey. Emir. J. Food Agric. 2023, 35, 428–435. [Google Scholar] [CrossRef] [Scilit]
  27. Jasinghe, V.J.; Perera, C.O. Distribution of ergosterol in different tissues of mushrooms and its effect on the conversion of ergosterol to vitamin D2 by UV irradiation. Food Chem. 2005, 92, 541–546. [Google Scholar] [CrossRef] [Scilit]
  28. Jiang, Q.; Zhang, M.; Mujumdar, A.S. UV induced conversion during drying of ergosterol to vitamin D in various mushrooms: Effect of different drying conditions. Trends Food Sci. Technol. 2020, 105, 200–210. [Google Scholar] [CrossRef] [Scilit] [PubMed]
  29. Gross, J.; Cho, W.K.; Lezhneva, L.; Falk, J.; Krupinska, K.; Shinozaki, K.; Seki, M.; Herrmann, R.G.; Meurer, J. A plant locus essential for phylloquinone (vitamin K1) biosynthesis originated from a fusion of four eubacterial genes. J. Biol. Chem. 2006, 281, 17189–17196. [Google Scholar] [CrossRef] [Scilit] [PubMed]
  30. Lichtenthaler, H.K. Biosynthesis, accumulation and emission of carotenoids, α-tocopherol, plastoquinone, and isoprene in leaves under high photosynthetic irradiance. Photosynth. Res. 2007, 92, 163–179. [Google Scholar] [CrossRef] [Scilit] [PubMed]
  31. Vujasinović, V.; Bjelica, M.; Čorbo, S.; Dimić, S.; Rabrenović, B. Characterization of the chemical and nutritive quality of cold-pressed grape seed oils produced in the Republic of Serbia from different red and white grape varieties. Grasas Aceites 2021, 72, e411. [Google Scholar] [CrossRef] [Scilit]
  32. Crews, C.; Hough, P.; Godward, J.; Brereton, P.; Lees, M.; Guiet, S.; Winkelmann, W. Quantitation of the main constituents of some authentic grape-seed oils of different origin. J. Agric. Food Chem. 2006, 54, 6261–6265. [Google Scholar] [CrossRef] [Scilit] [PubMed]
  33. DellaPenna, D.; Pogson, B.J. Vitamin synthesis in plants: Tocopherols and carotenoids. Annu. Rev. Plant Biol. 2006, 57, 711–738. [Google Scholar] [CrossRef] [Scilit] [PubMed]
  34. Karastergiou, A.; Gancel, A.-L.; Jourdes, M.; Teissedre, P.-L. Transforming winemaking waste: Grape pomace as a sustainable source of bioactive compounds. OENO One 2025, 59, 2. [Google Scholar] [CrossRef] [Scilit]
  35. Vecka, M.; Staňková, B.; Kutová, S.; Tomášová, P.; Tvrzická, E.; Žák, A. Comprehensive sterol and fatty acid analysis in nineteen nuts, seeds, and kernel. SN Appl. Sci. 2019, 1, 1531. [Google Scholar] [CrossRef] [Scilit]
  36. Pardo, J.E.; Fernández, E.; Rubio, M.; Alvarruiz, A.; Alonso, G.L. Characterization of grape seed oil from different grape varieties (Vitis vinifera). Eur. J. Lipid Sci. Technol. 2009, 111, 188–193. [Google Scholar] [CrossRef] [Scilit]
  37. Demirtas, I.; Pelvan, E.; Özdemir, I.S.; Alasalvar, C.; Ertas, E. Lipid characteristics and phenolics of native grape seed oils grown in Turkey. Eur. J. Lipid Sci. Technol. 2013, 115, 641–647. [Google Scholar] [CrossRef] [Scilit]
  38. Wen, X.; Zhu, M.; Hu, R.; Zhao, J.; Chen, Z.; Li, J.; Ni, Y. Characterisation of seed oils from different grape cultivars grown in China. J. Food Sci. Technol. 2016, 53, 3129–3136. [Google Scholar] [CrossRef] [Scilit] [PubMed]
  39. Górnaś, P.; Rudzińska, M.; Grygier, A.; Lācis, G. Diversity of oil yield, fatty acids, tocopherols, tocotrienols, and sterols in the seeds of 19 interspecific grapes crosses. J. Sci. Food Agric. 2019, 99, 2078–2087. [Google Scholar] [CrossRef] [Scilit] [PubMed]
  40. Ruggiero, A.; Vitalini, S.; Burlini, N.; Bernasconi, S.; Iriti, M. Phytosterols in grapes and wine, and effects of agrochemicals on their levels. Food Chem. 2013, 141, 3473–3479. [Google Scholar] [CrossRef] [Scilit] [PubMed]
  41. Bada, J.C.; León-Camacho, M.; Copovi, P.; Alonso, L. Characterization of grape seed oil from wines with protected denomination of origin (PDO) from Spain. Grasas Aceites 2015, 66, e085. [Google Scholar] [CrossRef] [Scilit]
  42. Akbaba, E.; Aydin, S.; Sanyurek, N.K. Biochemical composition and antioxidant profile of geografically labeled Kohnu grape (Vitis vinifera L.) cultivar from Turkey. Fresenius Environ. Bull. 2021, 30, 9091–9099. [Google Scholar]
  43. Saeidnia, S.; Manayi, A.; Gohari, A.R.; Abdollahi, M. The Story of Beta-sitosterol—A Review. Eur. J. Med. Plants 2014, 4, 590–609. [Google Scholar] [CrossRef] [Scilit]
  44. Rubio, M.; Alvarez-Ortí, M.; Alvarruiz, A.; Fernández, E.; Pardo, J.E. Characterization of oil obtained from grape seeds collected during berry development. J. Agric. Food Chem. 2009, 57, 2812–2815. [Google Scholar] [CrossRef] [Scilit] [PubMed]
  45. Katalinić, V.; Možina, S.S.; Skroza, D.; Generalić, I.; Abramovič, H.; Miloš, M.; Ljubenkov, I.; Piskernik, S.; Pezo, I.; Terpinc, P.; et al. Polyphenolic profile, antioxidant properties and antimicrobial activity of grape skin extracts of 14 Vitis vinifera varieties grown in Dalmatia (Croatia). Food Chem. 2010, 119, 715–723. [Google Scholar] [CrossRef] [Scilit]
  46. Bunea, C.-I.; Pop, N.; Babeş, A.C.; Matea, C.; Dulf, F.V.; Bunea, A. Carotenoids, total polyphenols and antioxidant activity of grapes (Vitis vinifera) cultivated in organic and conventional systems. Chem. Cent. J. 2012, 6, 66. [Google Scholar] [CrossRef] [Scilit] [PubMed]
  47. Liang, Z.; Cheng, L.; Zhong, G.-Y.; Liu, R.H. Antioxidant and antiproliferative activities of twenty-four Vitis vinifera grapes. PLoS ONE 2014, 9, e105146. [Google Scholar] [CrossRef] [Scilit] [PubMed]
  48. Cömert, E.D.; Mogol, B.A.; Gökmen, V. Relationship between color and antioxidant capacity of fruits and vegetables. Curr. Res. Food Sci. 2020, 2, 1–10. [Google Scholar] [CrossRef] [Scilit] [PubMed]
  49. Niu, S.; Hao, F.; Mo, H.; Jiang, J.; Wang, H.; Liu, C.; Fan, X.; Zhang, Y. Phenol profiles and antioxidant properties of white skinned grapes and their coloured genotypes during growth. Biotechnol. Biotechnol. Equip. 2017, 31, 58–67. [Google Scholar] [CrossRef] [Scilit]
  50. Pantelić, M.; Zagorac, D.D.; Natić, M.; Gašić, U.; Jović, S.; Vujović, D.; Djordjević, J.P. Impact of clonal variability on phenolics and radical scavenging activity of grapes and wines: A study on the recently developed Merlot and Cabernet Franc clones (Vitis vinifera L.). PLoS ONE 2016, 11, e0163823. [Google Scholar] [CrossRef] [Scilit] [PubMed]
  51. Kupe, M.; Karatas, N.; Unal, M.S.; Ercisli, S.; Baron, M.; Sochor, J. Phenolic composition and antioxidant activity of peel, pulp and seed extracts of different clones of the Turkish grape cultivar ‘Karaerik’. Plants 2021, 10, 2154. [Google Scholar] [CrossRef] [Scilit] [PubMed]
  52. Rao, M.J.; Duan, M.; Zhou, C.; Jiao, J.; Cheng, P.; Yang, L.; Wei, W.; Shen, Q.; Ji, P.; Yang, Y.; et al. Antioxidant defense system in plants: Reactive oxygen species production, signaling, and scavenging during abiotic stress-induced oxidative damage. Horticulturae 2025, 11, 477. [Google Scholar] [CrossRef] [Scilit]
  53. Zheng, C.; Chen, J.-P.; Wang, X.-W.; Li, P. Reactive oxygen species in plants: Metabolism, signaling, and oxidative modifications. Antioxidants 2025, 14, 617. [Google Scholar] [CrossRef] [Scilit] [PubMed]
  54. Rockenbach, I.I.; Rodrigues, E.; Gonzaga, L.V.; Caliari, V.; Genovese, M.I.; de Souza Schmidt Gonçalves, A.E.; Fett, R. Phenolic compounds content and antioxidant activity in pomace from selected red grapes (Vitis vinifera L. and Vitis labrusca L.) widely produced in Brazil. Food Chem. 2011, 127, 174–179. [Google Scholar] [CrossRef] [Scilit]
  55. Pinasseau, L.; Vallverdú-Queralt, A.; Verbaere, A.; Roques, M.; Meudec, E.; Le Cunff, L.; Péros, J.-P.; Ageorges, A.; Sommerer, N.; Boulet, J.-C.; et al. Cultivar diversity of grape skin polyphenol composition and changes in response to drought investigated by LC-MS based metabolomics. Front. Plant Sci. 2017, 8, 1826. [Google Scholar] [CrossRef] [Scilit] [PubMed]
  56. Billet, K.; Houillé, B.; Dugé de Bernonville, T.; Besseau, S.; Oudin, A.; Courdavault, V.; Delanoue, G.; Guérin, L.; Clastre, M.; Giglioli-Guivarc'h, N.; et al. Field-based metabolomics of Vitis vinifera L. stems provides new insights for genotype discrimination and polyphenol metabolism structuring. Front. Plant Sci. 2018, 9, 798. [Google Scholar] [CrossRef] [Scilit] [PubMed]
  57. Sochorova, L.; Prusova, B.; Jurikova, T.; Mlcek, J.; Adamkova, A.; Baron, M.; Sochor, J. The study of antioxidant components in grape seeds. Molecules 2020, 25, 3736. [Google Scholar] [CrossRef] [Scilit] [PubMed]
  58. Fernandes, L.; Casal, S.; Cruz, R.; Pereira, J.A.; Ramalhosa, E. Seed oils of ten traditional Portuguese grape varieties with interesting chemical and antioxidant properties. Food Res. Int. 2013, 50, 161–166. [Google Scholar] [CrossRef] [Scilit]
  59. Hernández, M.L.; Sicardo, M.D.; Belaj, A.; Martínez-Rivas, J.M. The oleic/linoleic acid ratio in olive (Olea europaea L.) fruit mesocarp is mainly controlled by OeFAD2-2 and OeFAD2-5 genes together with the different specificity of extraplastidial acyltransferase enzymes. Front. Plant Sci. 2021, 12, 653997. [Google Scholar] [CrossRef] [Scilit] [PubMed]
  60. Zhou, Y.; Zhao, W.; Lai, Y.; Zhang, B.; Zhang, D. Edible Plant Oil: Global Status, Health Issues, and Perspectives. Front. Plant Sci. 2020, 11, 1315. [Google Scholar] [CrossRef] [Scilit] [PubMed]
  61. Sabir, A.; Unver, A.; Kara, Z. The fatty acid and tocopherol constituents of the seed oil extracted from 21 grape varieties (Vitis spp.). J. Sci. Food Agric. 2012, 92, 1982–1987. [Google Scholar] [CrossRef] [Scilit] [PubMed]
  62. Beveridge, T.H.J.; Girard, B.; Kopp, T.; Drover, J.C.G. Yield and composition of grape seed oils extracted by supercritical carbon dioxide and petroleum ether: Varietal effects. J. Agric. Food Chem. 2005, 53, 1799–1804. [Google Scholar] [CrossRef] [Scilit] [PubMed]
  63. Lachman, J.; Hejtmánková, A.; Táborský, J.; Kotíková, Z.; Pivec, V.; Střalková, R.; Vollmannová, A.; Bojňanská, T.; Dědina, M. Evaluation of oil content and fatty acid composition in the seed of grapevine varieties. LWT-Food Sci. Technol. 2015, 63, 620–625. [Google Scholar] [CrossRef] [Scilit]
  64. Yoo, J.Y.; Shin, D.H.; Min, B.Y. Composition of grape seed oil. Korean J. Food Sci. Technol. 1984, 16, 257–260. [Google Scholar]
  65. Tangolar, S.G.; özoğul, Y.; Tangolar, S.; Torun, A. Evaluation of fatty acid profiles and mineral content of grape seed oil of some grape genotypes. Int. J. Food Sci. Nutr. 2009, 60, 32–39. [Google Scholar] [CrossRef] [Scilit] [PubMed]
  66. Zhao, L.; Yagiz, Y.; Xu, C.; Fang, X.; Marshall, M.R. Identification and characterization of vitamin E isomers, phenolic compounds, fatty acid composition, and antioxidant activity in seed oils from different muscadine grape cultivars. J. Food Biochem. 2017, 41, e12384. [Google Scholar] [CrossRef] [Scilit]
  67. Santos, L.P.; Morais, D.R.; Souza, N.E.; Cottica, S.M.; Boroski, M.; Visentainer, J.V. Phenolic compounds and fatty acids in different parts of Vitis labrusca and V. vinifera grapes. Food Res. Int. 2011, 44, 1414–1418. [Google Scholar] [CrossRef] [Scilit]
  68. Coklar, H. Antioxidant capacity and phenolic profile of berry, seed, and skin of Eksikara (Vitis vinifera L.) grape: Influence of harvest year and altitude. Int. J. Food Prop. 2017, 20, 2071–2087. [Google Scholar] [CrossRef] [Scilit]
  69. Özcan, M.; Al Juhaimi, F.; Gülcü, M.; Uslu, N.; Geçgel, Ü. Determination of bioactive compounds and mineral contents of seedless parts and seeds of grapes. S. Afr. J. Enol. Vitic. 2017, 38, 212–220. [Google Scholar] [CrossRef] [Scilit]
  70. Odabaşioğlu, M.I. Different irrigation strategies affect proximate composition and fatty acid profiles of grape seeds under semi-arid conditions. Turk. J. Agric. For. 2024, 48, 927–946. [Google Scholar] [CrossRef] [Scilit]
  71. Oomah, B.D.; Liang, J.; Godfrey, D.; Mazza, G. Microwave heating of grapeseed: Effect on oil quality. J. Agric. Food Chem. 1998, 46, 4017–4021. [Google Scholar] [CrossRef] [Scilit]
  72. Özkaya, A.; Bakır, C.; Şahin, Y.; Uzun, K. Comparative Evoluation of Fatty Acids of Raisins and Processed Grapes in Adıyaman. Adıyaman Univ. J. Educ. Sci. 2014, 4, 18–26. Available online: https://dergipark.org.tr/en/pub/adyuebd/article/16132 (accessed on 12 August 2026).
  73. Baydar, N.G.; Akkurt, M. Oil content and oil quality properties of some grape seeds. Turk. J. Agric. For. 2001, 25, 163–168. [Google Scholar]
  74. Chen, H.; Kim, H.U.; Weng, H.; Browse, J. Malonyl-CoA synthetase, encoded by ACYL ACTIVATING ENZYME13, is essential for growth and development of Arabidopsis. Plant Cell 2011, 23, 2247–2262. [Google Scholar] [CrossRef] [Scilit] [PubMed]
  75. Chen, G.; Liu, H.; Wei, Q.; Zhao, H.; Liu, J.; Yu, Y. The acyl-activating enzyme PhAAE13 is an alternative enzymatic source of precursors for anthocyanin biosynthesis in petunia flowers. J. Exp. Bot. 2017, 68, 457–467. [Google Scholar] [CrossRef] [Scilit] [PubMed]
  76. Uslu, A.; Dardeniz, A. Determination of fatty acid compositions in the seeds of some grape cultivars. Selcuk. J. Agric. Food Sci. 2009, 23, 13–19. [Google Scholar]
  77. Di Stefano, V.; Bongiorno, D.; Buzzanca, C.; Indelicato, S.; Santini, A.; Lucarini, M.; Fabbrizio, A.; Mauro, M.; Vazzana, M.; Arizza, V.; et al. Fatty Acids and Triacylglycerols Profiles from Sicilian (Cold Pressed vs Soxhlet) Grape Seed Oils. Sustainability 2021, 13, 13038. [Google Scholar] [CrossRef] [Scilit]
  78. Gitea, M.A.; Gitea, D.; Tit, D.M.; Bungau, S.G.; Bogdan, M.A.; Radu, A.-F.; Dulf, F.V.; Pasca, M.B. Organically cultivated vine varieties—Distinctive qualities of the oils obtained from grape seeds. Sustainability 2023, 15, 11037. [Google Scholar] [CrossRef] [Scilit]
  79. Poureshaghi, F.; Eghlima, G.; Khanmohammadi, D.; Esmaeili, H.; Mirjalili, M.H. Variability in seed oil content, fatty acids profile, phytochemical properties, mineral and proximate composition of Iranian cultivars of Vitis vinifera L. Sci. Rep. 2025, 15, 23210. [Google Scholar] [CrossRef] [Scilit] [PubMed]
  80. Karaosmanoğlu, H. Lipid characteristics, bioactive properties, and mineral content in hazelnut grown under different cultivation systems. J. Food Process. Preserv. 2022, 46, e16717. [Google Scholar] [CrossRef] [Scilit]
  81. Pannico, A.; Modarelli, G.C.; Stazi, S.R.; Giaccone, M.; Romano, R.; Rouphael, Y.; Cirillo, C. Foliar nutrition influences yield, nut quality and kernel composition in hazelnut cv Mortarella. Plants 2023, 12, 2219. [Google Scholar] [CrossRef] [Scilit] [PubMed]
  82. García-Martínez, M.D.; Esteve Ciudad, P.; Gómez Tenorio, M.Á.; Raigón Jiménez, M.D. Effect of organic farming techniques on the quality of almond fat. Horticulturae 2025, 11, 135. [Google Scholar] [CrossRef] [Scilit]
  83. Hart, T.L.; Damani, J.J.; DiMattia, Z.S.; Tate, K.E.; Jafari, F.; Petersen, K.S. Dietary polyunsaturated to saturated fatty acid ratio as an indicator for LDL cholesterol response: A systematic review and Meta-Analysis of randomized clinical trials. Adv. Nutr. 2025, 16, 100502. [Google Scholar] [CrossRef] [Scilit] [PubMed]
  84. World Health Organization. Saturated Fatty Acid and Trans-Fatty Acid Intake for Adults and Children: WHO Guideline; WHO: Geneva, Switzerland, 2023; Available online: https://www.who.int/publications/i/item/9789240073630 (accessed on 12 August 2026).
  85. Yağci, A.; Sucu, S.; Elmastaş, M. Fruit quality attributes and fatty acid composition of table and wine grape cultivars. Bilecik Şeyh Edebali Üniv. Bilim. Derg. 2019, 6, 404–414. [Google Scholar] [CrossRef] [Scilit]
  86. MGM. Turkish State Meteorological Service. 2023. Available online: https://www.mgm.gov.tr (accessed on 12 August 2026).
  87. Çiçek, M. Determination of Vineyards by Using Remote Detection Systems in Eğil of Diyarbakir. Master’s Thesis, Bingöl University, Bingöl, Turkey, 2018. (İn Turkish with an abstract in English). [Google Scholar]
  88. Heath, R.L.; Packer, L. Photoperoxidation in isolated chloroplasts: I. Kinetics and stoichiometry of fatty acid peroxidation. Arch. Biochem. Biophys. 1968, 125, 189–198. [Google Scholar] [CrossRef] [Scilit] [PubMed]
  89. Hara, A.; Radin, N.S. Lipid extraction of tissues with a low-toxicity solvent. Anal. Biochem. 1978, 90, 420–426. [Google Scholar] [CrossRef] [Scilit] [PubMed]
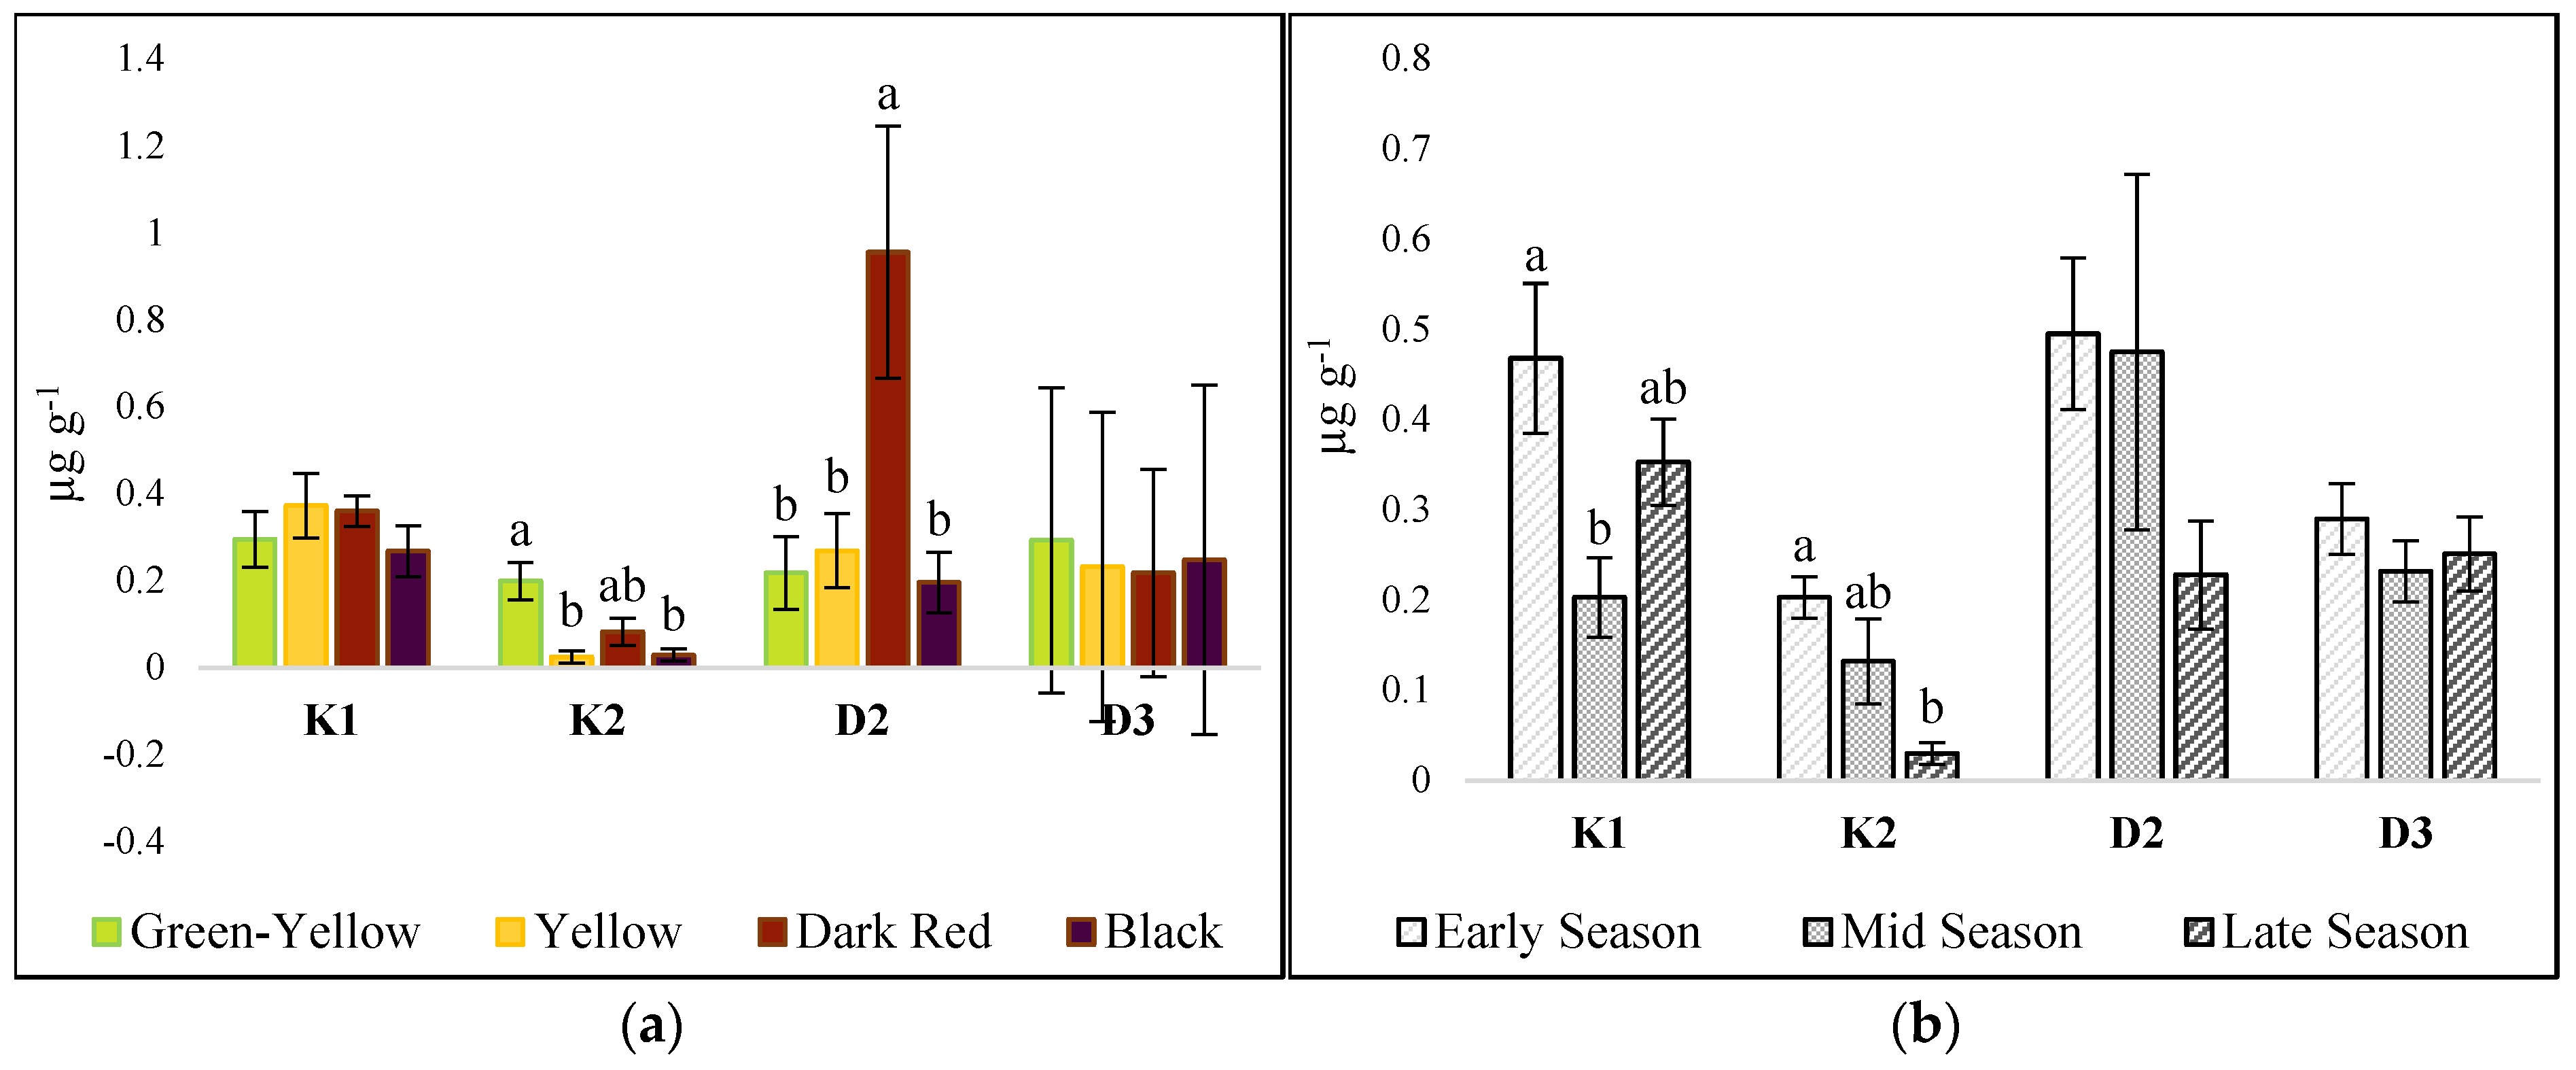
Figure 1. Variation in vitamin K and D content in grape seeds across groups based on berry skin colour (a) and ripening period (b). Different lowercase letters indicate statistically significant differences among groups according to Tukey’s multiple comparison test.
Molecules 31 03168 g001
Figure 2. Variation in tocopherol content in grape seeds across berry skin colour (a) and ripening stage (b) groups. Different lowercase letters indicate statistically significant differences among groups according to Tukey’s multiple comparison test.
Molecules 31 03168 g002
Figure 3. Variation in phytosterols in grape seeds across berry skin colour (a) and ripening stage (b) groups. Different lowercase letters indicate statistically significant differences among groups according to Tukey’s multiple comparison test.
Molecules 31 03168 g003
Figure 4. Variation in MDA content and antioxidant capacity (DPPH) in grape seeds across berry skin colour (a) and ripening stage (b) groups. Different lowercase letters indicate statistically significant differences among groups according to Tukey’s multiple comparison test.
Molecules 31 03168 g004
Figure 5. Variation in the major fatty acid composition of grape seeds across berry skin colour (a) and ripening period (b) groups. Different lowercase letters indicate statistically significant differences among groups according to Tukey’s multiple comparison test.
Molecules 31 03168 g005
Figure 6. Variation in fatty acid saturation in grape seeds across berry skin colour (a) and ripening stage (b) groups. Different lowercase letters indicate statistically significant differences among groups according to Tukey’s multiple comparison test.
Molecules 31 03168 g006
Figure 7. Pearson’s correlation coefficients of phytochemical compounds found in grape seeds.
Molecules 31 03168 g007
Figure 8. Principal component analysis (PCA) score plot of grape varieties based on standardized phytochemical variables measured in seeds. PC1 and PC2 explained 29.9% and 15.8% of the total variance, respectively. Samples were coloured according to berry skin colour groups.
Molecules 31 03168 g008
Table 1. Vitamin K and D contents in the seeds of grape varieties. Data are shown as means ± SEM.
VarietyK1 (µg g−1)K2 (µg g−1)D2 (µg g−1)D3 (µg g−1)
Boğazkere0.503 ± 0.009 d *0.000 ± 0.000 f *0.000 ± 0.000 j *0.503 ± 0.009 b *
Siyahi0.143 ± 0.003 l0.000 ± 0.000 f0.460 ± 0.006 d0.053 ± 0.003 h
Şarabi0.157 ± 0.003 kl0.087 ± 0.003 e0.127 ± 0.003 h0.187 ± 0.003 f
Tahannebi0.653 ± 0.003 b0.253 ± 0.009 b0.683 ± 0.007 c0.377 ± 0.003 c
Hasani0.207 ± 0.003 hi0.000 ± 0.000 f0.033 ± 0.003 i0.283 ± 0.003 d
Hatun Parmağı0.107 ± 0.003 m0.387 ± 0.003 a0.153 ± 0.003 g0.357 ± 0.003 c
Mazrone0.213 ± 0.003 h0.157 ± 0.003 c0.000 ± 0.000 j0.157 ± 0.003 g
Çirbeyt (V1)0.253 ± 0.003 g0.000 ± 0.000 f0.833 ± 0.009 b0.153 ± 0.003 g
Çirbeyt (V2)0.533 ± 0.003 c0.000 ± 0.000 f0.000 ± 0.000 j0.577 ± 0.003 a
Çirbeyt (V3)0.183 ± 0.003 ij0.000 ± 0.000 f0.403 ± 0.003 e0.000 ± 0.000 i
Şitu0.833 ± 0.003 a0.000 ± 0.000 f0.000 ± 0.000 j0.377 ± 0.003 c
Habo0.063 ± 0.003 n0.127 ± 0.003 d0.110 ± 0.006 h0.053 ± 0.003 h
Mikeri0.283 ± 0.003 f0.153 ± 0.003 c0.307 ± 0.003 f0.203 ± 0.003 f
Asuri0.437 ± 0.009 e0.013 ± 0.003 f1.603 ± 0.003 a0.233 ± 0.009 e
Utilization Type
Table0.383 ± 0.069 Ns0.130 ± 0.036 Ns0.431 ± 0.139 Ns0.280 ± 0.028 Ns
Wine0.307 ± 0.0370.041 ± 0.0150.227 ± 0.0740.263 ± 0.050
Raisin0.213 ± 0.0310.077 ± 0.0340.383 ± 0.0340.128 ± 0.034
There are statistically significant differences between the mean values indicated by different letters (*: p < 0.01). Ns: non-significant.
Table 2. Tocopherol contents in grape seeds. Data are shown as means ± SEM.
Varietyδ-Tocopherol
(mg kg−1)
α-Tocopherol
(mg kg−1)
Boğazkere0.030 ± 0.006 i *2.153 ± 0.009 L *
Siyahi0.577 ± 0.009 d1.597 ± 0.003 o
Şarabi0.640 ± 0.006 c2.643 ± 0.003 g
Tahannebi0.360 ± 0.006 g4.653 ± 0.015 b
Hasani0.463 ± 0.003 e3.403 ± 0.003 d
Hatun Parmağı0.710 ± 0.006 b3.557 ± 0.003 c
Mazrone0.357 ± 0.003 g2.357 ± 0.009 i
Çirbeyt (V1)0.543 ± 0.009 d2.740 ± 0.006 f
Çirbeyt (V2)1.027 ± 0.003 a2.237 ± 0.003 j
Çirbeyt (V3)0.407 ± 0.007 f2.023 ± 0.007 m
Şitu0.733 ± 0.003 b4.703 ± 0.003 a
Habo0.320 ± 0.006 h1.887 ± 0.003 n
Mikeri0.477 ± 0.003 e2.420 ± 0.006 h
Asuri0.443 ± 0.009 e2.757 ± 0.003 e
Utilization Type
Table0.505 ± 0.039 Ns3.493 ± 0.241 Ns
Wine0.501 ± 0.0732.359 ± 0.062
Raisin0.527 ± 0.0232.342 ± 0.035
There are statistically significant differences between the mean values indicated by different letters (*: p < 0.01). Ns: non-significant.
Table 3. Phytosterol contents in the seeds of grape varieties. Data are shown as means ± SEM.
VarietyStigmasterol
(µg g−1)
β-Sitosterol
(µg g−1)
Ergosterol
(µg g−1)
Boğazkere873.33 ± 0.507 b *1359.00 ± 0.144 g *385.17 ± 0.300 a *
Siyahi716.50 ± 0.144 c1779.75 ± 0.144 b121.92 ± 8.168 c
Şarabi491.17 ± 0.083 l1472.17 ± 0.083 e7.17 ± 0.083 gh
Tahannebi2394.58 ± 0.083 a3340.42 ± 0.300 a9.42 ± 0.220 fgh
Hasani558.50 ± 0.144 h1401.08 ± 0.083 f16.92 ± 0.083 fg
Hatun Parmağı582.58 ± 0.083 g1253.42 ± 0.083 j21.92 ± 0.083 f
Mazrone352.67 ± 0.083 n915.67 ± 0.083 n0.00 ± 0.000 h
Çirbeyt (V1)502.75 ± 0.144 k1640.33 ± 0.220 c110.25 ± 0.144 c
Çirbeyt (V2)602.08 ± 0.083 f1351.42 ± 0.083 h40.08 ± 0.083 d
Çirbeyt (V3)522.75 ± 0.144 j1296.33 ± 0.083 i38.50 ± 0.144 d
Şitu626.42 ± 0.083 e1573.92 ± 0.083 d238.75 ± 0.144 b
Habo527.83 ± 0.220 i957.67 ± 0.083 m250.67 ± 0.083 b
Mikeri408.33 ± 0.083 m1058.83 ± 0.083 l22.58 ± 0.083 f
Asuri650.33 ± 0.220 d1243.42 ± 0.083 k1.25 ± 0.144 h
Utilization Type
Table890.04 ±163.49 Ns1628.32 ± 191.08 Ns89.82 ± 26.62 Ns
Wine557.46 ± 38.641339.15 ± 53.3396.86 ± 32.44
Raisin562.42 ± 68.911419.29 ± 161.2072.25 ± 22.51
There are statistically significant differences between the mean values indicated by different letters (*: p < 0.01). Ns: non-significant.
Table 4. MDA content and antioxidant capacity (DPPH) in the seeds of grape varieties. Data are shown as means ± SEM.
VarietyMDA
(nmol g−1)
DPPH
(%)
Boğazkere248.33 ± 0.33 b *94.880 ± 0.003 d *
Siyahi52.02 ± 0.01 f95.067 ± 0.007 c
Şarabi110.02 ± 0.01 d93.600 ± 0.003 h
Tahannebi314.50 ± 0.01 a96.890 ± 0.003 a
Hasani34.51 ± 0.01 l94.702 ± 0.007 e
Hatun Parmağı40.51 ± 0.01 k94.515 ± 0.006 f
Mazrone49.51 ± 0.01 g92.505 ± 0.003 k
Çirbeyt (V1)112.84 ± 0.67 c93.235 ± 0.003 j
Çirbeyt (V2)59.02 ± 0.01 e95.245 ± 0.003 b
Çirbeyt (V3)43.01 ± 0.01 j91.412 ± 0.007 m
Şitu58.51 ± 0.01 e93.422 ± 0.002 i
Habo35.50 ± 0.01 l93.967 ± 0.004 g
Mikeri44.50 ± 0.01 i94.517 ± 0.004 f
Asuri46.02 ± 0.01 h92.145 ± 0.010 l
Utilization Type
Table88.26 ± 24.62 Ns94.28 ± 0.35 Ns
Wine103.79 ± 17.0593.48 ± 0.32
Raisin48.26 ± 1.6894.79 ± 0.13
There is a statistically significant difference between the mean values indicated by different letters (*: p < 0.01). Ns: non-significant.
Table 5. Major fatty acid composition of grape seed oils (%). Data are shown as means ± SEM.
VarietyPalmitic Acid
(C16:0)
Stearic Acid
(C18:0)
Oleic Acid
(C18:1c (n-9))
Linoleic Acid
(C18:2c (n-6))
Boğazkere7.90 ± 0.06 bc *6.28 ± 0.09 a *22.84 ± 1.17 bcd *56.96 ± 1.10 b–e *
Siyahi8.56 ± 0.25 abc4.84 ± 0.22 bcde26.52 ± 0.57 ab53.68 ± 1.15 e
Şarabi7.47 ± 0.39 c4.65 ± 0.28 b–f26.08 ± 0.72 ab55.18 ± 1.05 cde
Tahannebi8.88 ± 0.16 abc6.05 ± 0.11 ab13.80 ± 0.92 g66.73 ± 1.29 a
Hasani9.17 ± 0.34 abc4.84 ± 0.31 b–e23.70 ± 0.40 abc56.07 ± 1.17 b–e
Hatun Parmağı8.43 ± 0.39 abc3.82 ± 0.16 ef27.32 ± 0.70 a54.02 ± 1.15 de
Mazrone8.89 ± 0.40 abc3.38 ± 0.17 f14.73 ± 0.63 fg67.06 ± 1.16 a
Çirbeyt (V1)8.76 ± 0.23 abc5.35 ± 0.29 a–d18.70 ± 0.48 def61.32 ± 0.90 abc
Çirbeyt (V2)8.17 ± 0.25 abc5.08 ± 0.17 a–e19.45 ± 0.68 cde61.10 ± 1.09 abc
Çirbeyt (V3)7.89 ± 0.35 bc4.87 ± 0.34 a–e18.45 ± 0.49 ef62.76 ± 1.23 ab
Şitu10.10 ± 0.37 a4.55 ± 0.29 c–f16.69 ± 0.66 efg62.71 ± 1.19 ab
Habo9.60 ± 0.38 ab4.80 ± 0.18 b–e20.54 ± 0.70 cde58.27 ± 1.25 b–e
Mikeri8.01 ± 0.36 bc4.03 ± 0.10 def20.29 ± 0.69 cde60.78 ± 1.09 a–d
Asuri8.42 ± 0.53 abc5.60 ± 0.29 abc22.83 ± 0.55 bcd57.06 ± 1.18 b–e
Utilization Type
Table9.10 ± 0.20 a **4.94 ± 0.19 Ns20.81 ± 1.11 Ns59.14 ± 1.12 Ns
Wine8.18 ± 0.16 b4.93 ± 0.2320.04 ± 0.9160.73 ± 1.01
Raisin8.28 ± 0.23 b4.43 ± 0.2123.40 ± 1.4557.23 ± 1.74
There are statistically significant differences between the mean values indicated by different letters (*: p < 0.01; **: p < 0.05). Ns: non-significant.
Table 6. Composition of minor and essential fatty acids in grape seed oils (%) Data are shown as means ± SEM.
VarietyPalmitoleic Acid
(C16:1)
Trans-Elaidic Acid
(C18:1t (n-9))
Linolenic Acid
(C18:3 (n-6))
Myristic Acid
(C14:0)
Pentadecanoic Acid
(C15:0)
α-Linolenic Acid
(C18:3 (n-3))
Boğazkere0.51 ± 0.02 Ns1.36 ± 0.21 abc *0.37 ± 0.09 Ns0.20 ± 0.01 a *0.08 ± 0.00 a *0.09 ± 0.01 a *
Siyahi0.70 ± 0.061.68 ± 0.06 ab0.36 ± 0.010.17 ± 0.01 ab0.06 ± 0.00 a0.10 ± 0.00 a
Şarabi0.63 ± 0.051.71 ± 0.23 ab0.42 ± 0.120.16 ± 0.02 ab0.05 ± 0.01 a0.11 ± 0.02 a
Tahannebi0.53 ± 0.080.00 ± 0.00 d0.34 ± 0.020.18 ± 0.03 ab0.07 ± 0.02 a0.10 ± 0.01 a
Hasani0.73 ± 0.061.43 ± 0.13 abc0.41 ± 0.050.17 ± 0.03 ab0.06 ± 0.01 a0.10 ± 0.01 a
Hatun Parmağı0.76 ± 0.071.84 ± 0.12 a0.26 ± 0.030.03 ± 0.00 c0.05 ± 0.01 a0.00 ± 0.00 b
Mazrone0.71 ± 0.060.85 ± 0.06 c0.34 ± 0.020.16 ± 0.03 ab0.05 ± 0.01 a0.06 ± 0.01 ab
Çirbeyt (V1)0.67 ± 0.071.16 ± 0.09 abc0.27 ± 0.050.12 ± 0.01 abc0.00 ± 0.00 b0.08 ± 0.02 a
Çirbeyt (V2)0.66 ± 0.101.24 ± 0.11 abc0.25 ± 0.020.14 ± 0.01 abc0.04 ± 0.01 ab0.08 ± 0.01 a
Çirbeyt (V3)0.60 ± 0.061.15 ± 0.03 abc0.24 ± 0.010.14 ± 0.02 ab0.03 ± 0.00 ab0.08 ± 0.01 a
Şitu0.76 ± 0.100.99 ± 0.14 bc0.35 ± 0.080.16 ± 0.03 ab0.06 ± 0.01 a0.08 ± 0.02 a
Habo0.88 ± 0.071.41 ± 0.13 abc0.32 ± 0.030.17 ± 0.00 ab0.06 ± 0.01 a0.09 ± 0.01 a
Mikeri0.68 ± 0.091.41 ± 0.11 abc0.31 ± 0.060.23 ± 0.01 a0.04 ± 0.01 ab0.09 ± 0.01 a
Asuri0.66 ± 0.091.43 ± 0.22 abc0.27 ± 0.030.08 ± 0.01 bc0.04 ± 0.01 ab0.10 ± 0.01 a
Utilization Type
Table0.72 ± 0.04 Ns1.19 ± 0.15 Ns0.32 ± 0.02 Ns0.13 ± 0.02 b *0.06 ± 0.00 Ns0.08 ± 0.01 Ns
Wine0.63 ± 0.031.24 ± 0.080.31 ± 0.030.15 ± 0.01 ab0.04 ± 0.010.08 ± 0.01
Raisin0.69 ± 0.051.55 ± 0.080.33 ± 0.030.20 ± 0.02 a0.05 ± 0.010.10 ± 0.01
Skin Colour
Green-Yellow0.68 ± 0.04 Ns1.03 ± 0.21 Ns0.34 ± 0.02 Ns0.14 ± 0.02 Ns0.06 ± 0.00 ab **0.06 ± 0.01 Ns
Yellow0.71 ± 0.041.19 ± 0.050.28 ± 0.020.15 ± 0.010.04 ± 0.01 b0.08 ± 0.01
Dark-Red0.67 ± 0.051.42 ± 0.110.29 ± 0.030.16 ± 0.030.04 ± 0.00 b0.09 ± 0.01
Black0.62 ± 0.041.58 ± 0.110.38 ± 0.040.18 ± 0.010.06 ± 0.01 a0.10 ± 0.01
Ripening Season
Early Season0.60 ± 0.06 b **0.71 ± 0.32 b *0.32 ± 0.03 Ns0.21 ± 0.02 a *0.05 ± 0.01 Ns0.09 ± 0.01 Ns
Mid Season0.76 ± 0.04 a1.53 ± 0.08 a0.32 ± 0.020.11 ± 0.02 b0.05 ± 0.000.07 ± 0.01
Late Season0.66 ± 0.03 ab1.27 ± 0.07 a0.32 ± 0.020.16 ± 0.01 ab0.05 ± 0.010.08 ± 0.00
There are statistically significant differences between mean values denoted by different letters (*: p < 0.01; **: p < 0.05). Ns: non-significant.
Table 7. SFA, MUFA, and PUFA compositions and PUFA/SFA ratio in grape seed oils. Data are shown as means ± SEM.
Variety∑SFA∑MUFA∑PUFAPUFA/SFA
Boğazkere14.46 ± 0.33 ab *24.70 ± 0.88 c–f *57.42 ± 1.00 cde *3.97 ± 0.00 b–e *
Siyahi13.63 ± 0.33 ab28.90 ± 0.58 ab54.13 ± 1.14 e3.99 ± 0.00 e
Şarabi12.33 ± 0.58 b28.42 ± 0.58 abc55.71 ± 1.19 de4.56 ± 0.33 cde
Tahannebi15.18 ± 0.33 a14.33 ± 0.88 k67.17 ± 1.26 ab4.43 ± 0.33 b
Hasani14.23 ± 0.58 ab25.87 ± 0.58 a–d56.59 ± 1.21 de4.00 ± 0.00 b–e
Hatun Parmağı12.33 ± 0.58 b29.91 ± 0.58 a54.28 ± 1.18 e4.43 ± 0.33 de
Mazrone12.48 ± 0.33 ab16.29 ± 0.58 jk67.46 ± 1.17 a5.44 ± 0.33 a
Çirbeyt (V1)14.24 ± 0.58 ab20.52 ± 0.33 fgi61.67 ± 0.97 a–d4.35 ± 0.33 abc
Çirbeyt (V2)13.43 ± 0.33 ab21.35 ± 0.88 e–i61.43 ± 1.10 a–d4.59 ± 0.33 a-d
Çirbeyt (V3)12.94 ± 0.58 ab20.20 ± 0.58 gij63.09 ± 1.25 abc4.92 ± 0.58 ab
Şitu14.87 ± 0.58 ab18.45 ± 0.88 ijk63.13 ± 1.25 abc4.27 ± 0.33 ab
Habo14.62 ± 0.58 ab22.83 ± 0.58 d–g58.67 ± 1.22 cde4.03 ± 0.00 b–e
Mikeri12.31 ± 0.58 b22.38 ± 0.88 d–i61.18 ± 1.15 b–d4.99 ± 0.00 a–e
Asuri14.14 ± 0.88 ab24.92 ± 0.58 b–e57.42 ± 1.22 cde4.10 ± 0.33 b–e
Utilization Type
Table14.23 ± 0.30 a **22.72 ± 1.25 Ns59.54 ± 1.13 Ns4.21 ± 0.10 Ns
Wine13.31 ± 0.27 ab21.91 ± 0.9561.13 ± 1.004.64 ± 0.15
Raisin12.97 ± 0.42 b25.64 ± 1.5257.66 ± 1.734.49 ± 0.28
There are statistically significant differences between the mean values indicated by different letters (*: p < 0.01; **: p < 0.05). Ns: non-significant.
Table 8. Some ampelographic characteristics of the grape varieties examined.
VarietySkin ColourUtilization TypeFlowerSeed CountRipening Season
TahannebiGreen-YellowTablePistillate1-2Early Season
HasaniGreen-YellowTableHermaphrodite2-3Mid Season
Hatun ParmağıGreen-YellowTableHermaphrodite2-4Mid Season
MazroneGreen-YellowWine-MustHermaphrodite2-3Late Season
ÇirbeytYellowWine-MustHermaphrodite2-3Late Season
ŞituYellowTableHermaphrodite2-3Late Season
HaboYellowTableHermaphrodite1-3Mid Season
MikeriDark Red-PurpleRaisinHermaphrodite2-3Early Season
AsuriDark Red-BlackTableHermaphrodite2-3Mid Season
BoğazkereBlackWine-MustHermaphrodite2-3Late Season
SiyahiBlackRaisinHermaphrodite2-3Late Season
ŞarabiBlackWine-MustHermaphrodite2-3Late Season
Disclaimer/Publisher’s Note: The statements, opinions and data contained in all publications are solely those of the individual author(s) and contributor(s) and not of MDPI and/or the editor(s). MDPI and/or the editor(s) disclaim responsibility for any injury to people or property resulting from any ideas, methods, instructions or products referred to in the content.