Article

Dy3+ and Mn4+ Ions Co-Doped Stannate Phosphors for Applications in Dual-Mode Optical Thermometry

College of Physics and Electronic Engineering, Qilu Normal University, Jinan 250200, China
*
Author to whom correspondence should be addressed.
Molecules 2025, 30(7), 1569; https://doi.org/10.3390/molecules30071569
Submission received: 25 February 2025 / Revised: 25 March 2025 / Accepted: 26 March 2025 / Published: 31 March 2025
(This article belongs to the Special Issue Organic and Inorganic Luminescent Materials, 2nd Edition)

Abstract

In order to break through the limitations of the application of traditional temperature measurement technology, non-contact optical temperature sensing material with good sensitivity is one of the current research hotspots. Herein, a series of Dy3+ and Mn4+ co-doping Mg3Ga2SnO8 fluorescent materials were prepared successfully, and the crystal structure, phase purity, and morphology of the synthesized phosphors were comprehensively investigated, as well as their photoluminescence properties, energy transfer, and high-temperature thermal stability. The two pairs of independent thermally coupled energy levels of Dy3+ ions and Mn4+ ions in Mg3Ga2SnO8 are utilized to realize the dual-mode optical temperature detection with excellent performance. On the one hand, based on the different ionic energy level transitions of 4F9/26H13/2 and 2Eg4A2g responding differently to temperature, two emission bands of 577 nm and 668 nm were chosen to construct the fluorescence intensity ratio thermometry, and the maximum sensitivity of 1.82 %K−1 was achieved at 473 K. On the other hand, based on the strong temperature dependence of the lifetime of Mn4+ in Mg3Ga2SnO8:0.06Dy3+,0.009Mn4+, fluorescence lifetime thermometry was constructed and a maximum sensitivity of 2.75 %K−1 was achieved at 473 K. Finally, the Mg3Ga2SnO8: 0.06Dy3+,0.009Mn4+ sample realizes dual-mode optical temperature measurement with high sensitivity and a wide temperature detection range, indicating that the sample has promising applications in optical temperature measurement.

Graphical Abstract

1. Introduction

In chemistry, physics, and life movement, temperature is one of the most important parameters to determine the state of matter. Accurate measurement and precise control of temperature is of great significance in people’s daily life, industrial and agricultural production, and scientific research [1,2]. Traditional contact thermometers have been widely used in many areas, but slow response time and poor ability to adapt to complex environments are the main obstacles limiting their application. In recent years, non-contact optical thermometers are getting more and more attention because they not only avoid the above problems to a large extent but also have a strong anti-interference ability and high signal resolution [3,4]. The modes of non-contact optical temperature sensors mainly include the fluorescence intensity, fluorescence intensity ratio (FIR), peak position, fluorescence lifetime (FL), and emission diffusion [5]. These modes all utilize the characteristics of the optical parameters in the luminescent material that change with temperature to establish the relationship between temperature and these parameters and then obtain the temperature of the object under test. The technique has shown great potential for use in various applications, such as temperature mapping of living cells, microelectronics, and micro-optics, owing to its fast response, high sensitivity, and high spatial resolution [6,7].
Currently, the most widely studied fluorescence temperature sensors are mainly realized by energy transfer between thermally coupled energy level pairs of rare earth ions. The energy gap between these thermally coupled energy level pairs must be less than 2000 cm−1 [8]. An excessively large energy level gap hinders the thermal population of electrons from lower to higher energy levels, preventing effective thermal coupling. Consequently, the temperature sensitivity of such sensors cannot exceed 2878/T2, resulting in relatively low sensitivity for this class of fluorescent temperature sensors [9]. In addition, the narrow energy difference between thermally coupled energy level pairs leads to the overlap of the two monitored emission peaks, which results in poor signal differentiation. The above constraints have seriously hindered the further development of thermally coupled energy level pair-type fluorescence temperature sensors [10]. Researchers have obtained an optical temperature sensor with high sensitivity by studying the emission strategies of different luminescent centers, thus effectively solving the problem of low sensitivity of fluorescent temperature sensors. For example, Zheng et al. designed a temperature sensing material system with SrB4O7:Eu2+/Sm2+, which utilized the broadband emission of Eu2+ and the 5D07F0 emission of Sm2+ to obtain ultrahigh temperature sensitivity [11]. Wei et al. investigated the luminescence excellence and high temperature sensitivity of Na5Y9F32:Ho3+/Yb3+/Eu3+ [12]. The double emission of Bi3+/Eu3+ was constructed in Ca2Sb2O7, and the difference in the thermal quenching properties of Bi3+/Eu3+ and the efficient energy transfer process between them were utilized to achieve highly sensitive temperature detection [13]. Although these materials achieve relatively good temperature sensing characteristics, the relative sensitivity needs to be further improved.
Mg3Ga2SnO8 (MGS) matrix materials with a cubic structure were first reported by Zhu et al. They constructed MGS substrates based on Mg2TiO4 through a co-substitution strategy of [Ga3+-Ga3+] instead of [Mg2+-Ti4+] and Sn4+ instead of Ti4+. The results show that the MGS matrix material has stable physicochemical properties and low phonon energy [14]. Therefore, the study of Dy3+ and Mn4+ co-doped MGS phosphors for optical temperature measurement has attracted our attention. In this work, the novel Dy3+ and Mn4+ co-doped MGS phosphors were synthesized in this work. This study primarily investigated the crystal structure, luminescence characteristics, and variable-temperature emission spectra of the phosphors, while analyzing the energy transfer phenomenon between Dy3+ and Mn4+. Furthermore, based on the distinct thermal quenching properties of the two dopants, we designed two different temperature measurement modes utilizing FIR and FL, achieving relative sensitivities of 1.82 %K−1 and 2.75 %K−1, respectively.

2. Results and Discussion

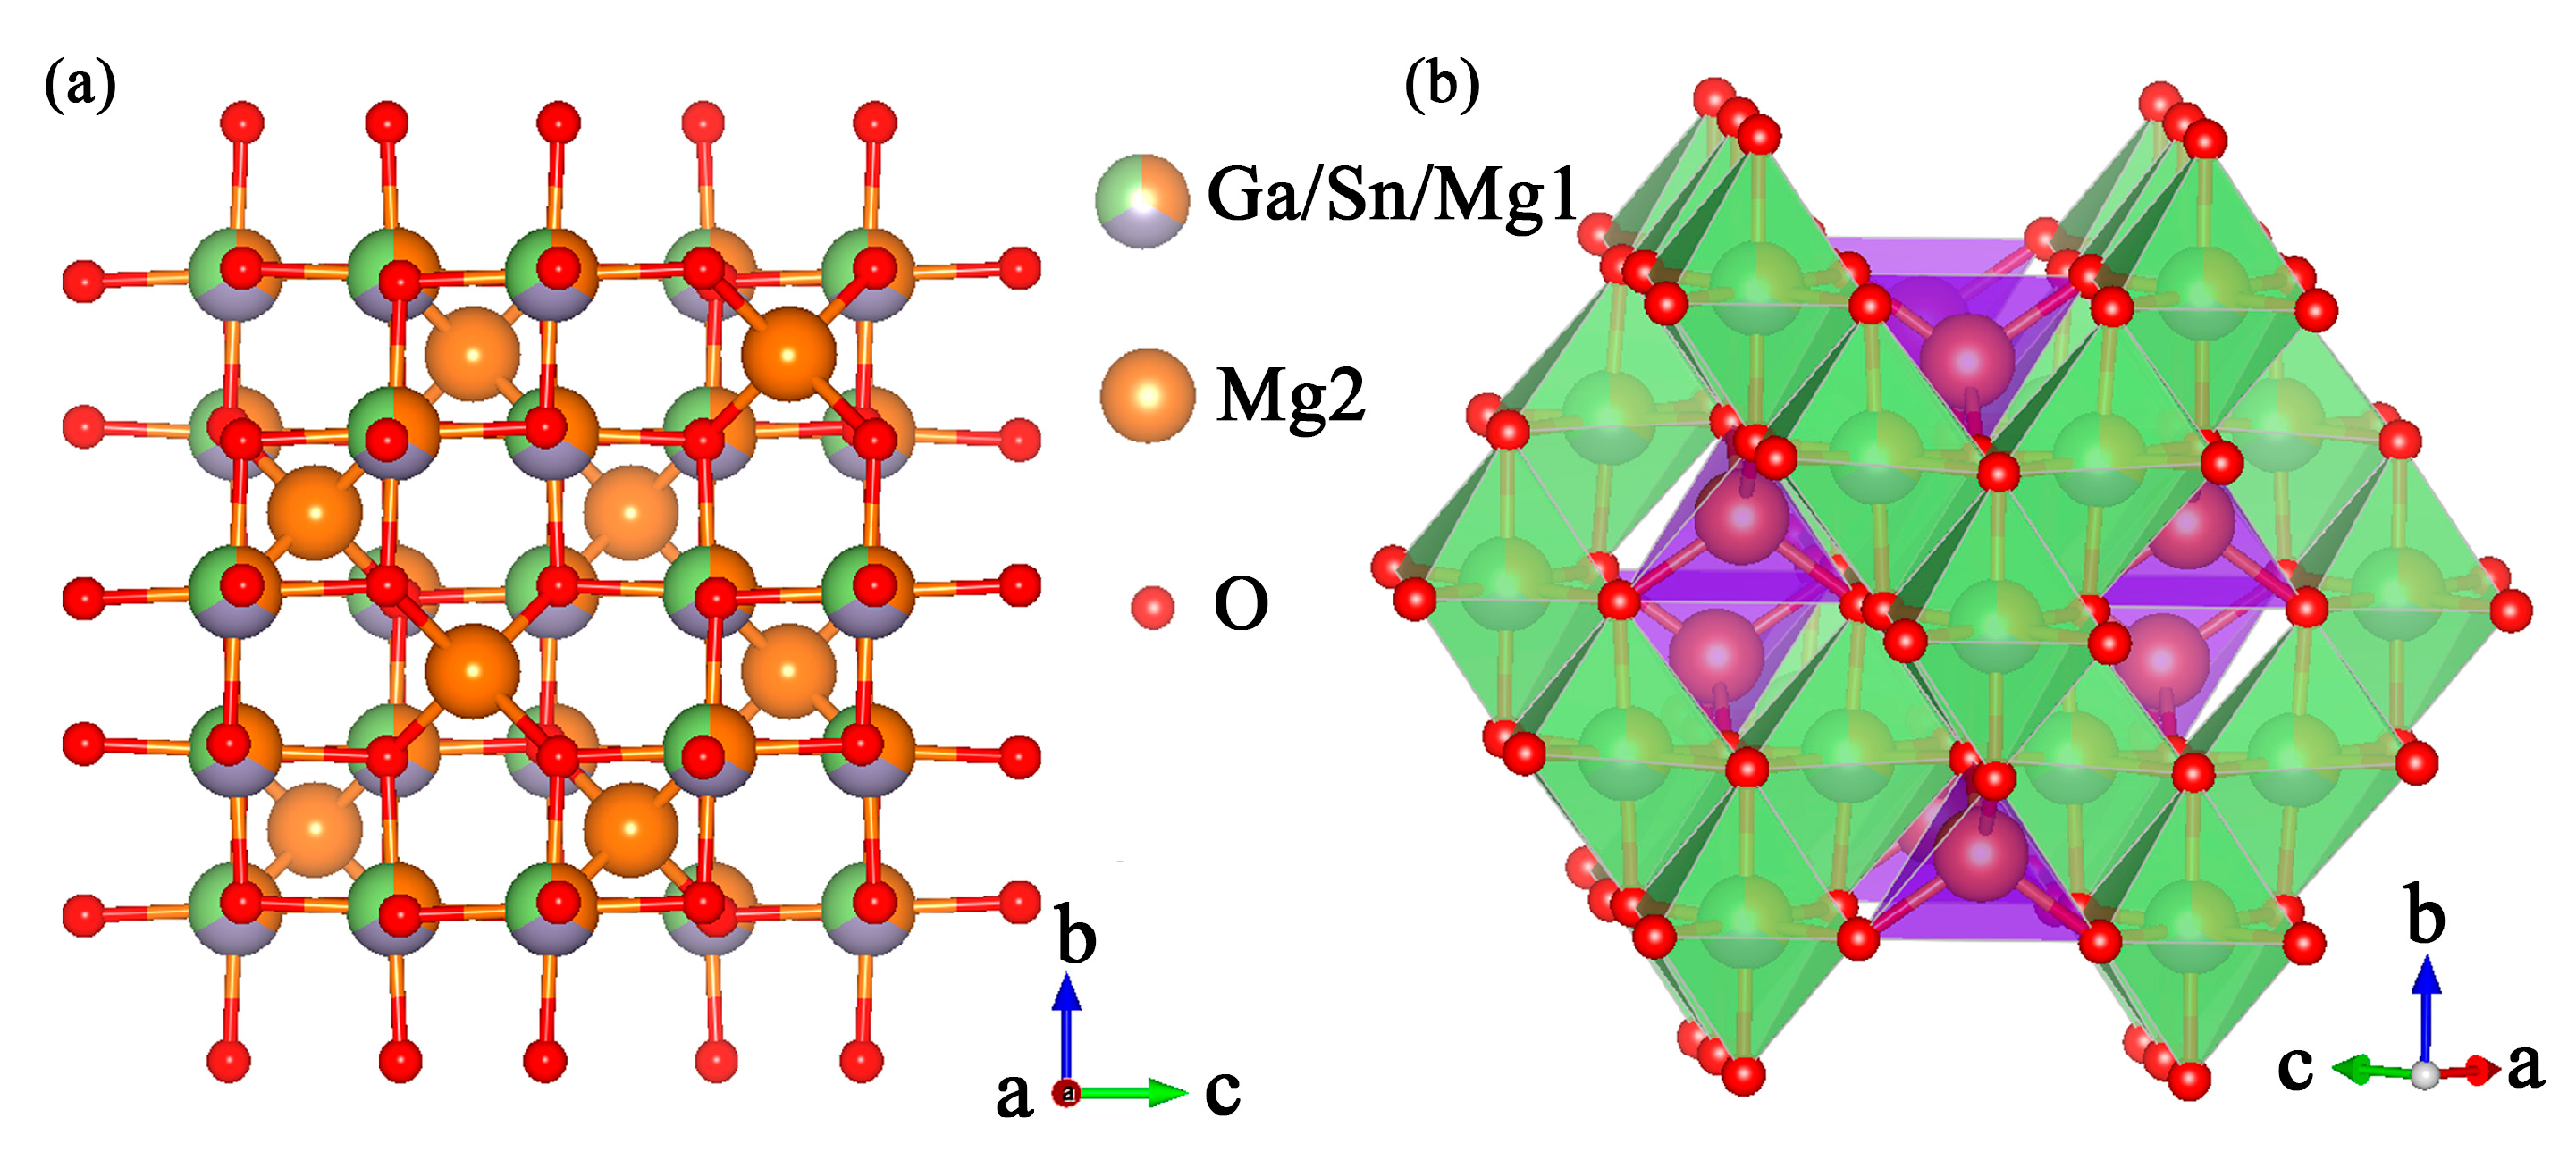
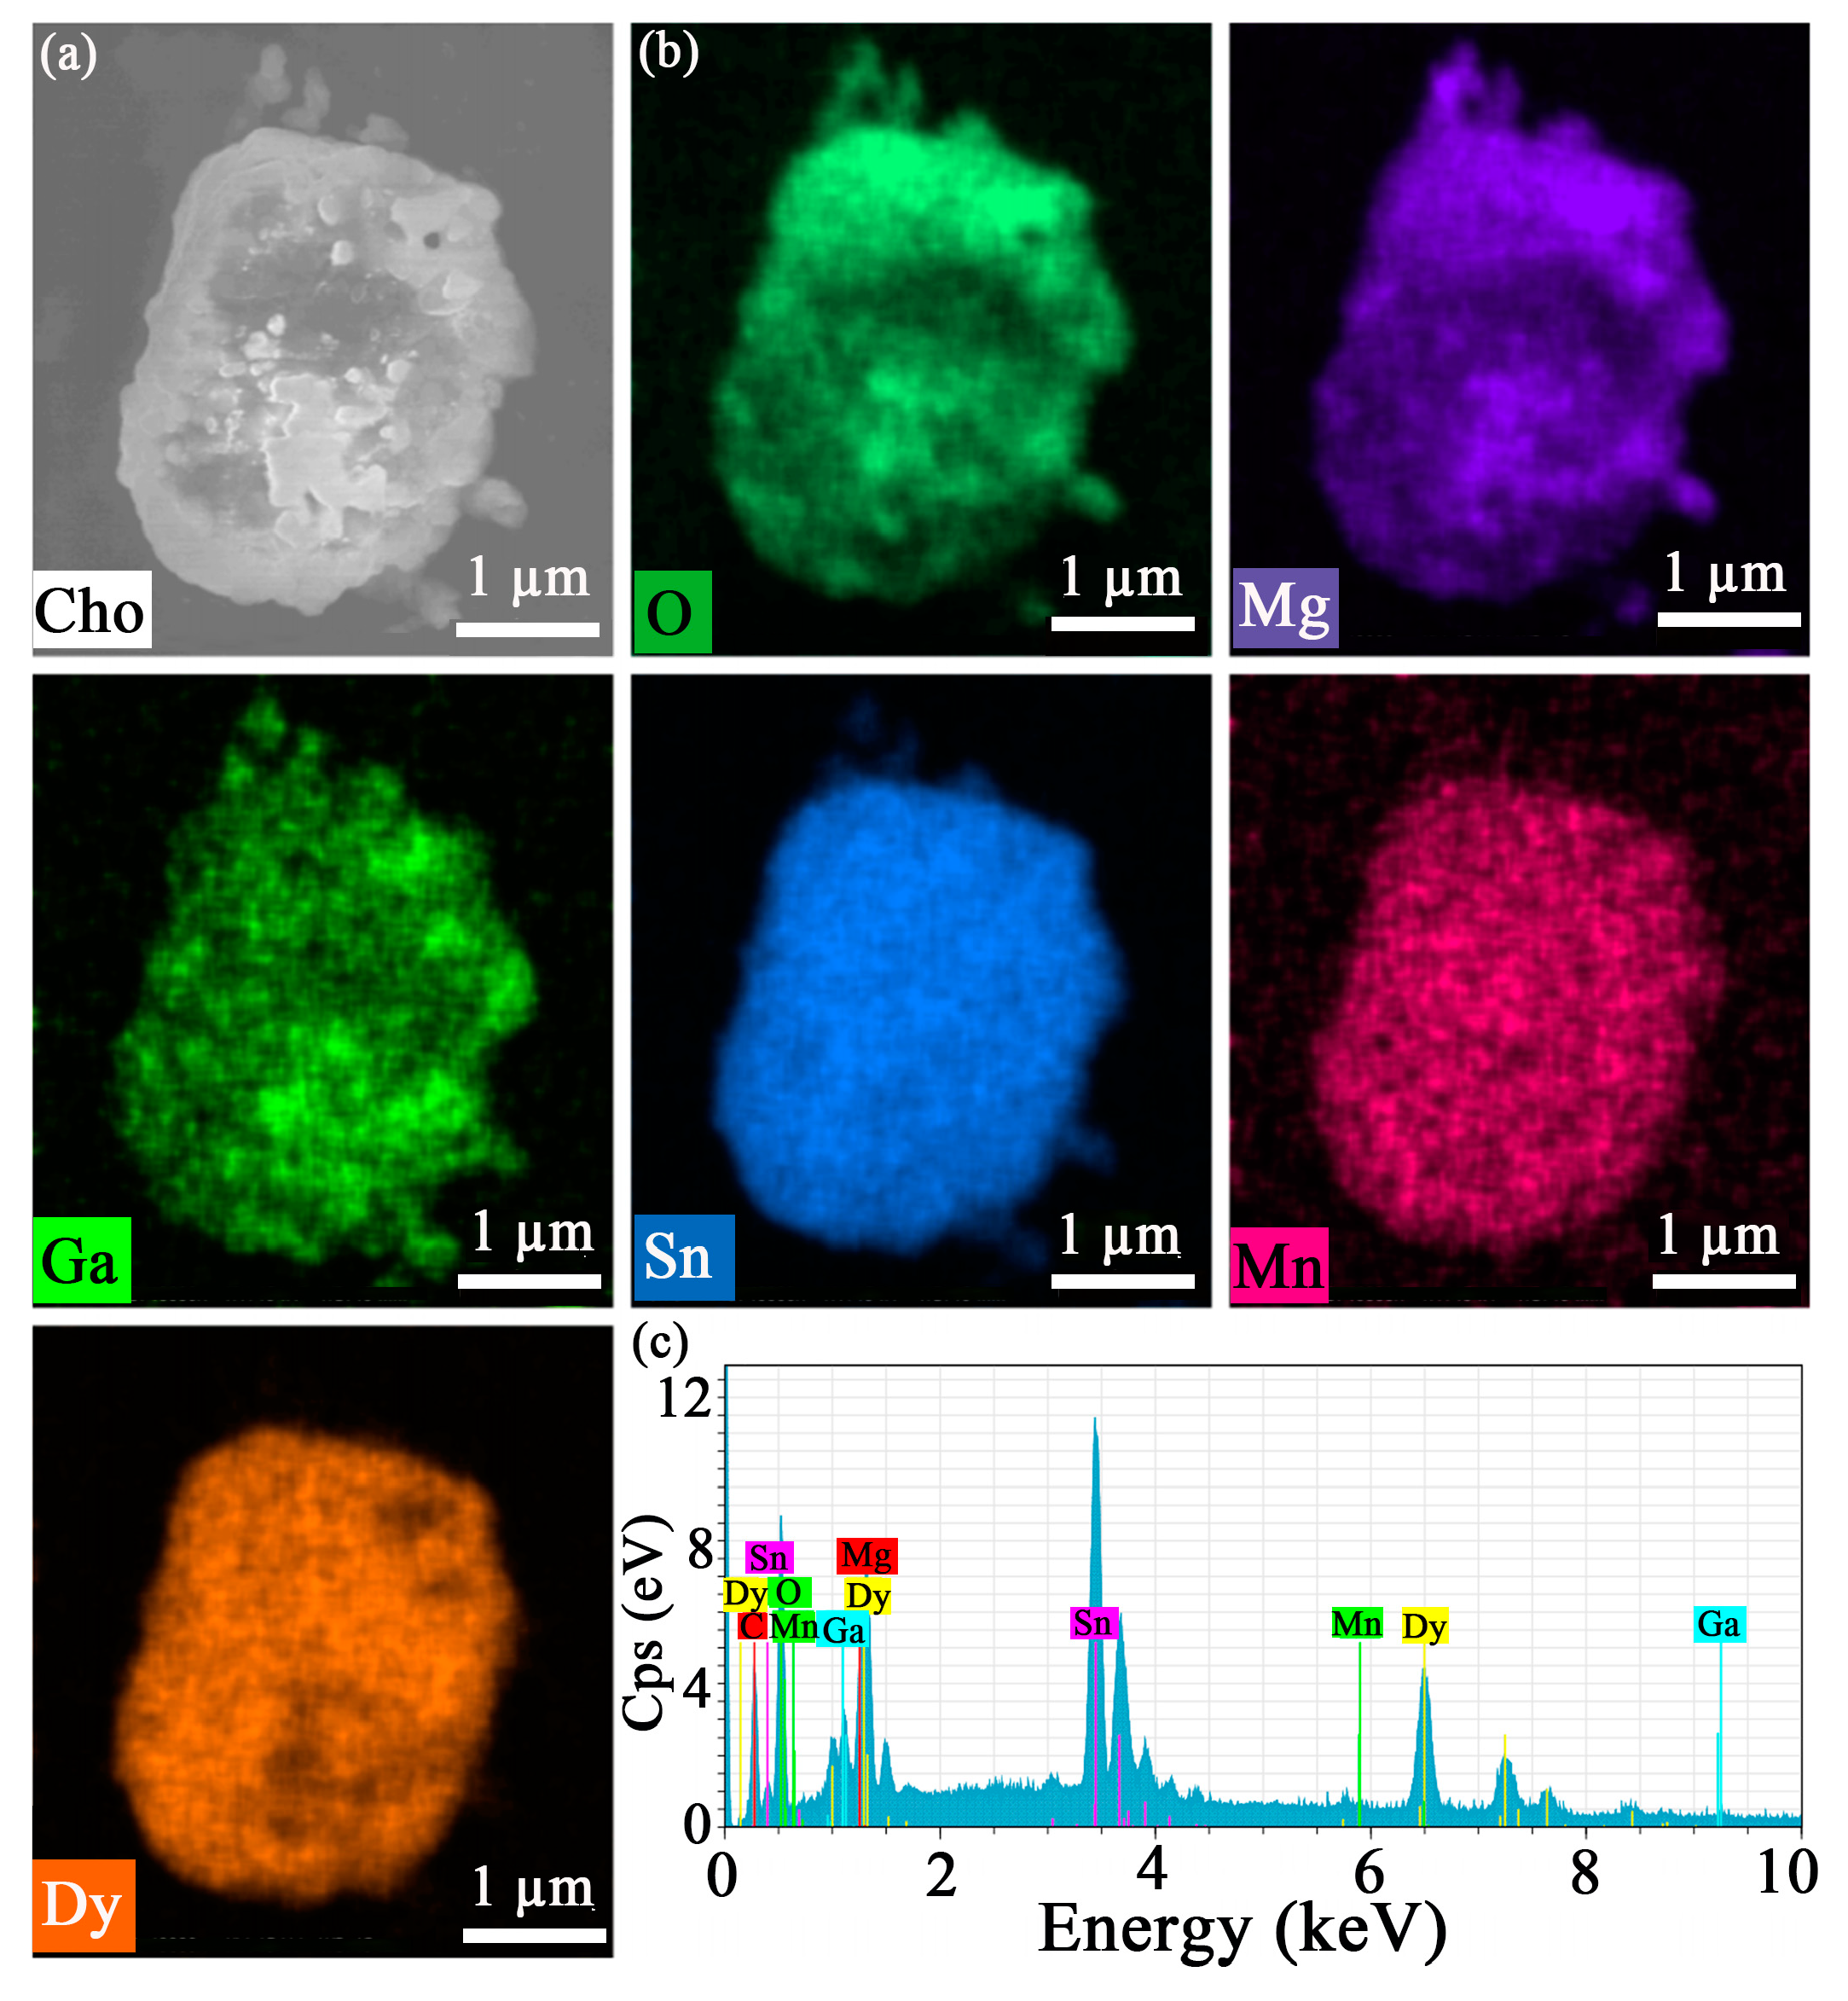
2.1. Crystal Structure

Figure 1a shows the crystal structure of MGS, which is a cubic structure with a Fd-3m space group [15]. It can be seen that there are two different ionic occupancies for the Mg ions. Interestingly, three different Ga3+, Sn4+, and Mg2+ ions occupy the same sites in this cubic crystal structure. As shown in Figure 1b, the Mg(1)2+, Sn4+, Ga3+, and six O2− are adjacent, forming an irregular octahedron, and one Mg(2)2+ and four O2− are adjacent, forming a regular tetrahedron. The [Mg(1),Sn,GaO6] and [Mg(2)O4] are alternately connected by sharing oxygen atoms and thus form the basic skeleton of the cubic structure. In order to better study the lattice occupation of Dy3+ and Mn4+ doping into MGS, the corresponding Dr values of dopant ions into Ga3+, Sn4+, and Mg2+ positions are determined by the following equation [16]:
D r = R m ( C N ) R d ( C N ) R m ( C N )
where CN, Rm(CN), and Rd(CN) denote the coordination number, the ionic radius of the substrate, and the radius of the dopant ion, respectively. Theoretically, doping is allowed when the Dr value is less than 30% [17]. The ionic radii of MGS are as follows: Mg2+ (r = 0.57 Å, CN = 4; r = 0.72 Å, CN = 6), Ga3+ (r = 0.86 Å, CN = 6), Sn4+ (r = 0.62 Å, CN = 6), Dy3+ (r = 0.912 Å, CN = 6), and Mn4+ (r = 0.53 Å, CN = 6) [18]. It can be found that the corresponding Dr values of Dy3+ into the Ga3+, Sn4+, and Mg2+ positions are 5.71%, 33.95%, and 26.67%, and for Mn4+ are 38.37%, 14.52%, and 26.39%, respectively. Therefore, the Dy3+ and Mn4+ ions tend to occupy the Ga3+ and Sn4+ lattice positions. More precise ion substitution can be further determined by later Rietveld refinement.
Figure 2a shows the X-ray diffraction (XRD) patterns of the MGS matrix, MGS:0.06Dy3+, MGS:0.009Mn4+, MGS:0.06Dy3+,0.003Mn4+, and MGS:0.06Dy3+,0.018Mn4+ phosphors. Comparing with the MGS standard card (JCPDS 22-1084) with the cubic phase structure, it is found that the diffraction peaks of all the samples coincide with the characteristic diffraction peaks of the standard spectrum, which indicates that the introduction of Dy3+ and Mn4+ has not changed the crystal structure of the MGS matrix, and the prepared samples are all in a pure phase [19]. The XRD data of the MGS:0.06Dy3+, MGS:0.009Mn4+, and MGS:0.06Dy3+,0.003Mn4+ samples were refined to further account for the ionic substitution of Dy3+ and Mn4+. Table 1 lists all the refined structural parameters obtained by the Rietveld refinement method. XRD refinements of MGS:0.06Dy3+, MGS:0.009Mn4+, and MGS:0.06Dy3+,0.003Mn4+ are shown in Figure 2b–d, respectively. The associated residual factors corresponding to MGS:0.009Mn4+, MGS:0.06Dy3+, and MGS:0.06Dy3+,0.003Mn4+ samples were as follows: Rwp = 9.6%, 10.3%, 8.8%, and Rp = 7.5%, 8.1%, and 6.9%, with all of the results staying at a low level. These data demonstrate that the crystal structure of the experimental samples agrees very well with the refined model.
Figure 3a shows the scanning electron microscopy (SEM) image of the MGS:0.06Dy3+,0.003Mn4+ sample, which was prepared as a microcrystal of about a few micrometers in size. And it can be seen that the prepared sample shows a slight agglomeration phenomenon, which is a relatively common result in the high-temperature solid-phase method [20]. Figure 3b shows the associated elemental mapping of the MGS:0.06Dy3+,0.003Mn4+ sample, and the results further confirm the uniform distribution of Mg, Ga, Sn, O, Dy, and Mn in the selected areas. In addition, Figure 3c shows the elemental distribution energy spectrum of the MGS:0.06Dy3+,0.003Mn4+ sample, where it can be clearly observed that the elements of Mg, Ga, Sn, O, Dy, and Mn are uniformly distributed in the randomly selected sample area, further indicating that Dy3+ and Mn4+ were successfully doped into the sample.

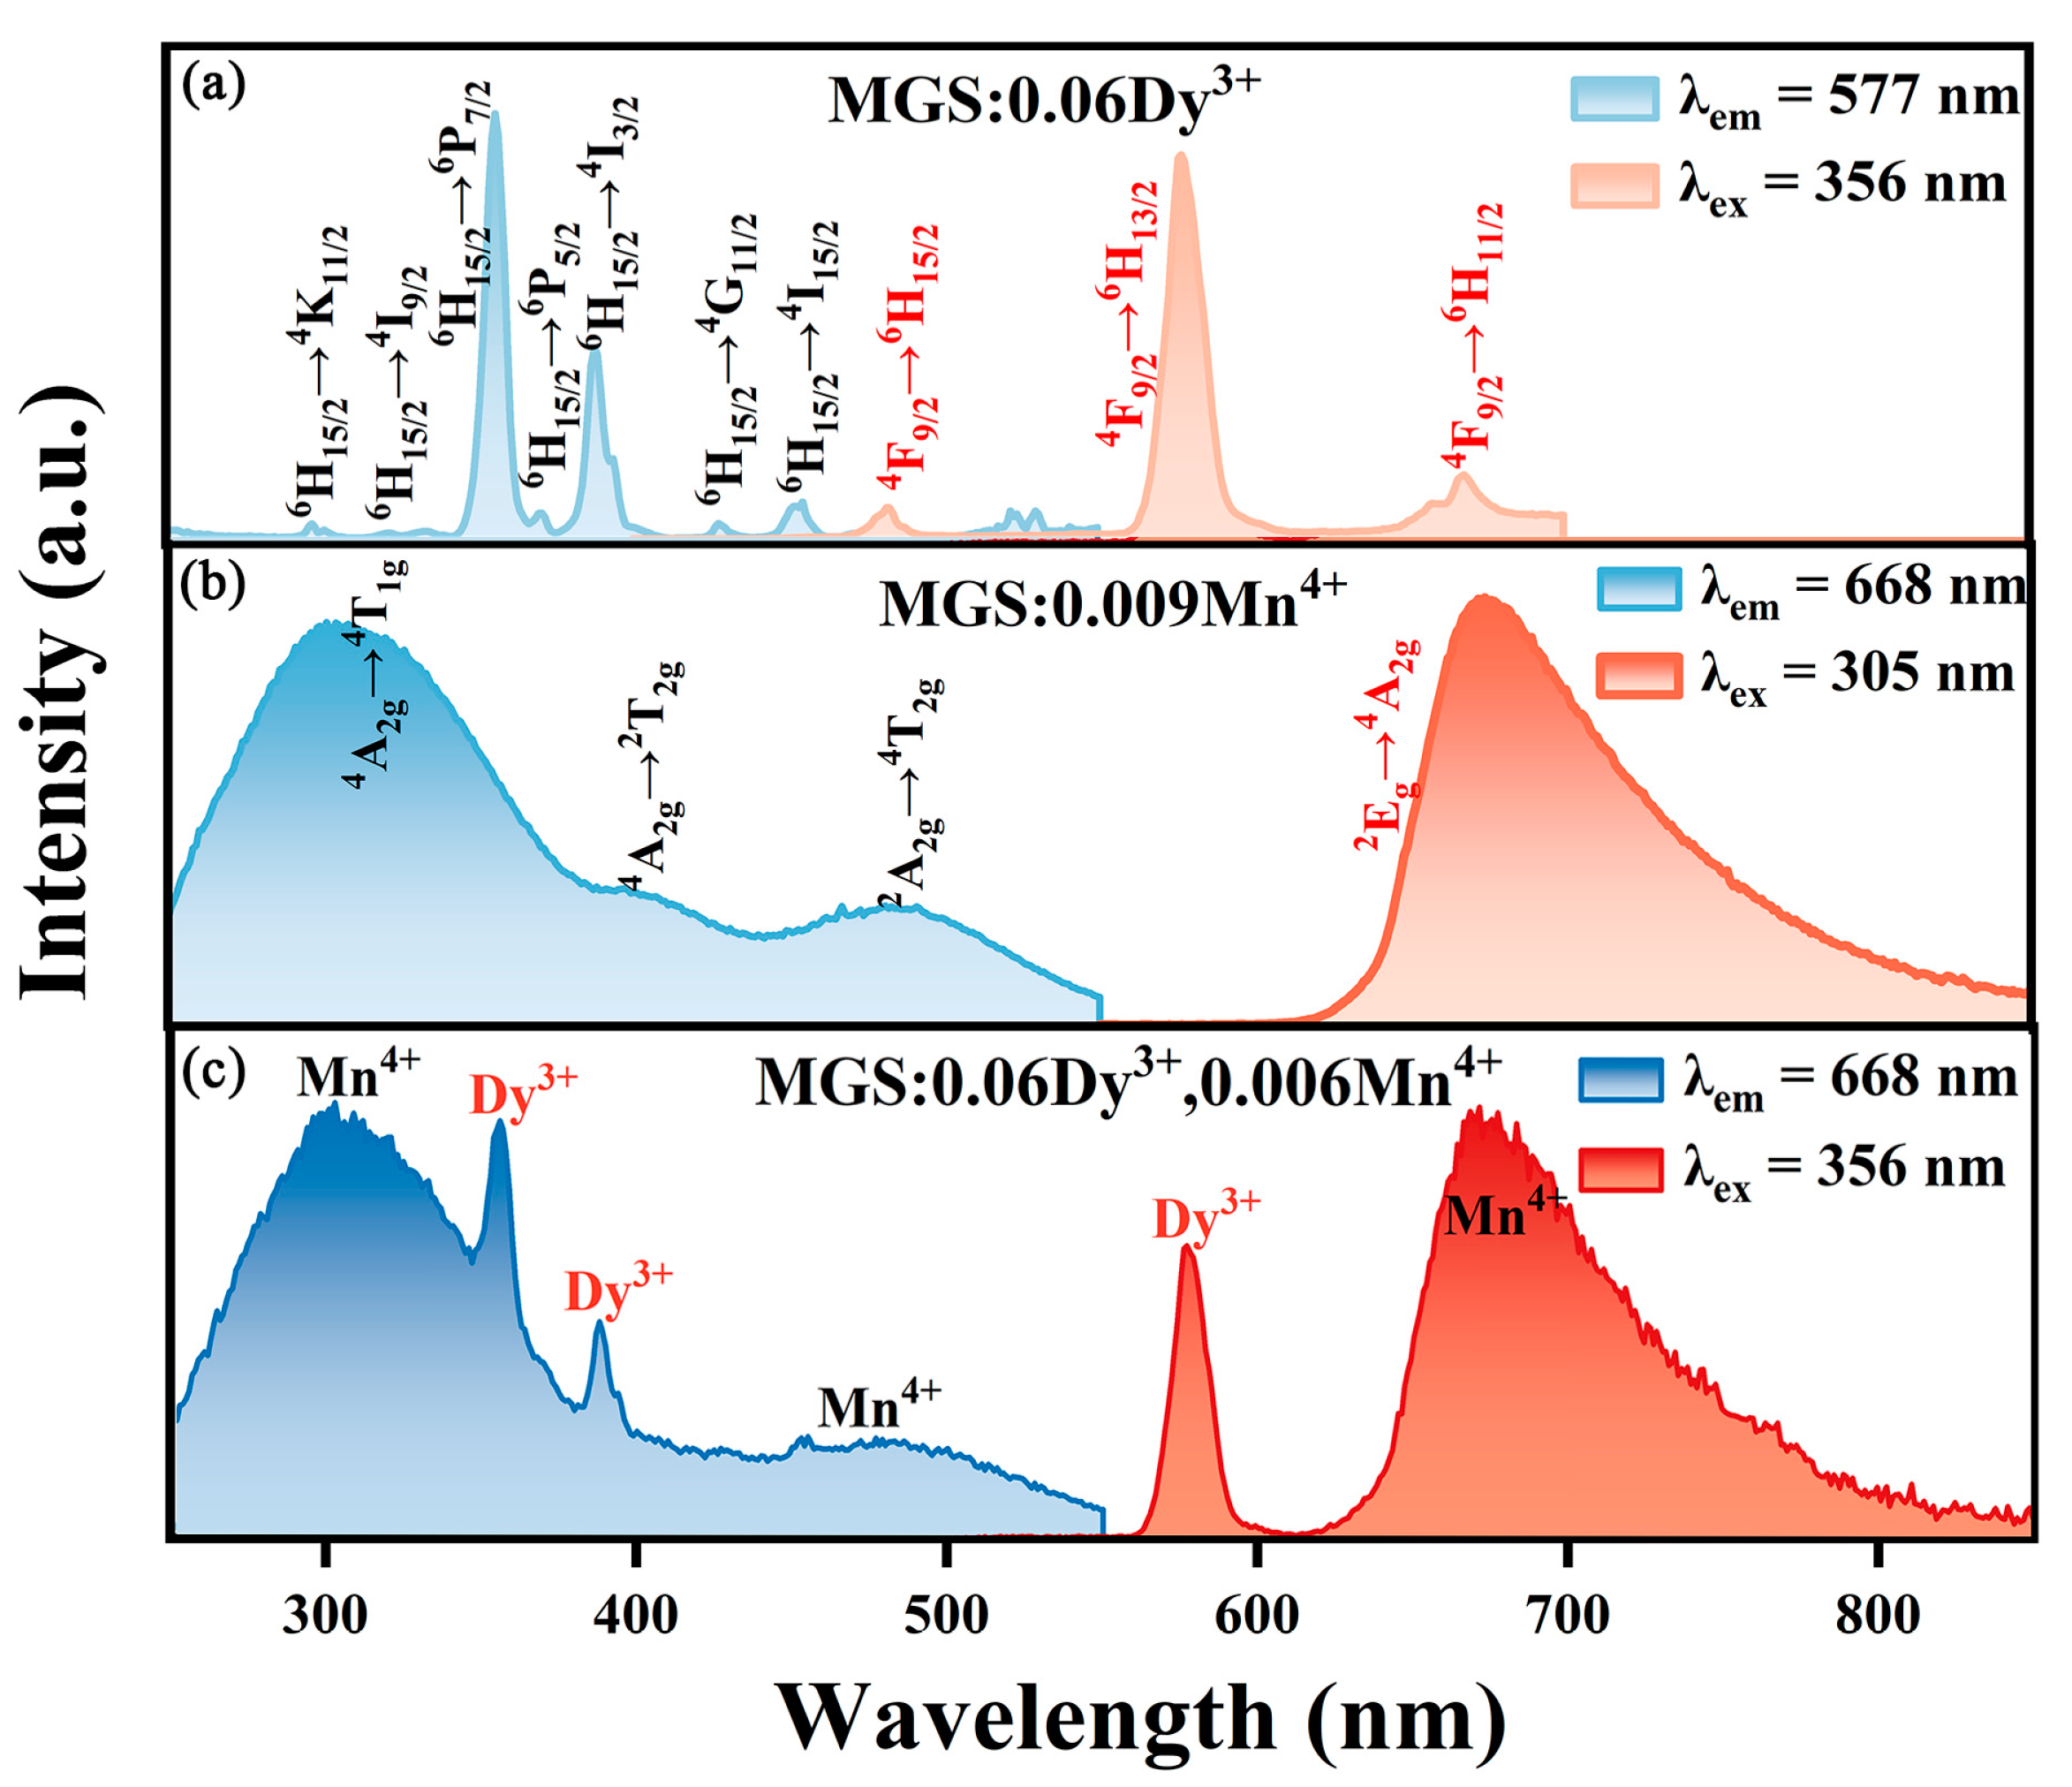
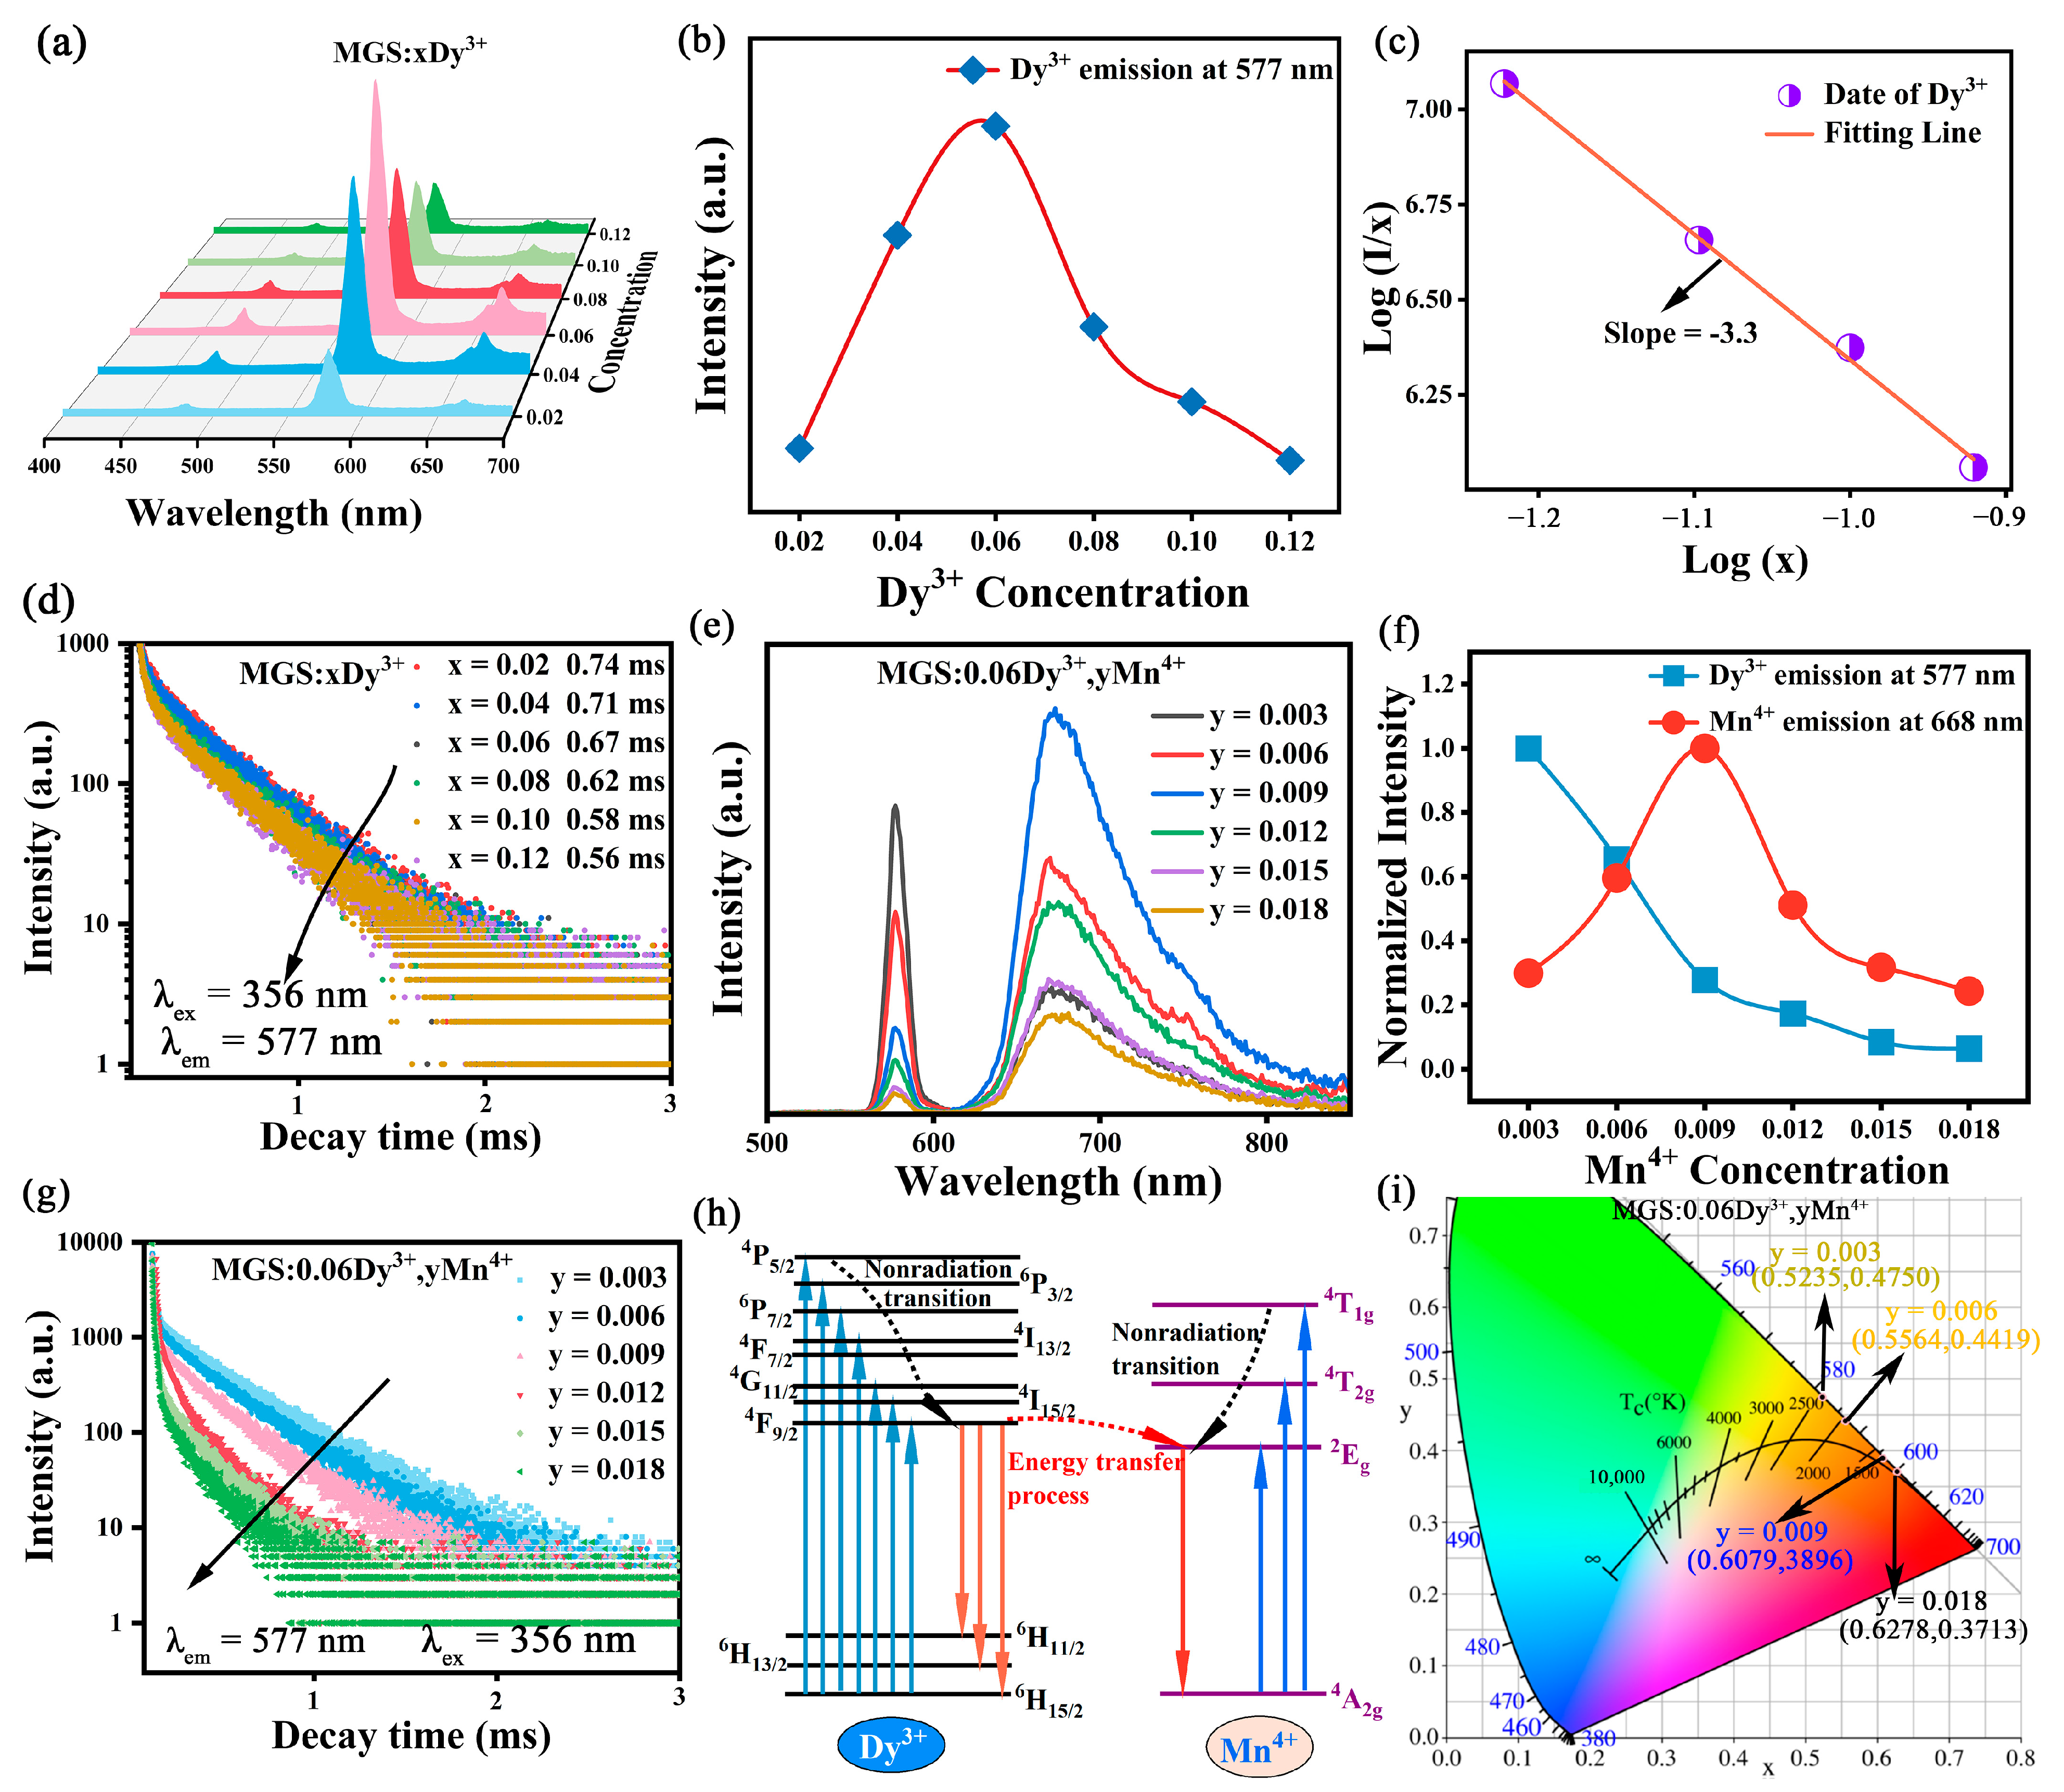
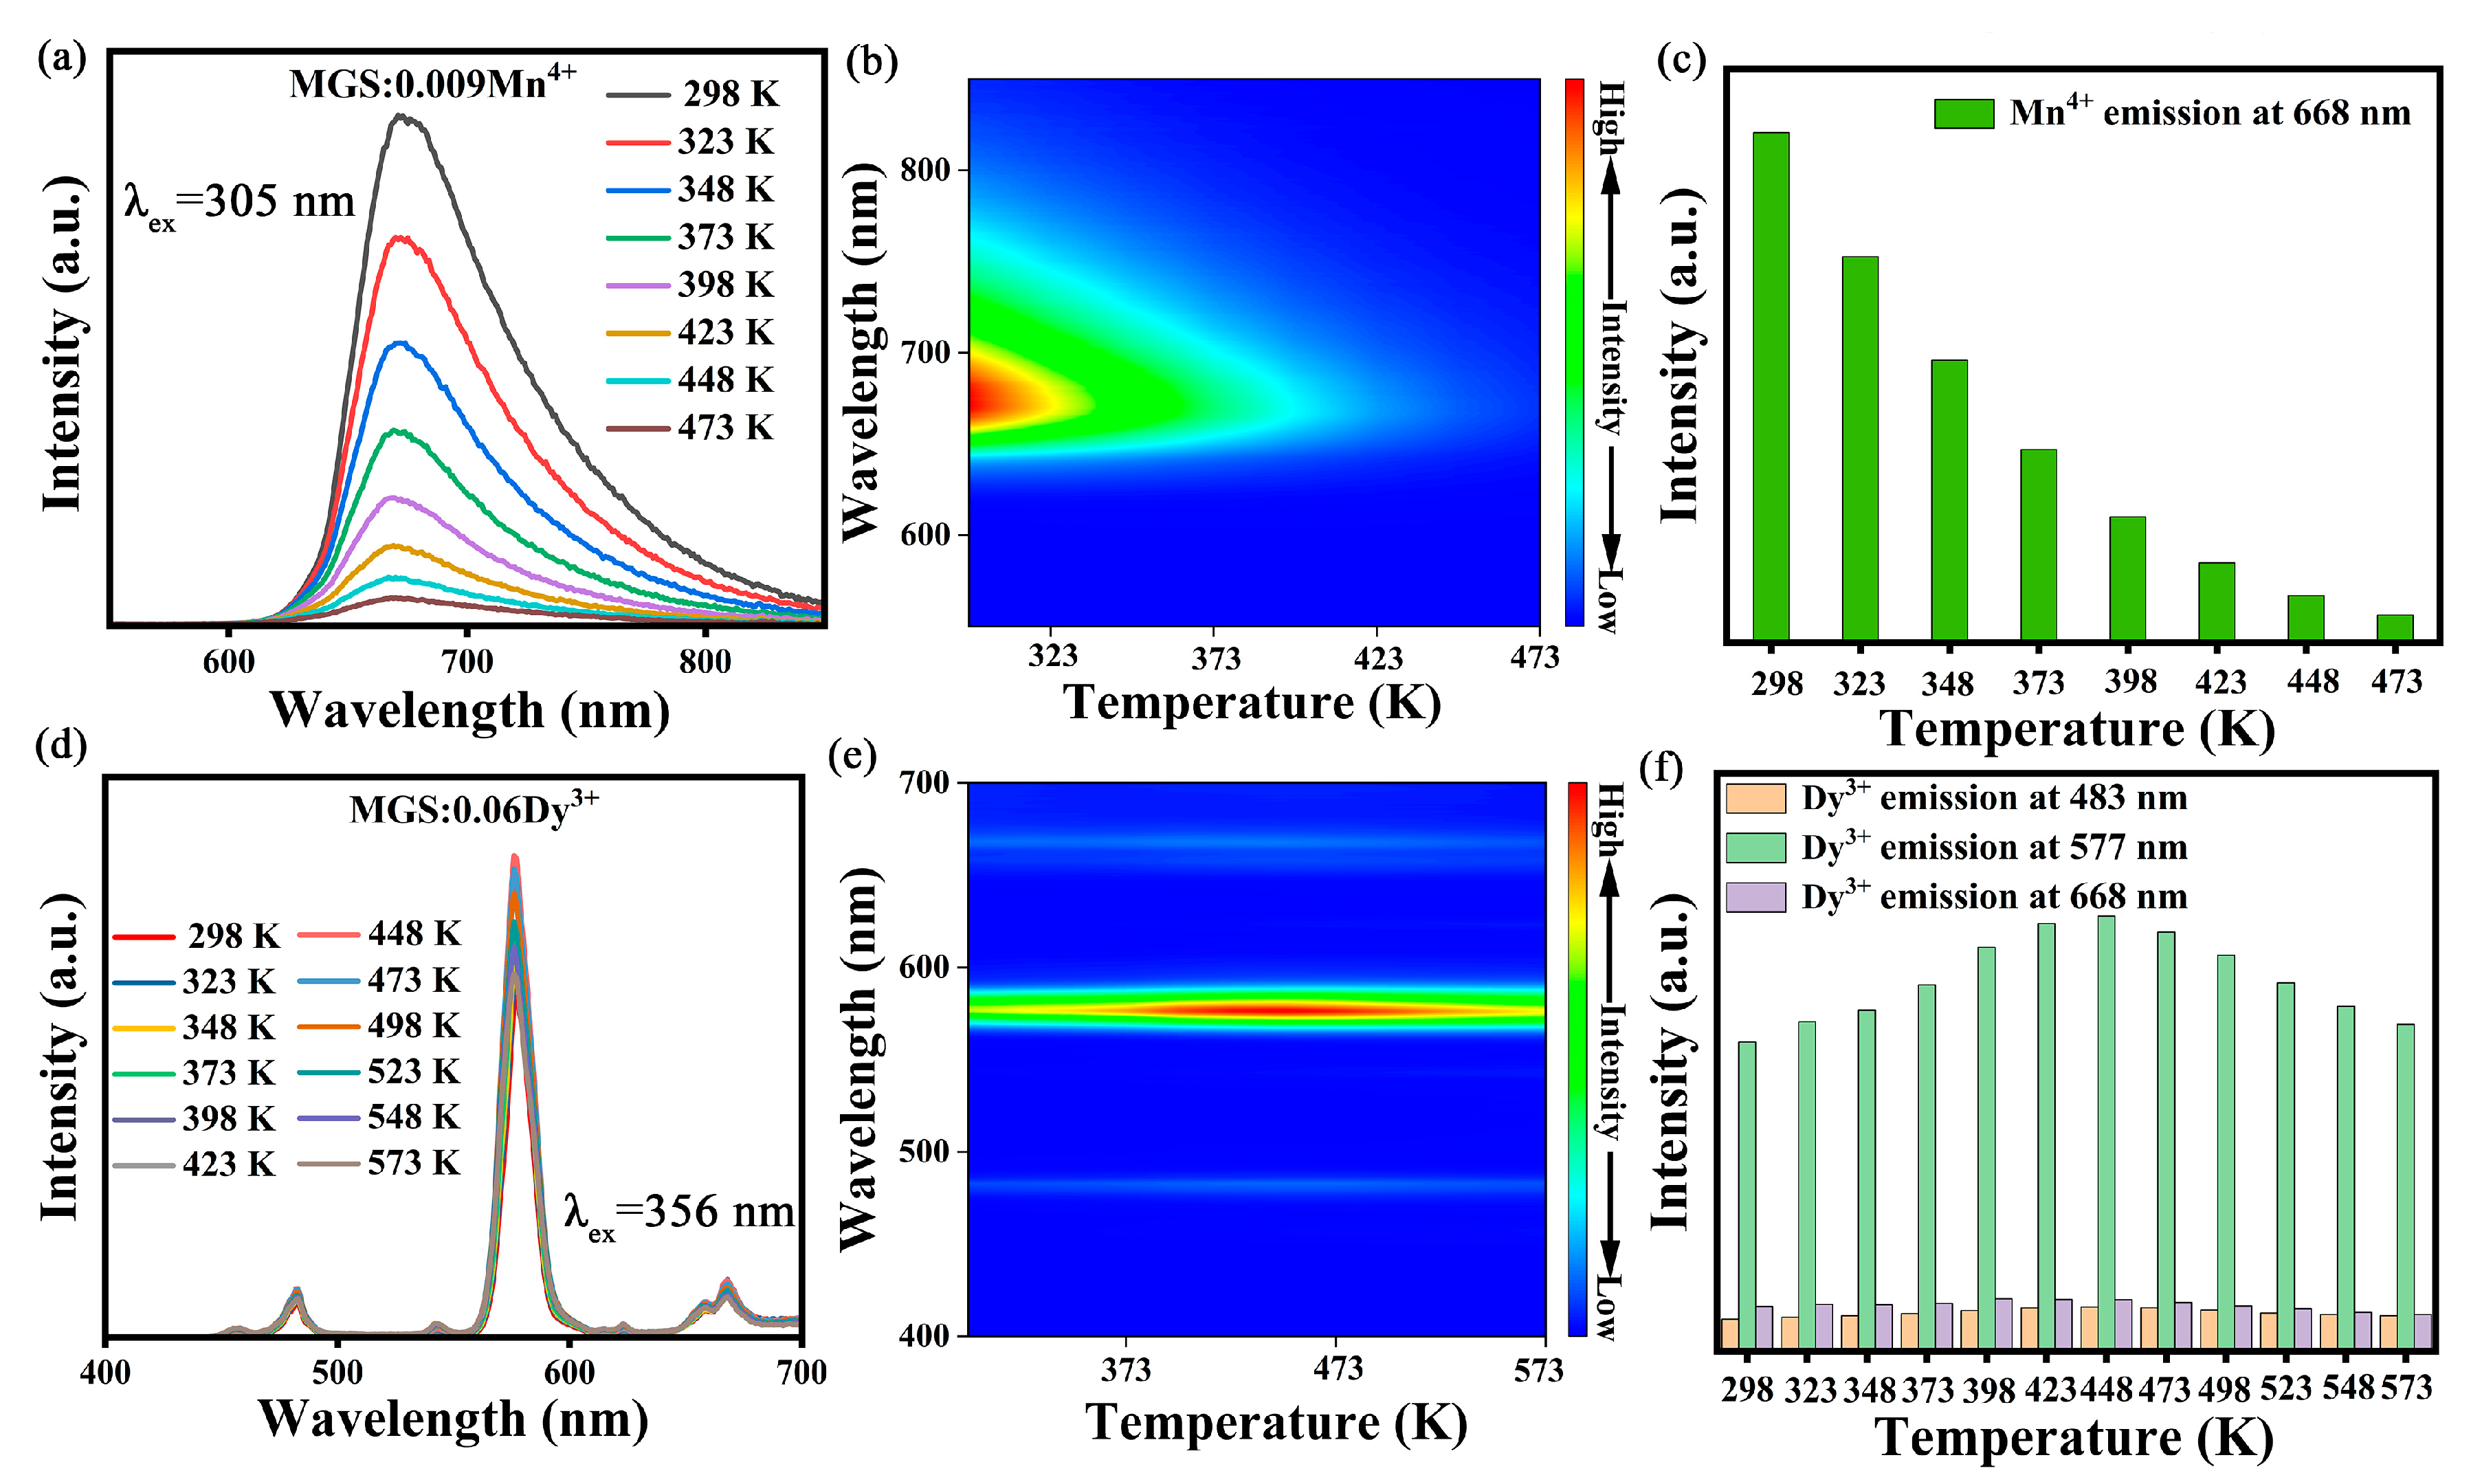
2.2. Optical Properties

Figure 4a shows the excitation spectrum of the MGS:0.06Dy3+ sample at the monitoring wavelength of 577 nm and the emission spectrum under the excitation wavelength of 356 nm. At the monitoring wavelength of 577 nm, the MGS:0.06Dy3+ sample shows several obvious excitation peaks at 297 nm (6H15/24K11/2), 322 nm (6H15/24I9/2), 356 nm (6H15/26P7/2), 371 nm (6H15/26P5/2), 388 nm (6H15/24I3/2), 428 nm (6H15/24G11/2), and 455 nm (6H15/24I15/2) [21,22]. From the emission spectrum, we can see that MGS:0.06Dy3+ has three main emission bands, which are located in the blue light region at 483 nm (4F9/26H15/2), the yellow light region at 577 nm (4F9/26H13/2), and the red light region at 667 nm (4F9/26H11/2), respectively [23]. Figure 4b displays the spectra of the MGS:0.009Mn4+ phosphor. The excitation spectrum of the MGS:0.009Mn4+ phosphor was measured to consist of three broad excitation bands located at 305, 403, and 488 nm. Among them, the two excitation peaks at 403 and 488 nm were attributed to the 4A2g2T2g and 4A2g4T2g transitions of Mn4+, respectively [24]. The excitation peak at 305 nm arises from the coupling of the O2−→Mn4+ charge transfer band and the 4A2g4T1g transition of Mn4+ [25]. Figure S1 also shows the excitation diagram of MGS:0.009Mn4+ at 77 K. Notably, a sharp R-line emission peak at about 653 nm and a small raised peak at about 670 nm can also be observed in the emission spectrum. The R-line emission peak is attributed to the zero-phonon line (ZPL) transition of Mn4+, which stemmed from the unperturbed octahedral sites [26]. In the figure, the emission spectrum of MGS:0.06Dy3+ in the range of 450–550 nm overlaps with the excitation spectrum of MGS:0.009Mn4+, suggesting the possibility of energy transfer between Dy3+ and Mn4+. Figure 4c shows the spectra of the MGS:0.06Dy3+,0.006Mn4+ phosphor. The emission peaks of the MGS:0.06Dy3+,0.006Mn4+ sample consisted of the characteristic emission peaks of Dy3+ and Mn4+. In addition, the excitation peaks were mainly from the characteristic peak of Mn4+, while two characteristic peaks of Dy3+ were also shown at 356 nm and 388 nm. These results indicate that there may be energy transfer from Dy3+ to Mn4+.
As shown in Figure 5a, the shape of the emission spectra of MGS:xDy3+ (0.02 ≤ x ≤ 0.12) phosphors under 356 nm excitation is almost unaffected, but the luminescence intensity of the samples exhibits significant differences. Figure 5b shows the relationship between the relative luminous intensity of MGS:xDy3+ (0.02 ≤ x ≤ 0.12) and the doping concentration of Dy3+. The concentration quenching of MGS:xDy3+ (0.02 ≤ x ≤ 0.12) phosphors starts to appear at the doping concentration x = 0.06. Before that, the luminous intensity of the sample increases with the increase in the doping concentration of Dy3+. And when the concentration quenching occurs, the luminescence intensity decreases with the further increase in the doping concentration of Dy3+. In general, the quenching phenomenon of phosphor concentration is mainly caused by the energy transfer between active ions [27]. And the energy transfer mechanism can be determined by calculating the critical distance (Rc) between activated ions. If the Rc is greater than 5 Å, then electric multipolar interactions dominate; if the Rc is less than 5 Å, then exchange interactions dominate. According to Blasse’s theory, the Rc was determined by the following equation [28]:
R c = 2 3 V 4 π x c N 1 / 3
where V is the cell volume of MGS, xc is the critical concentration (xc = 0.06), and N refers to the number of cations in MGS. According to the XRD refinement results, V = 604.85 Å3, and N = 8. The critical distance Rc for MGS:xDy3+ (0.02 ≤ x ≤ 0.12) phosphors is 20.11 Å according to the calculation of Equation (2). Exchange interactions require that the distances between activated ions are less than 5 Å, so it can be hypothesized that the electro-multipolar interactions between the Dy3+ are dominant. In addition, the multipolar interactions can be further categorized into dipole–dipole (d-d), dipole–quadrupole (d-q), and quadrupole–quadrupole (q-q) interactions [29]. For the concentration quenching caused by the above three kinds of electric multipole interactions, the relationship can be inferred using the following equation [30]:
I x = K 1 + β x Q / 3 1
where I is the luminescence intensity of the sample, x is the doping concentration of the activating ions, K and Q are constants, and Q is taken as 6, 8, and 10 for d-d, d-q, and q-q interactions, respectively. Figure 5c shows the curve of lg(I/x) versus log(x) for the MGS:xDy3+ samples, and it can be seen that lg(I/x) is almost linear with log(x), and its slope is -3.3 after fitting. The resulting value of Q is calculated to be 9.9, which is closer to 10. Therefore, the concentration quenching in the MGS:xDy3+ (0.02 ≤ x ≤ 0.12) phosphors can be attributed to the q-q interaction. The decay curves of MGS:xDy3+ (0.02 ≤ x ≤ 0.12) phosphors were measured under 356 nm excitation with the 4F9/26H13/2 transition emission of Dy3+ (577 nm) as the monitoring wavelength, as shown in Figure 5d. The decay curves of all the samples slightly deviated from the mono-exponential and decayed with a biexponential function, which conformed to the following equation [31]:
I = I 0 + A 1 exp ( t / τ 1 ) + A 2 exp ( t / τ 2 )
where t is the time, I(t) is the luminous intensity of the sample at the time t, A1 and A2 are constants, and τ1 and τ2 are the lifetime in two decay forms, respectively. When the decay curve is a double exponential function of the decay, the average lifetime can be expressed as follows:
τ = ( A 1 τ 1 2 + A 2 τ 2 2 ) / ( A 1 τ 1 + A 2 τ 2 )
The average lifetimes of the samples at each doping concentration were calculated according to Equation (5), which showed that the lifetime of the samples decreased slightly with the increase in the Dy3+ doping concentration.
To explore the effect of Mn4+ content on luminescence properties, the emission spectra of MGS:0.06Dy3+,yMn4+ (0.003 ≤ y ≤ 0.018) samples are shown in Figure 5e. Apparently, the peak shapes and peak positions of the Dy3+ and Mn4+ emission peaks did not change significantly; only the intensities changed significantly. The variation in the intensity of the emission peak of Dy3+ and Mn4+ with respect to that of the Mn4+ doping concentrations is given in Figure 5f. The intensity of Dy3+ (577 nm) decreases monotonically with the increase in the Mn4+ doping concentration, while the intensity of the emission peak of the Mn4+ ion at 668 nm first increases, confirming the existence of the energy transfer from Dy3+ to Mn4+. To further confirm the existence of the energy transfer phenomenon, Figure 5g shows the decay curves of MGS:0.06Dy3+,yMn4+ (0.003 ≤ y ≤ 0.018) samples. The decay curves at different Mn4+ doping concentrations can all be fitted with a double exponential, and the corresponding fitting calculations are presented in Table 2. It can be seen that the lifetime monotonically decreases with the increase in the Mn4+ concentration. This result also provides strong evidence for the existence of energy transfer. In order to present the process of energy transfer more clearly, Figure 5h plots the energy levels of Dy3+ and Mn4+ in the MGS:0.06Dy3+,yMn4+ (0.003 ≤ y ≤ 0.018) samples. Apparently, the mechanism and pathway of energy transfer between the two ions are clearly presented in the figure.
Color coordinates are indicators used to qualitatively measure the color of light, generally using the CIE color coordinate system implemented by the International Commission on Illumination in 1931 [32]. By analyzing the luminescence spectra of MGS:0.06Dy3+,yMn4+ (0.003 ≤ y ≤ 0.018) phosphors at an excitation wavelength of 356 nm, their CIE coordinates were determined and presented in Table 2. The CIE chromatogram of the MGS:0.06Dy3+,yMn4+ (0.003 ≤ y ≤ 0.018) samples are labeled in Figure 5i. The results show that there is a significant change in the CIE coordinates for Mn4+ concentration in the 0.003 to 0.018 range. Specifically, the coordinates move from (0.5235, 0.4750) to (0.6106, 0.3863). And the emission color of MGS:0.06Dy3+,yMn4+ (0.003 ≤ y ≤ 0.018) phosphors gradually changed from yellow to orange and finally to red. Moreover, the CIE coordinates of all samples are located at the edge of the coordinate plot indicating that all samples have very high color purity.
The temperature-dependent emission spectra of the MGS:0.009Mn4+ phosphor under 305 nm excitation between 298 and 473 K are shown in Figure 6a. And Figure 6b shows the color-filled contour plot of the normalized variable temperature emission spectrum of the MGS:0.009Mn4+ sample. Figure S2 demonstrates the normalized distribution of the temperature-dependent emission spectra of MGS:0.009Mn4+. The 2Eg4A2g transition emission of Mn4+ does not show a significant peak shift with increasing temperature due to the small electro-phonon coupling between the 2E energy level and the 4A2 energy level [33]. The full width at half maximum of MGS:0.009Mn4+ broadens from 76 nm to 84 nm as the temperature increases from 298 K to 473 K. This is due to the weakening of the field strength of the expanded lattice at higher temperatures in the Mn4+ ionic crystal field. Figure 6c demonstrates the variation in the integral intensity of the variable temperature emission spectrum of the MGS:0.009Mn4+ sample. As the temperature increases, the luminescence of MGS:0.009Mn4+ undergoes a significant decay due to the thermal quenching phenomenon [34]. The MGS:0.009Mn4+ samples maintained 55.4% of the room temperature luminous intensity at 348 K and 15.6% of the room temperature luminous intensity at 423 K, and when the temperature is greater than 473 K, the luminescence of MGS:0.009Mn4+ is close to complete quenching. The emission spectra and relative emission contour spectra of MGS:0.06Dy3+ with temperature changes are shown in Figure 6d,e. The peak shape and peak position of the Dy3+ emission peak did not change significantly with increasing temperature. Figure 6f illustrates the variation in the emission peaks of Dy3+ normalized by the initial value of the integral intensity with the process of temperature increase. The luminescence intensity increases and then decreases as the test temperature is increased in steps of 25 K. In general, the release of electrons from defect-induced trap states at elevated temperatures is strongly correlated with an increase in the intensity of the sample. The integrated intensity of MGS:0.06Dy3+ at 573 K can still maintain about 99.1% of the emission intensity at 298 K. Therefore, it can be used as a two-probe fluorescence intensity ratio temperature sensing parameter based on the relative changes in luminescence intensity of Dy3+ and Mn4+ ions.

2.3. Temperature Sensing Characterization

In order to further investigate the performance of this phosphor for optical temperature sensing application and to explore its potential application in temperature sensing, Figure 7a,b shows the emission spectra and corresponding two-dimensional images of the MGS:0.06Dy3+,0.009Mn4+ phosphor under excitation at 356 nm for the tested temperatures from 298 K to 473 K. The emission intensity of the emission peak of Dy3+ located near 577 nm (4F9/26H13/2) is basically unchanged when the temperature is gradually increased, while the emission intensity of Mn4+ located at 668 nm (2Eg4A2g) is rapidly bursting with the increase in temperature, as shown in Figure 7c. Therefore, the FIR model can be constructed for temperature measurement based on the fact that the luminescence intensity of the two ions responds differently to temperature at different temperatures. The relationship between FIR (I577 nm/I668 nm) and temperature can be described by the following equation [35]:
F I R = I D y I M n = 1 + A D y exp ( Δ E / ( k T ) ) 1 + A M n exp ( Δ E / ( k T ) ) A exp ( B / T ) + C
where T is the absolute temperature; A, B, and C are the relevant constant parameters. In the field of luminescence temperature measurement, absolute sensitivity (Sa) and relative sensitivity (Sr) are parameters necessary for the performance of the measured temperature, which are calculated as follows [36]:
S a = F I R T = A exp ( Δ E / ( k T ) ) × Δ E k T 2
S r = 100 % F I R F I R T = 100 % A exp ( Δ E k T ) C + A exp ( Δ E k T ) × Δ E k T 2
The fitting line of the FIR value to the temperature change is shown in Figure 7d, and the fitting accuracy R2 reaches 99.94%, which indicates that the fitting results are very reliable and lays a foundation for further investigation of the temperature sensing performance of the phosphor. The relationship between the FIR (I577 nm/I668 nm) value and temperature can be expressed by the fitting result as: FIR (I577 nm/I668 nm) = 1663.7×exp(-3519.6/T) + 0.1745. And the fitted curves of Sa and Sr versus temperature calculated by Equations (7) and (8) are shown in Figure 7e, respectively. From the figure, the value of Sr increases gradually with increasing temperature and reaches 1.82 %K−1 at 473 K. The value of Sa decreases from 0.04 K−1 to 0.016 K−1 with increasing temperature and has a maximum value of 0.04 K−1 at 298 K. Compared to the optical thermometry phosphors already reported in Table 3, the MGS:0.06Dy3+,0.009Mn4+ phosphor has a wider thermometry range and higher sensitivity. For temperature sensing materials, cycling stability is also an important parameter to measure its performance; the change in FIR value with temperature during multiple temperature cycling is shown in Figure 7f, and the FIR value can be restored to the initial state after six temperature cycles, indicating that the phosphor has good reversibility and reliability in temperature sensing. In conclusion, the MGS:0.06Dy3+,0.009Mn4+ phosphor has good temperature sensing performance, and can be regarded as an optical material with potential value for optical temperature sensing.
The use of fluorescence lifetime for temperature sensing is another very promising measurement option, which has the inherent advantage of calibration-free measurements, independent of external factors such as sample size and fluctuations in excitation power. Figure 8a shows the decay curves of Mn4+ in the MGS:0.06Dy3+,0.009Mn4+ sample as a function of temperature. As shown in the figure, the lifetime of Mn4+ ions decreases significantly with increasing temperature. As shown in Figure 8b, the lifetime of the MGS:0.06Dy3+,0.009Mn4+ sample decreases rapidly from 1.35 ms to 0.098 ms when the temperature is increased from 298 to 473 K. And the lifetime was fitted to the temperature for temperature sensing characterization, and was calculated according to the following Mott-Seitz equation [37]:
1 τ ( T ) = 1 τ 0 ( 1 + D exp ( Δ E / ( k T ) )
where τ(T) is the lifetime corresponding to a given temperature T, and τ0 is the lifetime at 298 K. The fitted curve of lifetime with temperature obtained by the above equation is shown in Figure 8c, which has a high degree of fit of 99.76%, thus it can be determined that the MGS:0.06Dy3+,0.009Mn4+ sample has a high degree of accuracy in temperature sensing. Its temperature-sensing sensitivity was further examined, and Sa and Sr were defined with the following equation [38]:
S a = τ T
S r = 100 % 1 τ τ T
The Sa and Sr values for FL thermometry were calculated from the above equation and plotted as shown in Figure 8d. Apparently, a maximum value of 2.75 %K−1 was obtained for Sr at 473 K and 0.068 K−1 for Sa at 298 K. The maximum relative sensitivities Sr for FL thermometry in different materials reported in the recent literature are demonstrated in Table 3. Compared to these materials, the MGS:0.06Dy3+,0.009Mn4+ sample exhibits superior temperature sensitivity. Therefore, the MGS:0.06Dy3+,0.009Mn4+ phosphor has potential applications in the field of FL thermometry.
Table 3. Sr-Max of some rare earth ions and transition metal ions with co-doped phosphors based on FIR or FL mode.
SampleTemperature Range (K)Sr-Max (% K−1)ModeRef.
La2LiSbO6:Mn4+,Dy3+303–5230.769FIR[10]
Ca2LaNbO6:Mn4+,Eu3+298–4981.51FIR[39]
SrLaLiTeO6:Mn4+,Dy3+298–6731.6FIR[40]
MGS:0.06Dy3+,0.009Mn4+298–4731.82FIRThis work
Ca2GdSbO6:Eu3+, Mn4+303–5031.47FL[22]
Ba2GdNbO6:Eu3+, Mn4+303–4831.73FL[41]
MGS:0.06Dy3+,0.009Mn4+298–4732.75FLThis work

3. Materials and Methods

3.1. Preparation of Materials

The MGS:xDy3+ (0.02 ≤ x ≤ 0.12), MGS:0.06Dy3+,yMn4+ (0.003 ≤ y ≤ 0.018), and MGS:0.009Mn4+ phosphors were synthesized by a high-temperature solid-phase reaction. And the raw materials of (MgCO3)4·Mg(OH)2·5H2O (99.5%), Ga2O3 (99.99%), SnO2 (99.5%), Dy2O3 (99.99%), and MnCO3 (99.5%) were weighed according to the same molar ratios as the chemical formulae and uniformly milled in the onyx mortar for 30 min. Then, the mixture was transferred into a corundum crucible and pre-sintered at 650 °C for 4 h in a box furnace. After the pre-sintered sample cooled to room temperature, it was removed and ground again for 5–10 min. The ground sample was then placed in a corundum crucible and reacted in air at 1450 °C for 6 h in the box furnace. After cooling to room temperature, the sample was removed and ground into a powdered sample for subsequent testing.

3.2. Characterization of Materials

The crystalline phase structure of the samples was determined by using a Cu-targeted Kα-radiation powder X-ray diffractometer (XRD, D8 Advanced, Bruker, Karlsruhe, Germany) with a scanning step of 0.02°. The surface morphology of the samples was analyzed by field emission scanning electron microscopy (SEM, JEOL JSM-IT500A, Tokyo, Japan). The excitation light source was a xenon lamp, and a variable-temperature accessory (Tian Jin Orient—KOJI Instrument, Tianjin, China) was used for variable-temperature testing. For lifetime measurement, a microsecond lamp was selected as the light source.

4. Conclusions

In this paper, a series of MGS:Dy3+,Mn4+ phosphors for optical temperature measurement were prepared by the high-temperature solid-phase reaction method. The microstructure, luminescence performance, and temperature sensing performance of the phosphors were studied in detail. The microstructures were analyzed by X-ray diffraction tests and refinement, indicating that the prepared phosphors feature a cubic structure with the Fd-3m space group. The luminescence performance of MGS:xDy3+ materials with different doping concentrations under 356 nm excitation was investigated, and the optimal doping concentration of Dy3+ in the phosphor was determined to be 0.06. The emission spectrum of MGS:0.06Dy3+,yMn4+ (0.003 ≤ y ≤ 0.018) indicates the presence of energy transfer of Dy3+→Mn4+ ions in the phosphors. The temperature-dependent luminescent properties of this phosphor were investigated, laying the foundation for the application of optical temperature sensors. The performance of MGS:0.06Dy3+,0.009Mn4+ as an optical temperature sensor was evaluated by FIR, with a relative sensitivity maximum of 1.82 %K−1 (473 K) when using the FIR (I577 nm/I668 nm) to characterize temperature. In addition, applying FL optical thermometry, the MGS:0.06Dy3+,0.009Mn4+ phosphor has a maximum value of Sr of 2.75 %K−1 (473 K) in the temperature range of 298~473 K. These results indicate that MGS:Dy3+,Mn4+ phosphors have good research and application prospects in the field of temperature sensing.

Supplementary Materials

The following supporting information can be downloaded at: www.mdpi.com/article/10.3390/molecules30071569/s1, Figure S1. The excitation spectrum of MGS:0.009Mn4+ at 77 K; Figure S2. Temperature-dependent normalized emission spectra of MGS:0.009Mn4+.

Author Contributions

Z.Y.: Writing, reviewing, and editing. W.Z.: Exploration of material preparation conditions. Z.W.: Samples preparation and data analysis. Y.S.: Characterization and analysis of phosphors by spectrophotometer. Y.Z.: Structure fabrication and analysis. All authors have read and agreed to the published version of the manuscript.

Funding

This work was supported by Natural Science Foundation of Shandong Province, China (No. ZR2019PEM006) and the National College Students’ Innovation and Entrepreneurship Training program (No. 202414276001).

Institutional Review Board Statement

Not applicable.

Informed Consent Statement

Not applicable.

Data Availability Statement

The research data are available from the authors on request.

Acknowledgments

We thank Changhui Sun for the SEM testing and analysis.

Conflicts of Interest

The authors declare no conflicts of interest.

References

  1. Zhou, J.J.; Rosal, D.B.; Jaque, D.; Uchiyama, S.; Jin, D.Y. Advances and challenges for fluorescence nanothermometry. Nat. Methods 2020, 17, 967–980. [Google Scholar] [PubMed]
  2. Kucsko, G.; Maurer, P.C.; Yao, N.Y.; Kubo, M.; Noh, H.J.; Lo, P.K.; Park, H.; Lukin, M.D. Nanometre-scale thermometry in a living cell. Nature 2013, 500, 54–58. [Google Scholar] [PubMed]
  3. Liu, W.; Zhao, D.; Zhang, R.J.; Yao, Q.X.; Zhu, S.Y. Fluorescence lifetime-based luminescent thermometry material with lifetime varying over a factor of 50. Inorg. Chem. 2022, 61, 16468–16476. [Google Scholar] [PubMed]
  4. Venturini, F.; Bürgi, R.; Borisov, S.M.; Klimant, I. Optical temperature sensing using a new thermographic phosphor. Sensor Actuat. A-Phys. 2015, 233, 324–329. [Google Scholar] [CrossRef]
  5. Sun, S.; Qian, J.; Li, Z.; Huang, L.; Li, D. Sensitivity Enhancement of Thermometry in Tb3+-Doped KY(CO3)2:Sm3+ by Energy Transfer. Molecules 2025, 30, 767. [Google Scholar] [CrossRef]
  6. Trung, T.Q.; Dang, T.M.L.; Ramasundaram, S.; Toi, P.T.; Park, S.Y.; Lee, N.E. A Stretchable Strain-Insensitive Temperature Sensor Based on Free-Standing Elastomeric Composite Fibers for On-Body Monitoring of Skin Temperature. ACS Appl. Mater. Interfaces 2019, 11, 2317–2327. [Google Scholar]
  7. Qiang, K.; Ye, Y.; Mao, Q.; Chen, F.; Chu, L.; Liu, M.; Zhong, J. Dy3+, Mn4+ co-doped phosphors for synergistic luminescent dual-mode thermometer and high-resolution imaging. Mater. Design 2024, 241, 112906. [Google Scholar]
  8. Atabaev, T.S.; Sayatova, S.; Molkenova, A.; Taniguchi, I. Nitrogen-doped carbon nanoparticles for potential temperature sensing applications. Sens. Bio-Sens. Res. 2019, 22, 100253. [Google Scholar]
  9. Hu, F.Y.; Zhang, D.; Wu, Y.J.; Sun, C.M.; Xu, C.C.; Wang, Q.R.; Xie, Y.R.; Shi, Q.; Li, S.H.; Wang, K. Optical behaviors of Mn4+-modified cubic type ZnTiO3:Eu3+ nanocrystals: Application in optical thermometers based on fluorescence intensity ratio and lifetime. Spectrochim. Acta A 2024, 304, 123339. [Google Scholar]
  10. Song, Y.; Guo, N.; Li, J.; Xin, Y.; Lü, W.; Miao, Y. Dual-emissive Ln3+/Mn4+ Codoped double perovskite phosphor via site-beneficial occupation. Mater. Adv. 2021, 2, 1402–1412. [Google Scholar]
  11. Zheng, T.; Sójka, M.; Woźny, P.; Martín, I.R.; Lavín, V.; Zych, E.; Lis, S.; Du, P.; Luo, L.; Runowski, M. Supersensitive Ratiometric Thermometry and Manometry Based on Dual-Emitting Centers in Eu2+/Sm2+-Doped Strontium Tetraborate Phosphors. Adv. Opt. Mater. 2022, 10, 2201055. [Google Scholar]
  12. Wei, D.; Fang, L.; Zhou, X.; Xia, H.; Chen, B. Enhanced up-conversion luminescence in Na5Y9F32: Ho3+/Yb3+/Eu3+ single crystals by introducing of Gd3+ ions for highly sensitive temperature sensing. Mater. Today Chem. 2024, 36, 101970. [Google Scholar]
  13. Huang, Z.; Wu, F.; Zhang, Q.; Teng, Y.; Mu, Z. High sensitivity temperature sensing material In2Li3P3O12: Bi3+, Eu3+ based on effective energy transfer from Bi3+ to Eu3+. Ceram. Int. 2024, 50, 32180–32186. [Google Scholar]
  14. Ma, L.; Tian, G.; Xiao, H.; Jiang, L.; Du, Q.; Li, H.; Yang, B. A novel spinel-type Mg3Ga2SnO8 microwave dielectric ceramic with low εr and low loss. J. Eur. Ceram. Soc. 2024, 44, 5731–5737. [Google Scholar]
  15. Zhu, Q.; Huo, J.; Lin, Y.; Li, M.; Liu, W.; Gao, J.; Wang, Q. A new co-substitution strategy as a model to study a rare-earth-free spinel-type phosphor with red emissions and its application in light-emitting diodes. Inorg. Chem. 2020, 59, 433–442. [Google Scholar]
  16. Yang, Z.F.; Yang, L.L.; Ji, C.J.; Xu, D.H.; Zhang, C.Q.; Bu, H.X.; Tan, X.; Yun, X.Y.; Sun, J.Y. Studies on luminescence properties of double perovskite deep red phosphor La2ZnTiO6:Mn4+ for indoor plant growth LED applications. J. Alloys Compd. 2019, 802, 628–635. [Google Scholar]
  17. Cao, R.P.; Zhong, B.H.; Nie, J.H.; Chen, Y.Y.; Zhang, L.; Li, L.; Chen, T.; Wang, J. Synthesis, spectral characteristics and energy transfer of SrLa2Al2O7:Mn4+, Dy3+. J. Lumin. 2023, 264, 120163. [Google Scholar]
  18. Shannon, R.D. Revised effective ionic radii and systematic studies of interatomie distances in halides and chaleogenides. Acta Cryst. 1976, 32, 751–767. [Google Scholar]
  19. Han, M.; Liu, L.; Zhang, D.; Du, Y.; Zhao, L.; Wang, Y.; Lv, L. Tuning the morphology of Mg2TiO4: Mn4+ for luminescence performance and latent fingerprint visualization. J. Lumin. 2022, 252, 119417. [Google Scholar]
  20. Yadav, S.; Kumar, D.; Yadav, R.S.; Rai, S.B.; Singh, A.K. Structural and wavelength dependent optical properties of La1-xEuxCoO3 perovskite phosphor. Ceram. Int. 2022, 48, 30754–30766. [Google Scholar]
  21. Raghupathi, P.; Jamalaiah, B.C. Structure, morphology and optical analysis of Dy3+ -doped Li6AlGd(BO3)4 phosphors for lighting applications. J. Mol. Struct. 2022, 1268, 133695. [Google Scholar] [CrossRef]
  22. Li, G.X.; Xue, Y.; Mao, Q.N.; Pei, L.; He, H.; Liu, M.J.; Chu, L.; Zhong, J.S. Synergistic luminescent thermometer using co-doped Ca2GdSbO6:Mn4+/(Eu3+ or Sm3+) phosphors. Dalton Trans. 2022, 51, 4685–4694. [Google Scholar] [CrossRef] [PubMed]
  23. Liu, Q.; Wu, M.; Chen, B.; Huang, X.; Liu, M.; Liu, Y.; Su, K.; Min, X.; Mi, R.; Huang, Z. Optical thermometry based on fluorescence intensity ratio of Dy3+-Doped oxysilicate apatite warm white phosphor. Ceram. Int. 2023, 49, 4971–4978. [Google Scholar] [CrossRef]
  24. Yang, Z.; Wang, R.; Yang, S.; Bu, H.; Zhao, J. Enhancing the Luminescence of La3Mg2NbO9:Mn4+ Phosphor through H3BO3 and Charge Compensator Co-Doping for Use in Plant Growth Lamps. Molecules 2024, 29, 1402. [Google Scholar] [CrossRef]
  25. Li, G.; Li, G.; Mao, Q.; Pei, L.; Yu, H.; Liu, M.; Chu, L.; Zhong, J. Efficient luminescence lifetime thermometry with enhanced Mn4+-activated BaLaCa1−xMgxSbO6 red phosphors. Chem. Eng. J. 2022, 430, 132923. [Google Scholar] [CrossRef]
  26. Wang, S.; Seto, T.; Liu, B.; Wang, Y.; Li, C.; Liu, Z.; Dong, H. Tremendous Acceleration of Plant Growth by Applying a New Sunlight Converter Sr4Al14−xGaxO25:Mn4+ Breaking Parity Forbidden Transition. Adv. Sci. 2023, 10, 2204418. [Google Scholar] [CrossRef]
  27. Yang, Z.; Ye, M.; Sun, C.; Wang, R.; Yang, S.; Yan, J. A novel multifunctional Eu3+/Mn4+ co-doping double perovskite phosphor for applications in LEDs and optical thermometry. J. Mol. Struct. 2025, 1319, 139399. [Google Scholar] [CrossRef]
  28. Blasse, G. Energy transfer between inequivalent Eu2+ ions. J. Solid State Chem. 1986, 62, 207–211. [Google Scholar] [CrossRef]
  29. Hussain, N.; Rubab, S.; Kumar, V. Spectroscopic characterizations and investigation of Judd-Ofelt intensity parameters of Dy3+-doped Ba2La8(SiO4)6O2 near white light emitting phosphor. Ceram. Int. 2023, 49, 15341–15348. [Google Scholar] [CrossRef]
  30. Nair, G.B.; Swart, H.C.; Dhoble, S.J. A review on the advancements in phosphor-converted light emitting diodes (pc-LEDs): Phosphor synthesis, device fabrication and characterization. Prog. Mater. Sci. 2020, 109, 100622. [Google Scholar] [CrossRef]
  31. Yang, Z.; Ye, M.; Sun, C.; Zhao, J.; Bu, H.; Yang, S.; Wang, R. Highly sensitive dual-mode temperature measurement utilizing completely opposite thermal quenching luminescence. Ceram. Int. 2024, 50, 44833–44842. [Google Scholar]
  32. McCamy, C.S. Correlated color temperature as an explicit function of chromaticity coordinates. Color Res. Appl. 1992, 17, 142–144. [Google Scholar]
  33. Huang, J.M.; Jiang, P.F.; Cheng, Z.; Wang, R.; Cong, R.H.; Yang, T. Structural confinement-induced highly efficient deep-red emission and negative thermal quenching performance in Mn4+-activated Ca7Mg2Ga6−yAlyO18:Mn4+ phosphors. Inorg. Chem. Front. 2023, 10, 2776. [Google Scholar]
  34. Jin, Y.; Hu, Y.; Wu, H.; Duan, H.; Chen, L.; Fu, Y.; Ju, G.; Mu, Z.; He, M. A deep red phosphor Li2MgTiO4:Mn4+ exhibiting abnormal emission: Potential application as color converter for warm w-LEDs. Chem. Eng. J. 2016, 288, 596–607. [Google Scholar]
  35. Long, J.; Xu, Y.; Huang, W.; Deng, C. Dual-mode optical thermometry based on La2MgTiO6: Mn4+, Dy3+ double perovskite phosphors. J. Mater. Sci. Mater. Electron. 2023, 34, 1613. [Google Scholar]
  36. Ding, Y.; Guo, N.; Lü, X.; Zhou, H.; Wang, L.; Ouyang, R.; Miao, Y.; Shao, B. None–rare–earth activated Ca14Al10Zn6O35:Bi3+, Mn4+ phosphor involving dual luminescent centers for temperature sensing. J. Am. Ceram. Soc. 2019, 102, 7436–7447. [Google Scholar]
  37. Hu, F.; Ren, S.; Wu, Y.; Sun, C.; Zhu, B.; Wang, Q.; Li, S.; Zhang, D. Dual-mode optical thermometer based on fluorescence intensity ratio of Eu3+/Mn4+ co-doping zinc titanate phosphors. Spectrochim. Acta 2023, 288, 122127. [Google Scholar]
  38. Yang, Z.F.; Ye, M.J.; Yang, S.Y.; Wang, R.X.; Sun, C.H.; Li, Y.F.; Wang, J.H. Efficient and abnormal thermal quenching Sm3+ activated perovskites-type niobate phosphor for plant growth lamp and WLEDs. Ceram. Int. 2024, 50, 21745–21754. [Google Scholar]
  39. Wang, P.; Mao, J.; Zhao, L.; Jiang, B.; Xie, C.; Lin, Y.; Chi, F.; Yin, M.; Chen, Y. Double perovskite A2LaNbO6:Mn4+, Eu3+ (A = Ba, Ca) phosphors: Potential applications in optical temperature sensing. Dalton Trans. 2019, 48, 10062–10069. [Google Scholar]
  40. Wu, Z.; Li, L.; Tian, G.; Wang, Y.; Ling, F.; Cao, Z.; Jiang, S.; Xiang, G.; Li, Y.; Zhou, X. High-sensitivity and wide-temperature-range dual-mode optical thermometry under dual-wavelength excitation in a novel double perovskite tellurate oxide. Dalton Trans. 2021, 50, 11412–11421. [Google Scholar]
  41. Luo, Y.X.; Chen, Y.; Li, L.J.; Chen, J.Y.; Pang, T.; Chen, L.P.; Guo, H. Three-mode fluorescence thermometers based on double perovskite Ba2GdNbO6:Eu3+, Mn4+ phosphors. Ceram. Int. 2023, 49, 38007–38014. [Google Scholar]
Figure 1. (a) Crystal structure of MGS. (b) The coordination environments of Mg, Ga, and Sn atoms.
Molecules 30 01569 g001
Figure 2. (a) XRD patterns of MGS matrix, MGS:0.06Dy3+, MGS:0.009Mn4+, MGS:0.06Dy3+,0.003Mn4+, and MGS:0.06Dy3+,0.018Mn4+ phosphors; XRD Rietveld refinement of (b) MGS:0.009Mn4+, (c) MGS:0.06Dy3+, and (d) MGS:0.06Dy3+,0.003Mn4+.
Molecules 30 01569 g002
Figure 3. The (a) SEM, and (b) elemental mapping image for MGS:0.06Dy3+,0.003Mn4+; (c) the elemental distribution energy spectrum of the MGS:0.06Dy3+,0.003Mn4+.
Molecules 30 01569 g003
Figure 4. The excitation and emission spectra of (a) MGS:0.06Dy3+, (b) MGS:0.009Mn4+, and (c) MGS:0.06Dy3+, 0.006Mn4+.
Molecules 30 01569 g004
Figure 5. (a) The emission spectra of MGS:xDy3+ (0.02 ≤ x ≤ 0.12); (b) integrated emission intensity at 577 nm with Dy3+ dopants; (c) fitting line of lg(I/x) versus lg(x) in MGS:xDy3+ (0.06 ≤ x ≤ 0.12); (d) decay curves of MGS:xDy3+ (0.02 ≤ x ≤ 0.12) phosphors excited by 356 nm; (e) the emission spectra of MGS:0.06Dy3+,yMn4+ (0.003 ≤ y ≤ 0.018); (f) integrated emission intensity at 577 nm and 668 nm with Mn4+ dopants; (g) decay curves of MGS:0.06Dy3+,yMn4+ (0.003 ≤ y ≤ 0.018) excited by 356 nm; (h) schematic diagram of energy transfer process from Dy3+ to Mn4+; (i) CIE chromaticity diagrams of MGS:0.06Dy3+,yMn4+ (0.003 ≤ y ≤ 0.018).
Molecules 30 01569 g005
Figure 6. (a) The temperature-dependent emission spectra and (b) the corresponding contour maps of MGS:0.009Mn4+; (c) integrated intensities of Mn4+ with temperature; (d) the temperature-dependent emission spectra, and (e) the corresponding contour maps of MGS:0.06Dy3+; (f) integrated intensities of Dy3+ with temperature.
Molecules 30 01569 g006
Figure 7. (a) The temperature-dependent emission spectra and (b) the corresponding contour maps of the MGS:0.06Dy3+,0.009Mn4+ phosphor; (c) integrated intensities of Dy3+ and Mn4+ for the MGS:0.06Dy3+,0.009Mn4+ phosphor with temperature; (d) temperature-dependent FIR values from I577/I668 of MGS:0.06Dy3+,0.009Mn4+; (e) calculated Sr and Sa at different temperatures by FIR; (f) FIR temperature-cycling values of I577/I668 with 6 cycles of heating and cooling processes.
Molecules 30 01569 g007
Figure 8. (a) The decay curves of MGS:0.06Dy3+,0.009Mn4+ at different temperatures excited by 305 nm; (b) the lifetime of Mn4+ at different temperatures; (c) fitting curve of temperature-dependent FL; (d) the Sa and Sr based on FL of Mn4+.
Molecules 30 01569 g008
Table 1. The detailed refinement results of MGS, MGS:0.009Mn4+, MGS:0.06Dy3+, and MGS:0.06Dy3+,0.003Mn4+ samples.
SampleMGSMGS:0.009Mn4+MGS:0.06Dy3+MGS:0.06Dy3+,0.003Mn4+
Space groupFd-3mFd-3mFd-3mFd-3m
Symmetrycubiccubiccubiccubic
a/b/c, Å8.45708.45528.45738.4566
V, Å3604.85604.46604.92604.77
Z8888
α = β = γ °90909090
Rwp8.59.610.38.8
Rp6.77.58.16.9
χ22.252.833.202.32
Table 2. The τ, color purity, and CIE coordinates of MGS:0.06Dy3+,yMn4+ (0 ≤ y ≤ 0.018) phosphors.
Samplesτ (ms)CIEColor Purity (%)
MGS:0.06Dy3+0.67(0.4925, 0.4770)88.3
MGS:0.06Dy3+,0.003Mn4+0.52(0.5235, 0.4750)97.2
MGS:0.06Dy3+,0.006Mn4+0.44(0.5564, 0.4419)97.8
MGS:0.06Dy3+,0.009Mn4+0.41(0.6278, 0.3713)99.1
MGS:0.06Dy3+,0.012Mn4+0.29(0.6079, 0.3896)98.9
MGS:0.06Dy3+,0.015Mn4+0.21(0.6134, 0.3836)98.5
MGS:0.06Dy3+,0.018Mn4+0.14(0.6106, 0.3863)98.7
Disclaimer/Publisher’s Note: The statements, opinions and data contained in all publications are solely those of the individual author(s) and contributor(s) and not of MDPI and/or the editor(s). MDPI and/or the editor(s) disclaim responsibility for any injury to people or property resulting from any ideas, methods, instructions or products referred to in the content.

